
Abstract
Background
Self-regulation of learning is a key consideration in the process of acquiring workplace competences. One key assumption of self-regulated learning in the literature is that the learner themself is undertaking a process of learning. However, in adult and vocational educational settings it is common that tasks may be either individual or cooperative. Theoretically, self-regulatory demands are different when applied to different learning forms, such as an individual task vs a cooperative learning task; but to date there is a dearth of empirical studies in this regard.
Method
Part of the CADCoM2024 + study on measuring CAD and FEM competences at EQF 6, the present study was conducted with 175 students from four mechanical engineering technical colleges in Germany. Through quantitative analysis we compared progression in CAD and FEM competency development in two learning approaches: individual self-regulated learning vs cooperative self-regulated learning.
Results
Strict invariance was partially present in both cross-sectional and longitudinal analyses. The differences in mean values suggest that there was strong learning progression in both individual self-regulated learning and cooperative self-regulated learning treatment groups. Interestingly, progression in FEM competency was better through cooperative self-regulated learning; however, progression in CAD competency was better through individual self-regulated learning. This latter finding was surprising given that students had demonstrated that they could work well together cooperatively, as shown in the FEM learning tasks.
Conclusion
This original interdisciplinary study suggests that skills for both individual and cooperative self-regulated learning are important for optimally acquiring workplace competences. Indeed, an important finding from this original study was that both individual and cooperative self-regulated learning are recommended as learning strategies: students made strong progress in competency development in both learning forms. Whether individual self-regulated learning or cooperative self-regulated learning is chosen as a pedagogical strategy for fostering workplace competences may depend on a variety of factors (such as interest, previous experience, social environment, and nature of the task). Further studies, including studies with larger sample sizes, are required to unpick this complexity and to confirm which factors might influence the pedagogical choice between individual and cooperative self-regulated learning strategies for competency development.
Keywords
Individual vs cooperative self-regulated learning
Self-Regulated learning
Self-regulated learning (SRL) describes a learning process in which the learner(s) engage successfully in a process of self-regulation, which is considered an important element in ensuring successful progress in a learning process. Self-regulation involves learner(s) applying the skill and capacity to take independent control and direction, thus intentional oversight, of psychological and physiological responses and actions so that their behavioral manifestations of their learning process are planned and systematic.1–5
Self-regulation involves learner skill and capacity to take independent control and direction of three main broad dimensions of behavioral manifestations: (1) behavior/actions (2) cognition/thoughts/attention and (3) emotions/feelings. SRL involves a proactive and focused monitoring of the learning process so that the learner(s) actively shape their learning through a feedback loop, in a process that is supported through intrinsic motivation of the learner.6–10
Self-regulated learning in adult and vocational educational settings
To date, the great majority of studies on SRL concern educational processes that take place within formal schooling contexts; and thus, there are limitations to transferring pedagogical knowledge of studies on SRL from these contexts to understanding SRL in adult and vocational educational settings. Specifically, it is important to highlight the point that the meaning of self-regulation, and thus SRL, might be very different in some adult and vocational learning forms. 11
In an adult learning context, Morris 11 defines self-regulation as “a construct that describes the process of the learner assuming and maintaining responsibility for making-meaning of experience with the aim to complete their learning goals” (p. 246). There are several important distinctions identified by Morris 11 in this regard, in terms of the possible differentiation of SRL in adult and vocational learning when compared to the “traditional” educational model; where in traditional education settings: the teacher is responsible for determining the learning means and objectives; learners can benefit from being meek in terms of letting knowledge inculcation happen to them; the educator is responsible for meaning-making – which concurs with behaviorist assumptions – characterized by predictable, measurable, and uniform learning outcomes; and it is commonplace that learning is decontextualized, including that there is a lack of use of the learners’ experience as a resource. In traditional education settings, behavioral manifestation of self-regulation exampled in the literature include sitting still, remembering instuctions, resisting distractions, limiting aggression/disruptive behaviours, keeping working until finished, and maintaining attention.12–14 In this respect, it seems vital to consider the transferrability of these behavioural manifestations to learning in adult and vocational educational settings.
Indeed, to date, there has been a lack of research that has empirically explored that there are various learning forms in adult and vocational educational settings, and not all learning forms may fit so well in terms of the above examples of behavioral manifestations of self-regulation. In other words, there might be different self-regulatory demands in different learning arrangements. One key assumption of SRL in the literature is that a learner themself is undertaking a process of learning. In many vocational settings, this might be the case, but it might also be the case that learners are completing a task or a learning process as part of a team – in cooperation with others. In such a case, arguably, and theoretically, the self-regulatory demands are different: (1) in terms of behavior/actions: devolving different tasks around the group; organizing different group roles and sub-tasks; communicating appropriately with group members, etcetera (2) in terms of cognition/thoughts/attention: the ability to attend to each other's ideas and work; skill to comprehend each other's thoughts; skill in making a decision in how and what ideas are taken forward to complete the task, etcetera and (3) in terms of emotions/feelings: such as, considering group members feelings before taking actions and decisions; being able to deal appropriately if group members do not contribute their fair share of the task, etcetera. Thus, theoretically, the self-regulatory demands of an individual learning task do not match the self-regulatory demands of a group working task, as exampled in cooperative learning (CL).
Cooperative learning
In CL individuals work together, as part of a team, to complete a learning goal. Importantly, studies have highlighted the point that cooperative behavior is not predominantly innate, but rather that it can be learned in a vocational education and training environment.15,16 Notably, workplace competences that have the potential to be fostered in a CL learning task, such as willingness to cooperate, ability to work flexibly, and being proactive to take independent action, are also particularly important in the twenty-first century context: to meet the challenges we face in a rapidly changing world.16–19
In CL, to achieve the collective goal, a well-considered balance must be found between diverging perspectives. 20 This is also relevant in the context of digital information sources, as these can contribute to or reinforce narrow or polarized views of learners through externally determined algorithms. 21 CL can demand a relatively high level of organizational effort, and conflicts can arise through human interaction, where resolving these conflicts also presents a challenge. It has been argued therefore that CL requires good reasoning and preparation, greater attention, and more creativity than individual learning.20,22 CL can be advantageous over working individually in terms of multiple minds might be better than one; however, amongst other issues, unequal distribution of work can also lead to problems.23–25
In sum, theoretically, there are different self-regulatory demands between individual and CL tasks – and to date there has been a dearth of empirical studies that have examined how workplace competency fostering is impacted by these two learning forms. In the following section we discuss, in brief, Computer-Aided Design (CAD) and Finite Element Method (FEM) as two workplace competences common to the mechanical engineering profession, which is the focus of the present study.
Domain-specific competences in mechanical engineering: computer-aided design and finite element method
The present study concerns mechanical engineering domain-specific competences in CAD and FEM. In CAD, virtual components can be developed that are used, for example, in the design of technical drawings according to DIN EN ISO, numerical strength calculations such as those performed by FEM, 3D printing, virtual reality (VR), and/or computer-aided manufacturing (CAM). The predicted shortage of skilled workers 26 also intensifies the debate about the urgent need to learn these competences in engineering. Accordingly, these competences are foundational for aspiring mechanical engineering technicians. In this regard, the results of the present study contribute to pedagogical knowledge of how these competences can be appropriately fostered within vocational education and training settings.
In previous analyses, reliable and valid measurement models for assessing these workplace competences have been developed using confirmatory factor analysis.27,28 On the one hand, reliable and valid measurement models are useful for knowledge application (domain-specific competence) in CAD, FEM, and FEM interpretation,29–32 and on the other hand, in the area of knowledge necessary for domain-specific competence, 33 which was also identified for the three dimensions – CAD, FEM, and FEM interpretation.29,31,32 The present study follows on from such analyses and represents an original and novel study that builds on previous research conducted recently in the field of CAD within mechanical engineering education.
For example, the work of Gummaluri 34 identifies that in the post-digital era, where CAD equips the learner to solve real-time problems with better effectiveness and efficiency in comparison to hand drawing, expectations for mechanical engineers have in recent years inclined toward higher-order thinking skills. In another notable study, Jianwu et al. 35 examples how conditions are changing in mechanical engineering: they explore how a web-enabled artificial intelligence tool could assist mechanical engineering students in terms of the evaluation of CAD drawings. Moreover, the work of Totuk, Selvi, and Akar 36 outlines the surge of 3D printing in CAD education and underscores how technology can indeed influence student cognition and learning strategies – highlighting the point that further studies are required to consider learning strategies that support the fostering of CAD and other workplace competences, in a mechanical engineering education context that is rapidly changing.
The present study addresses this call for further research through examining learning strategies that support the process of acquiring CAD and FEM competences. Specifically, the aim of the present study was to determine which learning strategy (individual self-regulated learning [ISRL] vs cooperative self-regulated learning [CSRL]) is more suitable for promoting CAD and FEM competences. Data was generated through an experiment conducted over two measurement points and evaluated using inferential statistics. Intuitively, it seemed reasonable to assume that working cooperatively in groups of three (CSRL), provided the group was organized appropriately, would be advantageous over learning alone (ISRL) in the process of acquiring CAD and FEM competences. But there was a need to explore this possibility empirically, which was the purpose of the present study, so that stakeholders of vocational education and training, including educators, are not solely reliant on intuition when making decisions.
Hypotheses
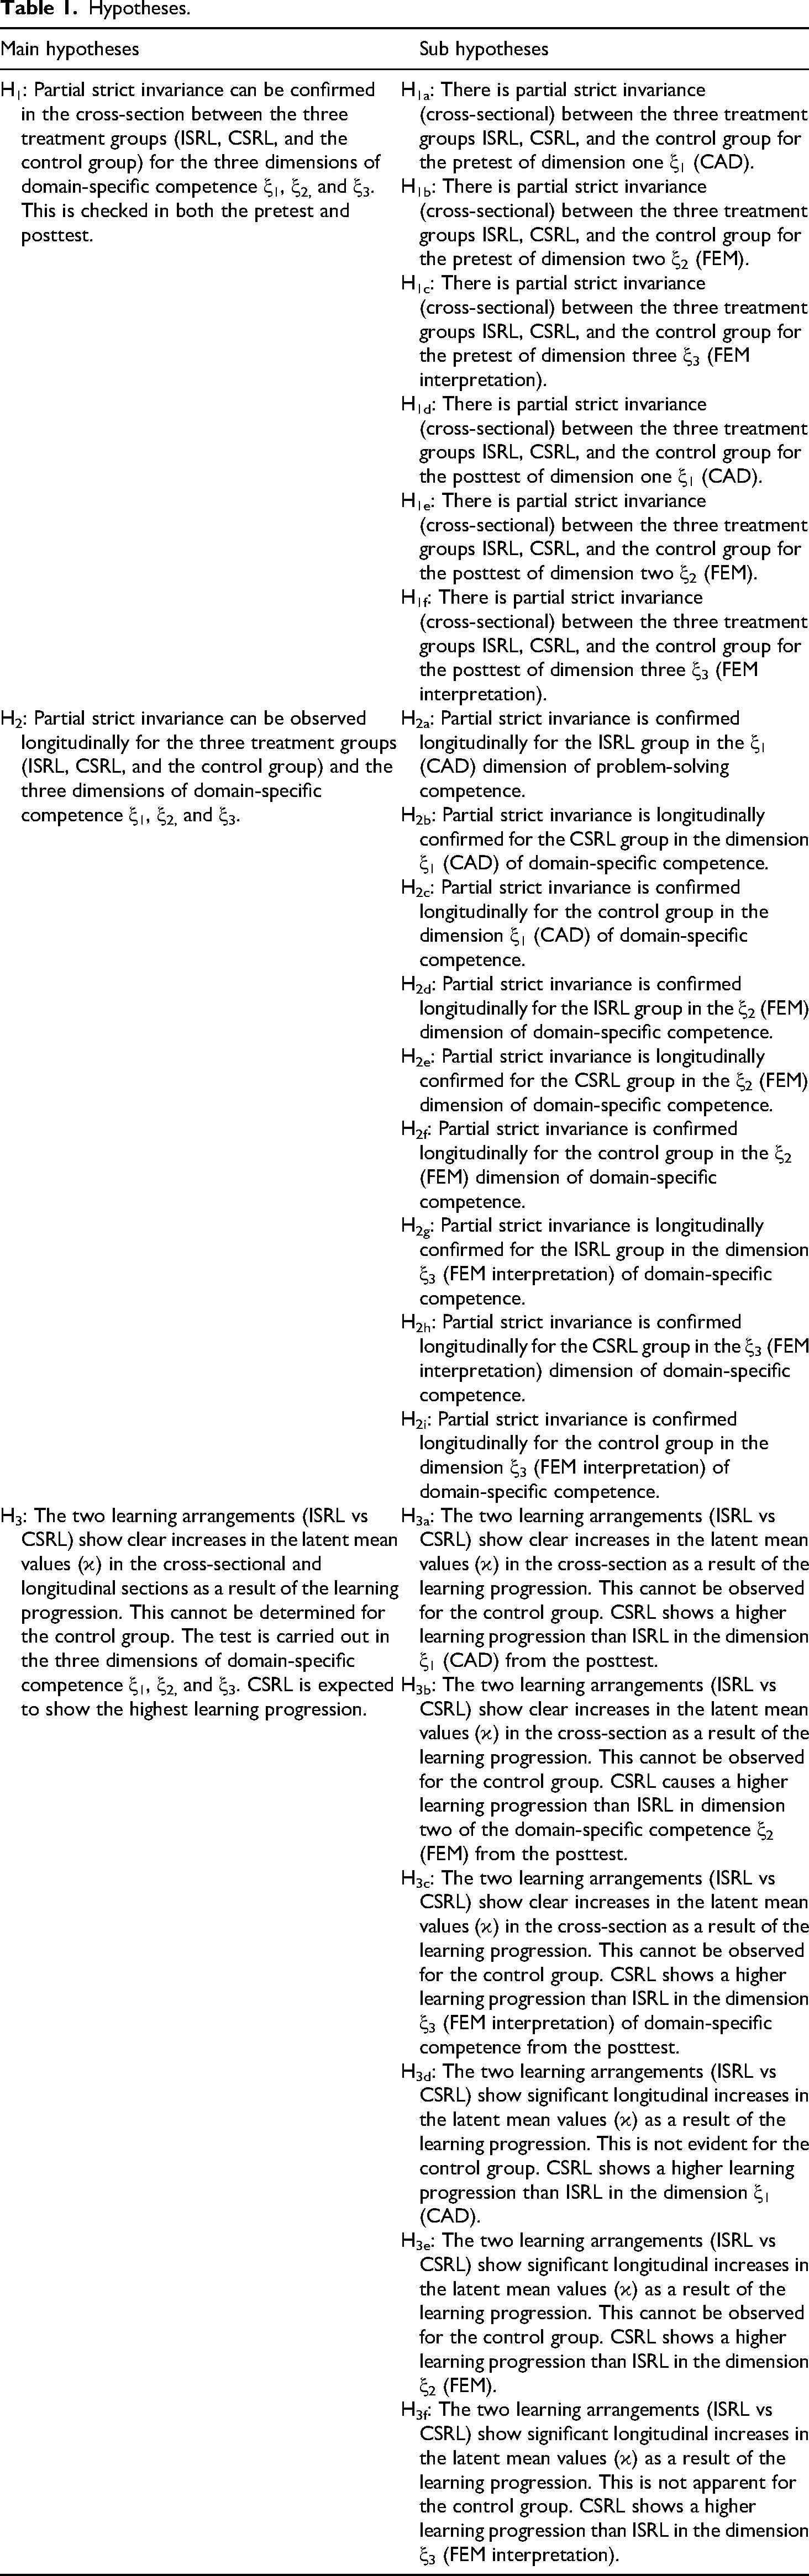
The three dimensions ξ1 (CAD), ξ2 (FEM) and ξ3 (FEM interpretation) of domain-specific competence should show partial strict invariance in both cross-sectional and longitudinal analyses across the three treatment groups: Individual (ISRL), CL (CSRL) and the control group. The three treatment groups should also withstand a longitudinal equivalence test for each of the three dimensions of domain-specific competence. In this regard, hypotheses are outlined in Table 1.
Hypotheses.
Method
Prior to commencement of the study, ethical clearance was granted by the Supervisory and Service Directorate in (taken out for peer-review). 175 students aged between 20 and 35 years, with an average age of 26.5 years partook in the study. All participants were students from four technical colleges in the field of mechanical engineering in the state of Rhineland-Palatinate (Germany). Informed consent was obtained, where participants were informed that their participation in the study was voluntary and that they could withdraw at any time without giving reasons. Of these, 11 students were female. The students were distributed into three treatment groups: ISRL (n = 65), CSRL (n = 62), and the control group (n = 48). Data were collected at the four technical colleges, using a pretest/posttest experimental design. The pretest and posttest each lasted for four school hours (180 min).
Item response theory (IRT) was used for evaluation. Since this method allows individuals and item parameters to be estimated separately, the results are not as heavily dependent on the sample size. In general, a larger sample size is advantageous because more information is available for estimation. Hoyle and Gottfredson 37 recommend a minimum sample size of 200 for structural equation modeling (SEM). However, this is not a cut-off value, as analyses with significantly smaller sample sizes have also yielded good to very good estimation results, 37 p. 993). In this respect, the present analysis was based on a small sample size.
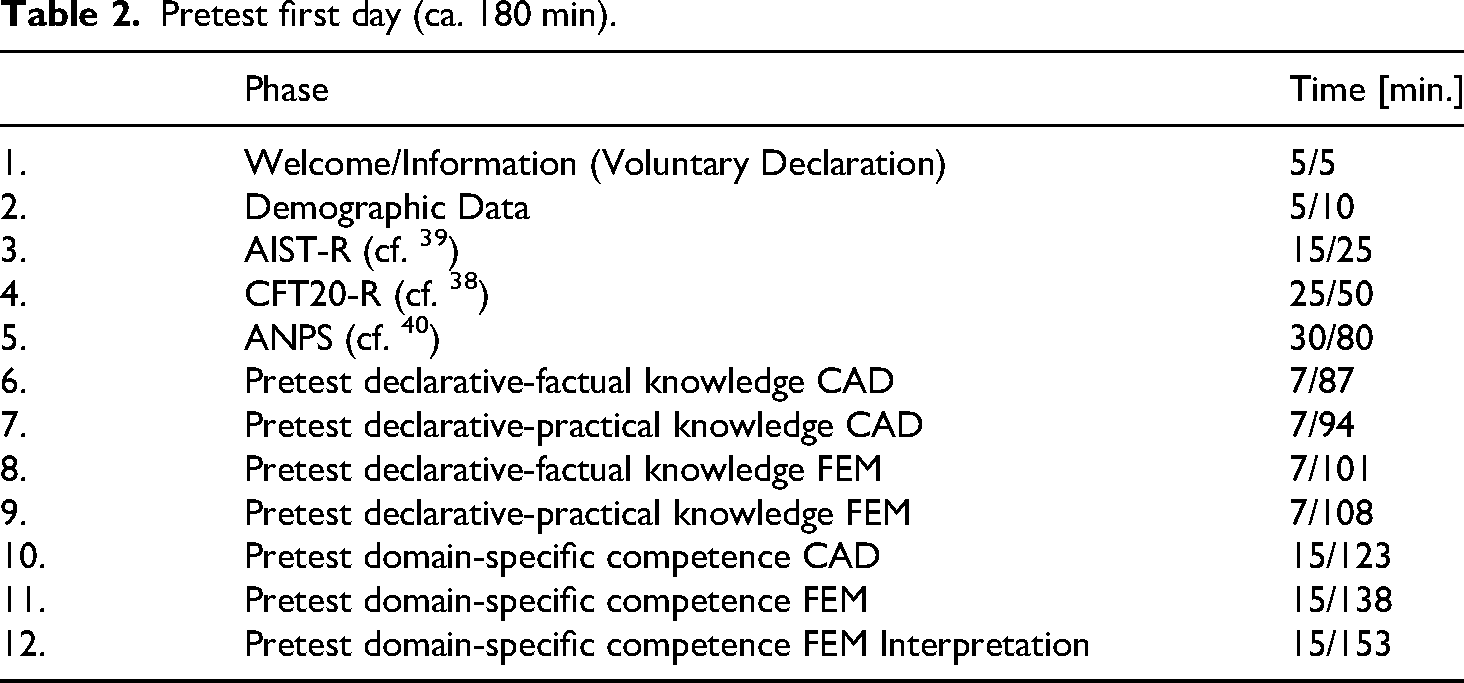
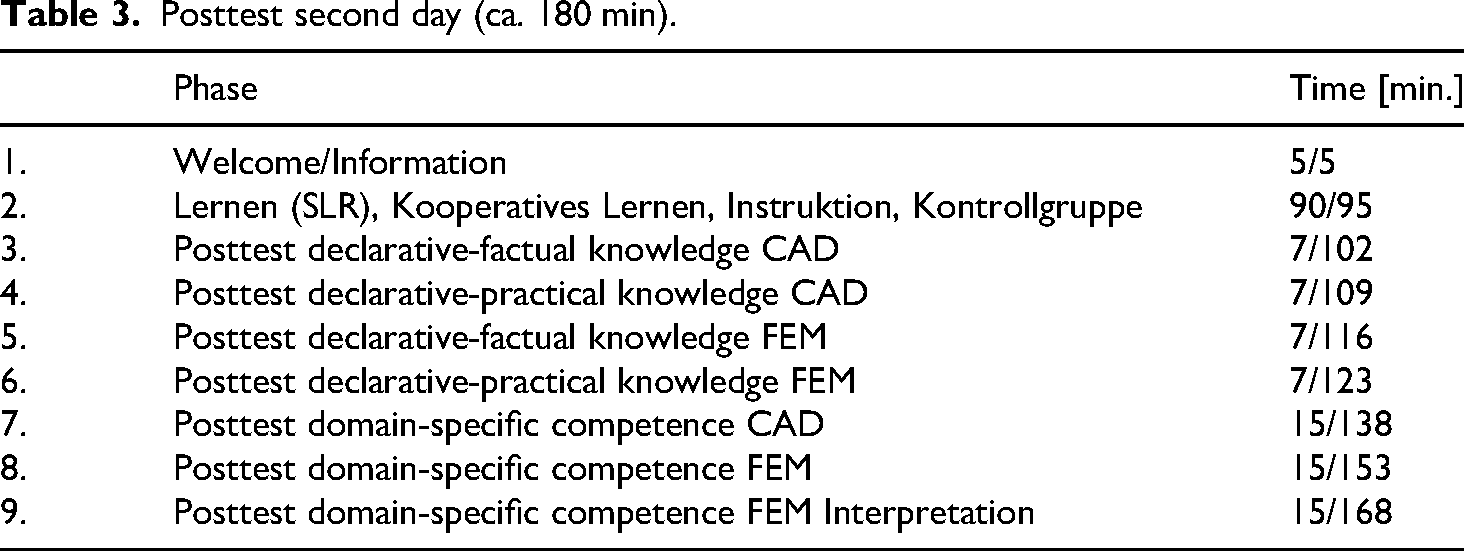
During the 180 min of the pre-test, numerous psychometric tests were conducted to determine the students’ baseline reference (cf. Tables 2 and 3). Several of these tests, including the short version of Part One of the CFT20-R 38 for assessing general cognitive abilities, the AIST-R 39 for assessing vocational interests, and the ANPS 40 for analyzing personality with a focus on emotions, are already recognized and established. Additional analyses, such as those for assessing domain-specific competences and the required content knowledge in the areas of CAD and FEM were required to be designed prior to undertaking the analysis. Reliable and valid measurement models can indeed be created to assess domain-specific competence using confirmatory factor analysis. The measurement model in the present study consisted of the three latent dimensions CAD, FEM, and the interpretation of FEM and was used in the present analysis to check invariance in both cross-sectional and longitudinal sections and to compare learning progress between different learning arrangements. The assessment of competences in 3D modeling, FEM, and the interpretation of FEM analyses for components should be conducted independently of each other. It would not be possible to perform FEM and interpret it on the same component without a 3D model created beforehand. However, due to component independence, it was still possible to perform FEM even if the creation of a 3D model failed. 3D and FEM models were stored on anonymous USB sticks, whereas the FEM interpretation was completed on the digital learning platform Moodle with anonymous user accounts. To enable consideration of secondary quality criteria (cf.41,42) — such as standardization, comparability, economy, and usefulness — the test time for the three variables — 3D modeling, FEM, and FEM interpretation was 15 min each. In accordance with this, the review of feasibility and applicability was modified.
Pretest first day (ca. 180 min).
Posttest second day (ca. 180 min).
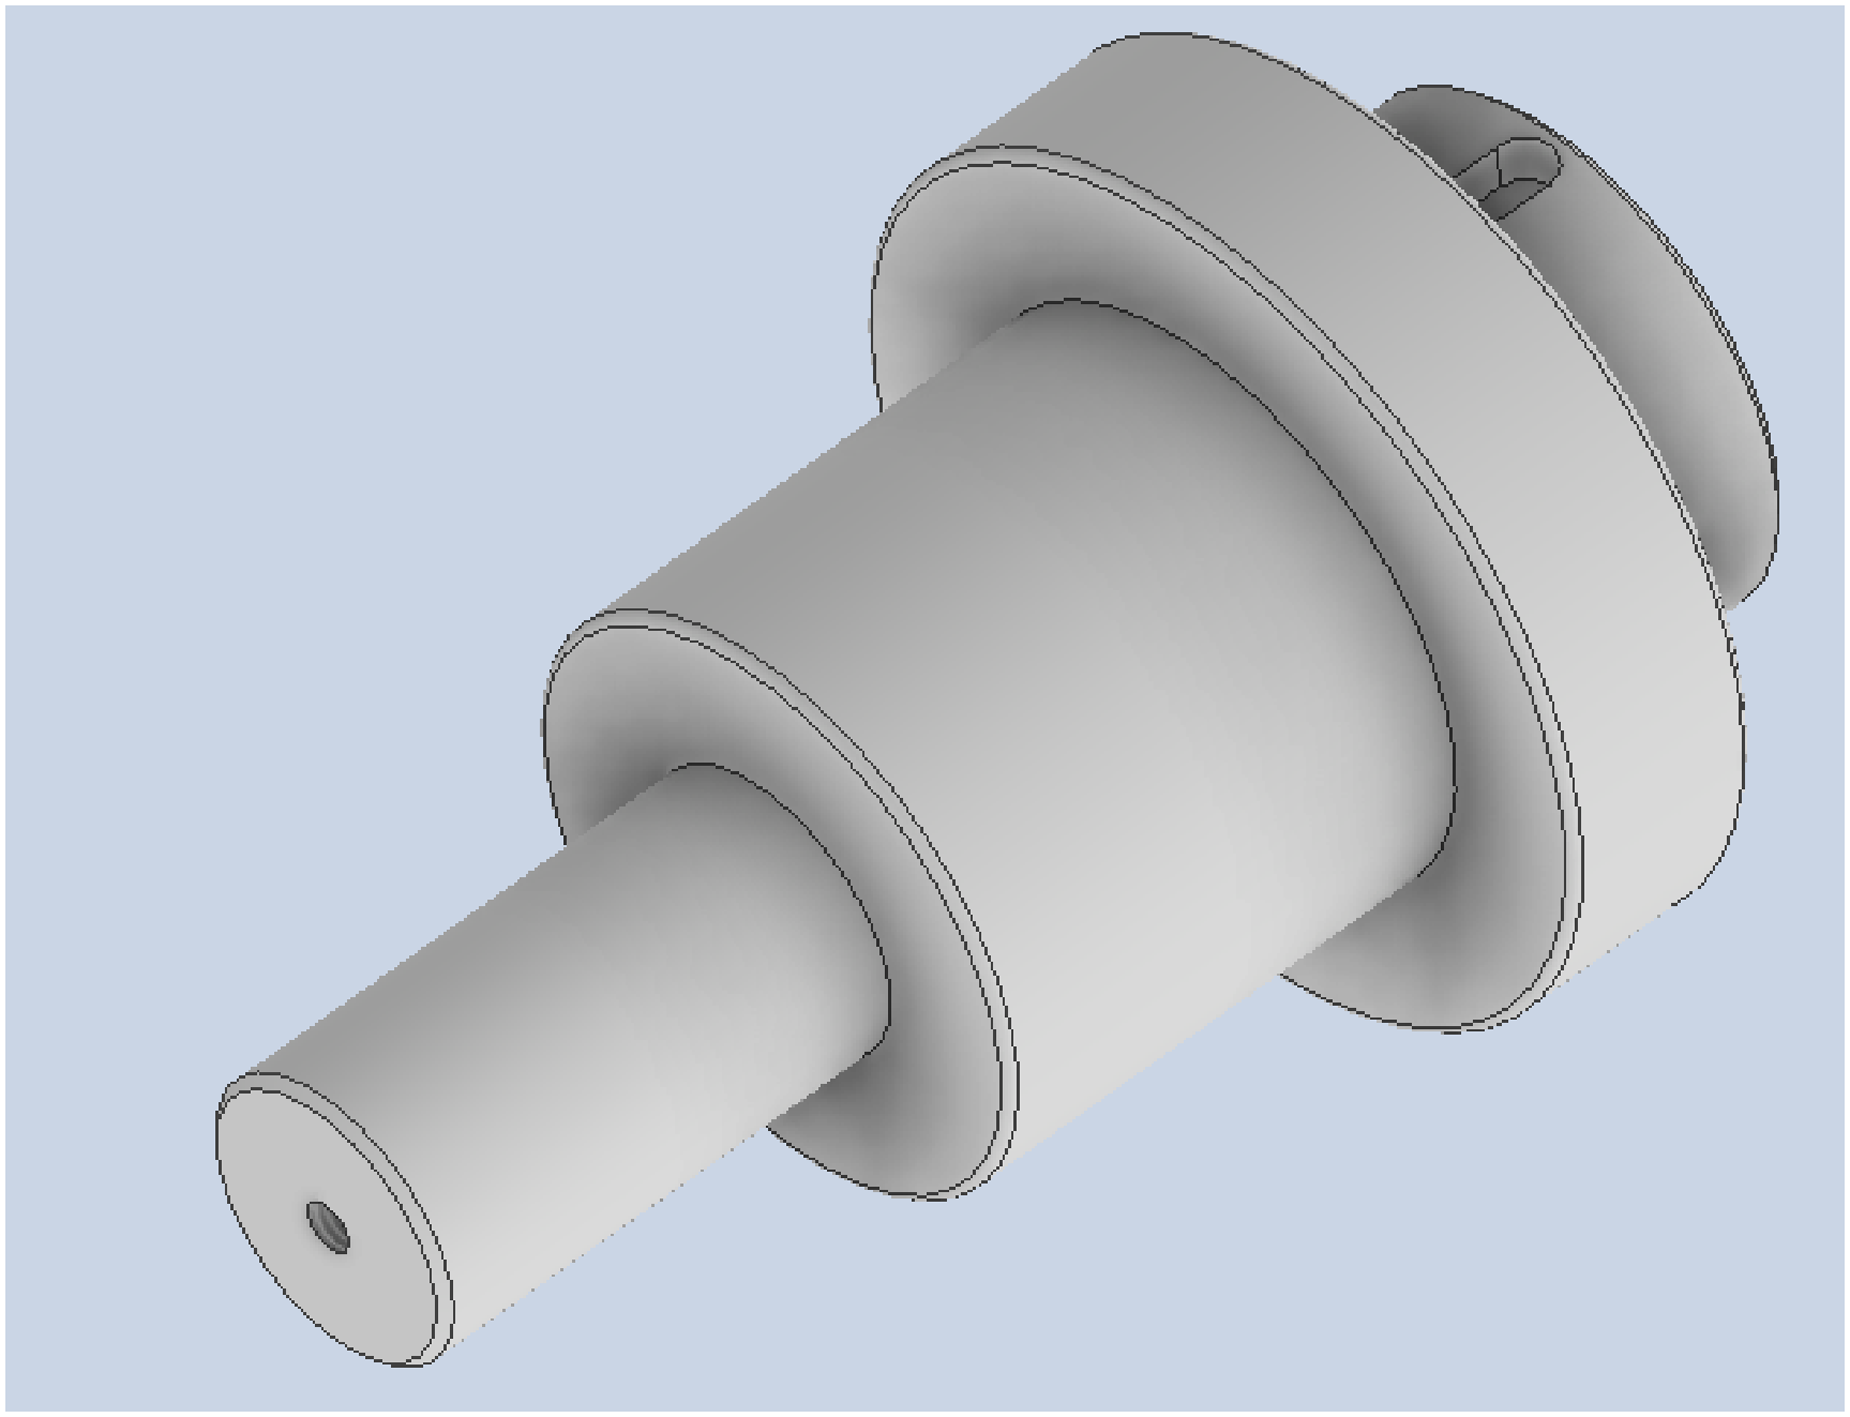
The 3D modeling was done using a file created with the CAD software Inventor. For modeling, students received a drawing with geometric information. Manufacturing information such as position tolerances and technological details, such as information on surfaces, were deliberately omitted: The focus was exclusively on 3D modeling where students created a shaft (cf. Figure 1). The following steps were necessary to develop the shaft in 3D, which simultaneously served as dichotomous items and thus categorical data: selection of the origin plane X-Y, shaded view with edges, material steel, rotation of the shaft, offset of plane, extrusion of the feather key groove, generation of the threaded hole, chamfers, and roundings. In addition to the 3D modeling with CAD, the students created an exercise section as part of the two learning arrangements. The main challenge in planning both components is that, on the one hand, students were given the opportunity to learn all the CAD functions necessary for developing the shaft in the test. On the other hand, students were expected to demonstrate an appropriate level of transfer performance. The basis for this was that the functions required for 3D modeling were identical for both components, while the components differed appropriately in their geometry (cf. Figure 2).
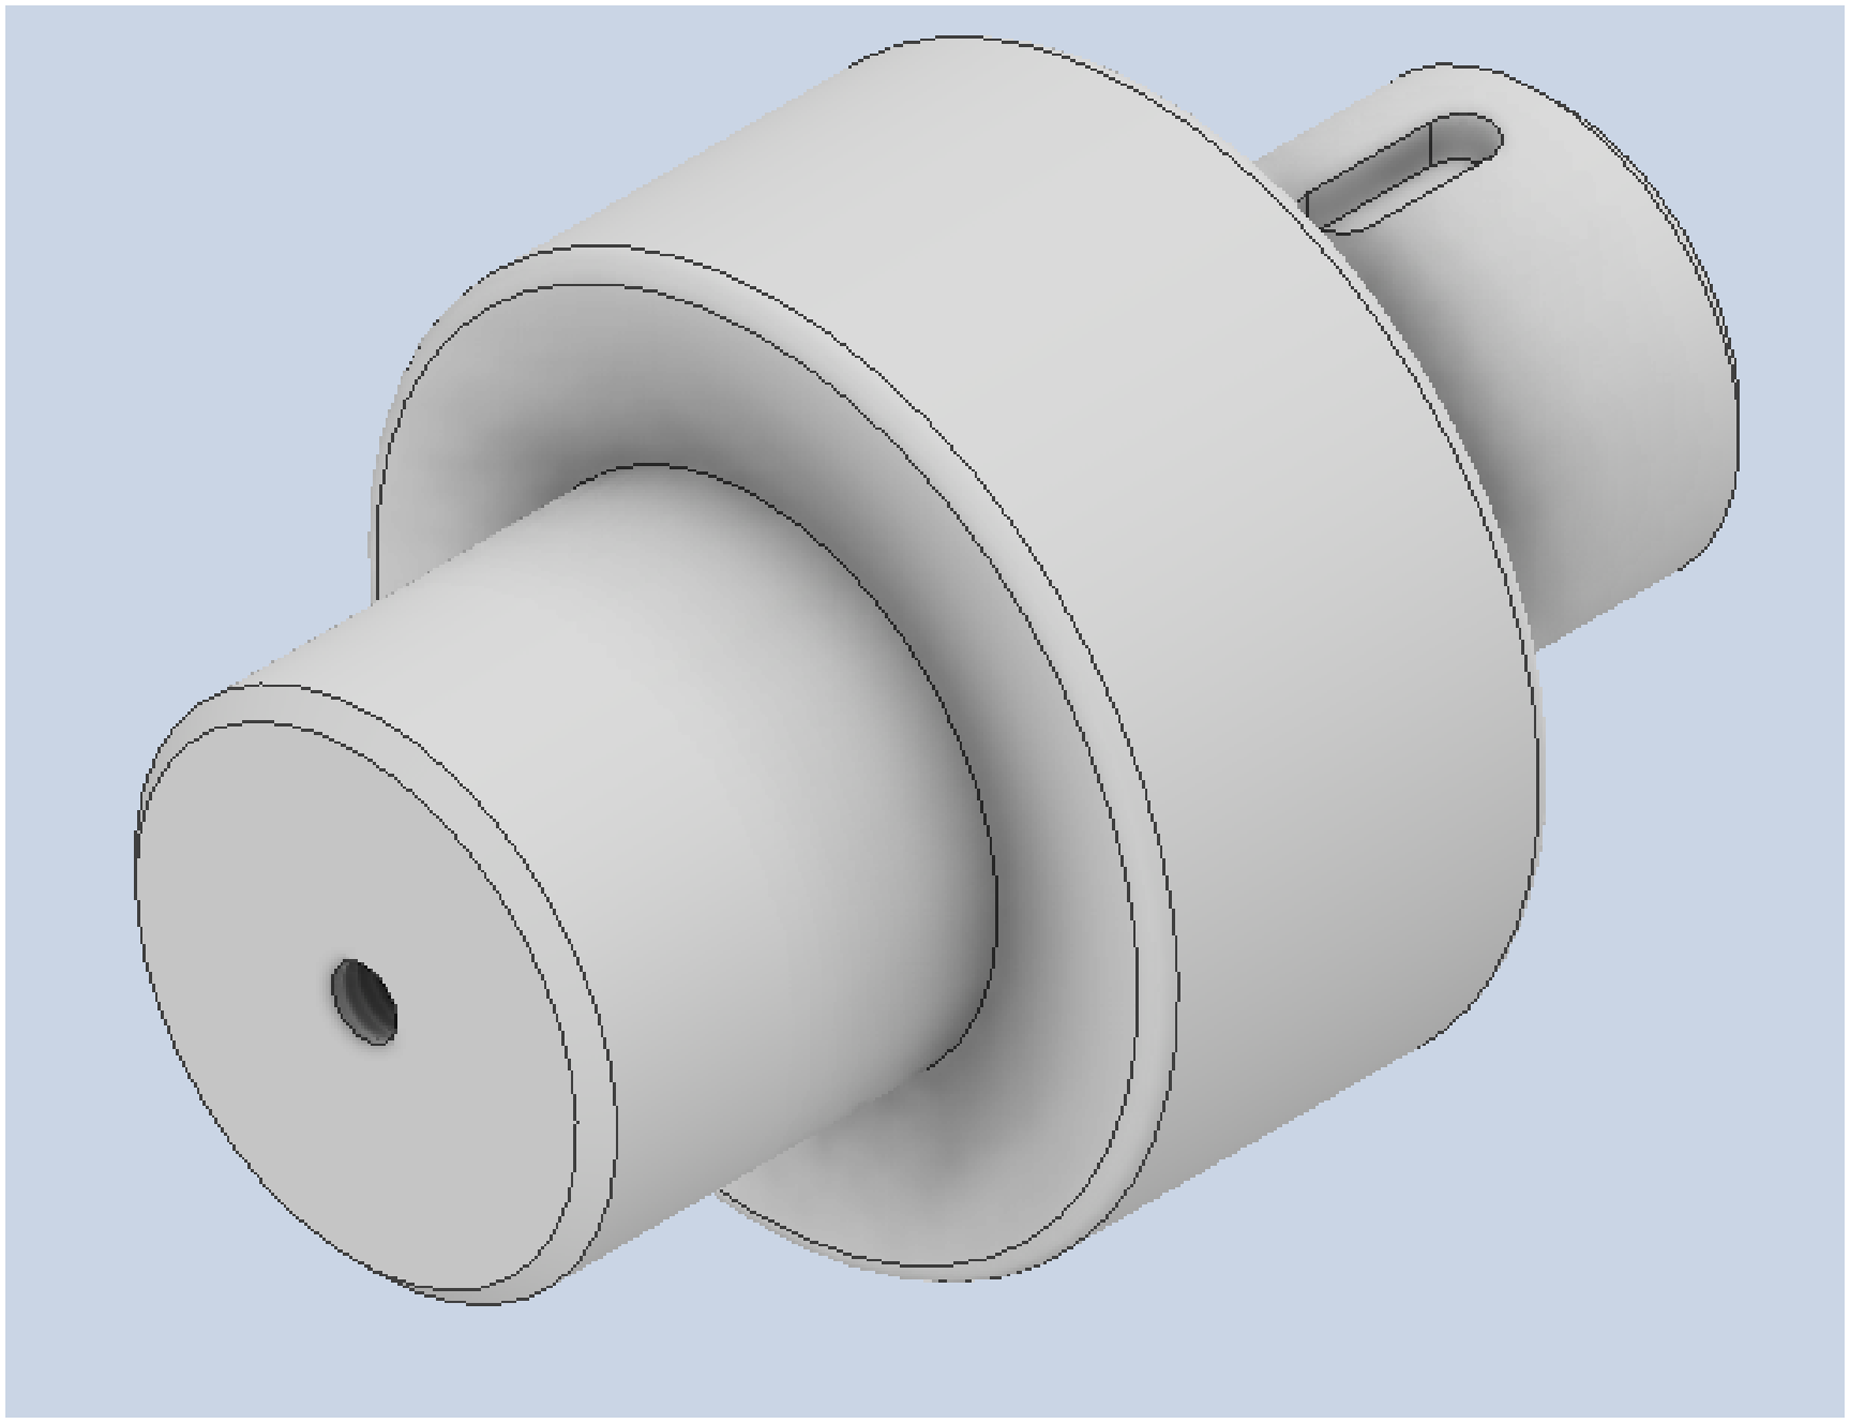
Shaft in pre and posttest.
Shaft in the learning unit.
The measurement for FEM creation was comparable to the CAD test. It also involved categorical data with a dichotomous character. The following seven dichotomous items were checked: material, force, constrain, mesh, maximum and minimum values, video and animation, and self-weight. The FEM was designed to be economical within 15 min. Accordingly, this was a very simple component, which focused more on logical processes for generating FEM that is comparable for more complex components. Similar to the CAD exercise, the FEM assignment also covered the functions required for testing. The difference between the test and the assignment was solely in the geometry of the component, the different load cases, and the varying boundary conditions.
As part of the FEM interpretation exercise, students received a PDF document providing them with the necessary information on topics such as load cases, stresses, deformations, and boundary conditions. The FEM interpretation was checked based on the previous tests. For this purpose, the students evaluated FEM images using a standardized single-choice procedure administered through the Moodle learning platform (see Figure 3). The option “Don’t know (Weiß nicht)” was included to reduce the likelihood of random guessing of correct answers and to enhance test reliability. Overall, the test comprised 15 dichotomous items. The three tests described above (CAD, FEM and FEM interpretation) collectively generate a dichotomous data matrix of zeros and ones, which was saved as a text file. This way, the data matrix could be imported into Mplus. Missing values were coded as −99 in the matrix to ensure proper handling by the program.
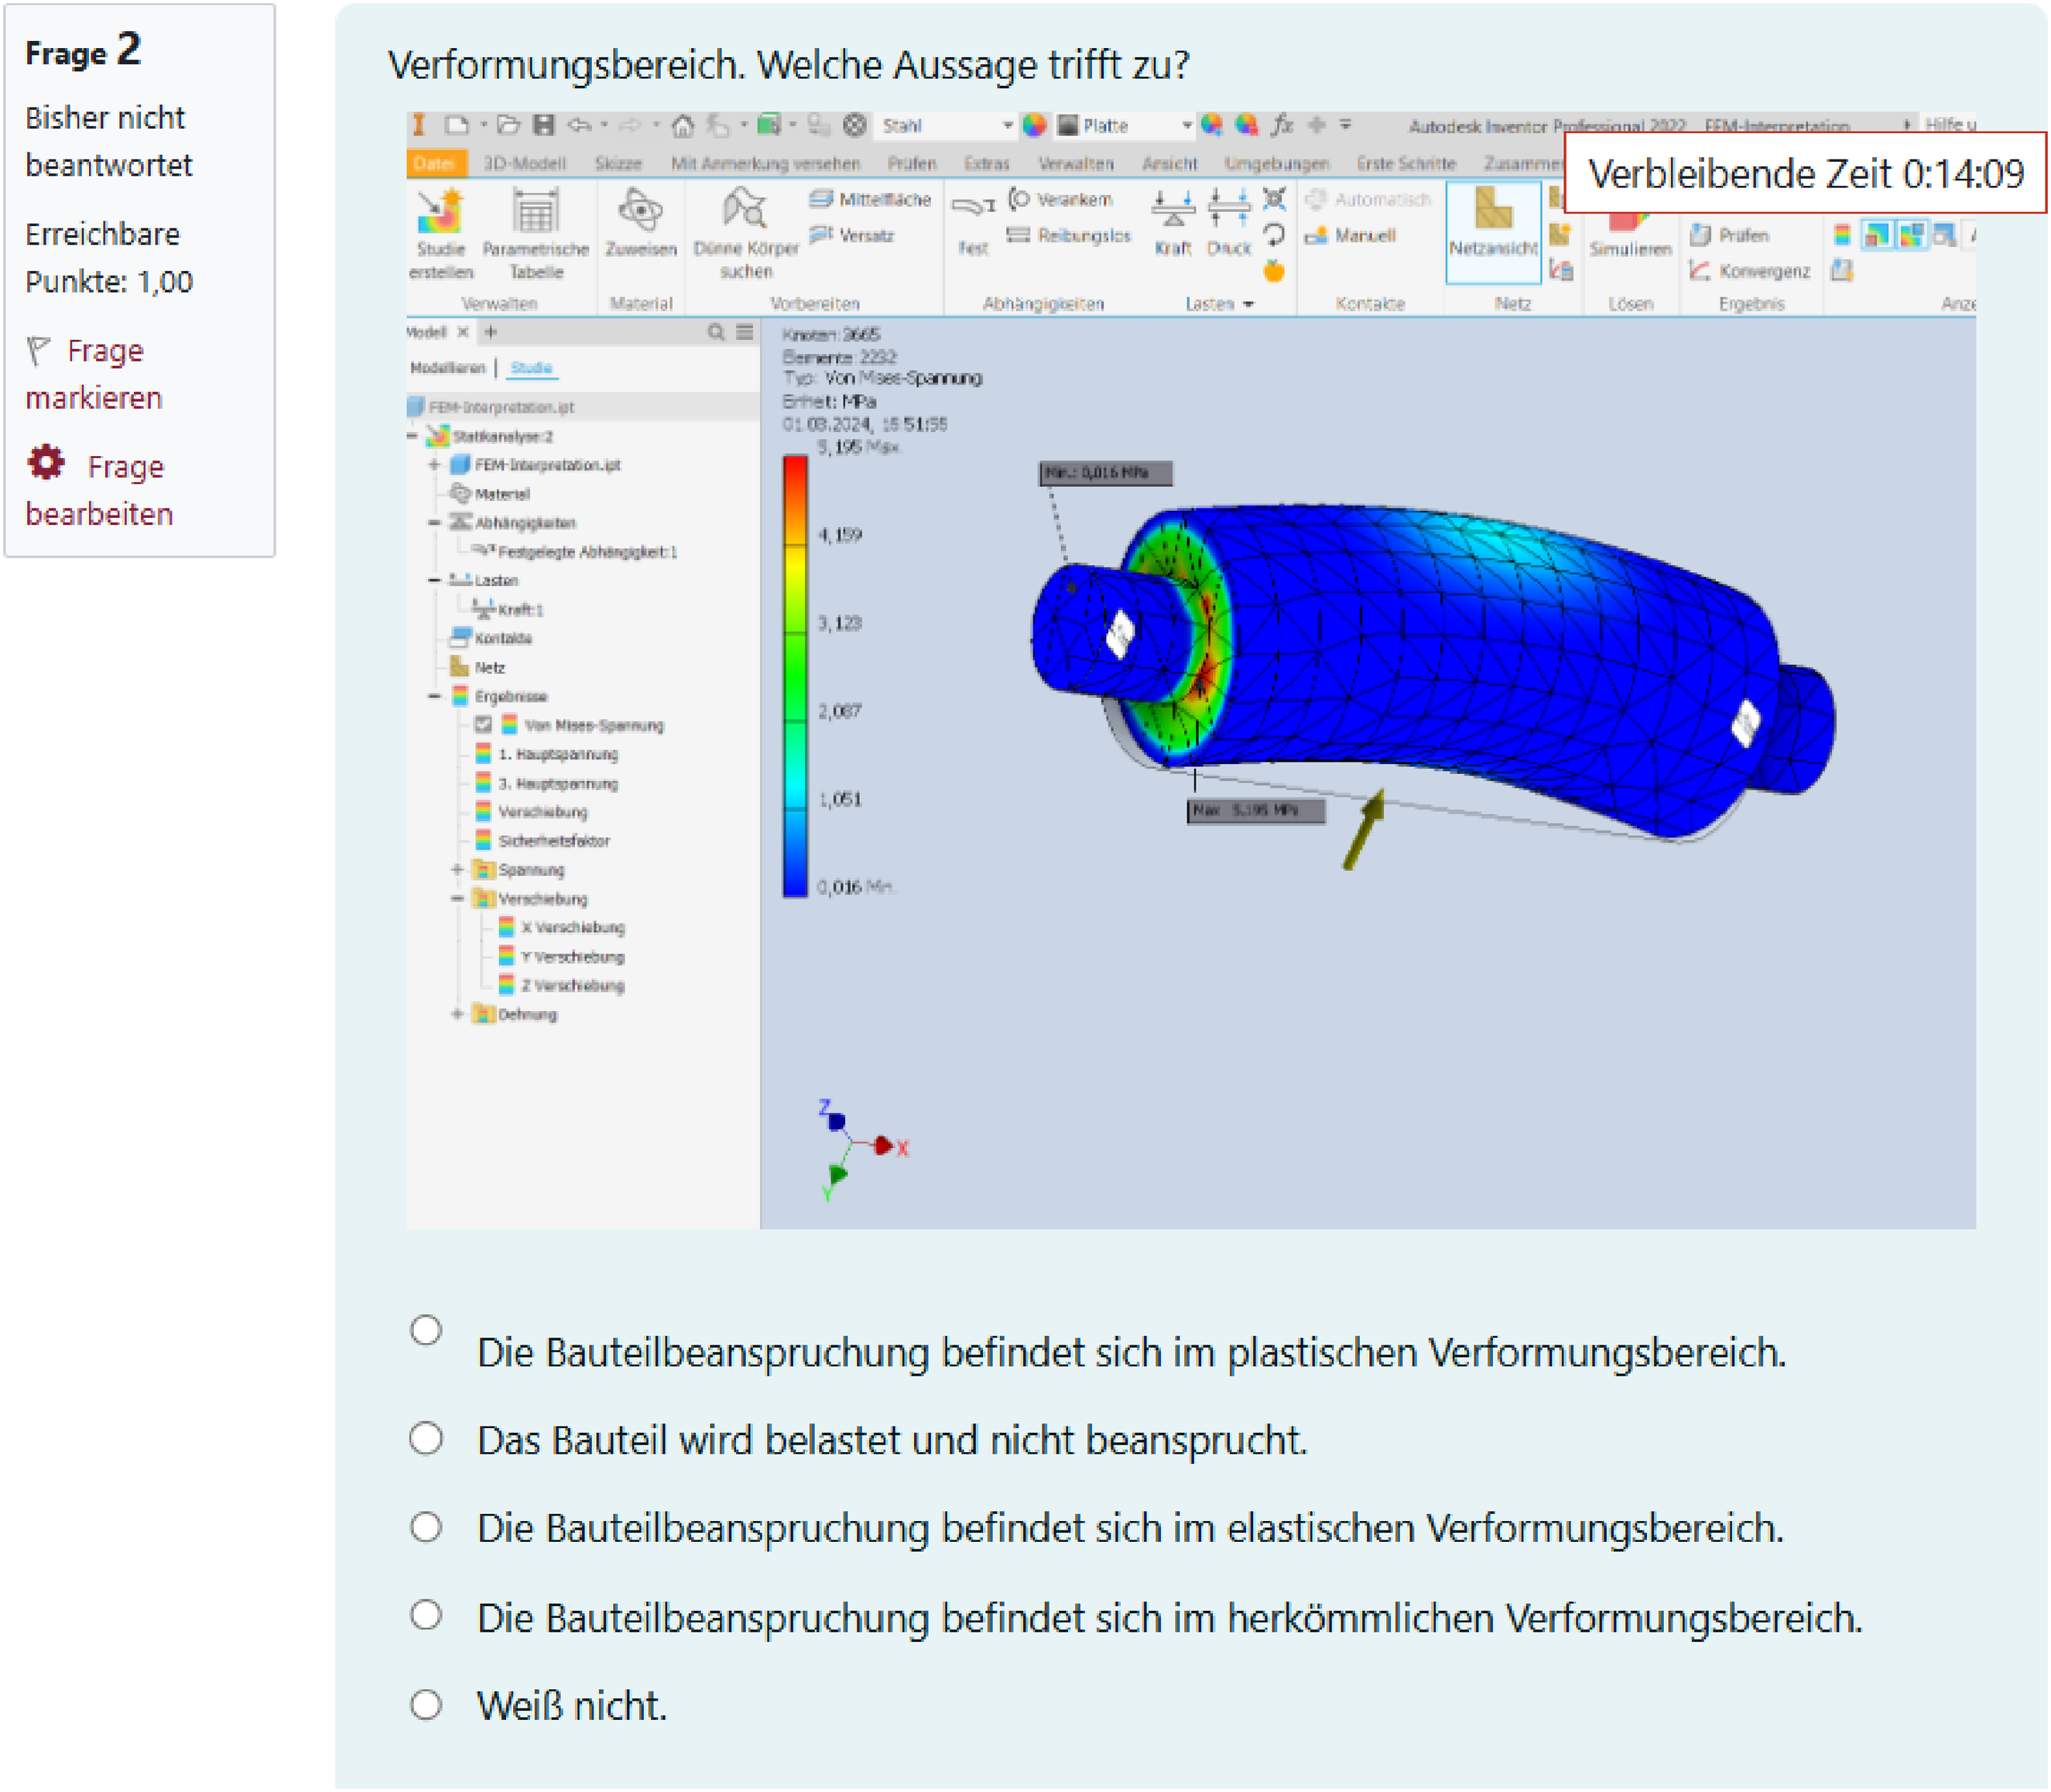
FEM interpretation in pre and posttest.
In the CSRL group, the five basic elements of CL according to Johnson and Johnson 43 were considered during the learning unit. The first basic element of CL, positive interdependence, refers to working toward a common goal. This point could not be realized in the present study because different learning arrangements were being tested. Alternatively, subsequent tests measured individual performance in relation to the expertise acquired in the three areas of CAD, FEM, and FEM interpretation. Accordingly, the identifiability of each individual's performance as a result of the subsequent competence measurement could certainly be seen as an incentive for all group members to get involved. 44 Basic element two is individual accountability and personal responsibility, which means that learners feel responsible for their own learning processes as well as for the learning processes of other group members. This was achieved by organizing expert groups. 45 Basic element three, promotive interaction, states that learners should be as close to each other as possible in order to optimize learning processes. This was achieved through flexible table arrangements and additional functions for cooperation within the group. Basic element four, appropriate use of social skills contributes to constructive interaction between learners. Social skills include encouraging, praising, or offering help to one another. To implement this in the learning unit, students were given additional tasks via cards, such as the role of encourager or time manager. 46 The last basic element, group processing, involves reflection and evaluation, including appropriate improvements with regard to CL. Numerous examples of successful CAD models are evident and can therefore also be evaluated. Furthermore, additional functions such as the role of the time manager were also considered.43,47–49
In addition to the five basic elements of CL, it is also important to consciously avoid competitive situations in order to resolve conflicts constructively. The focus must be on the collective goal of the group and not on individual interests. 20 In the present study, it was considered that competence measurement did not create a competitive situation because the results were collected anonymously. Constructive solutions in learning therefore benefit all participants and should support conflict resolution.
The learning materials were the same for both treatment groups, ISRL and CSRL, where students received video vignettes (Figure 450–52; and explanations in PDF format to support them. The only difference between the two treatment groups was that the ISRL group learned exclusively individually, while the CSRL group involved cooperation (teamwork). The question was therefore whether cooperation in the classroom actually leads to a significant increase in learning progression compared to an individual setting. However, the present analysis was limited to specialist competences. Developments in individual personalities, motivational differences, or developments in cooperation competences were not measured. Due to the high level of control of numerous variables, positive influences of CL should nevertheless be recognizable in the inferential statistical results of domain-specific competences in CAD, FEM, and FEM interpretation.

Video vignettes.
Higher learning progression in favor of the CSRL group would be consistent with numerous previous scientific findings.53–55 However, successful cooperation is not automatic due to expected conflicts, which naturally also speaks in favor of learning and practicing cooperative behavior. It can be speculated whether, as a result of reciprocal processes between the large number of variables during the learning process, a new level of quality can be achieved in the sense of emergence and how many variables cannot be captured. However, we did not intend to immunize the construct of CL against falsification (cf. 56 ). On the contrary, the aim was to gain a differentiated view of the form of learning in order to optimize learning environments.
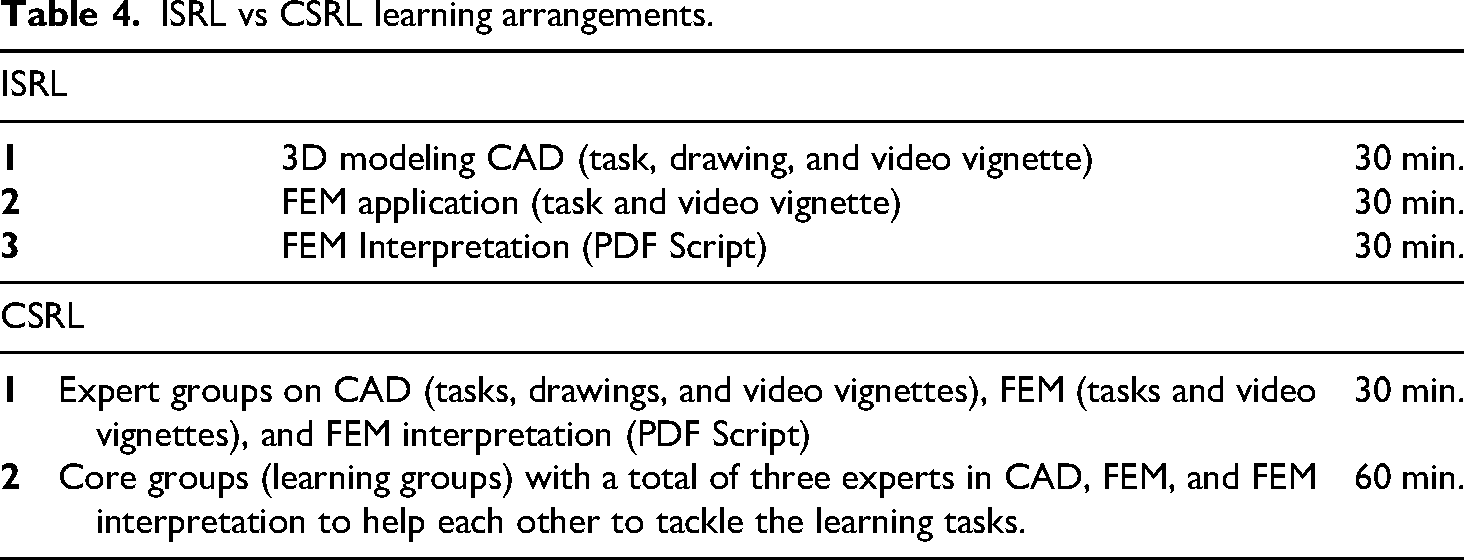
The 90-min learning unit was organized so that both treatment groups - ISRL and CSRL - were in two separate classrooms. Participants in the control group prepared for another subject in the common room. In the ISRL group, students acquired competences independently. They first spent 30 min working with CAD, followed by 30 min applying the FEM, and finally 30 min analyzing the results obtained from the FEM. In the CSRL group, however, students learned in groups of three. They were given three additional functions (encourager, time manager, and process manager) to ensure successful cooperation within the group. 46 In addition, expert groups 45 were organized so that all three students in a group could acquire expert knowledge within the first 30 min and then support each other adequately during joint learning. In general, experts may also move between groups as needed to learn from and with each other. The CL concept offers some theoretical advantages over the more restrictive individual learning approach. Within the first 30 min, each of the three students in the group acquired expert competences comparable to that of the ISRL group. One student dealt with CAD applications, one student practiced FEM, and one student interpreted the results of a FEM analysis. An advantage over an individual learning arrangement could already be apparent in this first 30-min learning phase. The three students had the opportunity to choose independently which topic area they would like to focus on, according to their personal interests. In the ISRL group, this freedom of choice did not exist. In this phase, learners selected a specific topic and then formed expert groups. This gave them the opportunity to exchange ideas and support each other in their learning right from the start. This could already have led to an increase in motivation at this stage and encouraged students to progress with learning. In the second phase, students returned to their original home group, where they could help and support each other in completing the learning tasks. In addition, students had the opportunity to support each other across different groups. These options were not available in the ISRL group. Students had a strictly defined time of 30 min for each learning task and received no support from their fellow students. An additional advantage of the CSRL group could be the flexible and individual time allocation from the second learning phase onwards after 30 min. While the ISRL group was bound to a fixed time format, the CSRL group had the option of adjusting the learning time according to individual needs. If a topic had already been mastered at an earlier stage, the time available could have be used to work on a more challenging topic. This time management could be adjusted within the group according to individual needs and was therefore not tied to the group. For a better overview, both learning arrangements, individual and cooperative, are compared in Table 4.
ISRL vs CSRL learning arrangements.
In a previous analysis, a suitable measurement model for pre- and post-testing of domain-specific competence was already developed via confirmatory factor analyses. This inferential statistical test using Mplus software is frequently used in the social sciences. A three-dimensional competency model was indeed found to exist, as theoretically assumed. Thus, 3D modeling, FEM creation, and FEM interpretation are three distinct dimensions. A one-dimensional structure was therefore refuted. The measurement models tested using inferential statistics led to the exclusion of some items because the loadings were too low. Accordingly, not all of the items originally planned could be retained in the reliable and valid measurement model of domain-specific competence in CAD and FEM. However, the question now needs to be answered as to whether the three groups differ in terms of other variables that have not been recorded or whether the groups are actually comparable with each other. If the groups can be considered equivalent, the results between the pretest and posttest can be compared with each other. Differences in the mean values between the latent variables would also be permissible. This allows for the diagnostic of learning progression and differences between the groups. Accordingly, an invariance test is carried out both cross-sectionally and longitudinally. In the cross-sectional analysis, the invariance test is performed for the pretest on the one hand and for the posttest on the other. The invariance test in the cross-sectional analysis is performed first, both for the pretest and for the posttest. Only when invariance can be established between the groups does the longitudinal test for equivalence make sense. 29
Since the 2000s, invariance tests have been present in the interdisciplinary research landscape thanks to improved software packages (such as Mplus). Although the groups are assumed to be equivalent for comparison from a theoretical perspective, they are not identical in composition. For this reason, partial differences, e.g., in the form of different correlations between the indicators, can be partially justified. 57 This partial invariance therefore exists when few of the indicators are not invariant, but the remaining indicators can be considered equivalent. Finally, minor differences may still exist within the groups, as they are similar but not identical.58,59 When comparing the invariance test of continuous data with that of categorical data, further considerations are necessary, especially with regard to model identification and the equating of boundary conditions. The four steps – configural, weak, strong, and strict – of the invariance test for continuous data are also applied as far as possible to the test for equivalence of categorical data. A modified chi-square difference test can also be used here for model comparison in Mplus7.60–62
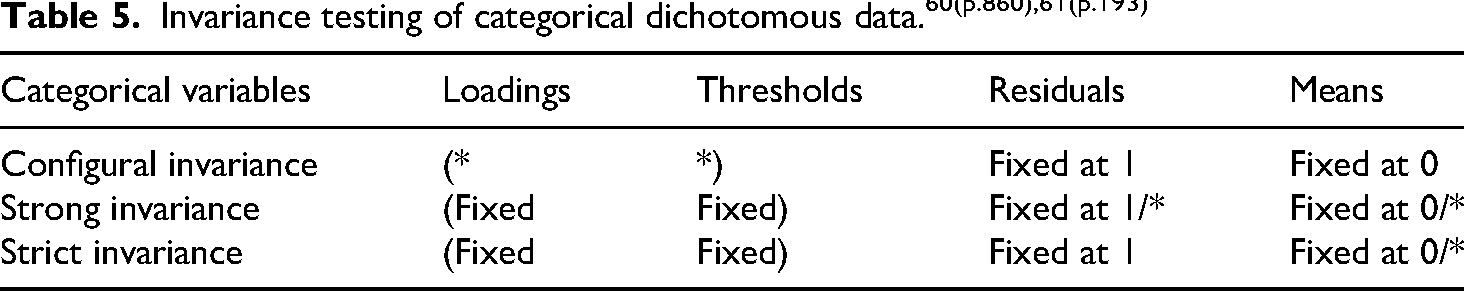
Schroeders and Wilhelm 60 examine the invariance of categorical dichotomous data in three steps (cf. Table 5). This procedure is applied in the present analysis. In the first step, the residual variances of the four groups are fixed at one, and the means of the latent variables are fixed at zero for the cross-sectional analysis. The loadings and thresholds, on the other hand, are estimated freely. This first step can be defined as configural invariance, provided that an acceptable model with adequate fit values emerges. The second step is referred to as strong invariance. Here, a second model is generated that is more restrictive than the previous one. To do this, the related factors and thresholds are equated across the three groups in this study. Only the residual variances are fixed at one for the first group, in this case the ISRL group. The residual variances of the other groups are estimated freely. The same is done for the factor means. Only the first ISRL group retains the factor mean fixation at zero. The factor means of the other two groups are estimated freely. The first and second models are then compared using the chi-square difference test. If the test is not significant, this means that the models are comparable and that strong invariance between the three groups can be assumed. In the opposite case of a significant chi-square difference test between models one and two, the models would differ substantially, and strong invariance cannot be established. The last step represents strict invariance. Therefore, only the residual variances from the previous model two are changed. To do this, the residual variances of all three groups are again fixed to one, as in the first model. The remaining parameter restrictions remain the same as in the previous model two. Again, invariance is established with a non-significant chi-square difference test. This means that strict invariance is achieved in the third stage. Table 5 provides an overview of the categorical dichotomous invariance test for cross-sectional and longitudinal data.59,60 The asterisk indicates a free estimate of the respective parameters. Fixed without explicit specification (1 or 0) denotes equality constraints (such as threshold t11) across the three groups.60,61
The learning progression of both learning arrangements and the control group was tested using the longitudinal model of strict invariance. The mean values of the latent variables (ϰ) are decisive for this. Mean value comparisons can be made using the confirmatory factor analysis model of the respective longitudinal strict invariance. In this context, the corresponding latent factor means at measurement point 1 are also fixed at zero. In contrast, the latent factor means (ϰ) at measurement point 2 are estimated freely. Thus, all mean changes of the groups in the respective dimension of domain-specific problem-solving competence have the same reference point (zero). 63
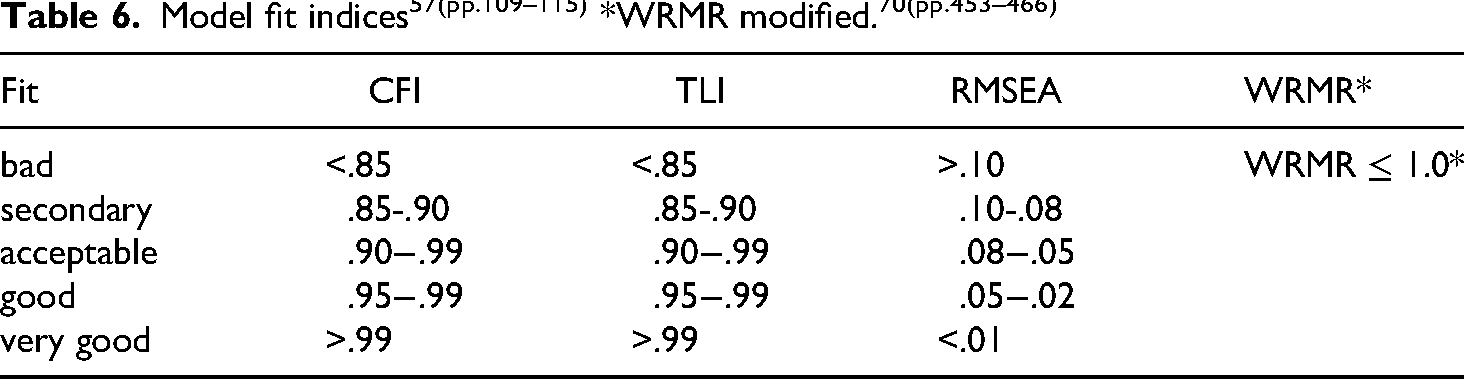
The models were estimated using the WLSMV estimator, which is appropriate for categorical data.64,65 Model fit indices are considered for structural equation models to assess the model estimation or model fit. Here, the empirically observed data are compared with the hypothetical model. In this context, absolute and incremental fit indices can be distinguished.57,64,66,67 However, it should be noted that these values are not fixed definitions but must be considered in the general context. 68
In this regard, the Tucker-Lewis Index (TLI), the Comparative Fit Index (CFI), and the Root Mean Square Error of Approximation (RMSEA) are used for model estimation in the present work (cf. Table 6). Since this study also involves categorical data, the additional use of the Weighted Root Mean Square Residual (WRMR) is considered appropriate. 69
Results
As explained in the previous chapter, the strategy was first to establish invariance between the three treatment groups for the dimensions ξ1, ξ2, and ξ3 in the cross-section. This was done in the pretest and posttest. The latent dimension of domain-specific competence ξ1 (use of CAD) actually shows partial strict invariance for the pretest and strict invariance for the posttest. The model fit values in the pretest are predominantly very good at the first level of configural invariance (RMSEA = .071; CFI = .998; TLI = .996; WRMR = .866). The factor loadings of all five manifest variables in the three groups are highly significant ** (p ≤ 0.01). For the group (ISRL) (n = 65), the five loadings range from λ = .792** to λ = .996**. The group (CSRL) (n = 62) shows factor loadings ranging from λ = .855** to λ = .998**. The factor loadings for the control group (n = 48) range from λ = .855** to λ = .998**. Compared to the more restrictive level of so-called strong invariance, the model fit values remain good to very good using the chi-square difference test (RMSEA = .062; CFI = .998; TLI = .997; WRMR = 1.059). The chi-square difference test is also not significant (p = 0.2728). However, the restrictions cannot be fully implemented. For example, a residual variance must remain fixed at one. An additional correlation between two manifest variables in the CSRL and control groups is also permitted. Accordingly, only partial invariance can be said to exist at this second stage. The chi-square difference test is also not significant between the comparison of strong and strict invariance (p = 0.2164). Therefore, strict invariance between the three groups is partially present in the pretest, which means that hypothesis H1a is correct. The mean values between the groups are close to each other. The mean value of the latent variables does not differ between the two groups ISRL and CSRL. The control group (ϰ = -0.146) is slightly below. For the posttest, the model fit values at the first level of configural invariance are also in a very good range (RMSEA = .080; CFI = .996; TLI = .992; WRMR = .723). The factor loadings of all five manifest variables in the three groups are predominantly highly significant **(p ≤ 0.01). For the ISRL group (n = 65), the loadings range from λ = .690** to λ = .960**. The CSRL group (n = 62) shows factor loadings going from λ = .810** to λ = .991**. The factor loadings for the control group (n = 48) range from λ = .787** to λ = .959**. Compared to the more restrictive level of so-called strong invariance, the model fit values remain good to very good using the chi-square difference test (RMSEA = .000; CFI = 1.000; TLI = 1.001; WRMR = .832). The chi-square difference test is also not significant (p = 0.7277). In contrast to the pretest, all restrictions can be applied, resulting in strong invariance between the three groups. The chi-square difference test is also not significant between the comparison of strong and strict invariance, and all additional restrictions can be applied here as well (p = 0.1040). The model fit values remain in a good to very good range. Consequently, there is indeed strict invariance between the three groups in the posttest. Hypothesis H1d can therefore be confirmed. The mean values between the two learning groups (ISRL and CSRL) are close to each other and do not differ (ϰ ≈ 0). However, the control group is significantly lower with a mean value of (ϰ = –0.901). In the pretest, there were negligible differences in the mean values between the three groups. This situation changed in the posttest. Here, the control group is significantly below the mean values of the two learning groups. This difference can already be interpreted as an initial indication of learning progression. Apparently, the two learning groups have learned significantly and are thus at a higher level than the control group. This confirms hypothesis H3a.
The latent dimension of domain-specific competence in dealing with FEM actually shows partial strict invariance for the pretest and strict invariance for the posttest. The model fit values in the pretest are good to very good at the first level of configural invariance (RMSEA = .089; CFI = .998; TLI = .997; WRMR = 1.073). The factor loadings of all six manifest variables in the three groups are highly significant **(p ≤ 0.01). For the ISRL group (n = 65), the six loadings range from λ = .709** to λ = .999**. The CSRL group (n = 62) shows factor loadings ranging from λ = .674** to λ = .991**. The factor loadings for the control group (n = 48) vary from λ = .568** to λ = .955**. Compared to the more restrictive level of so-called strong invariance, the model fit values remain acceptable to very good using the chi-square difference test (RMSEA = .089; CFI = .997; TLI = .997; WRMR = 1.320). The chi-square difference test is also not significant (p = 0.1060). However, the restrictions cannot be fully implemented. For example, a factor loading must be estimated freely. An additional correlation between two manifest variables in the ISRL group is also permitted. Accordingly, only partial invariance can be assumed at this second stage. The chi-square difference test is also not significant between the comparison of strong and strict invariance (p = 0.0658). For that reason, strict invariance between the three groups is partially present in the pretest, which does not refute hypothesis H1b. The mean values between the groups are close to each other. The mean value of the latent variables does not differ between the two groups ISRL and CSRL. The control group (ϰ = –0.185) is slightly below. For the posttest, no reliable results can be obtained even at the configural level. At this point in the cross-section, no invariance can be established. Hypothesis H1e cannot therefore be confirmed. The longitudinal invariance test for ξ2 is therefore negative.
The latent dimension of domain-specific competence for interpreting FEM (ξ3) shows, however, partial strict invariance for the pretest and posttest. The model fit values in the pretest are acceptable to very good at the first level of configural invariance (RMSEA = .041; CFI = .992; TLI = .989; WRMR =1.184). The factor loadings of all ten manifest variables in the three groups are highly significant **(p ≤ 0.01). For the ISRL group (n = 65), the ten loadings range from λ = .193** to λ = .942**. The CSRL group (n = 62) shows factor loadings between the values from λ = .565** to λ = .972**. The factor loadings for the control group (n = 48) range from λ = .330** to λ = .958**. Compared to the more restrictive level of so-called strong invariance, the model fit values remain acceptable to very good using the chi-square difference test (RMSEA = .050; CFI = .986; TLI = .984; WRMR = 1.366). Furthermore, the chi-square difference test is not significant (p = 0.0584). However, the restrictions cannot be fully implemented. For example, an additional correlation between two manifest variables in the ISRL group must be allowed. In this context, only partial invariance can be recorded in this second stage. The chi-square difference test is also not significant between the comparison of strong and strict invariance (p = 0.0599). Correspondingly, strict invariance between the three groups is partially present in the pretest, which means that hypothesis H1c is correct. The mean values between the groups are close to each other. The mean value of the latent variables does not differ between the two groups ISRL and CSRL. The control group is slightly higher (ϰ = 0.169). For the posttest, the model fit values are in the good to very good span at the first level of configural invariance (RMSEA = .000; CFI = 1.000; TLI = 1.002; WRMR = 1.055). The factor loadings of all ten manifest variables in the three groups are predominantly highly significant **(p ≤ 0.01). For the ISRL group (n = 65), the loadings range from λ = .378** to λ = .929**. The CSRL group (n = 62) shows factor loadings going from λ = .298** to λ = .875**. The factor loadings for the control group (n = 48) were presented from λ = .397** to λ = .996**. Compared to the more restrictive level of so-called strong invariance, the model fit values remain acceptable to very good according to the chi-square difference test (RMSEA = .031; CFI = .991; TLI = .990; WRMR = 1.217). The chi-square difference test is also not significant (p = 0.0845). The chi-square difference test is also not significant in the comparison of strong and strict invariance (p = 0.3560). The model fit values remain in an acceptable to very good range. Accordingly, there is partial strict invariance between the three groups in the posttest. Hypothesis H1f can therefore be supported. The latent mean of the CSRL group differs significantly from the reference group ISRL with (ϰ = 0.399) and from the control group. This difference can already be interpreted as an initial indication of learning progression. Apparently, the CSRL group performed best in this dimension of domain-specific competence. This confirms hypothesis H3c.
In summary, partial strict invariance can indeed be observed cross-sectionally for the pretests and posttests of the dimensions ξ1 and ξ3 of domain-specific competence. For ξ2, invariance only applies in the pretest. Consequently, hypothesis H1e is the only one that cannot be confirmed. The other hypotheses in the hypothesis family H1 cannot be refuted and can therefore be retained. The mean values of the latent variables in the pretest between the three groups are approximately at the same level. This changes in the posttest. Here, significant differences from the control group become apparent, allowing initial indications of learning progression through the learning arrangements to be anticipated. For that reason, hypotheses H3a and H3c can already be confirmed. The next step is to test the longitudinal invariance of the latent variables across the two measurement points. This is only legitimate given the partial strict invariance in the cross-section for the pretest and posttest. Based on this, the hypothesis family H2 is tested next, and then the mean changes of the latent variables across the two measurement points are observed.
First, the dimension one domain-specific competence ξ1 (use of CAD) is checked for longitudinal invariance in the three treatment groups (cf. Figure 5). The configural model of the ISRL group (n = 65) shows very good model fit values (RMSEA = .035; CFI = .995; TLI = .993; WRMR = .519). With one exception, the factor loadings of all five manifest variables at both measurement points are highly significant **(p ≤ 0.01). For group ξ11 (pretest), the five loadings range from λ = .798** to λ = .990**. Group ξ12 (posttest) shows factor loadings spanning from λ = .515 to λ = .860**. The model fit values remain very good in comparison with the more restrictive level of so-called strong invariance using the chi-square difference test (RMSEA = .000; CFI = 1.000; TLI = 1.007; WRMR = .550). The chi-square difference test is also not significant (p = 0.6121). The restrictions can be fully realized. Accordingly, strong invariance can be assumed. The chi-square difference test is also not significant between the comparison of strong and strict invariance (p = 0.2484). However, a correlation between two measurement points must be fixed for one indicator. Correspondingly, only strict invariance is partially present between the two measurement points, which mean that hypothesis H2a is correct. The mean change is ϰ = .940, which shows strong learning progression through the learning arrangement (ISRL). Consequently, hypothesis H3d is confirmed.
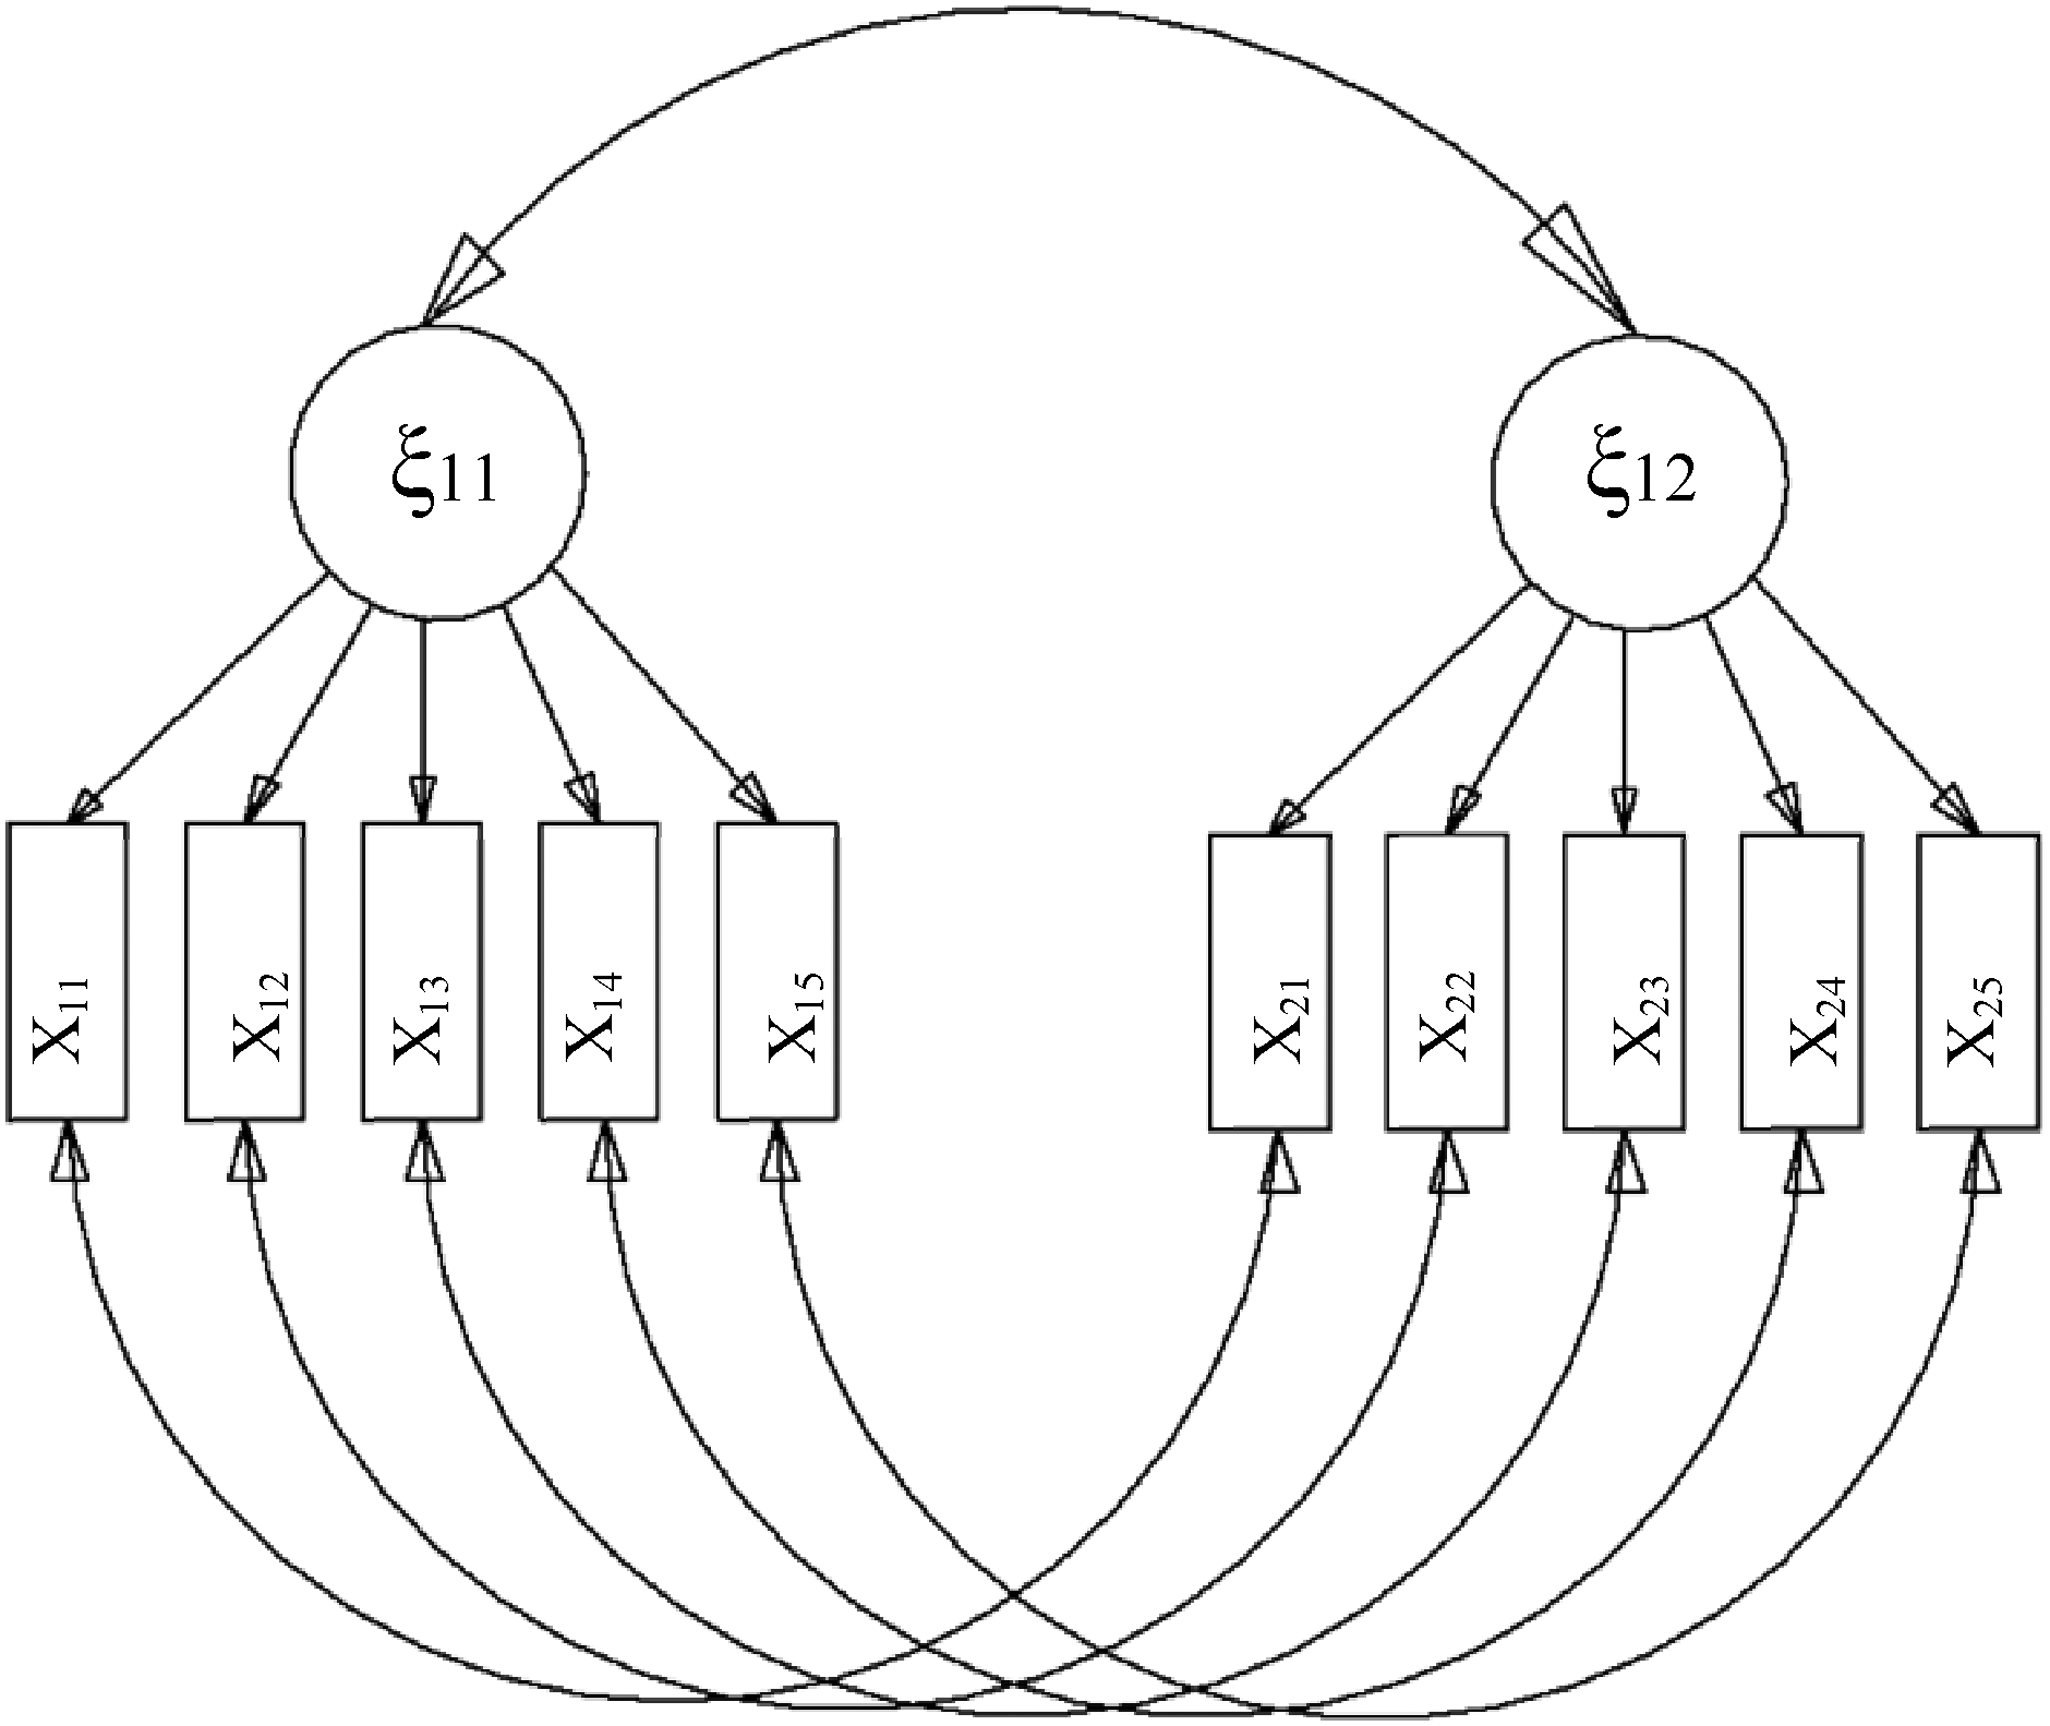
Longitudinal invariance test of the latent variable ξ1.
The configurational model of CSRL (n = 62) shows very good model fit values (RMSEA = .023; CFI =1 .000; TLI = .999; WRMR = .474). The factor loadings of all five manifest variables at both measurement points are highly significant **(p ≤ 0.01). For group ξ11 (pretest), the five loadings range from λ = .848** to λ = .996**. Group ξ12 (posttest) shows factor loadings ranging from λ = .765 to λ = .988**. The model fit values remain very good in comparison with the more restrictive level of so-called strong invariance using the chi-square difference test (RMSEA = .000; CFI = 1.000; TLI = 1.000; WRMR = .487). The chi-square difference test is also not significant (p = 0.5841). However, the restrictions cannot be fully implemented. Two correlations between two indicators at both measurement points must be omitted. Appropriately, only partial strong invariance can be said to exist. The chi-square difference test is also not significant between the comparison of strong and strict invariance (p = 0.3031). Consequently, strict invariance is partially present between the two measurement points, which means that hypothesis H2b can be recorded. The mean change is ϰ = .684, indicating strong learning progression from the CSRL arrangement.
For the control group, there are overlapping covariances during the estimation. This could be related to the fact that the groups are too similar at the two measurement points. For these reasons, the control group cannot be tested for longitudinal invariance and H2c is not confirmed. In the cross-sectional analysis, however, invariance between the two learning groups for the pretest and posttest was already established. Comparing the mean changes in both learning groups, the learning progression in the ISRL group is significantly higher at ϰ = .940 than in the CSRL group at ϰ = .684. The learning arrangement through ISRL for the application of 3D modeling with CAD is apparently most beneficial when the focus is exclusively on the technical activity. Based on this result, hypothesis H3d can only be retained to a limited extent. Since no invariance between the three groups in the cross-section could be observed for ξ2 (FEM) domain-specific competence in the posttest, a longitudinal test is unnecessary H2d, H2e, H2f and H3e are rejected.
Next, the dimension ξ3 of domain-specific competence (interpretation of an FEM) is examined for longitudinal invariance in the three treatment groups (cf. Figure 6). The configural model of the ISRL group (n = 65) shows very good model fit values (RMSEA = .040; CFI = .965; TLI = .959; WRMR = .846). With one exception, the factor loadings of all ten manifest variables at both measurement points are highly significant **(p ≤ 0.01). For group ξ31 (pretest), the ten loadings range from λ = .171** to λ = .928**. Group ξ32 (posttest) shows factor loadings represented from λ = .386 to λ = .905**. The model fit values remain very good in comparison with the more restrictive level of so-called strong invariance using the chi-square difference test (RMSEA = .043; CFI = .958; TLI = .953; WRMR = .886). The chi-square difference test is also not significant (p = 0.0646). The restrictions can be fully realized. For that reason, strong invariance can be assumed. The chi-square difference test is also not significant between the comparison of strong and strict invariance (p = 0.0617). However, a correlation between two indicators at both measurement points must be fixed. Consequently, only strict invariance is partially present between the two measurement points, which mean that hypothesis H2a is correct. The mean change is ϰ = .707, which shows strong learning progression through the ISRL learning arrangement and confirms hypothesis H3f.
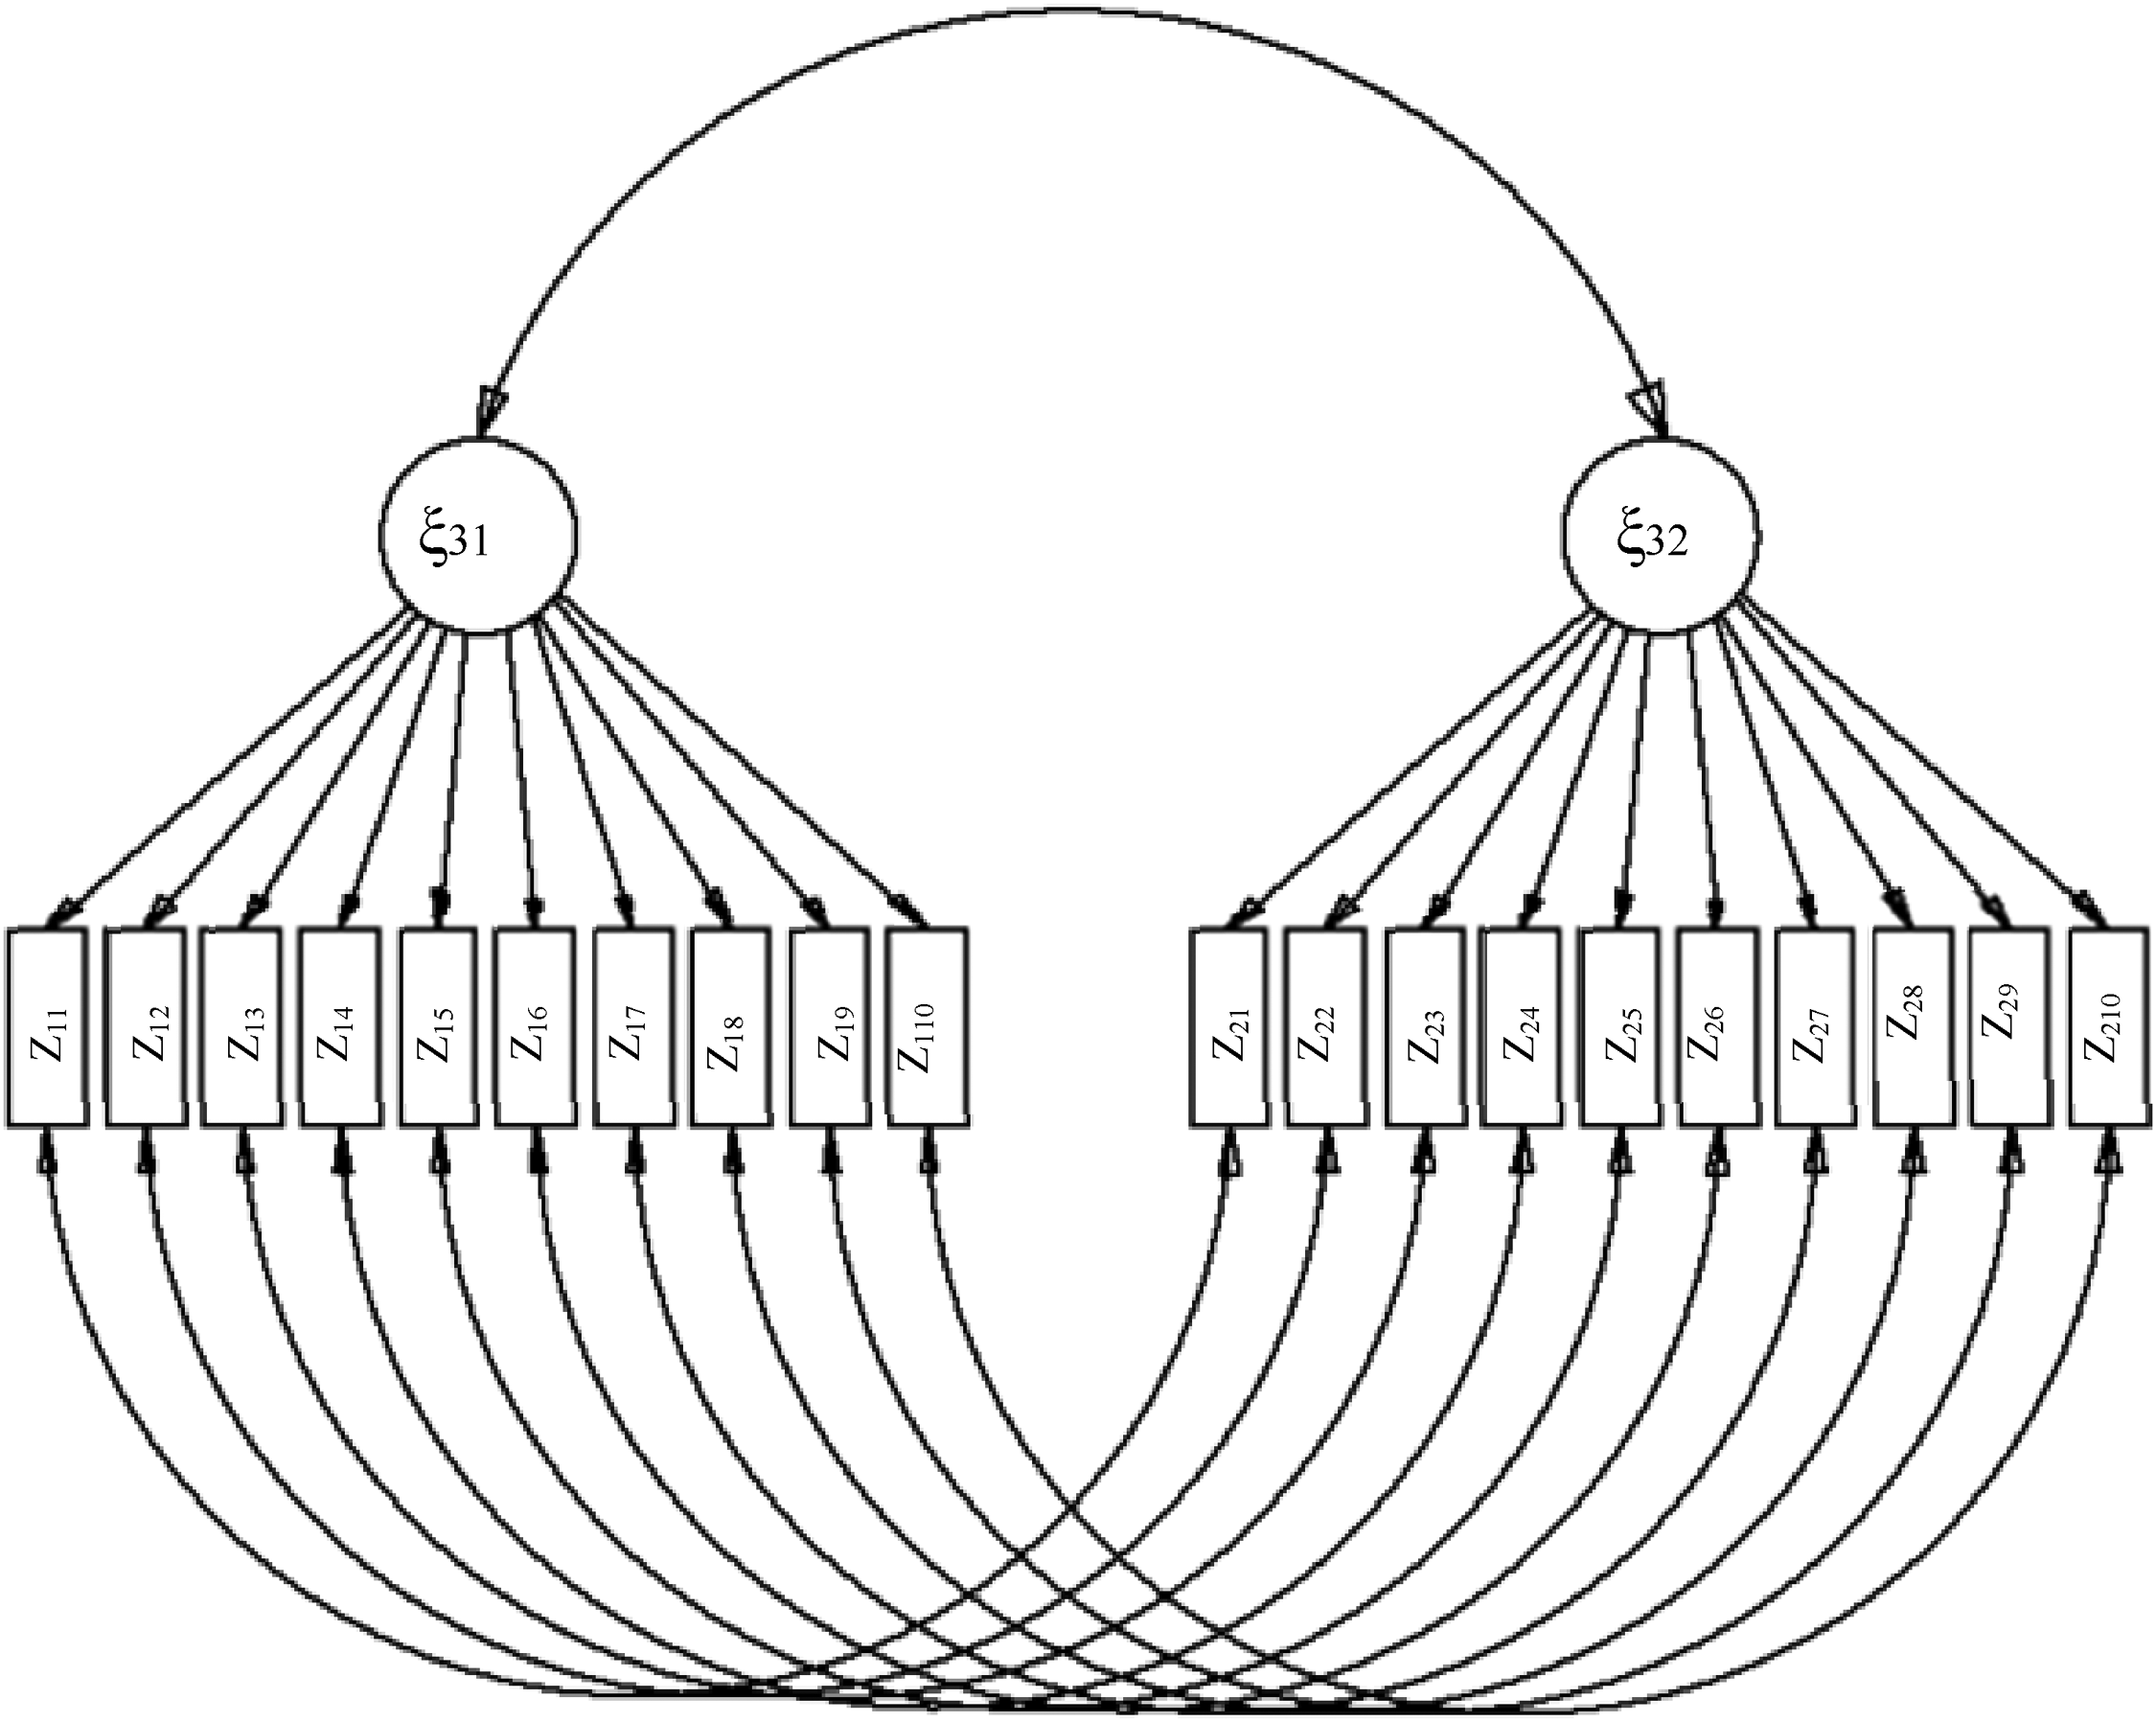
Longitudinal invariance test of the latent variable ξ3.
The configurational model of CSRL (n = 62) shows very good model fit values (RMSEA = .054; CFI = .954; TLI = .946; WRMR = .881). The factor loadings of all ten manifest variables at both measurement points are highly significant **(p ≤ 0.01). For the group ξ31 (pretest), the ten loadings range from λ = .599** to λ = .983**. The group ξ32 (posttest) shows factor loadings ranging from λ = .069 to λ = .915**. The model fit values remain very good in comparison with the more restrictive level of so-called strong invariance using the chi-square difference test (RMSEA = .052; CFI = .955; TLI = .949; WRMR = .901). The chi-square difference test is also not significant (p = 0.4377). However, the restrictions cannot be fully realized. Two correlations between two indicators at both measurement points must be omitted. Therefore, only partial strong invariance can be assumed. The chi-square difference test is also not significant between the comparison of strong and strict invariance (p = 0.0572). So, strict invariance is partially present between the two measurement points, which means that hypothesis H2b can be upheld. The mean change is ϰ = .974, indicating strong learning progression from the CSRL learning arrangement.
For the control group, overlapping covariances occur again during the estimation. As mentioned above, this could be related to the fact that the groups are too similar at the two measurement points. For this reason, the control group cannot be tested for longitudinal invariance. H2i is not retained. In the cross-sectional analysis, however, invariance between the two learning groups for the pretest and posttest was already established. Comparing the mean changes in both learning groups, the learning progression in the ISRL group is noticeably lower at ϰ = .707 than in the CSRL group at ϰ = .974. As theoretically assumed, the learning arrangement through CSRL is apparently most favorable for interpreting the FEM. Hypothesis H3f is confirmed.
We conclude that the entire family of hypotheses H1, with one exception (cf. H1e), can be maintained. This strongly suggests partial strict invariance across the three treatment groups in the pretest and posttest. Longitudinal invariance is partially tested for both learning arrangements across the dimensions. Thus, H2a, H2b, H2g, and H2h are not refuted and can be retained. Problems with longitudinal testing only arose in the dimension ξ2. This had already become apparent during the cross-sectional test between the treatment groups in the posttest. The control groups in all dimensions are apparently too similar between the pretest and posttest, which is why the invariance test must be longitudinal for the control group, even though invariance to the other groups was observed in the cross-section. The present invariance of the groups ξ1 and ξ3 in the cross-sectional and longitudinal sections, a difference in the mean value change can be attributed to the independent variable in the form of the previously completed learning arrangement (CSRL and ISRL). The observations of the mean changes in hypothesis family H3 confirm the learning progression through the learning arrangements compared to the control group. For dimension ξ3, CSRL has indeed proven to be the more effective learning environment. For dimension ξ1, however, the results indicate that ISRL was more effective. Consequently, hypotheses of family H3 can be largely confirmed, albeit with some reservations.
Discussion
One goal of the CADCoM2024+ study was to test the PPIK theory concerning the development of expertise in CAD and FEM among technicians in mechanical engineering. To this end, inferential statistical models are used that should also reveal the influence of positive emotions and vocational interest on competences. In order to compare the pretest and posttest, invariance tests of the three latent dimensions ξ1 (CAD), ξ2 (FEM) and ξ3 (FEM interpretation) of domain-specific competence (cf.27,28) were carried out in the present analysis. The invariance test was performed appropriately for categorical data in three stages: configural, strong, and strict invariance. 60 The test was conducted cross-sectionally for both the pretest and posttest as well as longitudinally across the two measurement points.
Cross-sectional results confirmed partial strict invariance across the three groups (ISRL, CSRL, and control group) for the pretest and posttest in two dimensions of domain-specific competence (ξ1 and ξ3). For dimension two ξ2, invariance was only found in the pretest. In this respect, with one exception, the complete hypothesis family H1 could be confirmed. Longitudinally, strict invariance was only partially found for the two learning arrangements ISRL and CSRL, in the dimensions CAD and FEM interpretation. Dimension two already revealed excessive estimation problems in the pretest, and for the control group, the difference between the two measurement points was too small, resulting in overlapping covariances. Nevertheless, invariance between the pretest and posttest can be observed for the most part, allowing comparisons between the two measurement points. Accordingly, the hypotheses of family H2 can be largely supported.
A further aim of the analysis was to determine learning progression. This was done by calculating the change in the mean value of the latent variables between the two measurement points using the hypotheses of family H3. As expected, clear learning progression was evident in both learning arrangements, which differed significantly from the control group. The FEM interpretation (ξ3), one off three dimensions of the competence structure, shows significant advantages in favor of the CSRL arrangement. These results were to be expected due to the small groups of three students, which avoided the bystander effect, 71 and the usual CL structure. The students were able to support each other, as the interpretation of FEM cannot be done by trial and error. It requires the relevant declarative knowledge to be able to interpret stresses and deformations.
Surprisingly, better learning effects in favor of ISRL were found in the use of CAD (ξ1). This was surprising because we expected that when three students support each other in their learning, the competences of everyone improve more than if they were to learn on their own; especially, given students in the present study had shown that they were clearly capable of working together, as demonstrated in the FEM interpretation. This may be due to the different activities involved. 3D modeling in CAD (ξ1) may be adequately explained via video vignettes. Students could watch the videos as often as they like and do not necessarily require cooperation or external instruction. As a result, basic element one (positive dependence) of CSRL was possibly not sufficiently present due to the activity of 3D modeling with CAD.43,47,72 The situation is apparently different for FEM interpretation (ξ3). Here, questions of understanding are increasingly important for clarifying facts in the context of strength calculations. It follows that a team is apparently helpful. In a team, different solutions and insights for overcoming barriers 73 to the existing problem can be debated and weighed up. An in-depth examination of the subject matter initially leads to different ideas, which also depend on individual previous experience. An additional explanation for these different results could also be related to the activity. Operating 3D modeling software could possibly be classified as biologically primary. 74 Geary 74 differentiates knowledge and competences into two categories that should also be considered during learning. Biologically primary is a category whose learnability is part of our human disposition. Recognizing language and faces are examples of this. Humans do not necessarily have to go to school to learn to speak. This happens automatically in the family environment through social contact. From an evolutionary point of view, humans should be able to speak. Many such complex knowledge applications and knowledge are learned intuitively and automatically by humans. These competences are part of human nature. The other category is what Geary calls biologically secondary. This includes competences and knowledge not part of the basic human inventory and must be laboriously learned using working memory with limited resources. Examples of this are reading, writing, and arithmetic. 74
The icons can be operated relatively easily through natural learning, such as imitation and repetition. Although the 3D software can certainly be considered highly domain-specific, learning by doing is very much in line with our human nature. The interpretation of a strength calculation, on the other hand, requires a deeper and more comprehensive understanding of numerous interrelated domain-specific variables. Accordingly, this could be classified as biologically secondary according to Geary. 74
A third possible explanation lies in the sample size (n = 175). The results may become more reliable and valid in the future with a larger sample size. Whether ISRL actually shows better results for 3D modeling could be tested with a larger number of participants.
Moreover, CSRL can be considered a useful strategy for generating missing links between the variables necessary for overcoming barriers. 73 CSRL could also take place with the teacher and provide helpful, targeted instructions for developing adequate competences. However, this is only possible if the autopoietic system of students 75 is able to use instructions and feedback from the teacher's environment for its own purposes. In order to find constructive solutions collectively, competitions within the group should be avoided (cf. 20 ). This should also systematically promote the alignment of target and actual values from the individual's internal and external cybernetic control loop model (cf. 29 ).
As a result of a lower discrepancy between the target and actual values of both control loops, the ability to connect with the environment is greater, which makes it more likely that joint problem solutions will be found within the group. In general, both learning arrangements, ISRL and CSRL, showed strong learning progression. There may be activities or actions that are more suitable than others for ISRL, even with a focus on digital learning environments. Whether individual self-regulated learning (ISRL) or cooperative self-regulated learning (CSRL) is chosen as a strategy depends on a variety of other factors (such as interest, previous experience, social environment). Based on this analysis, both learning strategies are recommended. In a networked world, cooperation and the necessary competences play a decisive role. Cooperative behavior should therefore be learned and practiced. As a result, learning coaches, teachers, and professors can use the findings from this analysis to design cooperative learning arrangements, preferably in a setting comparable to the study. The results of the analysis are consistent with numerous studies (e.g.,76,77). To further clarify the effectiveness of both learning arrangements, a similar analysis could be conducted with the three knowledge dimensions relevant to domain-specific competence (CAD, FEM, and FEM interpretation).
CL does not necessarily lead to better learning outcomes, as one might intuitively assume. Both learning arrangements showed clear learning progression, which provides solid support for their use in the classroom based on this study. Of course, teachers can also use cooperative learning in the field of CAD. However, the present analysis refutes the assumption that cooperation inevitably leads to better individual learning outcomes than individual learning. Another reason for using cooperative learning when teaching CAD could be, for example, to promote cooperative behavior, which is also increasingly required in professional contexts.
Looking at both competence dimensions (ξ1 and ξ3), a number of differences can be identified. In 3D modeling, students can try out whatever they want. They use the icons and the deliberately user-friendly interface. Actions can be supported visually with video vignettes. These parameters are missing when it comes to interpreting a strength calculation (FEM). This is why the positive interdependence is greater here and students can all benefit from supporting each other. This would also be a guideline when it comes to decisions about the learning arrangement in other subjects. Another aspect that should be taken into account is the distinction between biologically primary and biologically secondary competences. Since students achieved better results through individual learning in the CAD dimension than through cooperative forms of learning, this could be a further indication that CAD tends to fall into the category of biologically primary competences. 74 If students are able to teach themselves 3D modeling through their innate aptitude, cooperation in this context is not necessary.
Based on the above explanations, learning CAD competences appears to be particularly well suited to an online course. This learning project clearly corresponds to the natural abilities of the students (biologically primary). They have the opportunity to test 3D models directly in the program, where the user interface impresses with its intuitively designed icons. In addition, short video sequences provide helpful support during the learning process. Indeed, further studies are required to examine broader implications for teaching and training in engineering contexts, such as blended or hybrid models.
An important finding from this original study was that both individual and cooperative self-regulated learning are recommended as learning strategies: students made strong progress in competency development in both learning forms. If cooperative behavior is to be pursued as the goal of the teaching unit, the use of CL (CSRL) can be justified on the basis of the present analysis. The intuitive argument that CL fundamentally leads to better learning outcomes than individual learning (ISRL), on the other hand, could be refuted by the analysis.
Whether individual self-regulated learning or cooperative self-regulated learning is chosen as a pedagogical strategy for fostering workplace competences may depend on a variety of factors (such as interest, previous experience, social environment, and nature of the task). Further studies, including studies with larger sample sizes, are required to unpick this complexity and to confirm which factors might influence the pedagogical choice between individual and cooperative self-regulated learning strategies for competency development. Accordingly, learning educators at universities, colleges, schools, or in the workplace require flexibility and considerable scope for action: which is a key consideration for educators and policymakers.
Footnotes
Funding
The authors received no financial support for the research, authorship, and/or publication of this article.
Declaration of conflicting interests
The authors declared no potential conflicts of interest with respect to the research, authorship, and/or publication of this article.
Data availability statement
The datasets generated during and/or analyzed during the current study are available from the corresponding author on reasonable request.