
Abstract
This study presents a novel approach to enhance the educational utility of small-scale wind tunnels through low-cost instrumentation and automation. A legacy Plint TE80 vertical smoke tunnel was repurposed using consumer-grade components to enable automated measurement of aerodynamic properties. Two experimental methodologies were implemented to calculate drag coefficients: the Wake Momentum Deficit Principle and the Surface Pressure Distribution Method, using a NACA0012 airfoil and a cylindrical model. The system achieved drag coefficient measurements within 2% of literature values, demonstrating its viability for educational use. Beyond technical validation, the project addresses broader educational challenges: limited access to high-cost aerodynamic facilities, especially in low-resource settings. By demonstrating that legacy equipment can be modernised affordably (less than 200 GBP) and effectively, this work supports the integration of hands-on experimentation into engineering curricula. This case study underscores the potential of accessible instrumentation to enrich fluid dynamics education and foster deeper student engagement with experimental methods.
Introduction
Wind Tunnels have been at the forefront of fluid dynamics research and development since their inception in 1872 by Francis Herbert Wenham, 1 they have proven their utility in a variety of fields including aerospace, ecological, civil, biological, nautical and many more; even the Wright brothers performed extensive wind tunnel testing as part of their successful manned flight in 1903. 2 A wind tunnel is device that produces a controlled stream of air to study the effects of movement through air on different bodies. It is now common practice for aerodynamics development to combine theoretical, analytical, experimental and computational methods working together to overcome shortcomings of each of the methods individually; however, access to experimental fluid dynamics apparatus such as wind tunnels is restricted by the high initial and running costs of such machinery as well as the facility required to support it.3–5 Wind Tunnels have often been at the forefront of fluid dynamics progress and continue to do so in modern developments such as wind turbine advancements and infrastructure testing. 6 Innovations in computer technology in recent years have allowed for computational fluid dynamics to become a powerful tool in design and development; however, due to the assumptions and simplifications made during turbulence modelling, experimental results from wind tunnels are often needed to verify results gained; meaning that the need for such apparatus has been sustained despite these developments. 7
Prior contributions in literature have largely advanced educational wind-tunnel practice along two tracks: low-cost qualitative visualisation in subsonic teaching tunnels8–10 and the design of specialised facilities. On the qualitative side, Trinder and Jabbal designed a safe, inexpensive smoke-rake system for a vertical tunnel to support classroom demonstrations, while Kubesh and Allie described an economical open-circuit tunnel for instrument calibration (∼0.5–20 m s−1) and reported strong student engagement; more recently, Vieira and Farias presented a simple open-type tunnel and compared photographed streamlines with CFD but without force measurement capability. At the specialised end, Bruckman and Traub 11 reported a compact continuous indraught supersonic tunnel (M≈1.96) fabricated via rapid prototyping for quiet, extended-run instruction. In contrast, the work presented in this manuscript targets the gap between these strands by retrofitting a legacy smoke tunnel with low-cost instrumentation and computer numerical controlled (CNC) automation to deliver validated, quantitative aerodynamic data, hence moving beyond purely visual studies while avoiding the expense and bespoke fabrication of new facilities.
Wind tunnels are broadly classified into two main categories based on airflow circulation: open-circuit and closed-circuit systems. Open-circuit tunnels draw air from the environment and exhaust it after passing through the test section, making them simpler and more cost-effective but prone to environmental noise and flow instability. Closed-circuit tunnels, by contrast, recirculate air within a sealed loop, offering superior flow quality and energy efficiency at the expense of increased complexity and cost. 12
Test sections within these tunnels can be either open or closed, depending on the boundary conditions around the model. Closed test sections generally provide better flow uniformity, especially when their width is under 3 meters, while open sections offer easier access and flexibility but are more susceptible to flow fluctuations. Although these configurations are standard, modern applications have introduced variations such as open-bottom portable tunnels for environmental studies 13 and cryogenic tunnels for high-speed aerodynamics. 14
Effective wind tunnel operation relies on a series of carefully designed components that ensure flow uniformity, measurement accuracy, and minimal turbulence. Flow conditioners such as meshes, honeycomb structures, and screens, are typically installed at the inlet and outlet or around the settling chamber to reduce turbulence and align the flow parallel to the tunnel walls. These devices help achieve a uniform velocity profile across the test section, though they introduce a pressure drop due to frictional effects. 15
The contraction section, often referred to as a nozzle, accelerates the flow by reducing the cross-sectional area between the settling chamber and the test section. While not always conical in shape, this geometry is critical for maintaining smooth, laminar flow. Optimisation of contraction profiles using computational tools such as ANSYS Fluent has become standard practice to minimise corner effects and enhance flow uniformity. 16
The test section itself serves as the primary measurement zone and must balance accessibility with aerodynamic integrity. Rectangular cross-sections are common for ease of instrumentation, though they can introduce corner-induced flow disturbances. Circular sections offer better flow symmetry but complicate apparatus mounting. Blockage effects, where test models alter local flow velocity, must be accounted for using correction factors such as those proposed by Katz, Plotkin and Glauert, especially when model thickness exceeds 5–10% of the tunnel height.15,17,18 In addition to thickness-based guideline (e.g., avoiding models whose maximum thickness exceeds 5–10% of the test-section height), blockage can also be expressed via the frontal-area ratio, i.e., the model's projected frontal area divided by the test-section area. Standard references recommend keeping this frontal-area blockage below 10% to minimise wall interference and streamline curvature effects in closed test sections.10,12,19,20
Finally, the diffuser cone and fan section transition the flow from the test section to the exhaust, mitigating upstream turbulence generated by the fan. The diffuser's geometry, often shifting from rectangular to circular, plays a vital role in preserving flow quality and structural integrity. Across all components, the design must balance aerodynamic performance with energy efficiency and cost, particularly in educational or low-resource contexts where compromises are often necessary. 21
This paper will endeavour to explore the limitations of small-scale wind tunnels and their uses in educational, and practical applications; a Plint Model TE80 smoke tunnel is adapted to allow for pressure readings to be taken of the flow in the wake of a model to capture the pressure distribution; similarly, a cylindrical test model is created to explore the pressure distribution along the surface of a cylinder inserted into the flow. Finally, the results from this testing will be compared to existing experimental data as well as analytical expectations, and finally, the feasibility of the utility of such a wind tunnel will be discussed.
The primary motivation is to widen access to hands-on aerodynamics equipments by retrofitting a legacy smoke tunnel with low-cost sensors and simple automation, enabling repeatable laboratory exercises that fit typical teaching constraints and budgets. The secondary motivation of the present work is to show that, under these constraints, basic quantitative measurements, such as wake-momentum drag on a NACA0012 profile and surface-pressure integration on a cylinder, are feasible and instructionally reliable when uncertainties are reported and discussed. It is important to note that this work does not seek to match the accuracy or flow quality of dedicated research facilities, and our results should be interpreted as validated, classroom-ready exemplars rather than benchmark datasets.
Access to subsonic aerodynamic facilities
Research into subsonic aerodynamic facilities worldwide shows that there is a clear disparity between access to wind tunnels in Low-Middle Income Countries (LMIC's) and other countries. Combining this definition, data from the International Monetary Fund and data from various subsonic testing facility organisations such as SATA (Subsonic Aerodynamic Testing Association) and STAI (Supersonic Tunnel Association, International), inferences can be made about the distribution of wind tunnel facilities in LMIC's and High Income Countries (HIC's). 22
Figures 1 and 2 clearly show that there is a correlation between a countries Gross Purchasing Power per capita and the access to wind tunnel facilities in this country. The data in Figures 1 and 2 shows in the countries categorised as LMIC, there is only one country that has members in the testing associations: India. There are seventy-seven LMIC's, which makes up 39% of countries worldwide, that do not have access to these facilities according to this research. However, it must be considered that the lists provided by these organisations are not all-inclusive of all wind tunnel facilities, only the members of each organisation; this means that there are many wind tunnels that are not listed in this dataset such as demonstration wind tunnels at universities. This data can still be used to gain a general perspective of the availability of access to such facilities in each country; in addition to this, an investigation into the specific model used in this project was undertaken. This revealed two documents that describe the smoke tunnel, unfortunately the company fell into dissolution in 2008 so other information is limited. The first result is a report from a machine recycling service which describe the wind tunnel briefly but were unable to operate it, the second result features a datasheet from the Plint & Partners Engineers as part of an academic aid project sending a TE80 Smoke Tunnel to Ecuador in 1976. The datasheet not only provides useful information about the specifications and dimensions of the Wind Tunnel, but also it helps demonstrate that such wind tunnels can be used in missions to improve access to subsonic facilities and modernising this equipment would improve this all the more.
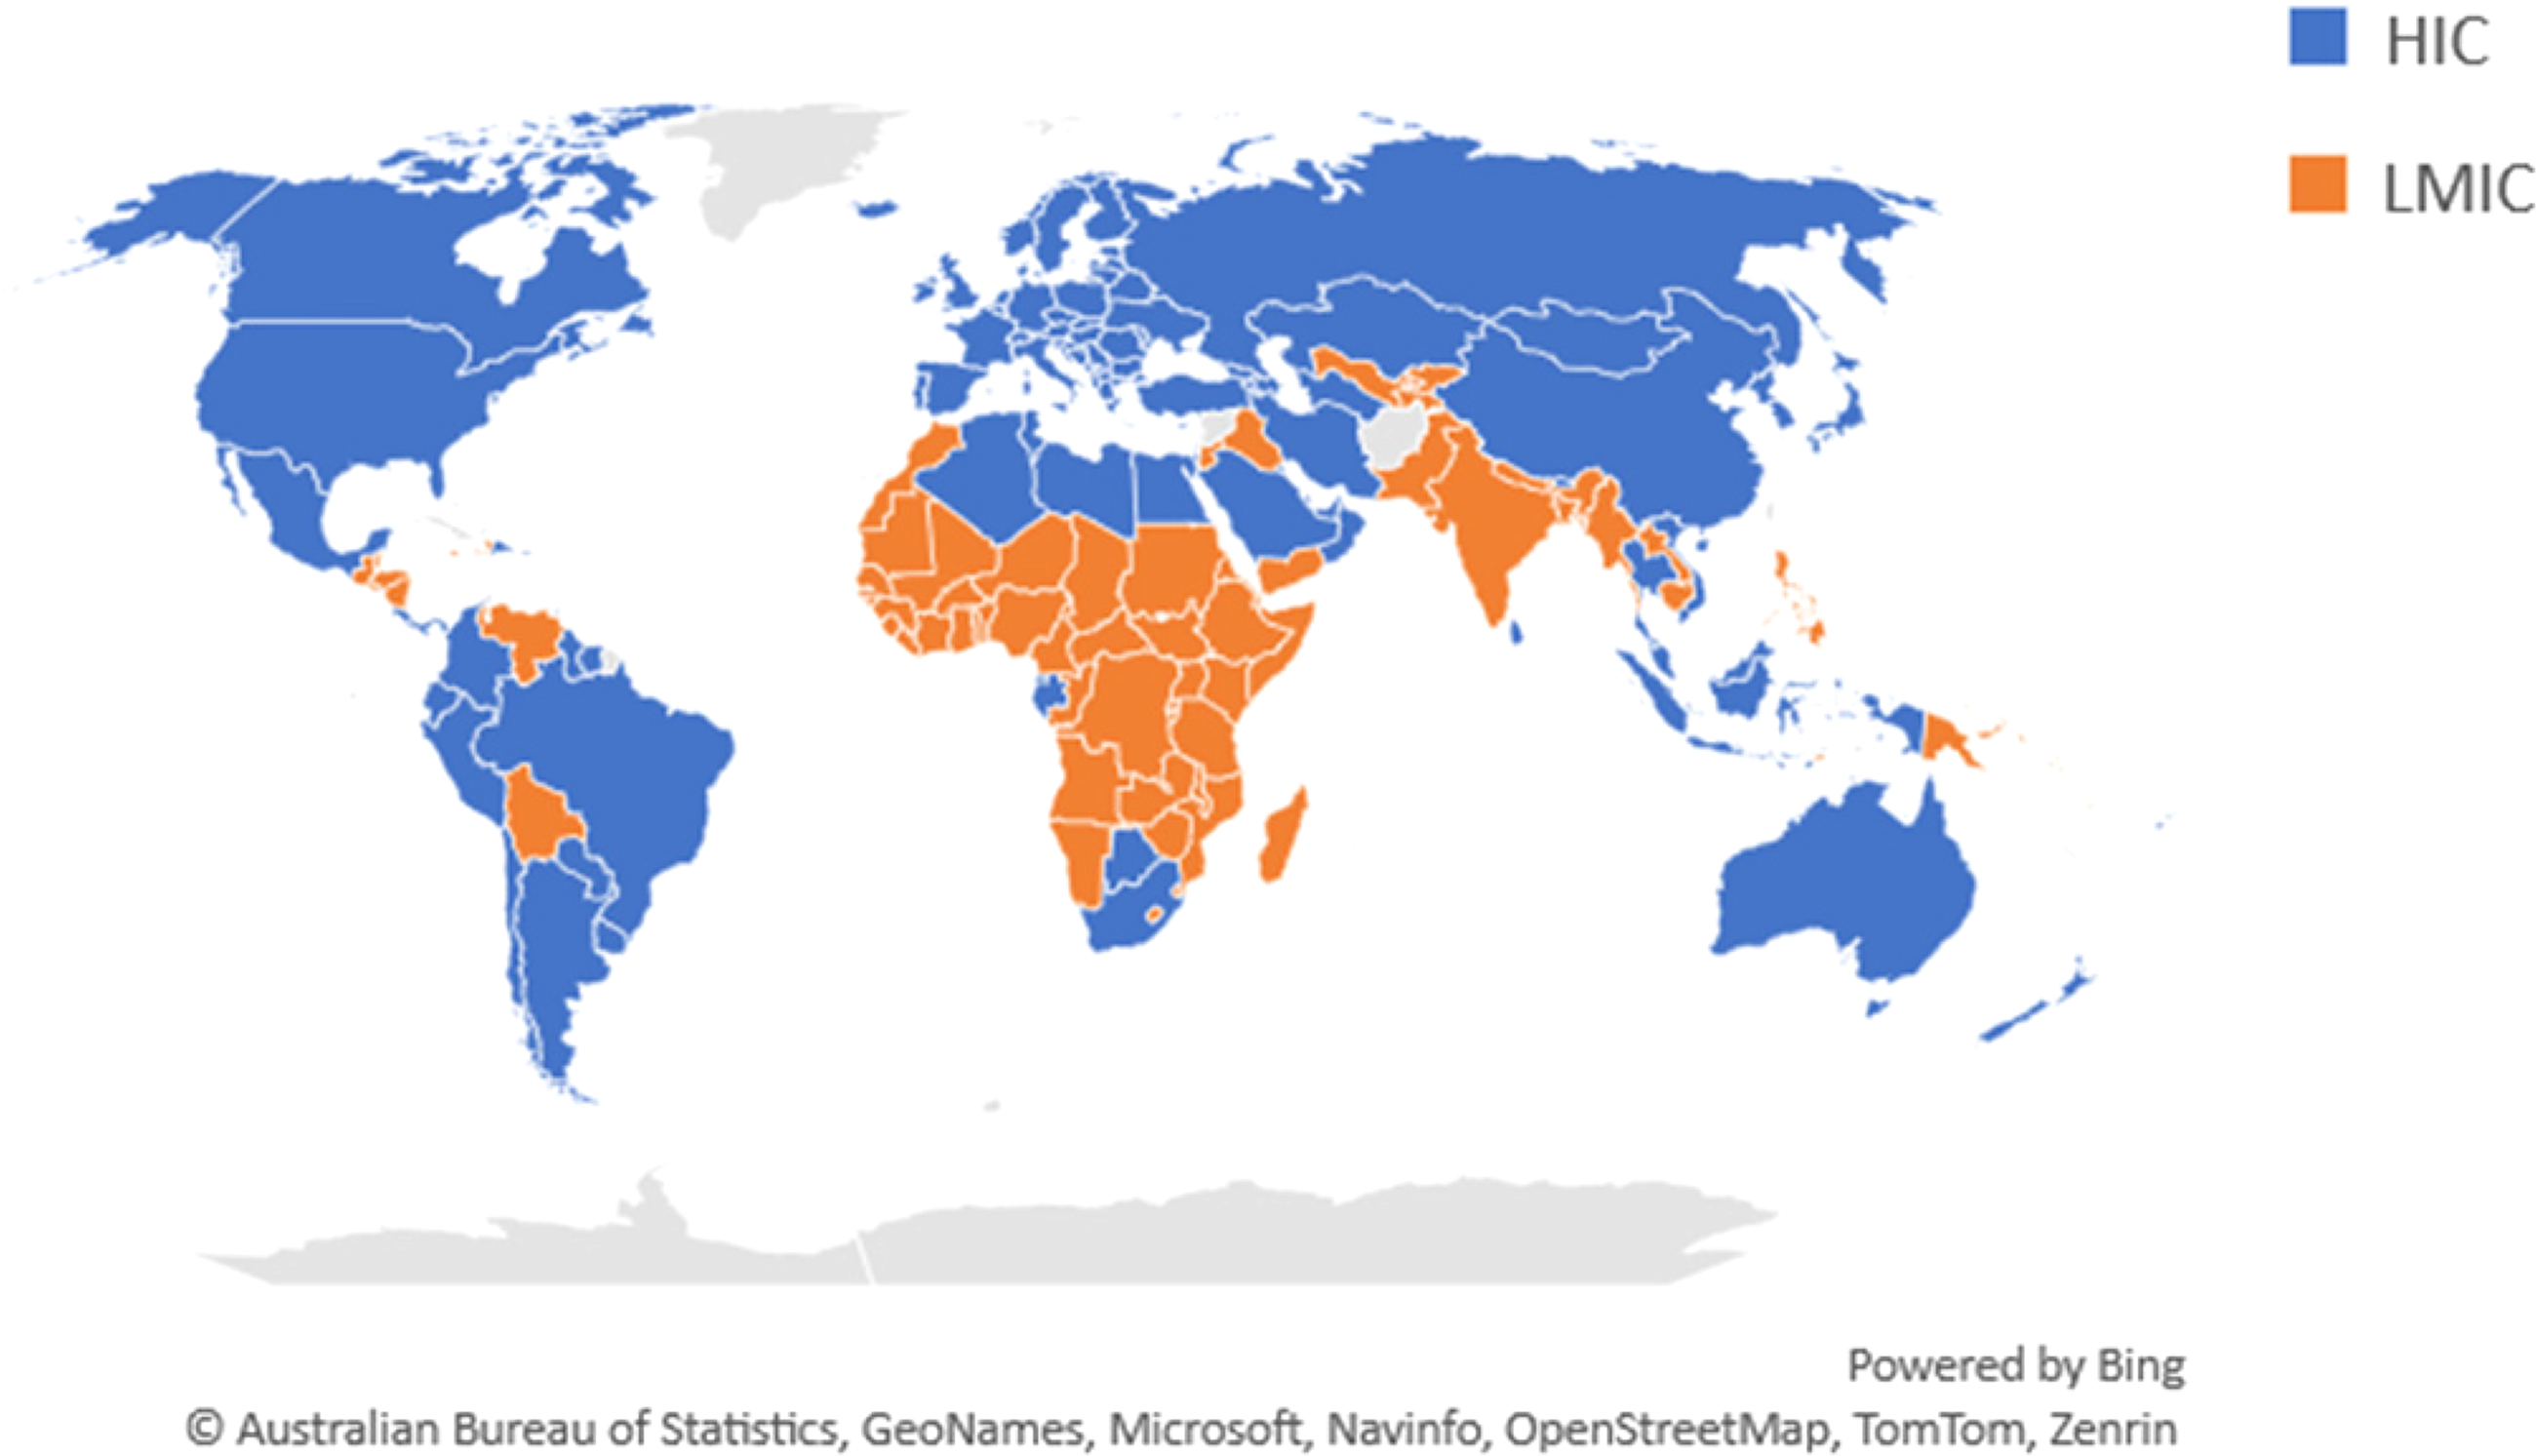
Map distribution of high income countries & low-middle income countries (World Economic Outlook Database: April 2023).
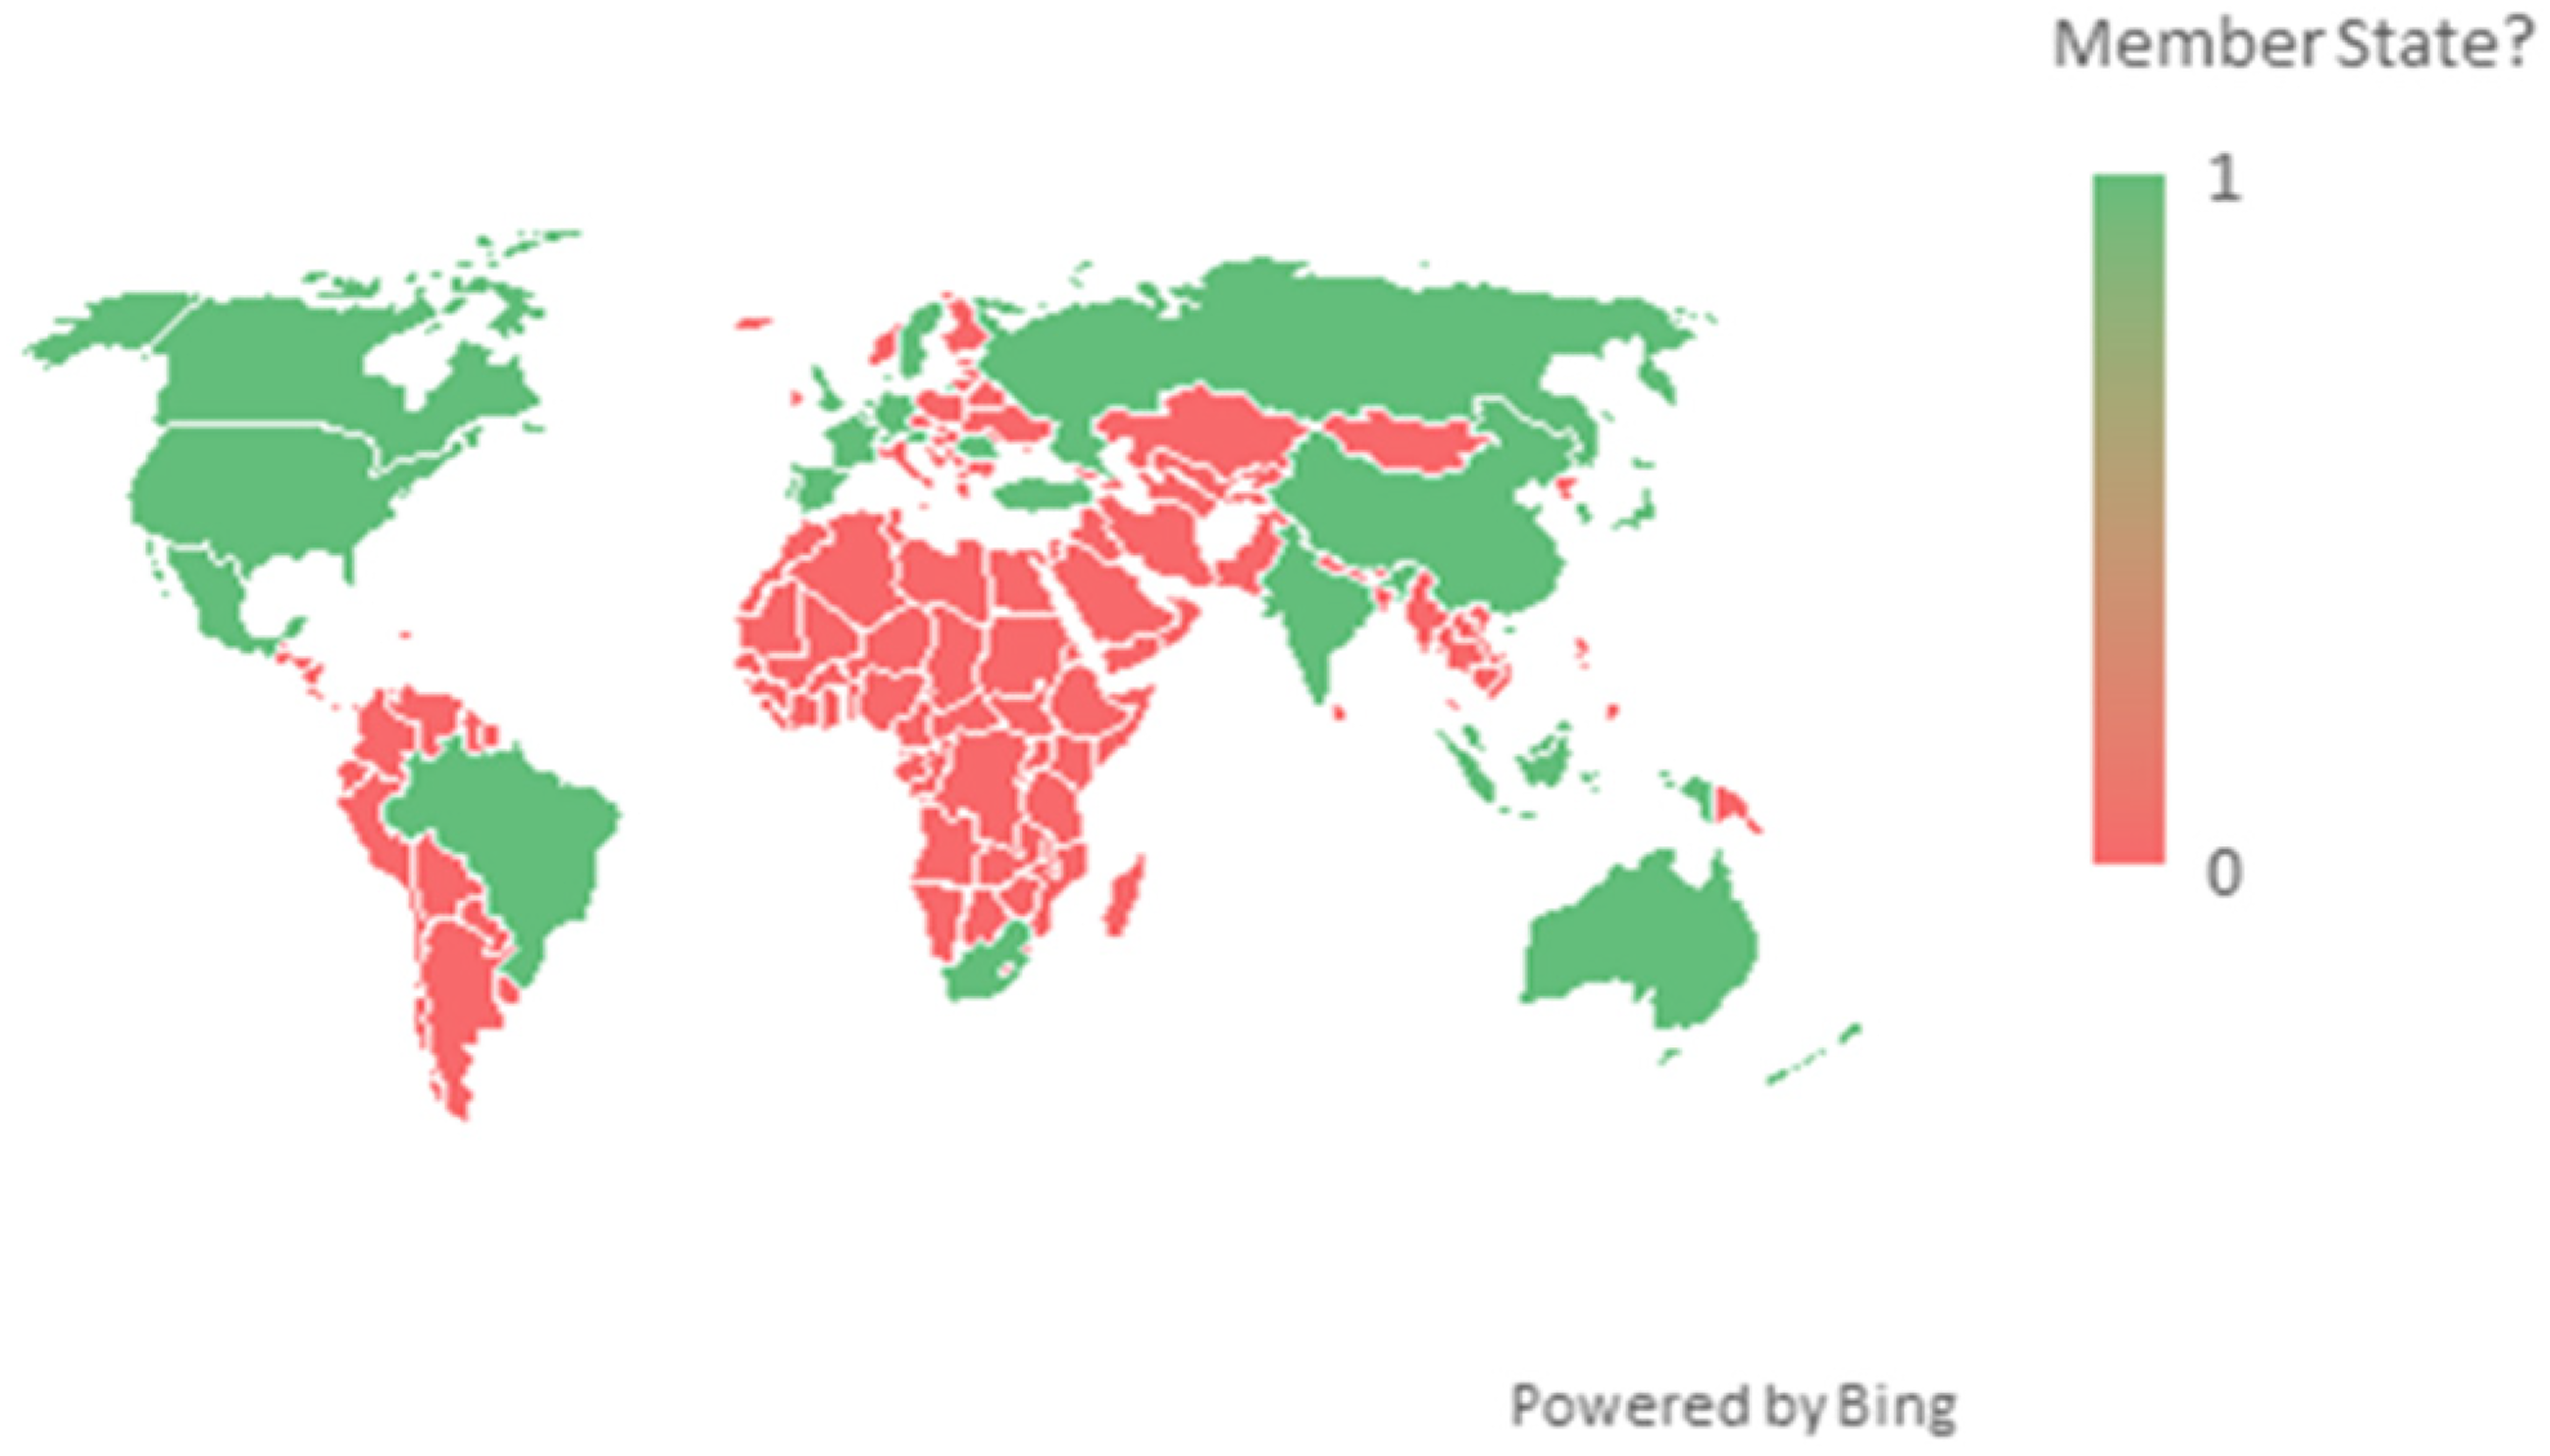
Distribution map of countries with an organisation member in SATA or STAI. 23
Methodology
The main apparatus used in experimentation will be the Plint TE80 Smoke Tunnel (Figure 3), it is a demonstration smoke tunnel designed for purely smoke visualisation. This has been in storage and has been unused for a number of years before it was sourced for this project, meaning that modernising this equipment could drastically increase its utility with little capital investment. The tunnel structure is comprised of sheet metal and a tubular steel trolley; allowing it to be easily moved. Air is drawn in from the bottom of the tunnel through a muslin sheet and steel mesh through a contraction cone and into the test section measuring 180 mm wide × 250 mm high × 100 mm deep with a Perspex front which can be removed to manipulate the model in the test section. The models are mounted to the tunnel using an M5 threaded bar which screws into a knurled nut at the back of the test section, models are mounted flush to the surface to seal the mounting hole; models and smoke are lit using two 100 W bulbs located on either side of the test section. Air is drawn through the tunnel using a 120 V motor which is fitted at the top of the tunnel. The trolley is fitted with a steel cabinet which houses the smoke generator components, the smoke generator uses kerosene to produce the smoke trails in the test section, introduced using a smoke comb with 23 ports to allow the smoke to flow through the test section and across the test model. The datasheet for the wind tunnel claims that this can be operated “in a small room with all windows closed for periods of twenty minutes or more before the concentration of vapour becomes objectionable”, however, with modern health and safety standards in place an extraction system is necessary to remove the smoke once it has passed through the wind tunnel. The wind tunnel is controlled via a control panel on the steel trolley, with power switches for the fan and lights as well as a voltage regulator for controlling the fan speed, this subsequently means the airspeed in the test section can be adjusted between 0 and ±3 m/s according to the datasheet. Manual post-processing techniques were used to enhance the smoke visualisation trails whilst masking unwanted features (Figure 4).
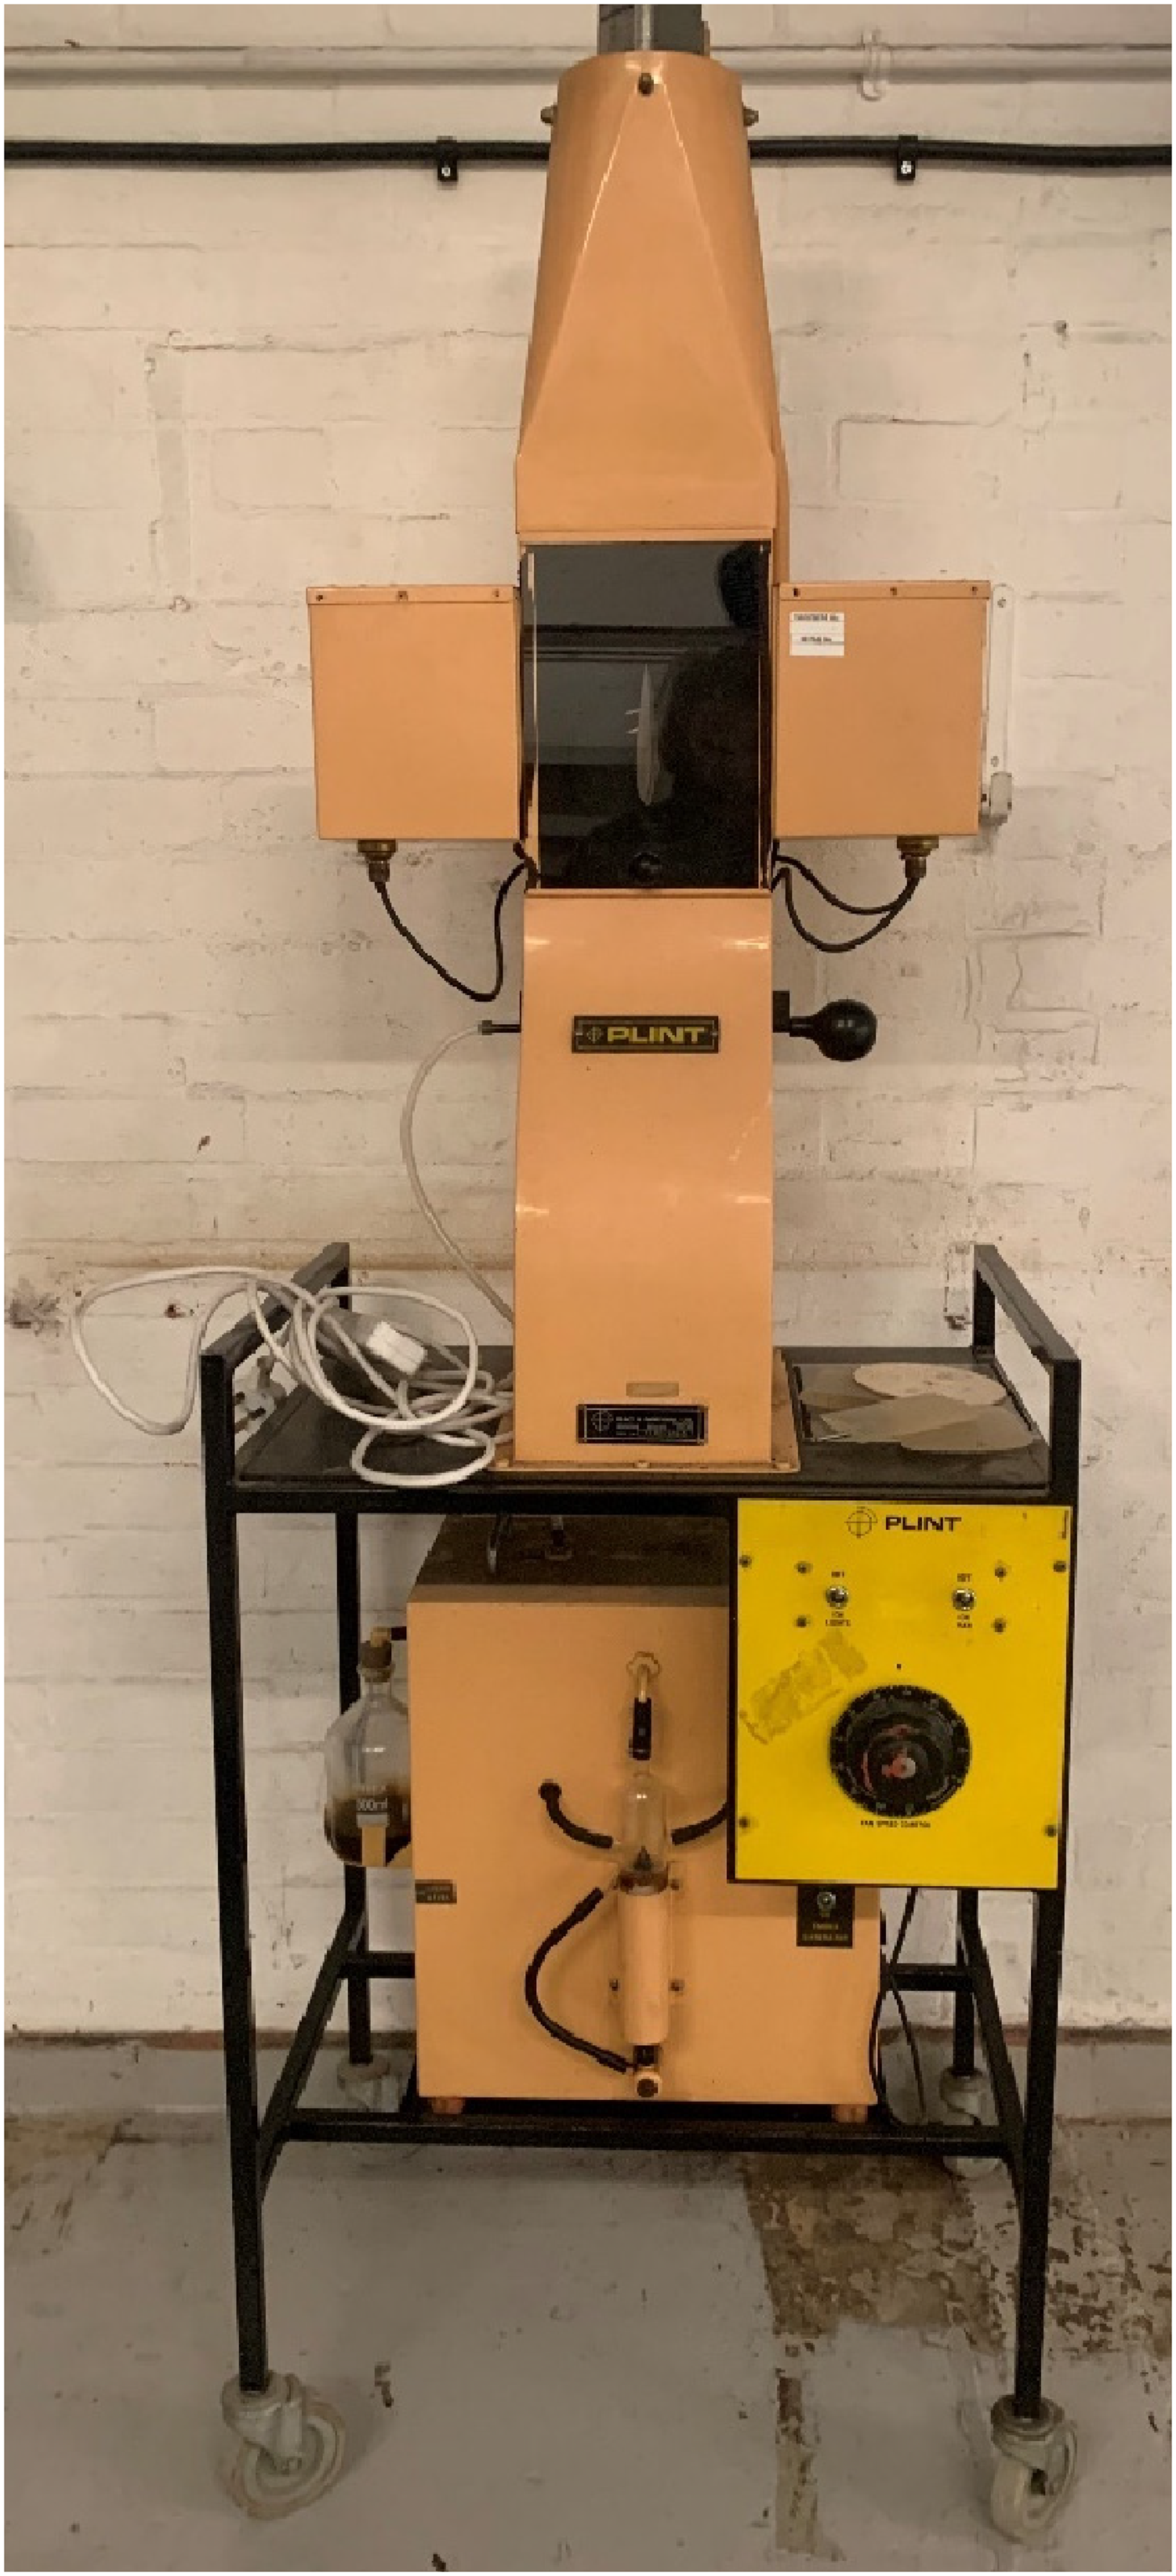
Plint TE80 wind tunnel used in this project.
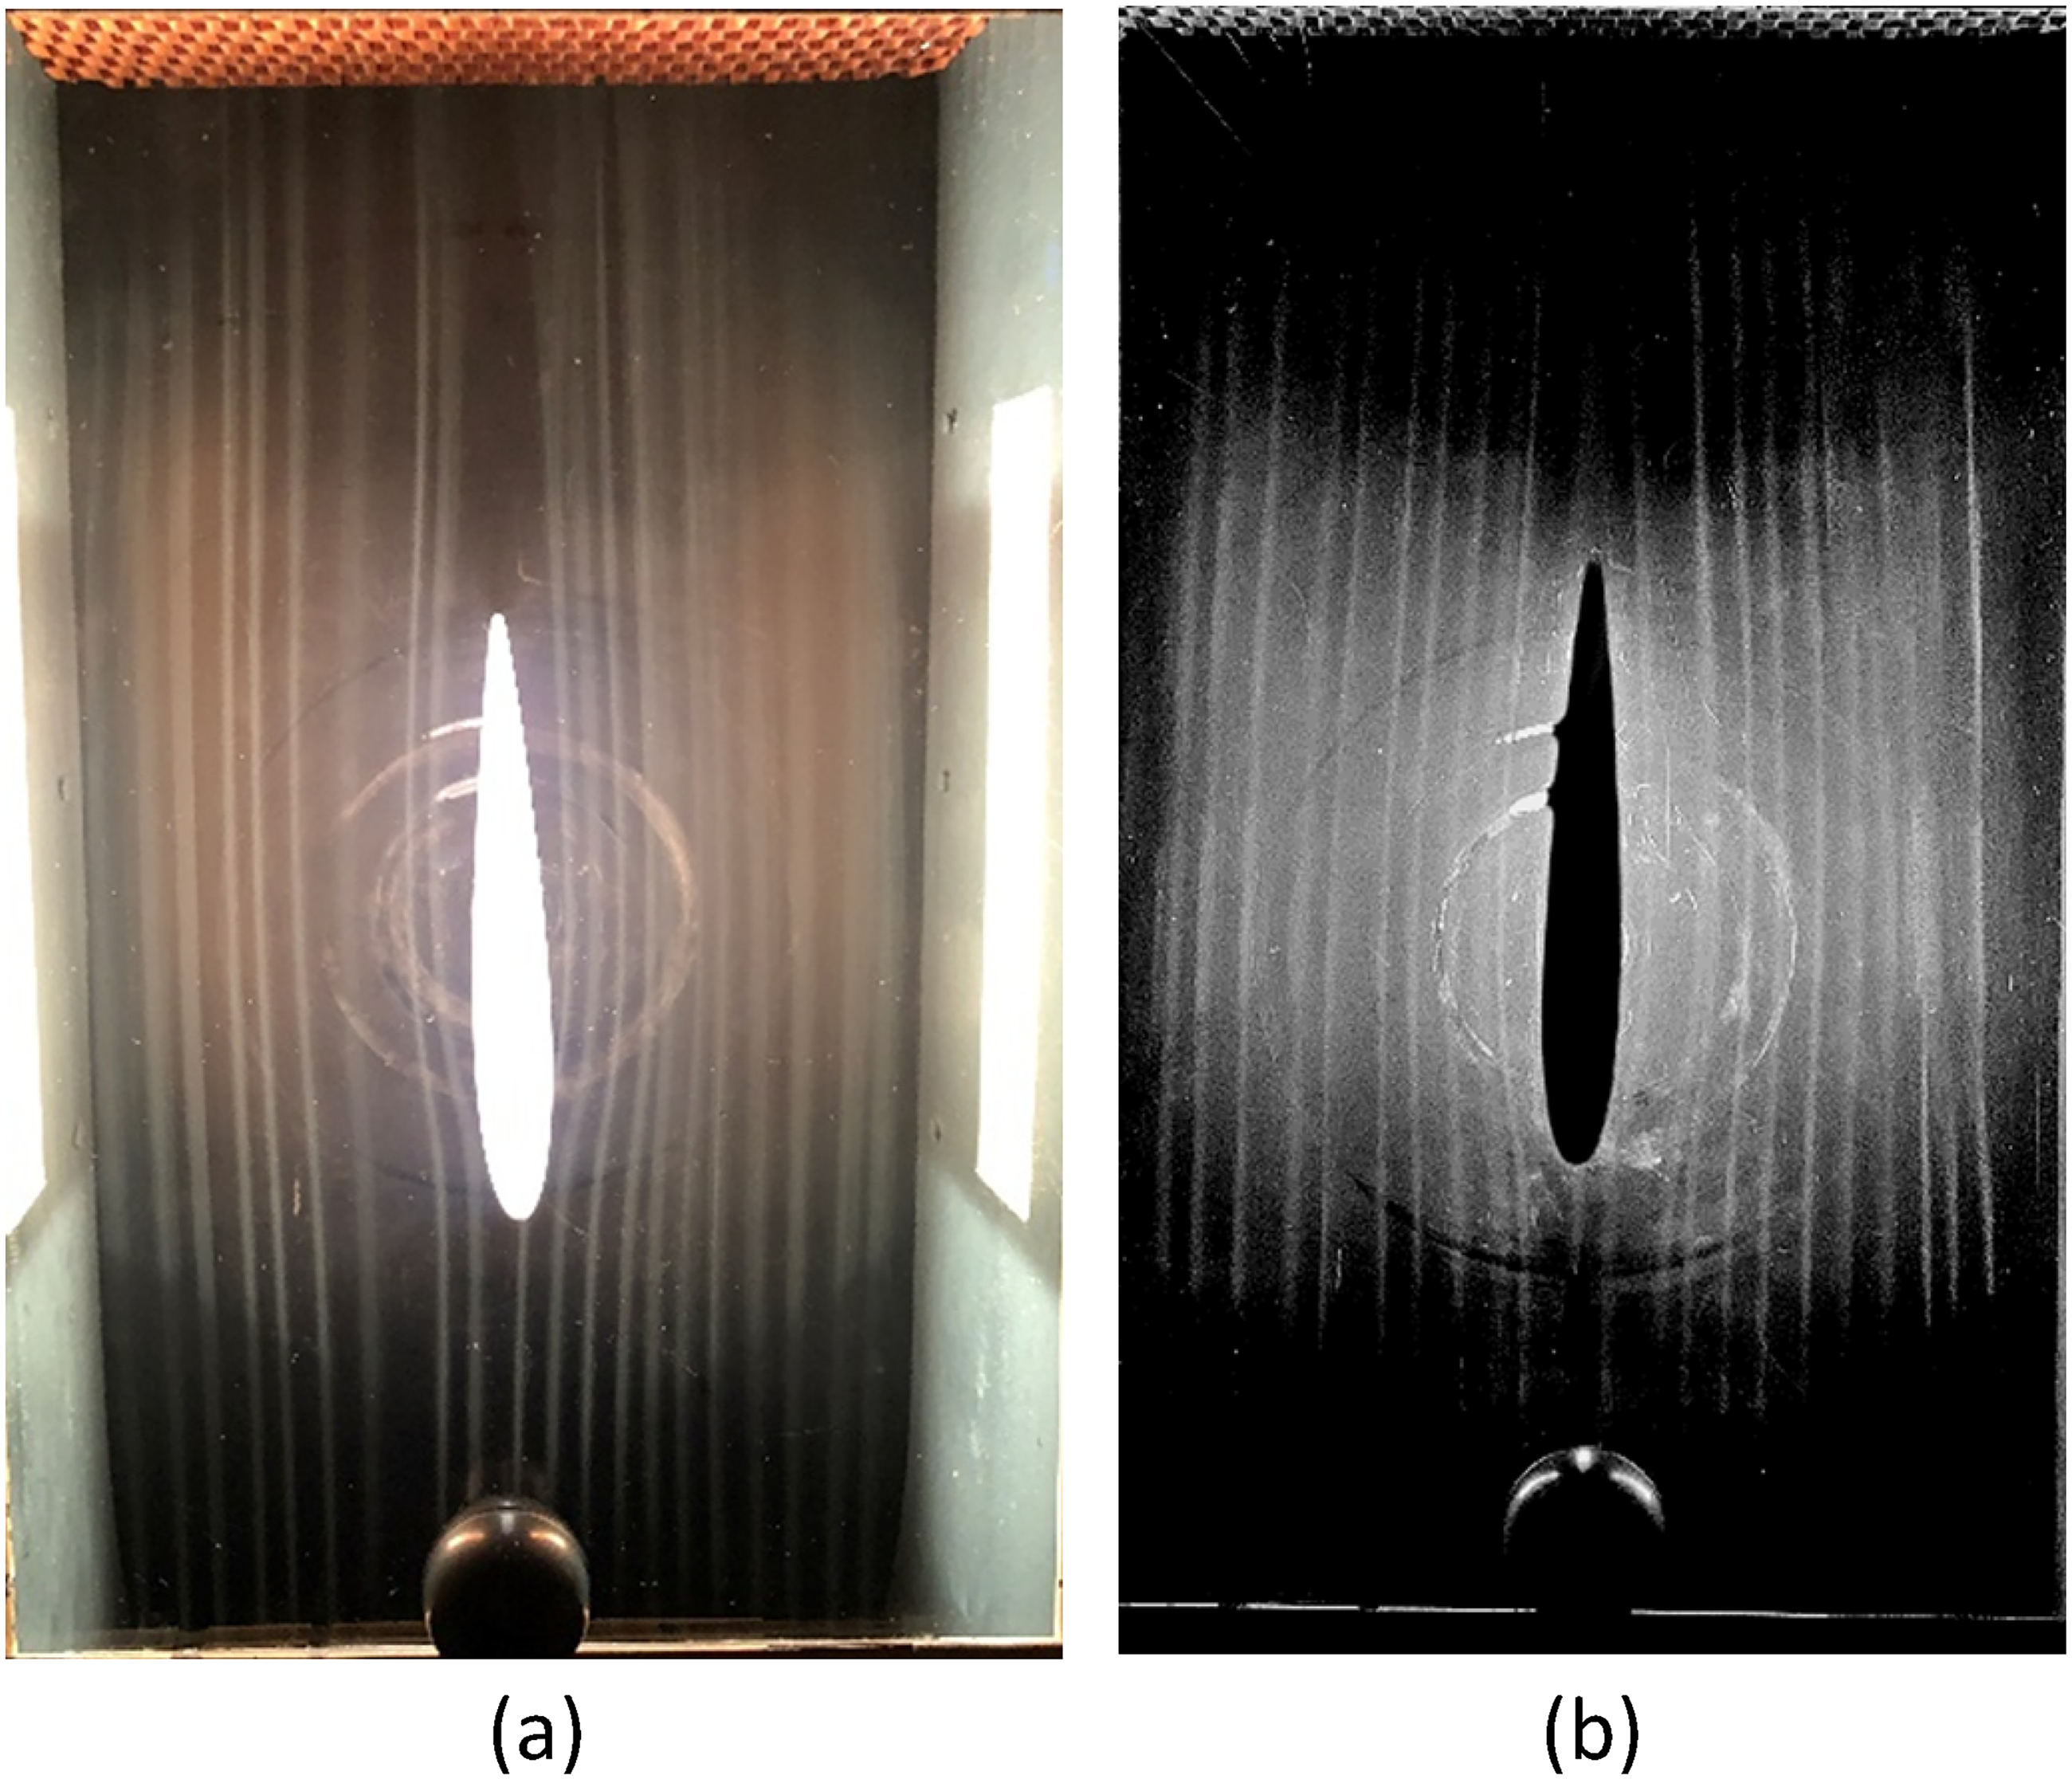
Example of (a) smoke visualisation [NACA0012 airfoil pictured] no post processing, and b) with post processing.
The pressure transducer used in this project is a differential pressure transducer from Evolution Measurement, P8-D, which is marketed as a high accuracy pressure device with a small package to allow for a variety of applications. However, similar analysis can be performed with cheaper alternatives that are less than 200 GBP. The transducer outputs the difference in pressure between each of the 8 pressure input ports and the reference port, typically used in the automotive industry due to its high resilience to noise and packet loss. The accuracy of the pressure transducer is listed as ±0.15% of the full scale range (in the case of the model used in this project that is ±100 mbar) which corresponds to an accuracy of ±0.3 mbar. The resolution of the device is 0.003 mbar which means it is able to detect the dynamic pressure of air at atmospheric conditions to a resolution of 0.7 m/s, however, time averaged results could be used to estimate values within this resolution as it was found that the data across time follows a normal distribution and hence provides a meaningful result from time averaged data.
A wake survey rake works in a comparable manner to a pitot-static tube, with the absence of the static pressure holes on the head of the tube; instead an array of 18 total pressure holes is presented opposing the flow direction in order to capture the distribution over an area. This is particularly useful as this means that the 8 channels of the P8-D device could then be connected to 8 of these total pressure tubes and the reference port attached to a wall tap static port; the dynamic pressure would be directly outputted by the pressure transducer device.
A pitot tube measures the total (stagnation) pressure of a flow by bringing the fluid to rest at the tube's inlet. A separate static port measures the static pressure of the same flow. The difference between these two measurements is the dynamic pressure. The relation between these quantities comes directly from the Bernoulli equation for incompressible, steady, inviscid flow along a streamline:

Unfortunately, due to the age and condition of the total pressure rake; results were impacted to a degree where usable information could not be determined from the data. Since the error introduced by the total pressure rake is determined by the total pressure it is impossible to correct for this without a calibration setup. Additionally, increasing the number of pressure inputs that are used simultaneously will increase the uncertainty of the result because the zero error for each pressure input is different and cannot be accounted for, the zeroing process is automatic within the firmware on the transducer. Figure 5 shows the results from the wake survey rake positioned in the middle of the test section at 2 m/s (pictured in Figure 6(a)); the pressure should be consistent across the pressure ports but clearly this is not the case. It was because of this that the wake survey rake was removed from the apparatus and a pitot-static tube traverse was used instead. This of course meant that the number of test locations necessary would increase dramatically due to the single port on the pitot-static tube, on the other hand, using a single pressure input on the P8-D device would avoid any errors that would have been introduced across the pressure inputs.
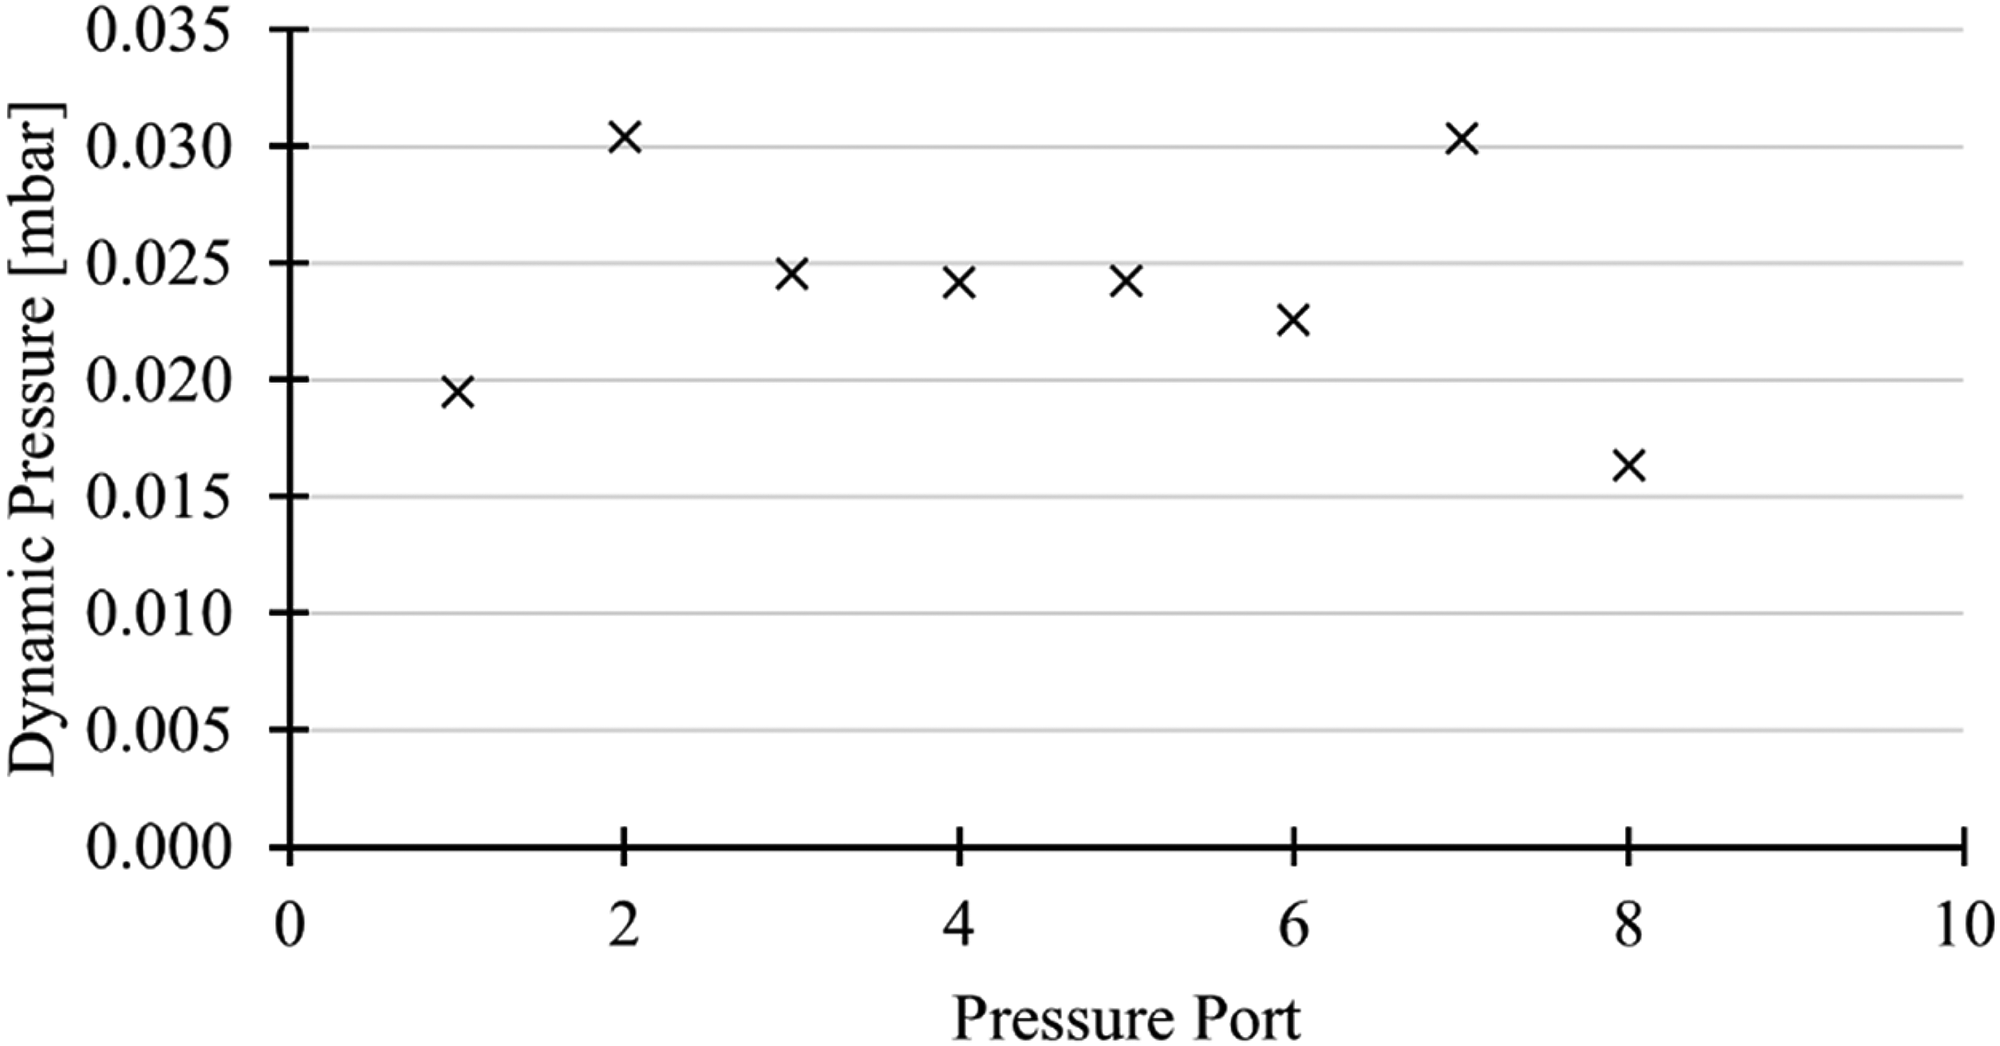
Results from wake survey rake in unobstructed tunnel, exhibiting errors across the pressure ports.
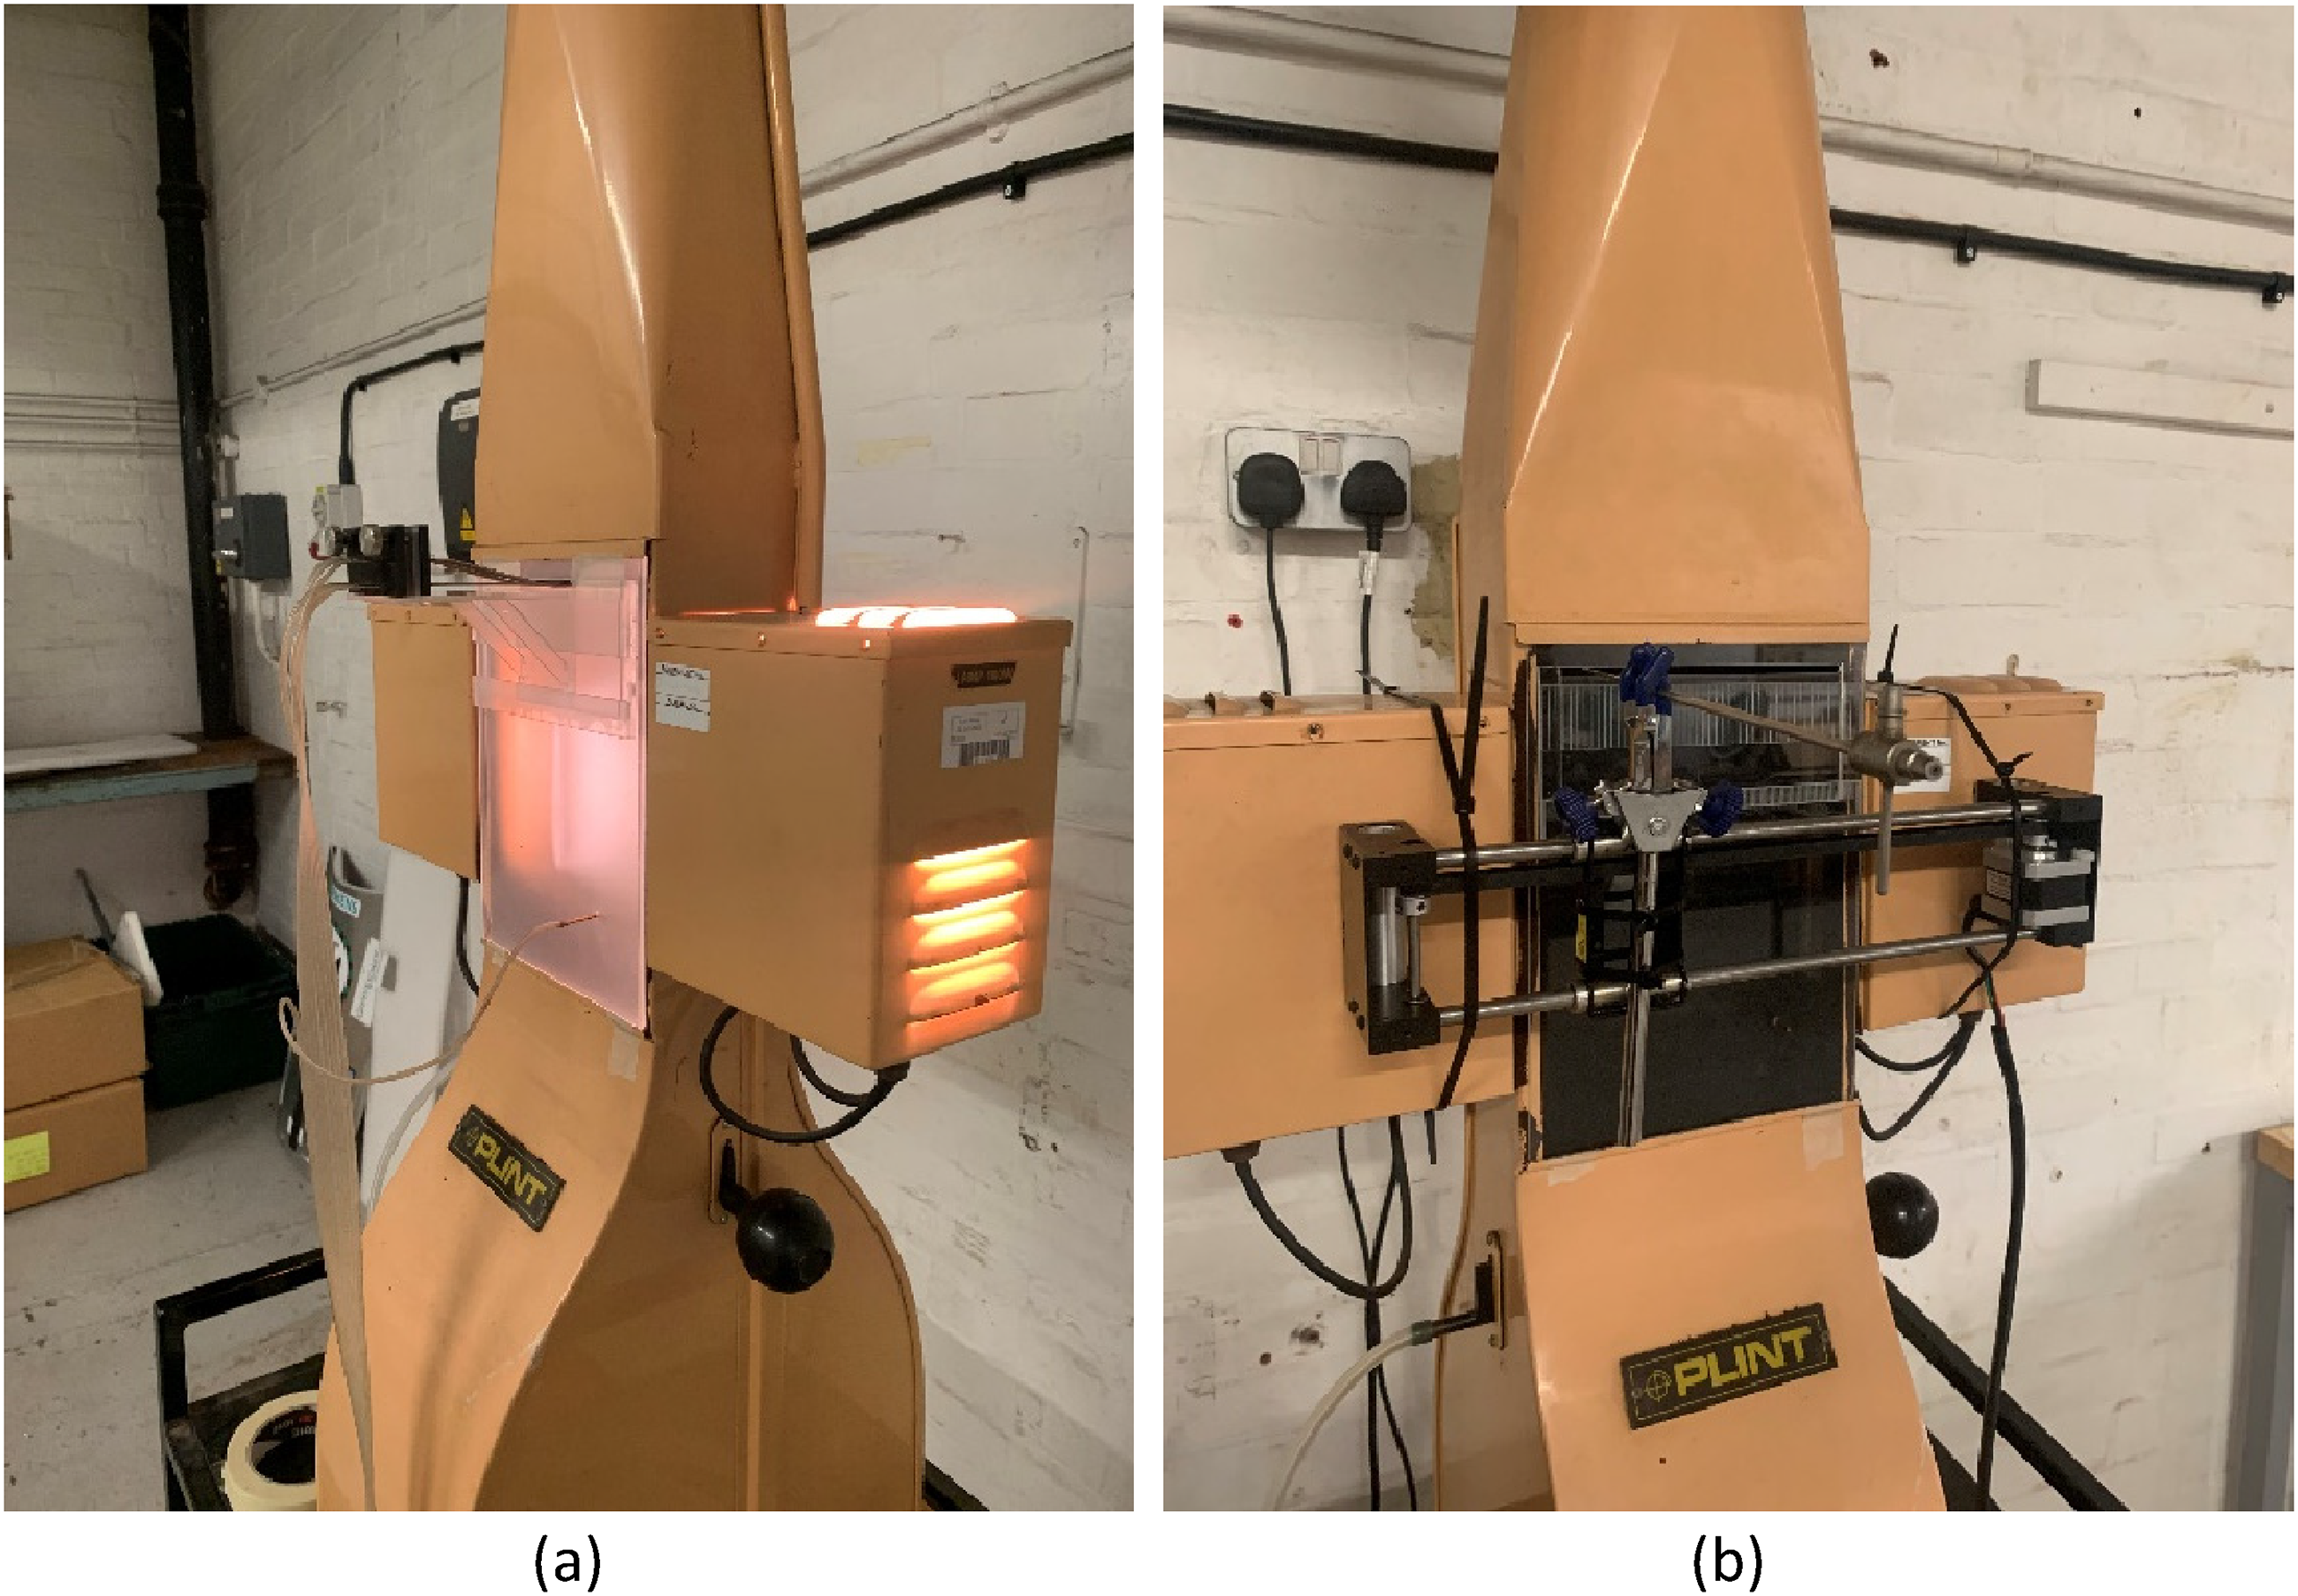
Setup 1 with pressure rake installed (a) and setup 2 with pitot-static tube installed (b).
To accurately control the pitot-static tube along the horizontal axis of the wind tunnel in order to capture pressure distribution in the wake of the model, a CNC positioning system has been implemented into the final iteration of the apparatus (as shown in Figure 7). This not only means that strain on the tester is reduced by completely automating the testing process but also the accuracy of positioning is increased due to the avoidance of human error and the high accuracy of the stepper motor. The CNC system consists of an Arduino Uno to receive G-Code commands from a serial device (normally a connected laptop) and translate this to stepper motor instructions which are then passed to the stepper motor via a driver that is mounted to a CNC shield on the Arduino. A stepper motor driver is necessary here as the stepper motor requires 12 V 0.3 A which would damage the Arduino if this was used; hence a CNC shield is attached to the Arduino to allow for the connection of a separate 12 V power supply, 4 motor drivers and 4 stepper motors (only one is used for this project). The stepper motor is run with single steps rather than implementing any micro stepping which means that it is able to position the pitot-static tube with a resolution of 0.16 mm which is more than adequate for this project.
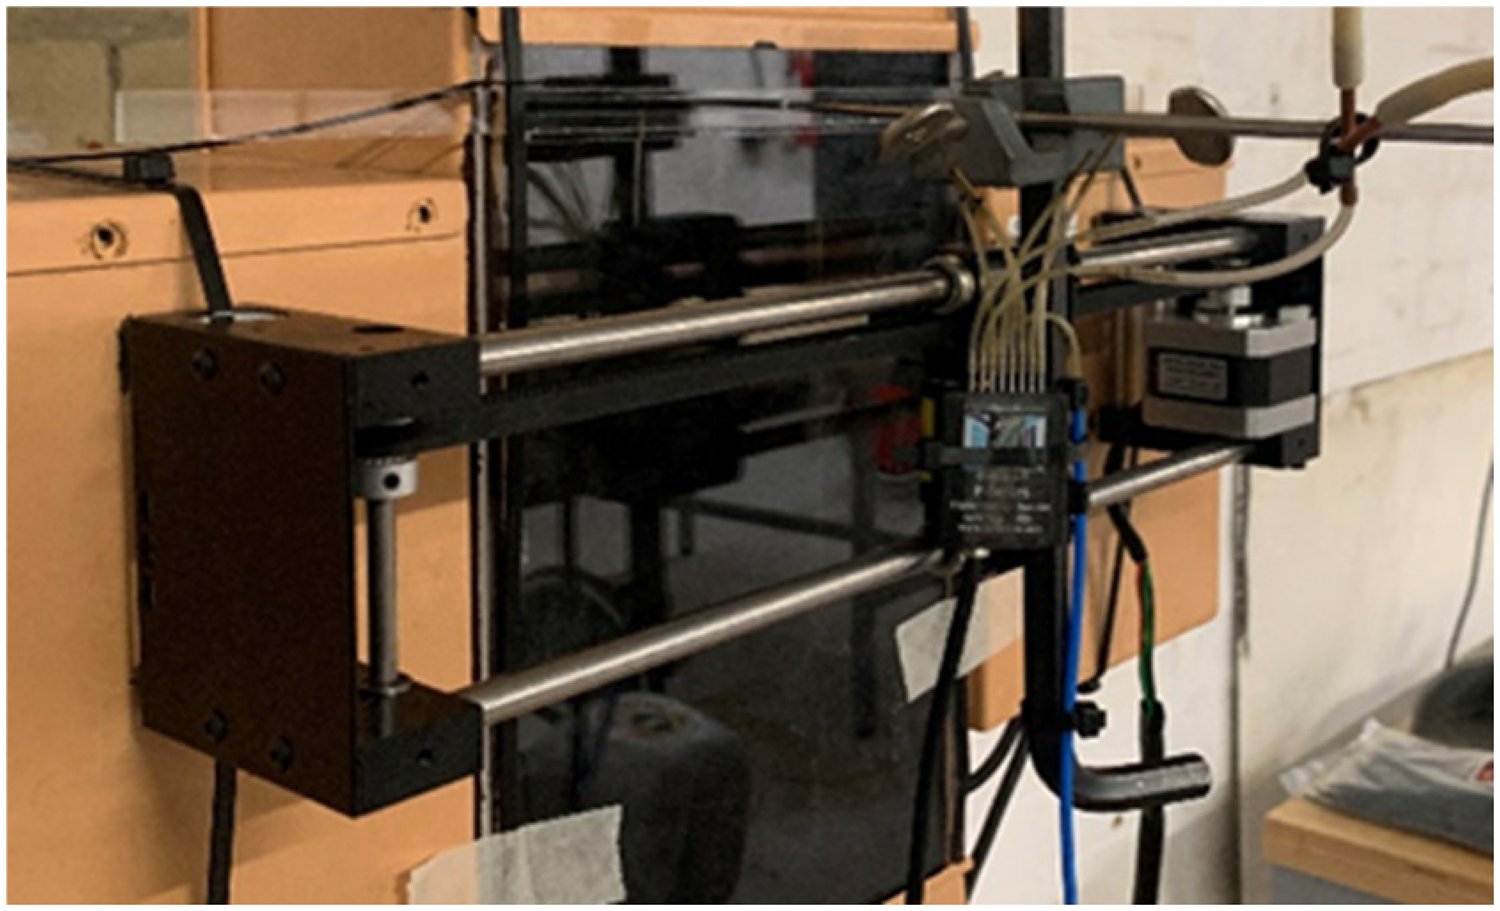
CNC system with attached to test section with pitot-tube mounted [arduino not pictured].
Preliminary testing
Before testing could begin, the feasibility of using the wind tunnel and the selected apparatus needed to be verified, this was done by verifying fluid velocity vs motor voltage and to check the smoke uniformity in the test section. Although the pressure rake couldn’t be used for integration calculations further in the methodology, it could still be used at this point to reliably capture the fluid velocity in the test section; with the addition of taking multiple measurements at once that could be compared, stray values omitted and a mean found for each motor voltage value; the results of this testing are shown in Figure 8 with the error bars representing the minimum and maximum velocities from each test. This shows that the relationship between the velocity in the test section and the voltage is linear with a very high correlation (R2 = 0.9347, or R2 = 0.9743 when stray data is omitted), although the total pressure rake has not been calibrated against a known fluid velocity it is still clear to see the linear trend in the data. From this chart, 2.5 m/s was chosen as the testing velocity for the following tests: this is because it is the mean value of the attainable velocities in the wind tunnel and therefore the speed can be adjusted up and down for testing at different Reynolds numbers or to account for different models. Additionally, in repeat tests this was found to be the optimum motor voltage for achieving consistent flow velocity.
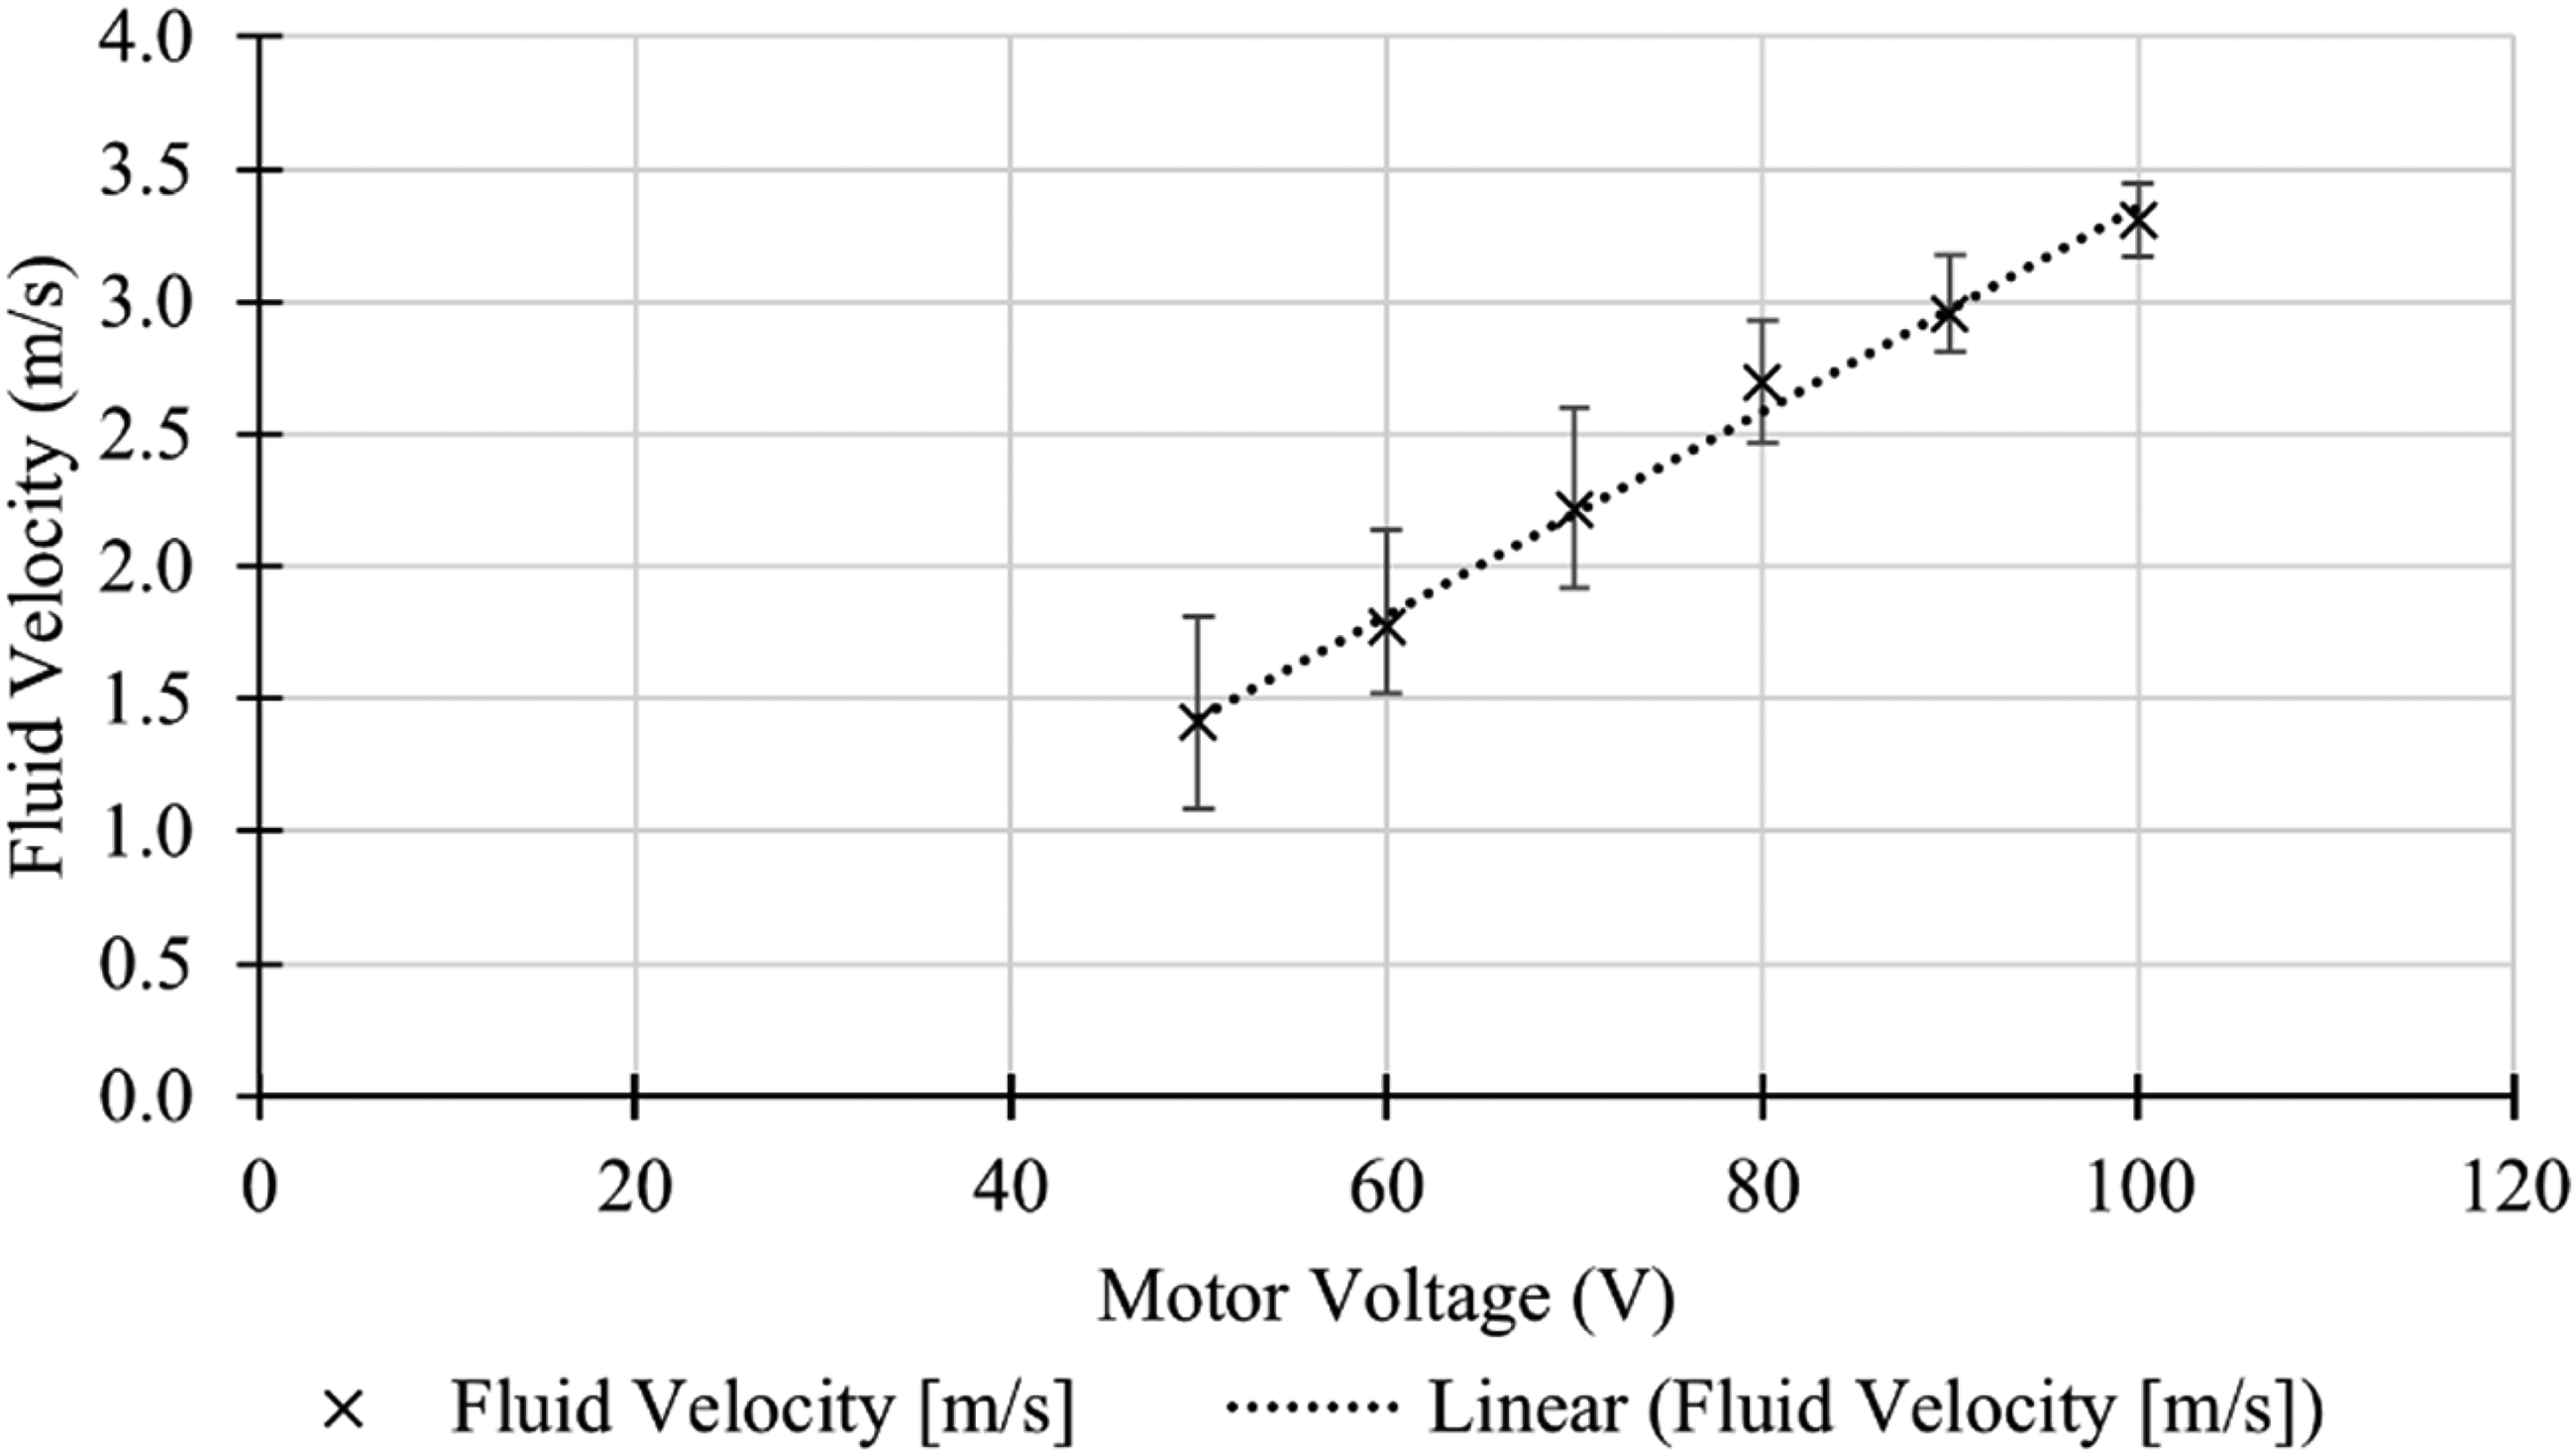
Test section fluid velocity vs motor voltage chart.
The error-bars represent the minimum and maximum values that were calculated by each of the three repeated test, and the same formatting shown in Figure 8 is used across the whole paper.
Next, smoke visualisation was used to observe the flow uniformity in the test section. This would not provide quantitative results but would allow for observations to be made about the general flow structure in the test section. From Figure 9, it is clear to see that the smoke travels parallel to the walls of the wind tunnel with little turbulence or stray velocities seen. Air is drawn in from the bottom of the tunnel through a muslin sheet and steel mesh through a contraction cone and into the test section measuring 180 mm wide × 250 mm high × 100 mm deep with a Perspex front which can be removed to manipulate the model in the test section. A longer shutter speed was used for the image to allow for motion blur to illustrate the motion of the particles and this shows that the motion is vertical and parallel. It was noted during testing that at higher fluid velocities, there is some turbulence present on the right side of the test section; this is likely caused by upstream swirl from the motor and fan operating at high speeds.
Smoke visualisation of unobstructed wind tunnel showing flow uniformity (post processing applied).
Experiments
The experimental methodology presented in this study is adapted from Experiments 5 and 6 in Chapter 17 of Low-Speed Wind Tunnel Testing by Barlow et al., 20 with modifications to suit the capabilities of a small-scale vertical wind tunnel.
Wake momentum deficit principle
The first experiment focuses on determining the drag coefficient of a NACA0012 airfoil at varying angles of attack using the Wake Momentum Deficit Principle, which is a method of calculating the drag on a body opposing the flow of a fluid using the change in momentum of the fluid across a control volume containing the body and the wake of reduced total pressure that is produced by the body. 25 A swept pitot-static tube, mounted on a CNC-controlled linear rail, is used in conjunction with a high-resolution digital pressure transducer to measure the dynamic pressure distribution in the wake of the airfoil. The sign convection used is depicted in Figure 10, where for airfoil tests, the angle of attack is defined as positive when the chord line is rotated counter-clockwise from the freestream direction. The global x-axis is aligned with the freestream velocity (positive downstream). The surface angle θ is measured from +x and increases counter-clockwise. At tap i, the local pressure force Fp,i (blue arrow) acts normal to the surface; its streamwise projection FD,p,i (green arrow) contributes to the pressure-drag estimate. The same global x-axis is used to define the airfoil angle of attack, which is positive for counter-clockwise rotation of the chord line from +x.
Sign convention for the cylinder pressure measurements.
Preliminary testing confirmed that static pressure effects become negligible at a distance of 0.5 chord lengths downstream of the trailing edge, which was selected as the measurement plane. The airfoil, spanning the full depth of the test section, is mounted using the existing M5-threaded fixture. The pitot-static tube traverses the horizontal axis of the test section to capture wake profiles. Tests are conducted at a regulated voltage of 80 V, corresponding to a free-stream velocity of approximately 2.5 m/s. Measurements are taken at angles of attack from 0° to +6° in 3° increments. The resulting velocity profiles are used to calculate drag coefficients, which are then compared to established experimental data to assess the accuracy and reliability of the apparatus.
The initial experimental configuration employed a wake survey rake mounted to a custom laser-cut acrylic panel, replacing the original front cover of the wind tunnel (Figure 6(a)). This setup enabled simultaneous pressure measurements at multiple points across the wake using eight of the rake's eighteen ports, connected to a P8-D pressure transducer. Two port configurations were tested to optimise spatial resolution, and the panel was engraved with measurement guides to aid repeatability. However, the rake's age and condition introduced significant uncertainties. Misalignment of pressure ports and potential internal blockages compromised data integrity, while reliance on a wall-mounted static pressure port further exacerbated measurement errors due to low dynamic pressure levels and manufacturing tolerances. Preliminary tests revealed inconsistent velocity profiles, prompting a redesign.
The setup was improved replacing the rake with a pitot-static tube mounted on a manually operated linear rail salvaged from a 3D printer (Figure 6(b)). This configuration enhanced stability and allowed flexible positioning across the test section. Static pressure was measured locally at the tube, eliminating reliance on wall taps. Despite improved accuracy, manual positioning introduced human error, and the open slot around the tube required sealing to prevent airflow disturbances. While this setup increased measurement fidelity, further refinements were necessary to fully automate and stabilise the system for reliable data acquisition.
To enhance measurement precision and reduce manual intervention, the final experimental setup incorporated a CNC-controlled pitot-static tube system (Figure 11(a)). A stepper motor, driven by an Arduino UNO and CNC shield running GRBL firmware, enabled automated positioning of the probe along the test section. Initially operated via Arduino IDE and P8-D GUI software, the system was later integrated into a MATLAB script that simultaneously controlled probe movement and acquired pressure data via a CAN-BUS interface. This automation significantly reduced human error and improved repeatability.
Setup 3 with pitot-static tube, reference pressure line visible (a) and diagram of pressure static bottle (b).
Following manufacturer guidance, a custom reference pressure chamber constructed from a PET bottle filled with foam was implemented to shield the transducer from ambient fluctuations (Figure 11(b)).
Although the linear rail was secured with zip ties for modularity, this introduced slight positional variability. However, alignment tools such as digital and laser levels ensured consistent setup. Despite minor limitations, the system proved robust and accurate enough for automated aerodynamic testing within the constraints of a small-scale educational wind tunnel.
Results from the first experiment are presented in Figure 12.
Dynamic pressure and velocities in the wake at different angles of attack: (a), (b), (c) show the dynamic pressure at 0°, 3°. 6° AoA, respectively; (d), (e), (f) show the velocity at 0°, 3°. 6° AoA, respectively. R1, R2, R3 stands for the different repetition of the experiment.
Surface pressure distribution on a cylindrical model
The second experiment builds upon Experiment 6 from Barlow, Rae and Pope 20 and the discussion in Chapter 12.5 of J.F. Douglas, 26 adapting the methodology to investigate the surface pressure distribution on a cylindrical model rather than an airfoil. This modification was necessary due to the practical limitations of manufacturing a ported airfoil at the scale required for the apparatus. A 20 mm diameter PVC cylinder was installed across the full depth of the test section using the existing M5-threaded mounting system and a custom-fabricated front plate. A single pressure port embedded in the cylinder wall was used to record total pressure at discrete angular intervals as the cylinder was manually rotated through 180°, enabling the reconstruction of the surface pressure distribution. Tests were conducted at a regulated voltage of 80 V, corresponding to a mean flow velocity of approximately 2.5 m/s. Static pressure was recorded from a wall tap on the front plate, and total pressure was measured at 10° increments along the cylinder's surface. The resulting pressure distribution was used to calculate the drag coefficient using the surface integration method, and results were compared to established literature values. Additionally, a pitot-static tube traverse was performed in the wake of the cylinder to obtain a velocity profile and calculate the drag coefficient using the Wake Momentum Deficit Principle, providing a secondary validation of the experimental setup.
Information gathered from the iterative process of producing the final apparatus in Experiment 1 could be directly transferred to the initial setup of Experiment 2. The apparatus consists of an acrylic sheet laser cut to the dimensions of the test section front. The sheet has a 20 mm diameter hole cut opposite the mounting position for models, a slot cut 10 mm from the top of the test section front spanning 150 mm across and 2.5 mm high, finally a 2 mm brass insert is located 50 mm from the bottom and right sides. The insert functions as the pressure port for static pressure in the test section. A 150 mm length of PVC tubing acts as the cylinder test model, with a 2 mm brass tube insert located 50 mm from the end of the cylinder and an M5 thread mounted to this end to allow for mounting in the test section. The brass tube serves as a pressure port to measure the total pressure on the surface of the cylinder at a given angle. To accurately measure the angle of the pressure port with respect to the flow, a flat section has been cut on the protruding end of the PVC tubing perpendicularly to the pressure port to allow for a digital protractor to be used, this means the angle uncertainty is ±0.05 °. Additionally, the pressure static bottle from Experiment 1 is reused in order to create a stable environment for the reference atmospheric pressure reading of the pressure transducer, this is again placed on an isolated platform to reduce vibrations from the wind tunnel motor (Figure 13). The slot at the top of the sheet is covered during measurements in order to maintain the correct static pressure within the test section, the slot is used later for the pitot-static tube survey. The manufacturing quality, surface quality and diameter of the brass pressure inserts will have a considerable effect on pressure readings taken, hence, care was taken during manufacture to produce a clean edge on the brass tube and maintain the circular profile of the tube. Furthermore, the surface roughness on the exterior of the PVC cylinder is not controlled during the manufacturing process to the same degree as upheld for subsonic wind tunnel test models and hence will affect the drag force exerted onto the cylinder. 10
Experiment 2 final set up.
Results from the second experiment are presented in Figure 14 where the pressure coefficient is defined as
Cylinder surface pressure (a), surface pressure coefficient (b), velocity (c), and dynamic pressure (d).
MATLAB data acquisition and control system
MATLAB was employed to automate data acquisition and control in this study. Two key toolboxes, Vehicle Network Communications and Support Package for Arduino Hardware, enabled seamless communication between the P8-D pressure transducer and the Arduino UNO microcontroller. The Arduino was programmed with GRBL, an open-source G-code interpreter, allowing MATLAB to send precise movement commands to a stepper motor that controlled the pitot-static tube's position along a linear rail. Two custom MATLAB scripts were developed, for which an overview is provided in Figures 15 and 16: one for wake pressure measurements and another for surface pressure distribution. The wake pressure script fully automated the testing process by initialising device connections, collecting environmental parameters for calculating air density, and defining the test grid. It used nested loops to move the pitot-static tube across the test section, synchronising motor delays for accurate positioning. Pressure data, transmitted via CAN-BUS in multiplexed packets, was filtered to extract relevant sensor readings, and a while-loop ensured consistent sample collection at each point. Although the system's acquisition rate was limited to 3 Hz due to message filtering, this was sufficient for the low-speed flow conditions tested. Overall, the MATLAB integration enabled precise, repeatable, and largely hands-free data collection, significantly improving the reliability and efficiency of the experimental process.
General overview of MATLAB data inputs and outputs.
MATLAB wake pressure script flowchart.
The Surface Pressure script is remarkably similar but with interrupts between each step point to allow for the user to rotate the cylinder before continuing the programme, furthermore the positions of each step point are predefined in the script. This is because the sweep of the cylinder surface is already defined as a 180° sweep with 10° intervals and therefore this does not need to be classified by the user. The flexibility of the first script allowed for only a few modifications to be necessary for it to be used to find the Surface Pressure distribution.
Analysis and discussion of results
Experiment 1
Figure 17 shows the drag coefficients calculated at different angle of attacks (AoA). The chart shows that at 0°, 3° & 6° AoA, the drag coefficient calculated is 0.0305, 0.0329 & 0.0376 respectively from the wake momentum deficit of the airfoil.
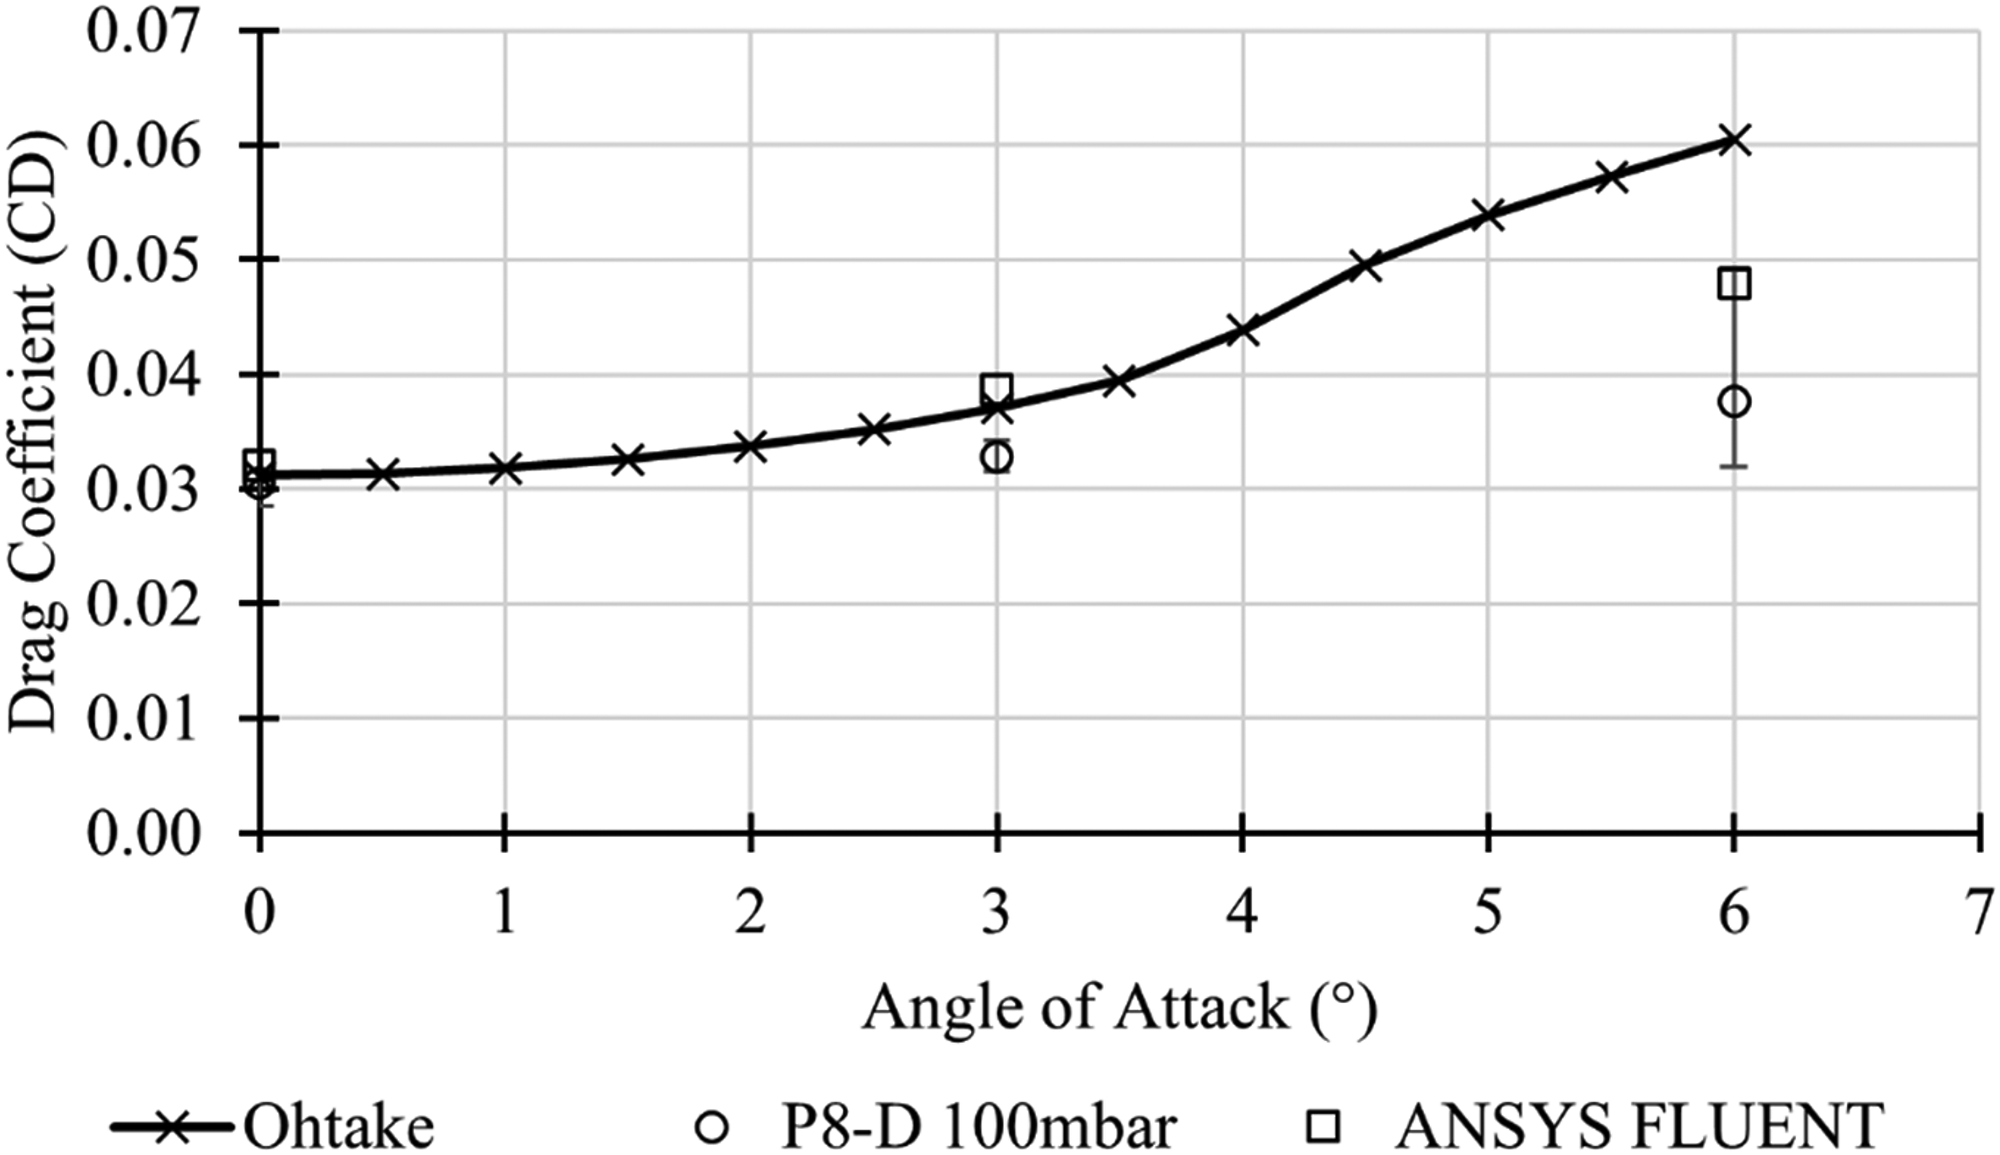
NACA0012 drag coefficient comparison.
Ohtake et al.
6
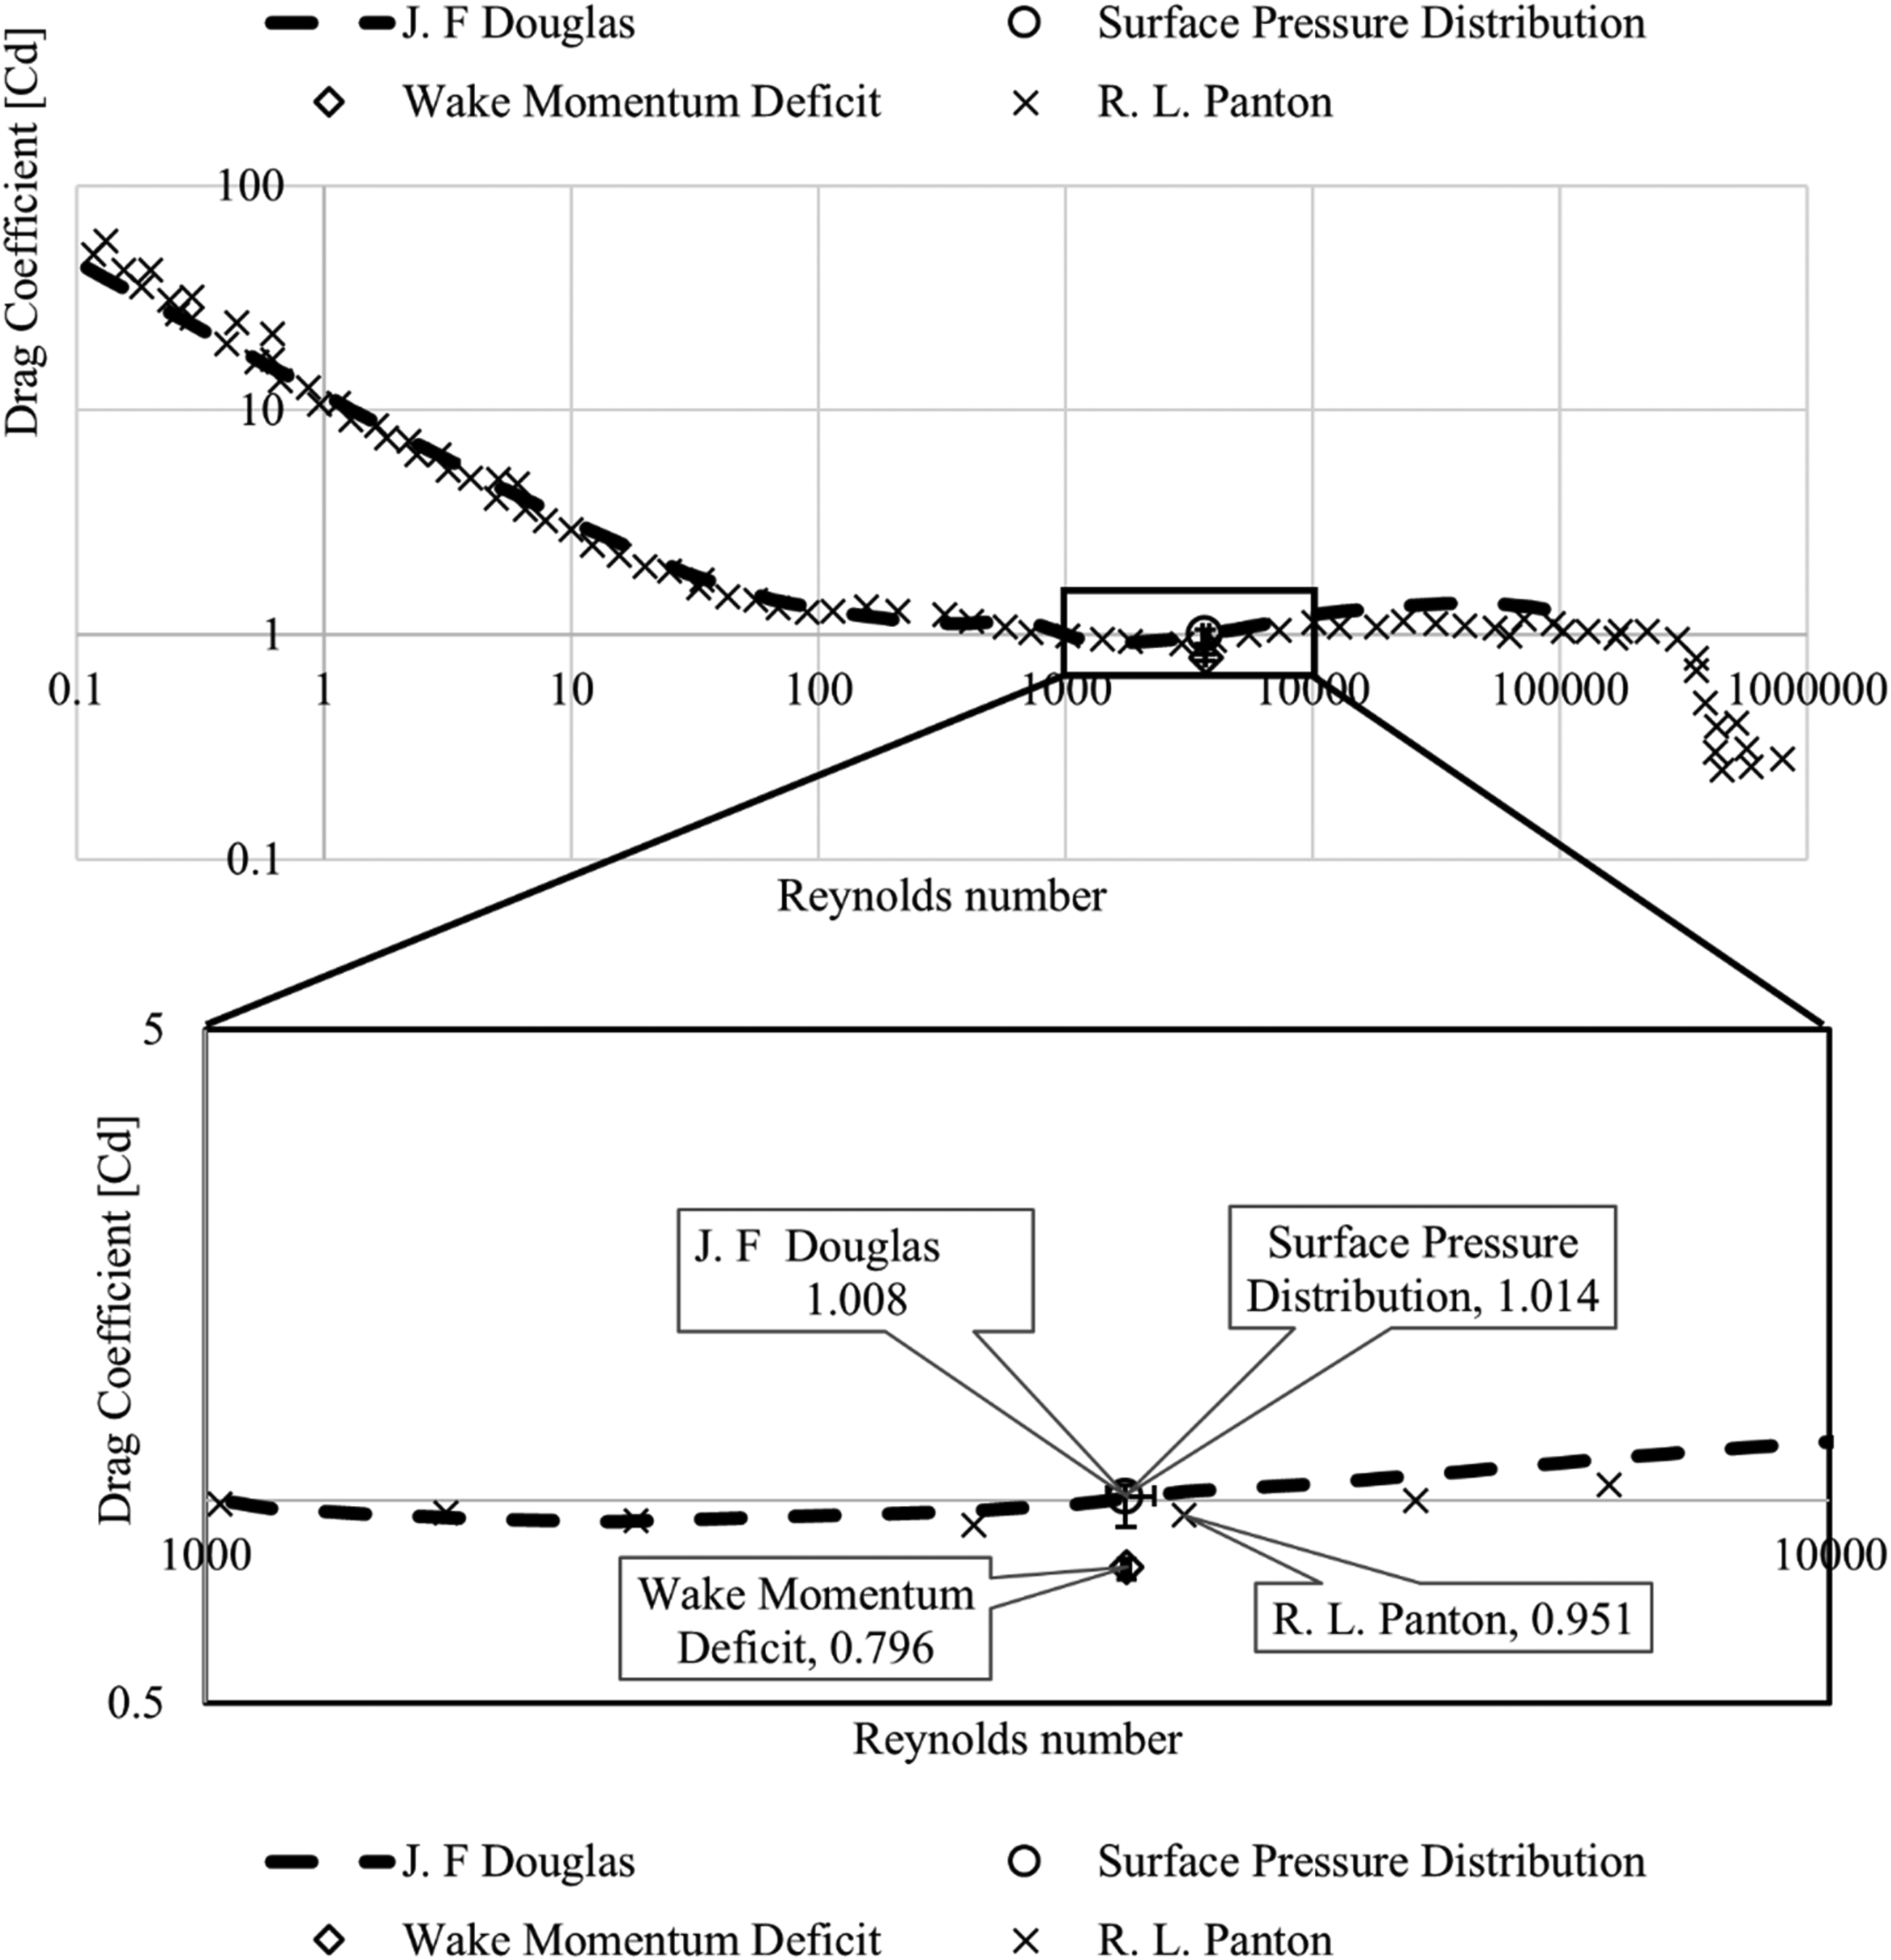
presents the data collected during a similar experiment performed in an investigation into the non-linearity of airfoil characteristics at low Reynolds number. Since the test fluid velocity is on average 2.5 m/s, this means that the chord based Reynolds number for this configuration is:
Hence all researched values presented are for a Reynolds number range of 100,000–200,000. The data shows that the wake momentum deficit principle method was able to calculate the drag coefficient for the NACA0012 up to an angle of 6°, passed this point the blockage factor of the model and effects from the wall of the wind tunnel become too great for a viable result to be taken from the data. As the angle of the airfoil increases, so does the frontal area of the airfoil exposed to the flow, this causes the body to begin to act more like a bluff/blunt body and therefore leads to increased wake size and detached vortex shedding behind the model. At 0° AoA, the Wake Momentum Deficit method is able to calculate the drag coefficient to within −2% of the value found by Ohtake et al., 6 however this discrepancy increases to −11.5% at 3° and −37.8% at 6°; this increasing error from validated data shows that the approximations taken in the above methodology have not taken into account the changing angle of the airfoil and how this could affect the wake momentum deficit within the wind tunnel. As the airfoil is simulated as an equivalent cylinder when calculating the velocity correction factor, there is no consideration for the AoA, and therefore this error at increasing AoA is expected.
The error-bars represent the minimum and maximum values that were calculated by each repeated test whilst the data point is calculated from an average velocity profile across all 3 repeated tests. At 6° AoA it is clear to see that there is much turbulence behind the model, shown by the variation in the dynamic pressures in Figure 12(d), this highlights the necessity to calculate the drag coefficient individually for each repeated test as opposed to finding an average velocity profile. Fluctuations in the motor and fan, room pressure variations, room air currents, pressure transducer drift and even more variations can occur between the repeated tests that would not be accounted for in an averaged velocity profile.
Experiment 2
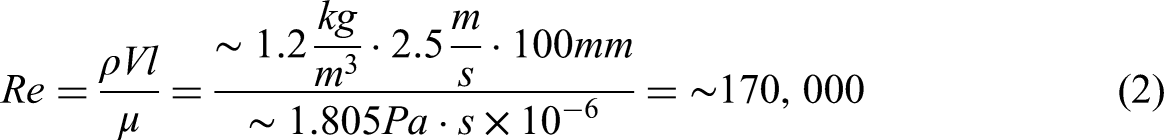
Figure 18 show the final drag coefficient values found from the data presented in Figure 14 once they have been processed.
The figures above show that the Surface Pressure method was able to calculate the drag coefficient for a cylinder in this Reynolds number range to +0.6% of the value found in 26 and 25 where the results were found experimentally. Despite the approximations and uncertainties, it is unanticipated that the results would be as close to existing values; however this underscores the feasibility of using such an apparatus in an educational or rudimentary research scenario.
The Wake Momentum Deficit method, however, was less successful in predicting the drag coefficient of the cylinder as it had a discrepancy of −24.2% and −19.8% of the researched values, respectively. The errors present in this method are likely due to the interactions with the walls of the wind tunnel caused by the size of the model used in this experiment, as the PVC tube is 20 mm in diameter this means that it obstructs 11.1% of the test section cross-sectional area10,12,19; this means that the approximations made in the wake deficit principle that the model is in free stream will break down due to the restriction of the flow. The surface roughness of the cylinder is not taken into account, but at these low Reynold's Number ranges this effect is negligible. An additional factor contributing to this discrepancy is the difference in how drag is generated on a cylinder compared with a conventional airfoil. For a circular cylinder, the drag is dominated by pressure drag due to large-scale flow separation and a broad wake, whereas a streamlined airfoil experiences drag primarily through skin friction with much smaller pressure-drag contributions. Because the Wake Momentum Deficit method estimates drag based on the momentum loss within the wake, it is more suitable for bodies where friction drag dominates and becomes less accurate for bluff bodies such as cylinders, where pressure drag is the primary component.
The error bars in the data above are presented as the range of values calculated from each repeat test using the individual corrected mean flow velocity when calculating the drag coefficient; it is interesting to see that the uncertainty range from the surface pressure measurements are much wider than that of the wake deficit measurements, even though the results for the surface pressure method were much closer to the researched values. This is likely due to uncertainty introduced by the quality of flow instrumentation used in each setup. The above results are an example of data that is accurate but not precise (surface pressure measurements) as opposed to results that are precise (repeatable) but not accurate (wake deficit measurements). Conversely, the wake deficit measurements are taken ‘far-field’ as in far-away from the model and would therefore be more susceptible to variations and interferences from the wind tunnel as the control volume is much larger; where for the surface pressure measurements the control surface is only the surface of the cylinder and therefore is less susceptible to the unwanted interactions.
Figures 19 and 20 show how the data captured from the surface pressure measurements can be overlayed with diagrams and data retrieved from experimental values and fluid dynamics textbooks 26 in order to compare the surface pressure distribution to existing art. Obtaining surface pressure distribution for a specific Reynolds number proved challenging, however as the drag coefficient changes very little with small changes to Reynolds number (note the x-axis in Figure 18 is a logarithmic scale) these values can be approximated but this must be taken into account when evaluating the final results. Figure 20 shows that the angle of transition between negative and positive pressure (following definition from JF Douglas) is the same for the data retrieved in this experiment and that observed in. 26
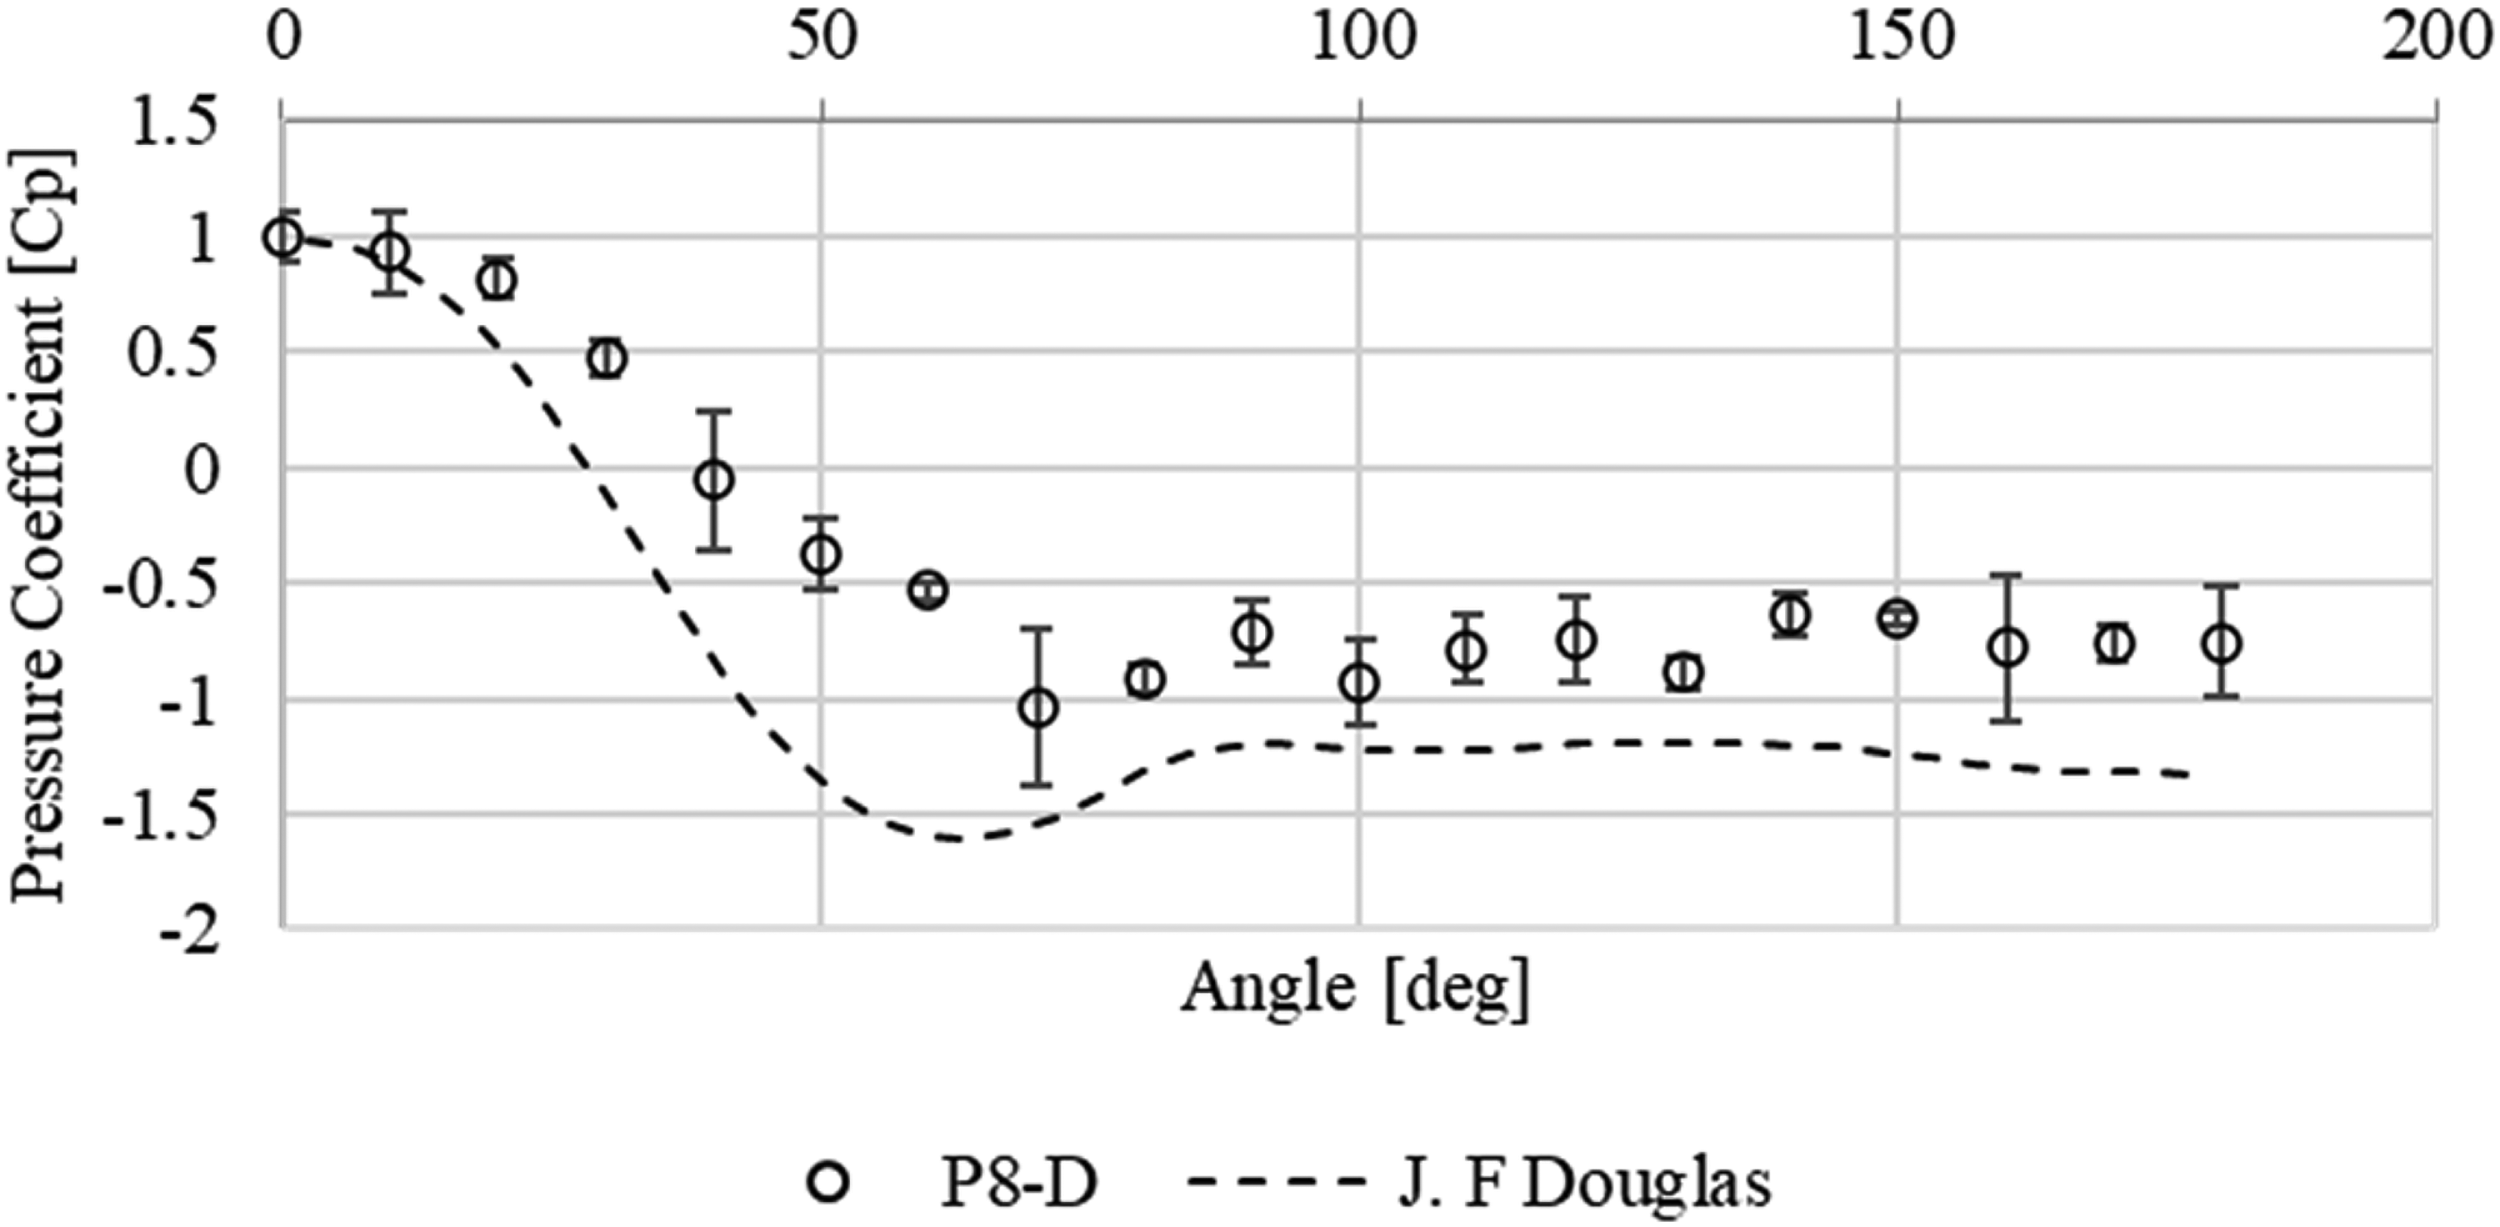
Comparison of results of the surface pressure distribution over the cylinder, over reynolds number between 90 and 1000, in accordance with experimental data published in. 26
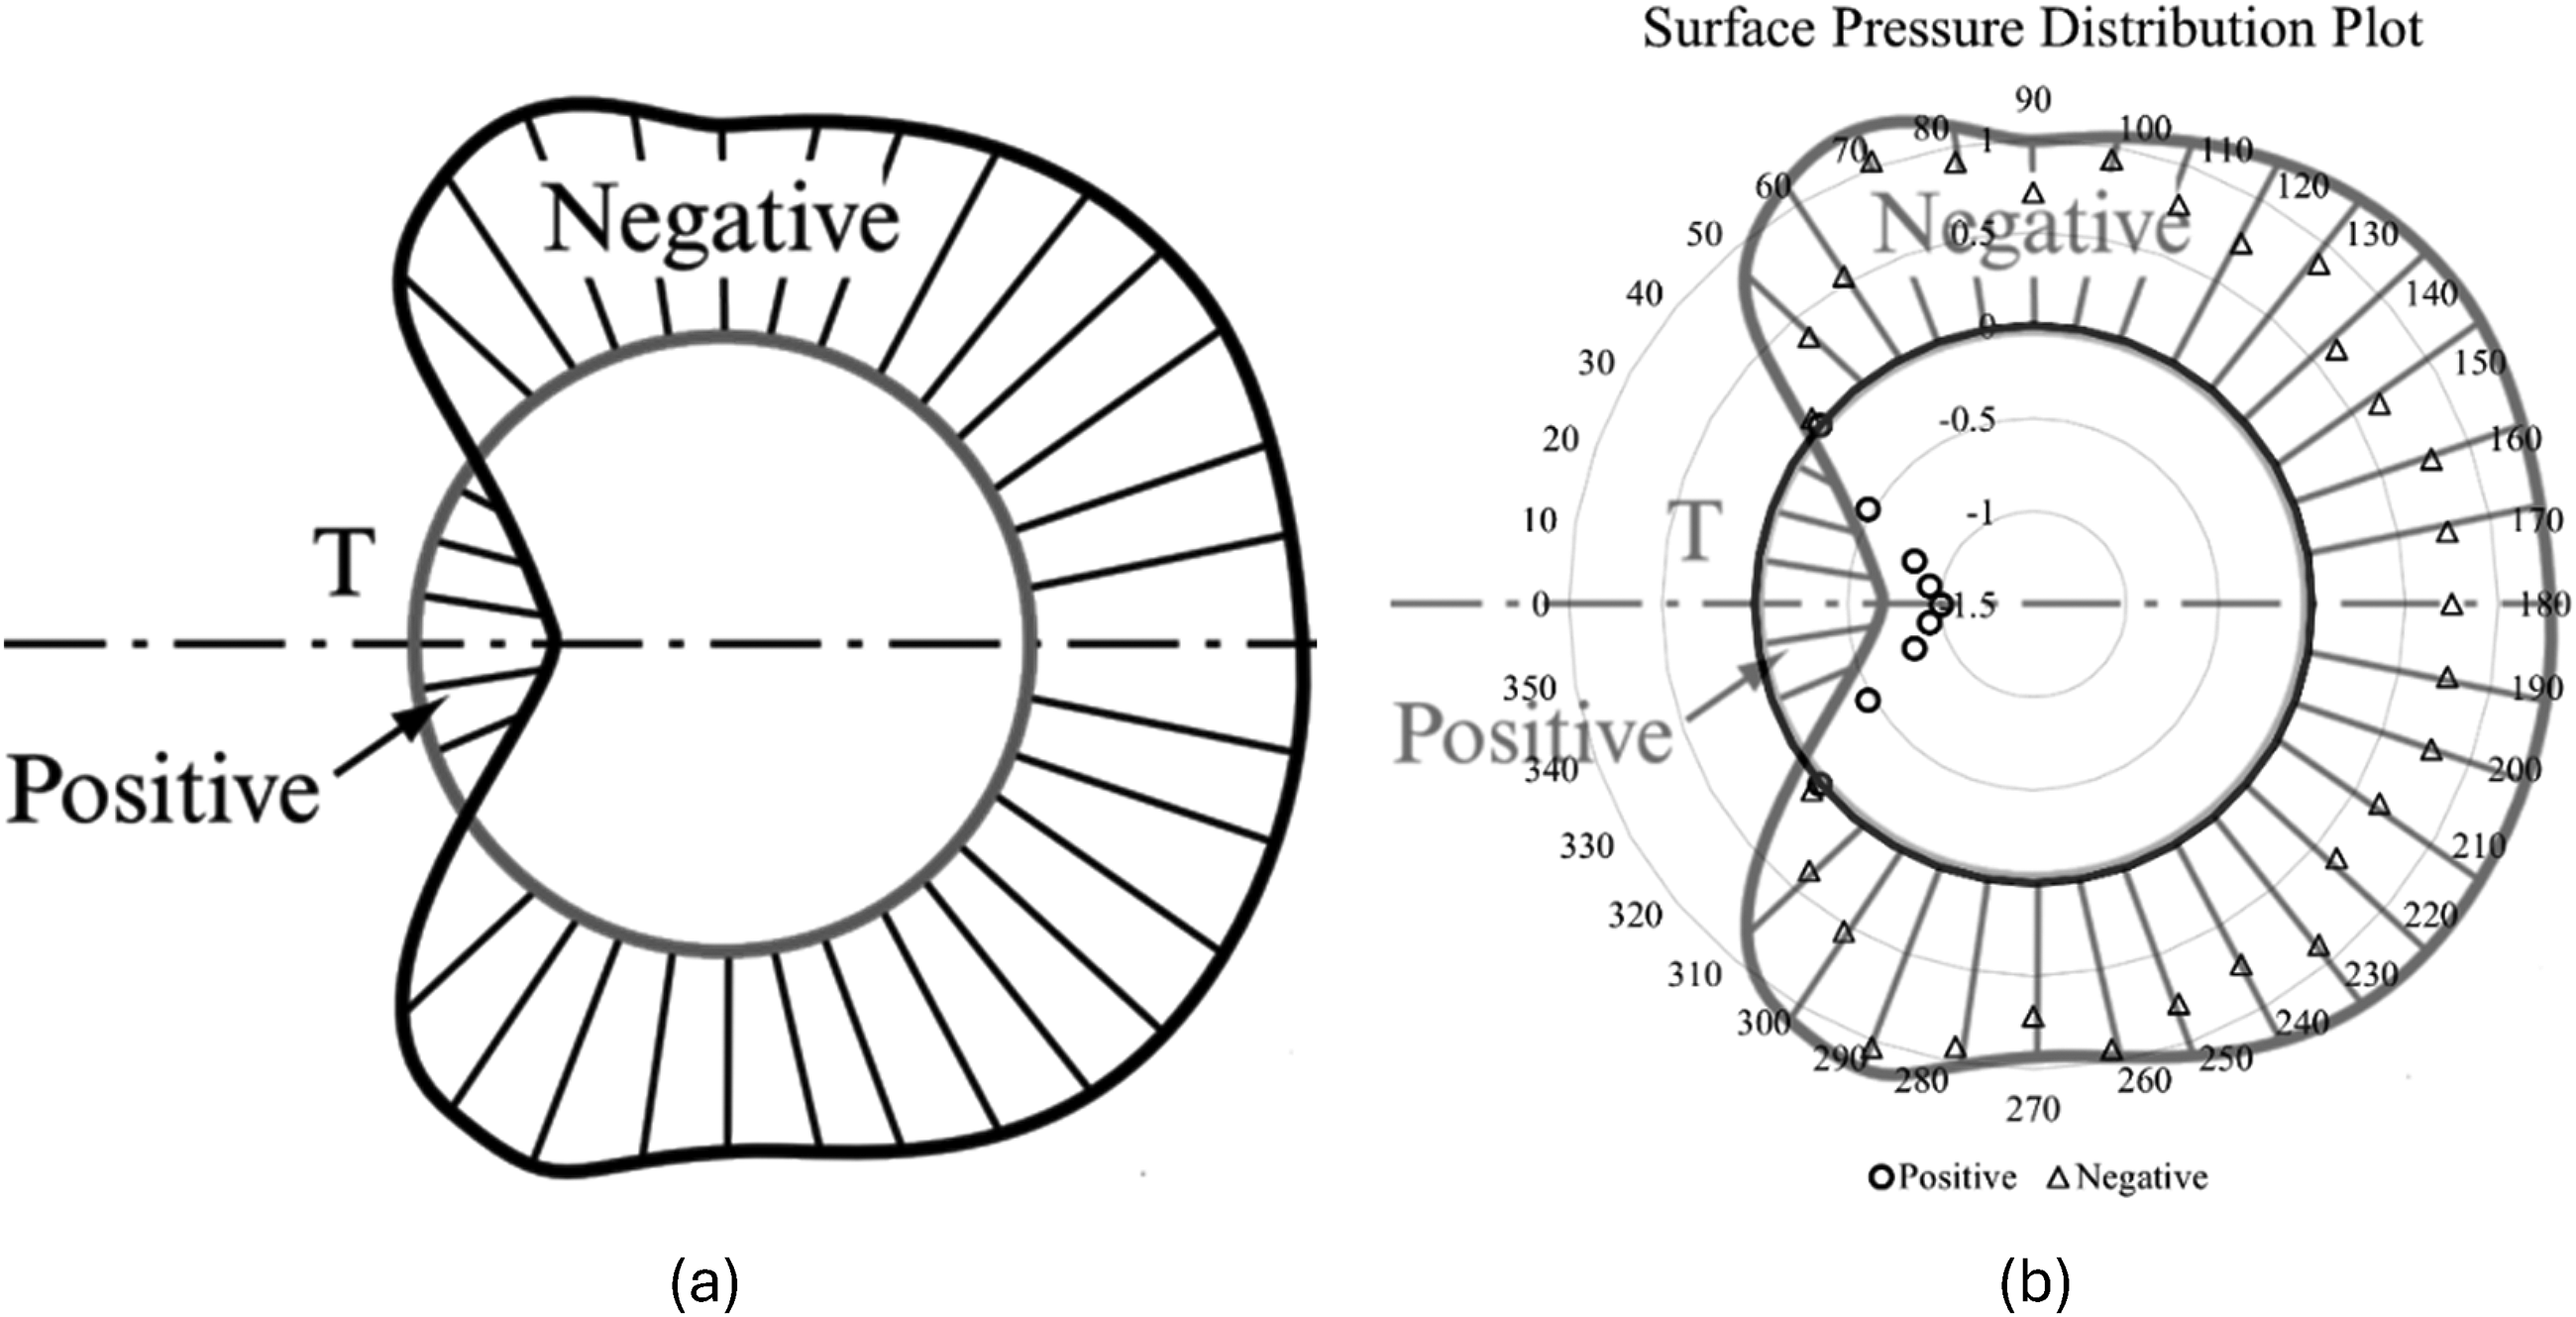
Positive and negative pressure comparison, following jf douglas definition, between their work and this work. Surface plot diagram comparison between this work (a) and 26 (b).
Discussion
The proposed repurposing of the Plint TE80 smoke tunnel into a digitally instrumented aerodynamic testbed offers a compelling case study in the pedagogical value of low-cost experimental data acquisition in engineering education. Experiential learning, as defined by Kolb and Kolb, 27 emphasises the transformation of experience into knowledge. Students engage directly with aerodynamic phenomena, instrumentation and data analysis, moving beyond passive reception of information to active construction of knowledge. This aligns with constructivist theory, particularly Piaget's and Vygotsky's views, 28 that learners build understanding through interaction with their environment and peers. The setup encourages reflection-in-action, a concept introduced by Schön, 29 where learners adapt and refine their understanding in real time. The iterative nature of the experiments by modification of setups, troubleshooting instrumentation and interpretation of results actively helps students to independently discover principles and concepts of engineering design process and supports deep learning. 30
The modular, low-cost instrumentation framework exemplifies Project-Based Learning, which fosters real-world problem-solving, interdisciplinary thinking and student agency. 31 By engaging with a tangible engineering challenge of reviving and modernising a legacy wind tunnel, students develop both technical and soft skills, including teamwork, critical thinking, and resilience. Hands-on learning also supports active learning environments, which have been linked to improved retention and engagement in STEM (Science, Technology, Engineering, and Mathematics) disciplines. 32 The tactile and visual nature of smoke visualisation, combined with data acquisition and postprocessing, provides a multisensory experience that enhances conceptual understanding.
In this experimental study, reviving a legacy wind tunnel for educational use embodies situated learning theory, which puts forward that learning is most effective when embedded in authentic contexts. Students not only simulate engineering tasks but also solve real problems with real constraints, echoing Koen's 33 definition of engineering as “the strategy for causing the best change in a poorly understood situation within the available resources.” Moreover, the historical and outreach dimensions of the TE80 tunnel support critical pedagogy, encouraging students to reflect on global disparities in access to engineering education and the role of resourcefulness in addressing them.
The integration of MATLAB-based data acquisition and statistical analysis introduces students to cognitive apprenticeship, where learners acquire expert thinking through guided practice to foster rapid development. The use of error analysis and postprocessing techniques cultivates data literacy, a crucial skill in modern engineering practice. This aligns with Bloom's taxonomy, 34 particularly the higher-order cognitive domains of analysis, evaluation and creation. Students not only collect data but interpret, critique and use it to inform design decisions, moving from knowledge recall to synthesis.
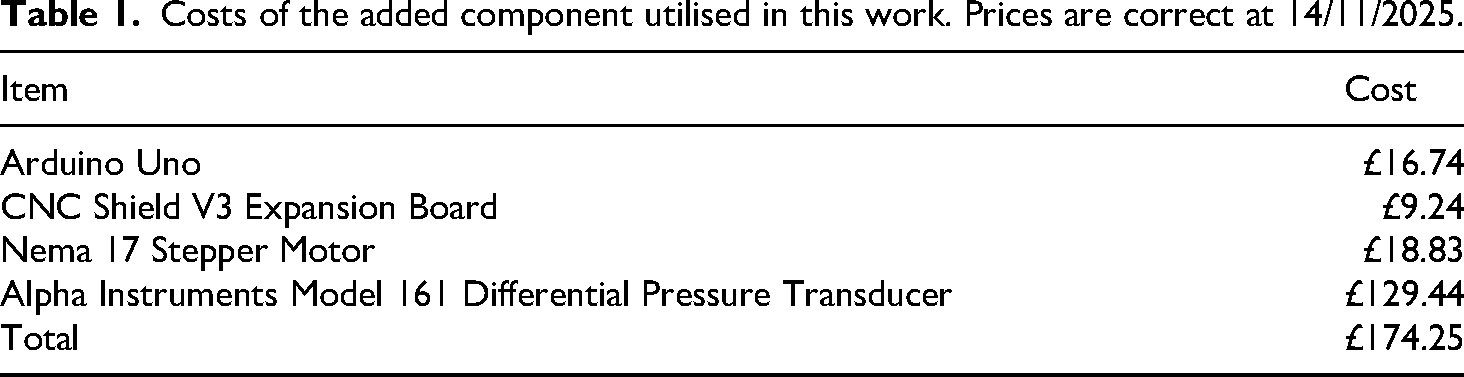
As shown in Table 1, the total cost of the additional components remains under 200 GBP, demonstrating that meaningful experimental capabilities can be achieved with minimal financial investment. Repurposing outdated equipment into a functional teaching tool exemplifies sustainable pedagogy—maximizing educational impact while minimising resource consumption. This approach not only reduces waste and extends the life of existing infrastructure, but also promotes equity in engineering education by enabling hands-on learning in low-resource settings where access to high-end facilities is often limited.
Costs of the added component utilised in this work. Prices are correct at 14/11/2025.
In fact, access to high-end experimental facilities remains highly unequal across the globe. Following data reported in Figures 1 and 2, 39% of countries worldwide lack any membership in major aerodynamic testing networks, indicating limited access to wind tunnels and similar infrastructure. This disparity strongly correlates with GDP per capita, creating systemic barriers for students in resource-constrained regions.
Educational equity extends beyond enrolment as it requires meaningful participation in hands-on learning. Research consistently shows that experiential learning environments, such as makerspaces and laboratories, significantly improve conceptual understanding and retention in STEM fields. However, these spaces normally often demand substantial investment, which is unattainable for many institutions in LMICs. Studies on engineering makerspaces emphasise that equitable access depends on affordability, multiple entry points, and cultural belonging, not merely the physical presence of equipment. 35 Low-cost experimental setups can bridge this gap. For example, a quasi-experimental study in rural Mexico demonstrated that introducing a $50 STEM toolkit increased student engagement and interest in physics by over 40% compared to traditional lecture-based instruction, while also improving teachers’ ability to deliver practical lessons. 36 Researchers have also worked in creating low-cost load cells for wind tunnels 3 or even low-scale actual wind tunnel for educational purpose. 37 Similarly, systematic reviews confirm that hands-on activities, regardless of scale, consistently enhance academic performance and problem-solving skills in STEM education. 38
The implications are profound: affordable retrofitting of legacy equipment, as demonstrated in this study, can democratise access to experimental learning, enabling institutions in low-resource settings to offer authentic engineering experiences without multimillion-dollar investments. This aligns with UNESCO's call for inclusive educational frameworks and recent findings 39 that infrastructure quality accounts for up to 16% of variation in student learning outcomes. This has impact on research environments as well, 40 where researchers from low-income countries look for second hand equipment and more international collaborations to minimise resource usage and circumnavigate sourcing bottlenecks. 40
Conclusions
Wind Tunnels have proven their ability to allow for a better understanding of fluid dynamics problems across history. Current developments in renewable energy systems and their related applications have created a new opportunity for wind tunnels to be at the forefront of advancement; however, due to the cost and size of the facility required to support most wind tunnels, access to this apparatus has been limited to regions of greater economic development, resulting from a global disparity in access to high-end experimental facilities. Reducing the cost and size of these wind tunnels would allow for better access to apparatus at the cost of performance and accuracy. This study repurposed a legacy Plint TE80 smoke wind tunnel into a digitally instrumented, remote controlled low -cost aerodynamic testbed for engineering students.
The methodology involved retrofitting the wind tunnel with a differential pressure transducer, a CNC-controlled pitot-static tube system, and a MATLAB-based data acquisition and control interface. Two classical aerodynamic experiments were conducted: (1) drag coefficient estimation of a NACA0012 airfoil using the Wake Momentum Deficit Principle, and (2) drag determination of a cylinder via both surface pressure distribution and wake velocity profiles.
Three key results emerged from this work:
The Wake Momentum Deficit method yielded drag coefficients for the NACA0012 airfoil at 0°, 3°, and 6° angles of attack as 0.0305, 0.0329, and 0.0376, respectively. At 0°, the result was within 2% of validated literature values, demonstrating the method's reliability under low-angle conditions. For the cylindrical model, the surface pressure integration method produced a drag coefficient within +0.6% of established experimental data, confirming the effectiveness of the low-cost setup for accurate pressure measurements. The entire instrumentation upgrade was achieved for under £175, using off-the-shelf components such as an Arduino Uno, stepper motor, and a budget differential pressure transducer. The system enabled automated, repeatable measurements with a spatial resolution of 0.16 mm and a pressure resolution of 0.003 mbar, sufficient for low-speed aerodynamic testing.
Beyond technical validation, this work underscores the broader educational and societal value of repurposing legacy equipment. By transforming disused apparatus into functional, modern teaching tools, institutions can provide students with authentic, hands-on experiences that foster deep learning, critical thinking, and data literacy.
Footnotes
Acknowledgements
The Authors acknowledge and thank colleagues from Evolution Measurement for the differential pressure transducer and the support throughout this investigation. For the purpose of open access, the author(s) have applied a Creative Commons Attribution (CC BY) licence to any Author Accepted Manuscript version arising from this submission.
Funding
The authors received no financial support for the research, authorship, and/or publication of this article.
Declaration of conflicting interests
The authors declared no potential conflicts of interest with respect to the research, authorship, and/or publication of this article.
Data availability statement
Data sharing not applicable to this article as no datasets were generated or analyzed during the current study.