
Abstract
This study explores the pedagogical impact of digital pre-laboratory experiences within a flipped engineering education context, examining how simulation modality influences student engagement and perceived workload. A cohort of 250 first-year engineering students was assigned to one of four groups: a control group with a traditional pre-lab quiz, or one of three digital pre-lab formats; a 2D image-based tool (iLabs), a low-fidelity browser simulation, or an immersive virtual reality (iVR) experience. All simulations replicated a standard 3-point beam bending experiment using identical empirical data. Student perceptions were collected through NASA's Task Load Index (TLX), Likert-scale surveys and open-ended feedback. Although no statistically significant differences in post-lab test scores were observed, iVR participants reported significantly higher enjoyment (M = 6.11, H = 24.19), attention (M = 5.8, H = 11.92), immersion (M = 5.67, H = 20.7) and interactivity (M = 5.53, H = 9.2). TLX analysis also revealed significant differences in physical demand (M = 2.74, H = 11.61) and effort (M = 7.51, H = 7.78). These findings suggest that simulation modality strongly influences user experience, even when learning gains remain comparable. The study highlights the need to balance pedagogical value with resource demands when designing digital learning interventions.
Keywords
Introduction
The rapid integration of digital technologies has profoundly transformed higher education, particularly evidenced by the surge in remote and virtual laboratory experiences. This shift underscores the need for effective digital tools that complement traditional teaching methods and enhance learning. Extended Reality (XR), an umbrella term encompassing Virtual Reality (VR), Augmented Reality (AR) and Mixed Reality (MR), 1 has emerged as a promising avenue for immersive educational experiences. Its adoption in Higher Education (HE) has seen remarkable growth, especially within engineering disciplines, where it offers novel approaches to complex problem-solving and skill development.2,3
The pedagogical benefits of XR, such as providing access to environments not feasible through traditional means, 4 have driven extensive exploration. However, early studies often prioritised technical possibilities over robust pedagogical frameworks. 5 More recent work has begun to integrate pedagogical approaches, including didactic and “flipped” learner-centric models within Constructivist frameworks4,6 and incorporating experiential learning modes. 7 While XR holds significant promise, technical hurdles such as staff skill gaps, lack of standardization, hardware costs and potential user discomfort3,8 remain considerations for long-term adoption.
Practical laboratory instruction is a cornerstone of undergraduate education, fostering essential problem-solving skills. 9 Digital learning content offers flexibility and adaptability, enabling continuity in teaching and supporting iterative curriculum development. 10 Despite the potential, many institutions have yet to fully integrate immersive XR experiences, even as students express a demand for more experiential learning spaces. 7 The integration of XR alongside e-learning and blended learning tools can yield significant pedagogical and cognitive benefits, while also offering logistical advantages such as alleviating physical lab constraints and enhancing accessibility.4,8,11
This study builds upon previous work,
12
which provided an initial overview of the project's background, simulations and preliminary findings. This manuscript expands significantly on the detailed methodology, data analysis, and comprehensive discussion of results. Specifically, we investigate the relationship between simulation immersion, fidelity, and memory recall by comparing three distinct digital simulations designed to replicate a practical engineering laboratory: a 2D photography-based “iLabs,” a web-based low-fidelity simulator and an immersive Virtual Reality (iVR) simulator. The objective is to evaluate their comparative effectiveness in relation to a series of previously identified, outstanding research questions:
L1. To what extent does iVR impact learning outcomes in comparison to a nVR counterpart? L2. Can a specific form of digital flipped learning enhance student learning during subsequent in-person laboratory sessions? L3. Do multilingual interactions in iVR offer advantages in learner experiences when contrasted with nVR alternatives? L4. Does a decrease in visual fidelity or detail impact learning performance? L5. How do the costs vary across different digital approaches, and how does this correlate with their pedagogical impact?
In addition, the following have been posed by the authors to compare different software/hardware approaches:
S1. Is there a difference in the workload experienced by a student using iVR versus nVR simulations? S2. To what extent does the enjoyment or novelty of an experience affect the student perception of usefulness?
Research methodology
This study investigated the comparative effectiveness of different digital simulation fidelities on learning outcomes and memory recall in an authentic educational context. The research utilised the 3-point beam bending test, a classic undergraduate engineering laboratory experiment. In this experiment, students explore the relationship between applied load and deflection for various beam samples, comparing experimental results with theoretical predictions using the fundamental beam deflection equation (equation 1): δ = PL3 / 48El, Where δ is the beams central deflection (mm), P is the load (N), E is the Young's modulus, I is the second moment of area and L is the beams supported length (mm).
This experiment provides insights into how cross-sectional geometry influences bending stiffness. The experiment is conducted annually with a large cohort of approximately 600 students, providing a robust opportunity for gathering statistically significant pedagogical data.13,14 The existing structured integration of Virtual Learning Environment (VLE) based “pre-lab” activities allowed for the deployment of varied digital learning experiences with differing levels of interactivity and fidelity, central to this research. 15
Study design and participants
A cohort of 250 first-year Mechanical Engineering students participated in this study, randomly assigned to one of four groups. All groups completed a standardized formative pre-lab Health and Safety quiz, participated in the physical laboratory session and completed a post-lab test for the 3-point beam bending activity. The key differentiator between the groups was the assigned digital pre-lab experience, designed to precede their engagement with the practical experiment. One group served as a “control,” completing only a standard multiple-choice pre-lab quiz without any digital simulation. All “Simulation Activity” groups were given equivalent timetabled in-laboratory session allocations for their assigned pre-lab activities (approximately one hour, with either a laptop or a laptop and VR headset depending on the grouping). Time-on-task was standardised across conditions to minimise the effects of unequal preparation time. Any differences in self-reported engagement duration were therefore due to user choice, rather than the design of the intervention. The exception to this was the “control” activity “Pre-Lab Quiz”, which gave the students the typical non-timetabled time allocation effectively as an extension of the “VLE H&S Quiz” stage.
The experimental workflow for each cohort is illustrated in Figure 1.
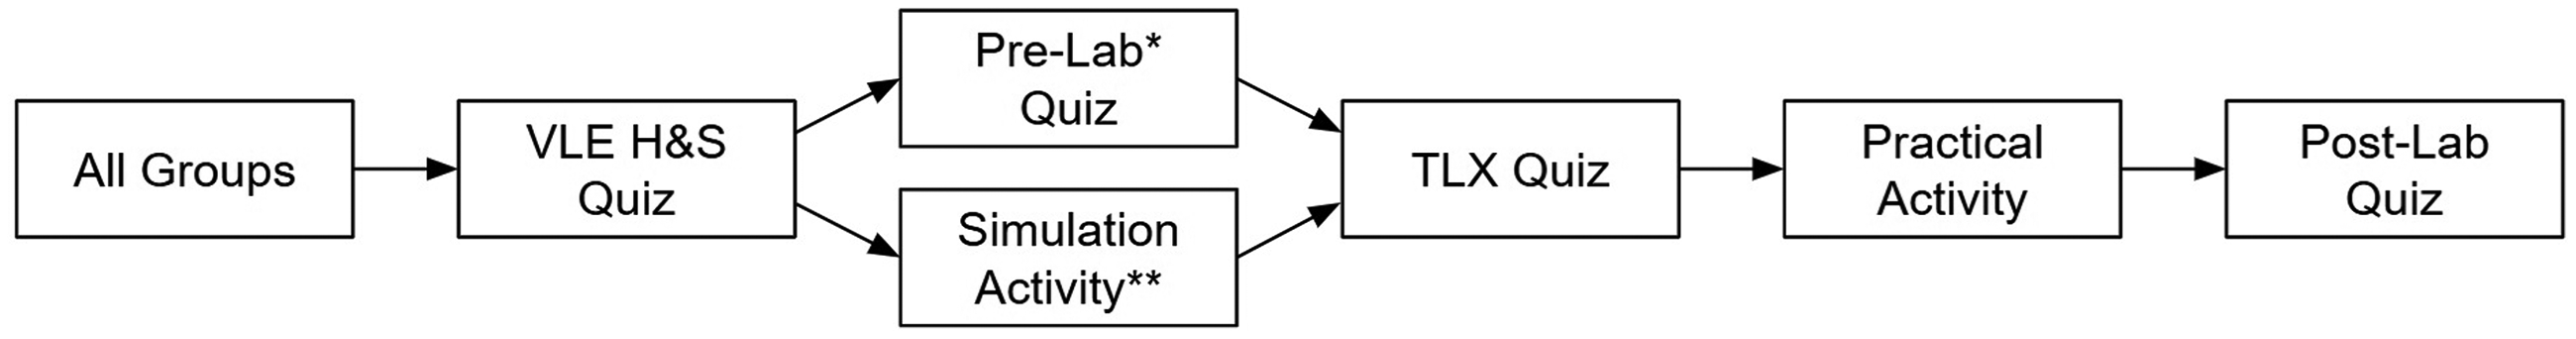
Breakdown of study route per cohort. Note. *Standard practical “Control” activity only has one group. **Simulation and standard practical activity, all other groups.
Digital simulation development
To address the research questions concerning display/simulation fidelity and its connection to the reinforcement of learning outcomes and memory recall, 16 the three distinct digital simulations featured varying degrees of visual immersion and detail (see Figure 2), whilst sharing the same “digital twin” numeric data that is empirically derived from the actual laboratory equipment. This approach facilitated a direct comparison of the benefits offered by 2D and 3D simulations. 17
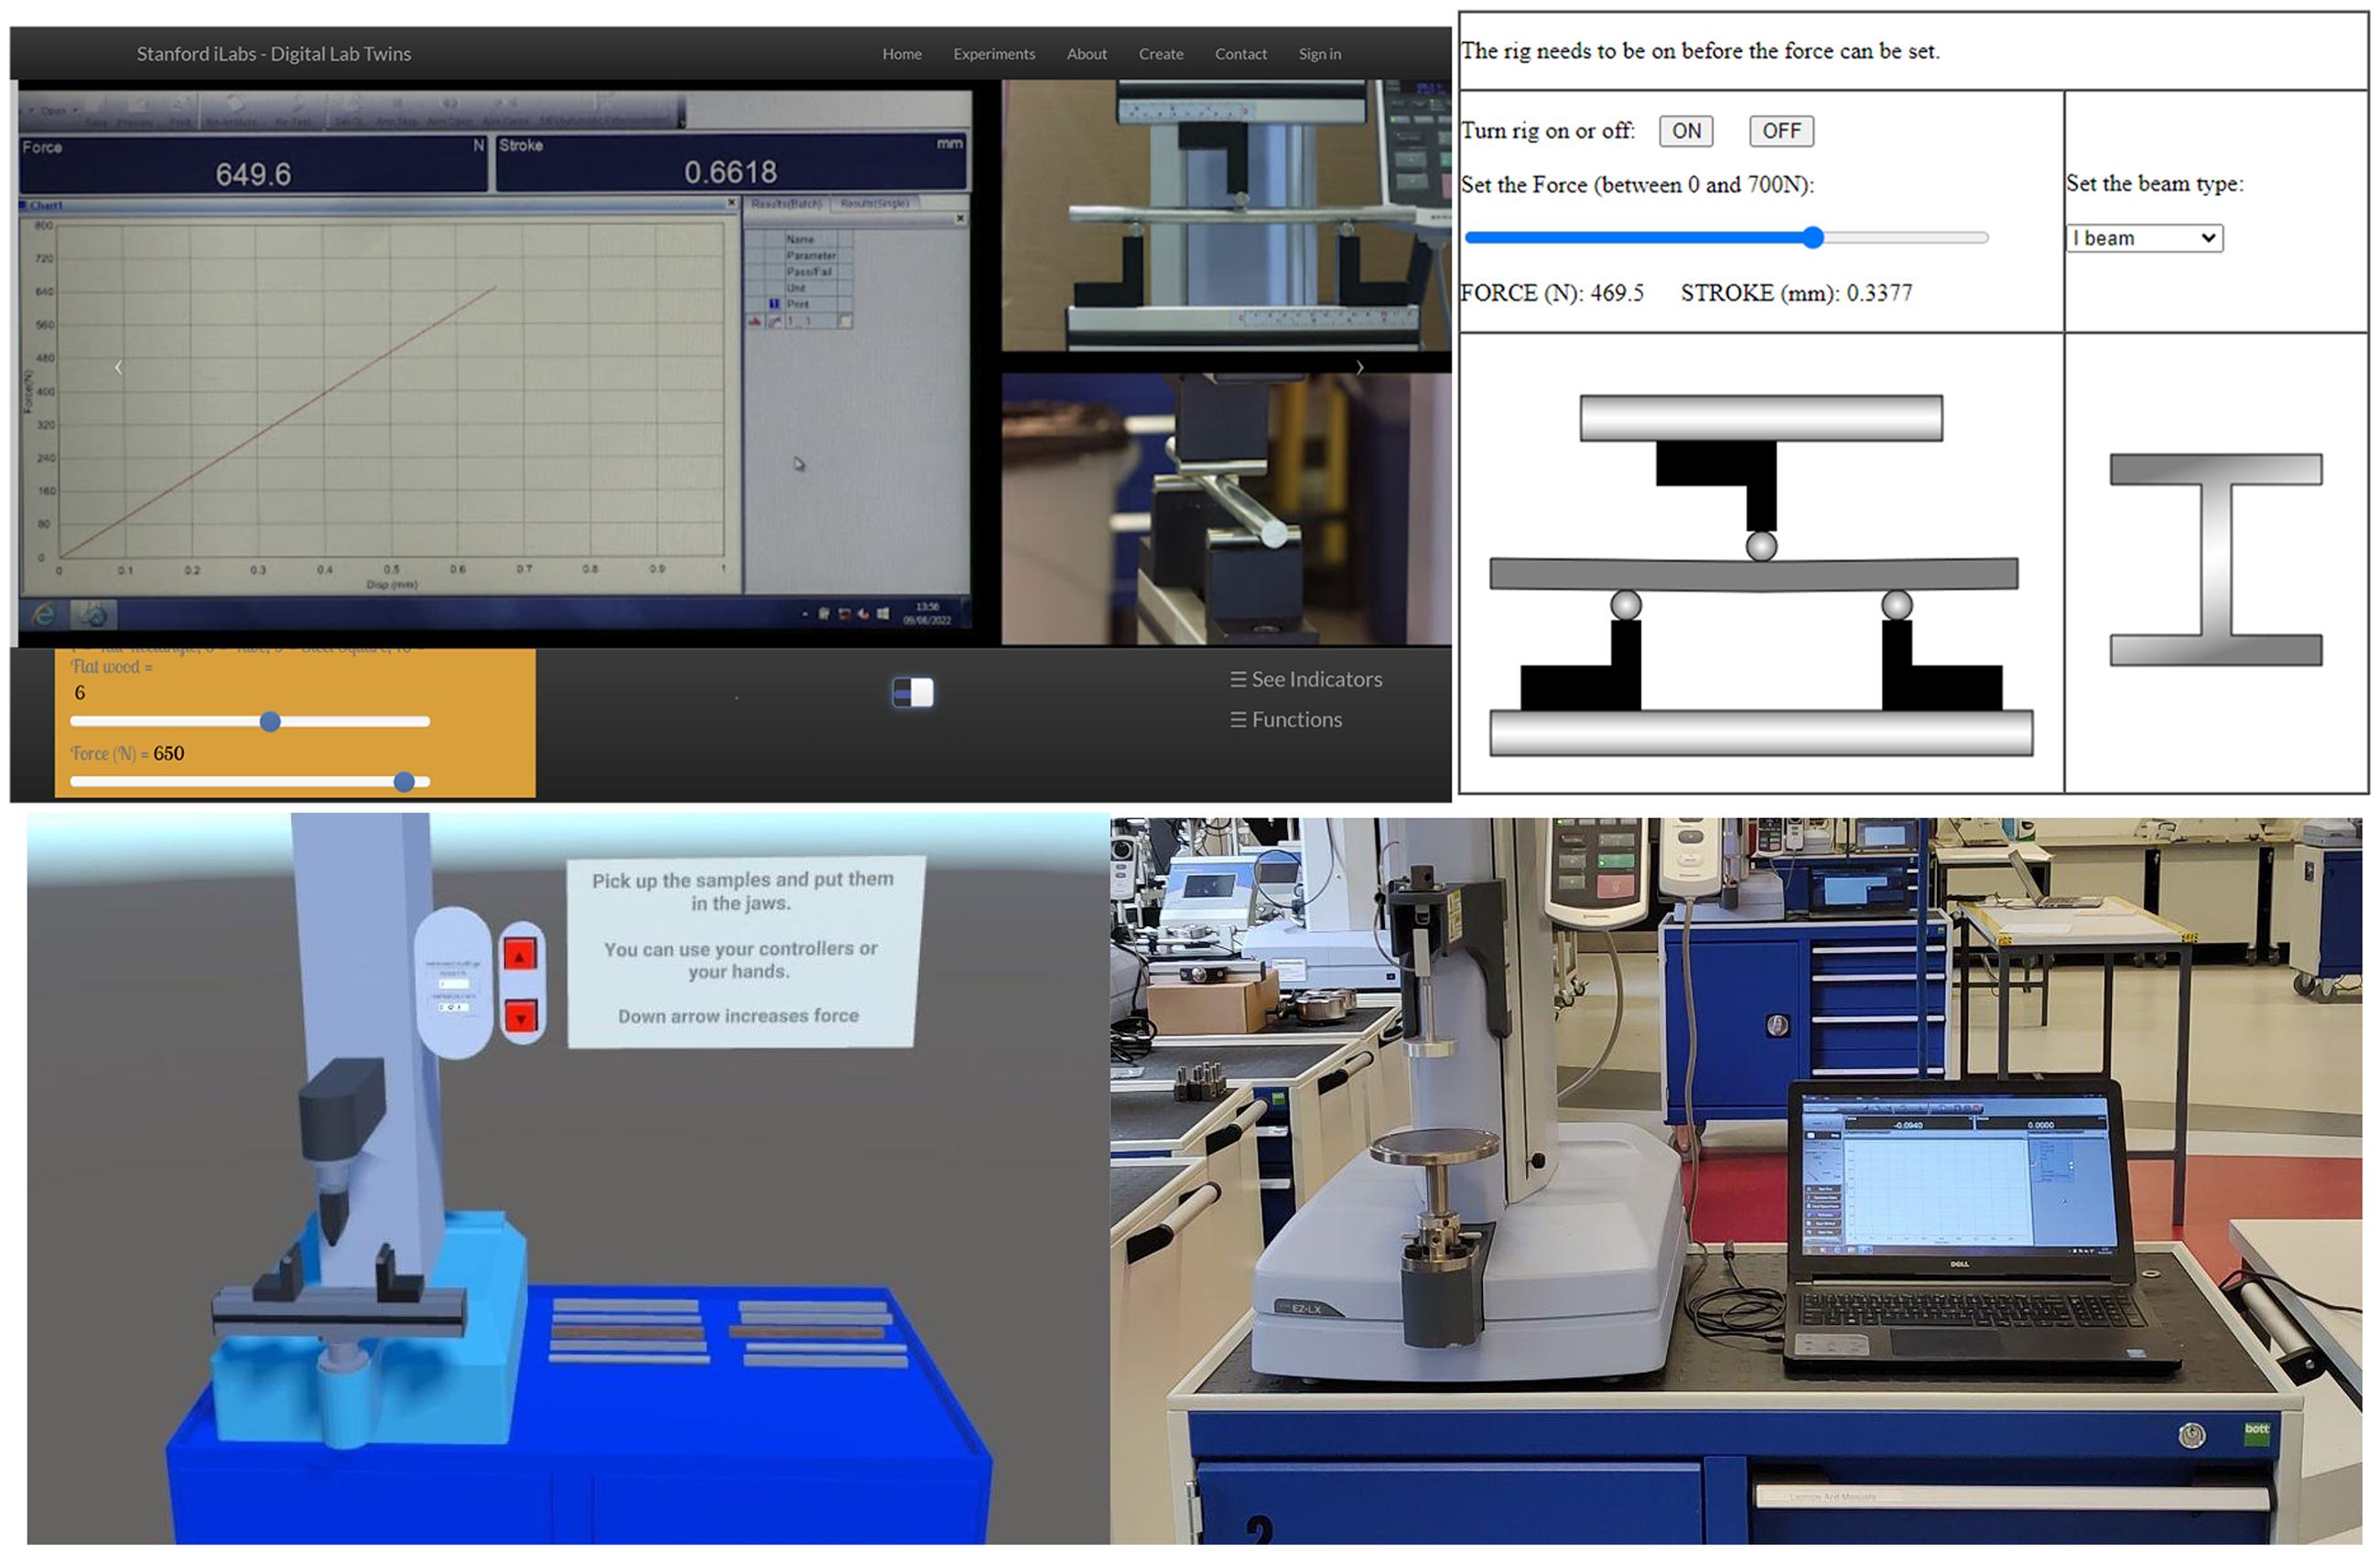
Examples of digital simulations used in the study. Note. Typical web browser views of the iLabs simulation (Top Left) and “Lo-Fi” html based simulation (Top Right). In headset view of the iVR Unity simulation (Bottom left) and the real Shimadzu EZ-LX Universal Tester machine (Bottom right).
iLabs 2D simulation
The iLabs 2D simulation allows students to interact with pre-recorded photographic images and numerical data representing various output states corresponding to specific input parameters on the actual experimental apparatus. Students accessed this web-based interface to control variables and observe resultant deflection, mirroring real experiment conditions. 17
Web browser-based “Lo-Fi” simulation
The “Lo-Fi” simulation is a straightforward, web browser-based tool characterised by its simplicity in graphics and modeling. It allows for the construction of experimental systems with interactive elements for input parameters and displays numerical or graphical outputs. This simulation mimics the behavior of the physical system, with deflection calculated using empirically measured coefficients. It also includes an optional introduction of controlled experimental error to represent real-world laboratory conditions more closely.18,19
Unity iVR simulation
A fully customised iVR experience was developed using the Unity game engine (version 2020.3.34f1), for use with Meta's Quest 1 & 2 XR headsets. The simulation's geometry was created based on the actual experimental apparatus, focusing on essential components to provide visual cues for operating the experiment and facilitating experiential learning. The program incorporated controller and hand tracking interactions, allowing users to select samples, position them and adjust applied force. Resultant deflection was displayed within the 3D models, accompanied by appropriate visual readouts of the forces applied and deflection created based on the same empirical data as the other two simulations.20–22
Feature comparison
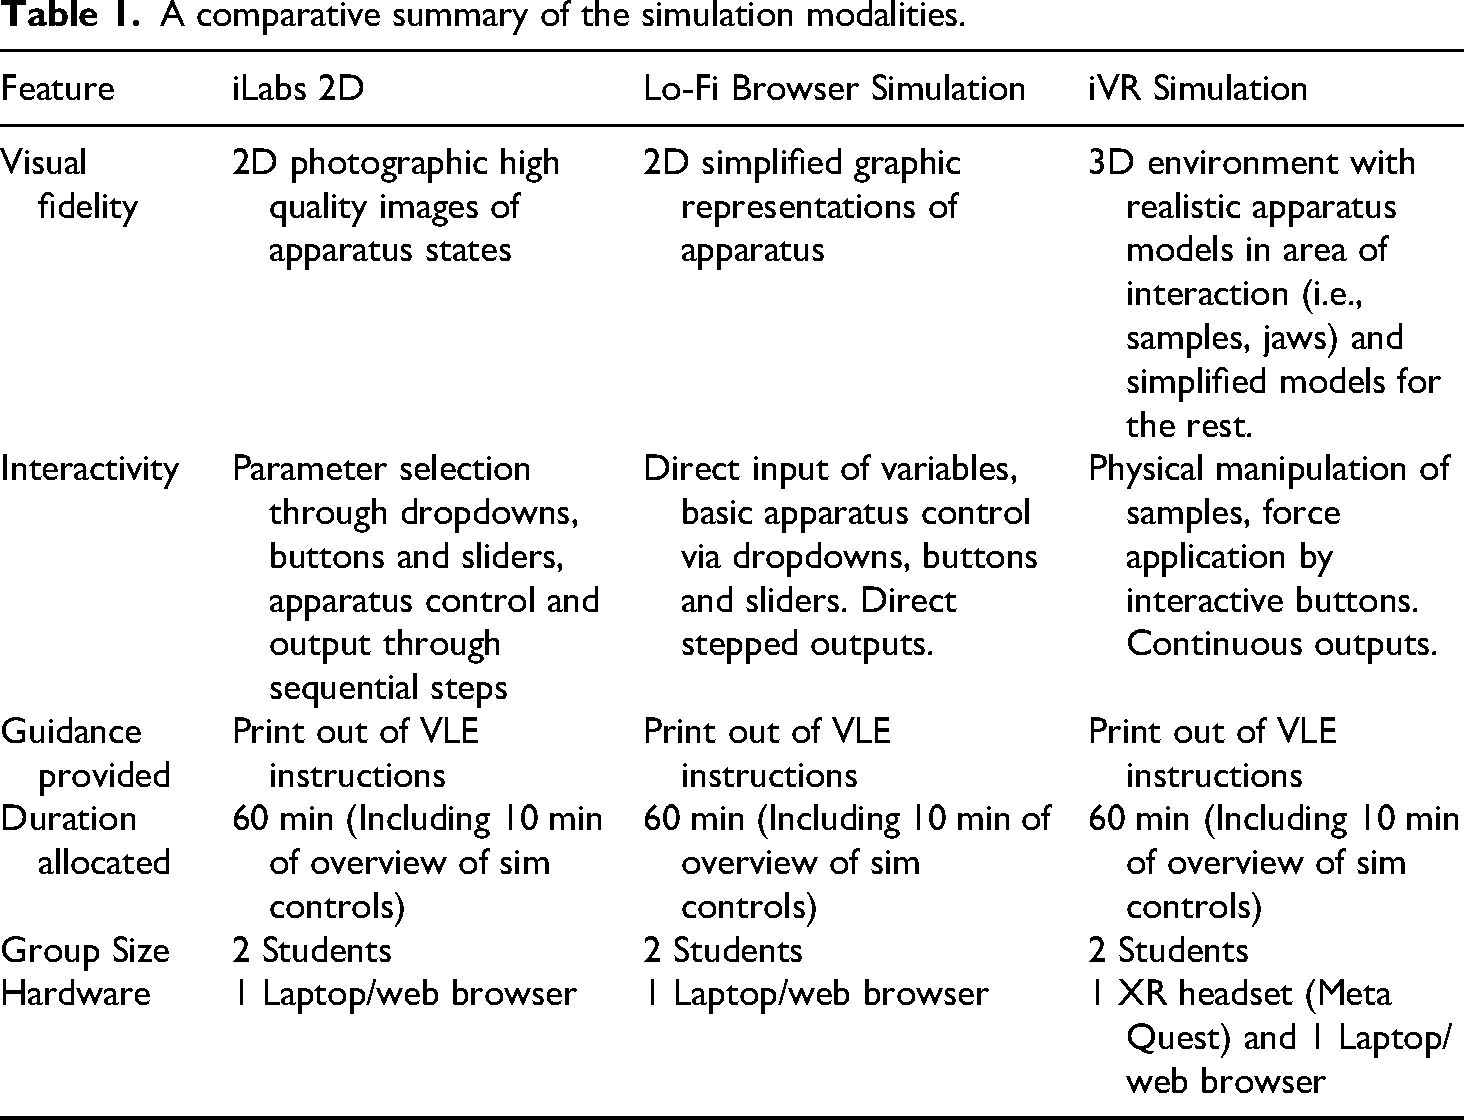
In this study, the term ‘low-fidelity’ refers to simulations that provide limited graphical realism and simplified interactivity compared to immersive XR systems, while still replicating the underlying conceptual principles of the physical experiment. To ensure consistency, all three digital pre-lab experiences targeted the same learning objectives and included identical instructional prompts, see Table 1. provides a comparative summary of the modalities.
A comparative summary of the simulation modalities.
Methods of assessment
The data capture methodology employed in this study encompasses two primary categories: pedagogical testing aimed at assessing student achievement of learning outcomes and the capture of students’ experiential learning. In the literature, the qualitative aspects of participation experience, which are less explicitly linked to learning outcomes, have been addressed using self-reported psychological assessments. 23 This involves strategies such as employing questionnaires based on various frameworks. Given that this study is geared towards hypothesis testing, refining testing protocols and involves a relatively small sample size, sampling was approached from a non-probability (theoretical/grounded theory) standpoint, as the dataset generated would be insufficient for comprehensive statistical analysis. 24
Quantitative approaches
To streamline and quasi-quantify data collection, a combination of NASA's Task Load Index (TLX)25,26 and Likert-framed questions were utilised to evaluate user experience and discern factors associated with the different digital platforms. These methodologies were selected due to their successful application in similar VR/multimedia comparison studies documented in the literature.27,28 Moreover, these approaches are highly suitable as they can be seamlessly integrated into a VLE and facilitate comparison to a known standard (e.g., the traditional pre-lab), thereby providing concurrent validity in the analysis. 4
The TLX workload assessment questions are subdivided into six subscales: mental demand, physical demand, temporal demand, performance, frustration and effort, with subscale scores ranging from 1 to 100. This was implemented within the Blackboard VLE, alongside a standard Likert questionnaire featuring a 7-point scale, with response indicators spanning from variations of “strongly disagree” to “strongly agree”. For analytical purposes, the Likert data was converted to a numeric equivalent ranging from 1 (“strongly disagree”) to 7 (“strongly agree”). The Likert questions encompass data collection concerning prior digital media experience and culminate with inquiries regarding measures of usability beyond workload. These measures include prior experience with computer interfaces, prior familiarity with VR/XR hardware, enjoyment, attention, affectiveness, usefulness, comprehension, ease of use, sense of control, sense of immersion and interactivity. Additionally, a final open-ended text box was included to solicit optional written feedback.
The post-laboratory test is also administered to participants through the VLE (Figure 1), featuring a structured format to assess achievement of the learning outcomes, comprising six diagnostic summative questions. Four of these questions are closed Multiple Choice Questions (MCQs), encompassing a mixture of single and multiple selection types, while the remaining two questions require a value falling within a specified tolerance range.
For the analysis of the data collected, a number of statistical tests were performed. Based on the null hypothesis of “There is no statistical difference between the three groups of answers” i.e., iVR/iLabs/Lo-Fi perform the same, a non-parametric Kruskal-Wallis test was employed on the Likert and TLX datasets. This was represented as a H value against a critical chi-squared value of 5.99 with an associated confidence level of 5% and 2 df. A value of H above the critical number was considered to not support the null hypothesis and therefore be significant.
In addition, a Cronbach's alpha calculation was performed independently on each dataset, grouping the Likert questions by similar category to assess if the answers given had similar trends. It's worth noting, this was included as an indicator of generally correct thematic engagement with the questions between pre-lab types, rather than a corroboration of answer validity dependent on question phrasing.
The post lab test scores were processed as intervallic (numeric) data, as the answers were aggregated values across all questions per dataset based on whether they were correct or not. Following an analysis of equality of variance, three independent T-Tests were performed with a 95% confidence interval, comparing the intervention (simulation) groups with the control group (standard pre-lab).
Qualitative content analysis
Participant feedback collected in the open-field section of the form in response to the question “Do you have any other feedback about the activity?” was processed using a simple qualitative content analysis approach, aided by the use of OpenAI's ChatGPT (v3.5) artificial intelligence (AI) Large Language Model (LLM). The data from each simulation group was processed in a series of steps, initially categorising each comment as having positive or negative sentiment and assigning + or - labels. The labelled responses were then grouped according to similar positive or negative themes, this was further subdivided into sub-themes or categories and then coded again for a final thematic analysis, the results for each stage were then verified by the authors. The transcript, prompts and interactions with ChatGPT demonstrating this process are available in the study data repository. 29
Results and discussion
The experiment was run in multiple sessions over the course of two weeks of scheduled teaching. Of the 250 students attending the laboratory session, the following numbers consented to take part in the study within the sub-groups. For the pre-lab stage; 45: iVR, 46: Lo-Fi and 54: iLabs. For the post-lab tests; 8: iVR, 16: Lo-Fi, 5: iLabs and 6: control group. The datasets with processing methods are available from the authors. 29
Likert data
Table 2 shows the mean Likert values for each of the different datasets and the standard deviation for each value in brackets. The calculated Kruskal-Wallis chi-squared values (H) are shown in the column at the end of the table, results with an asterisk (*) demonstrating Likert results of statistical significance between the data sets.
Average Likert responses to each question in the pre-lab dataset with standard deviation in brackets, plus Kruskal-Wallis H values.
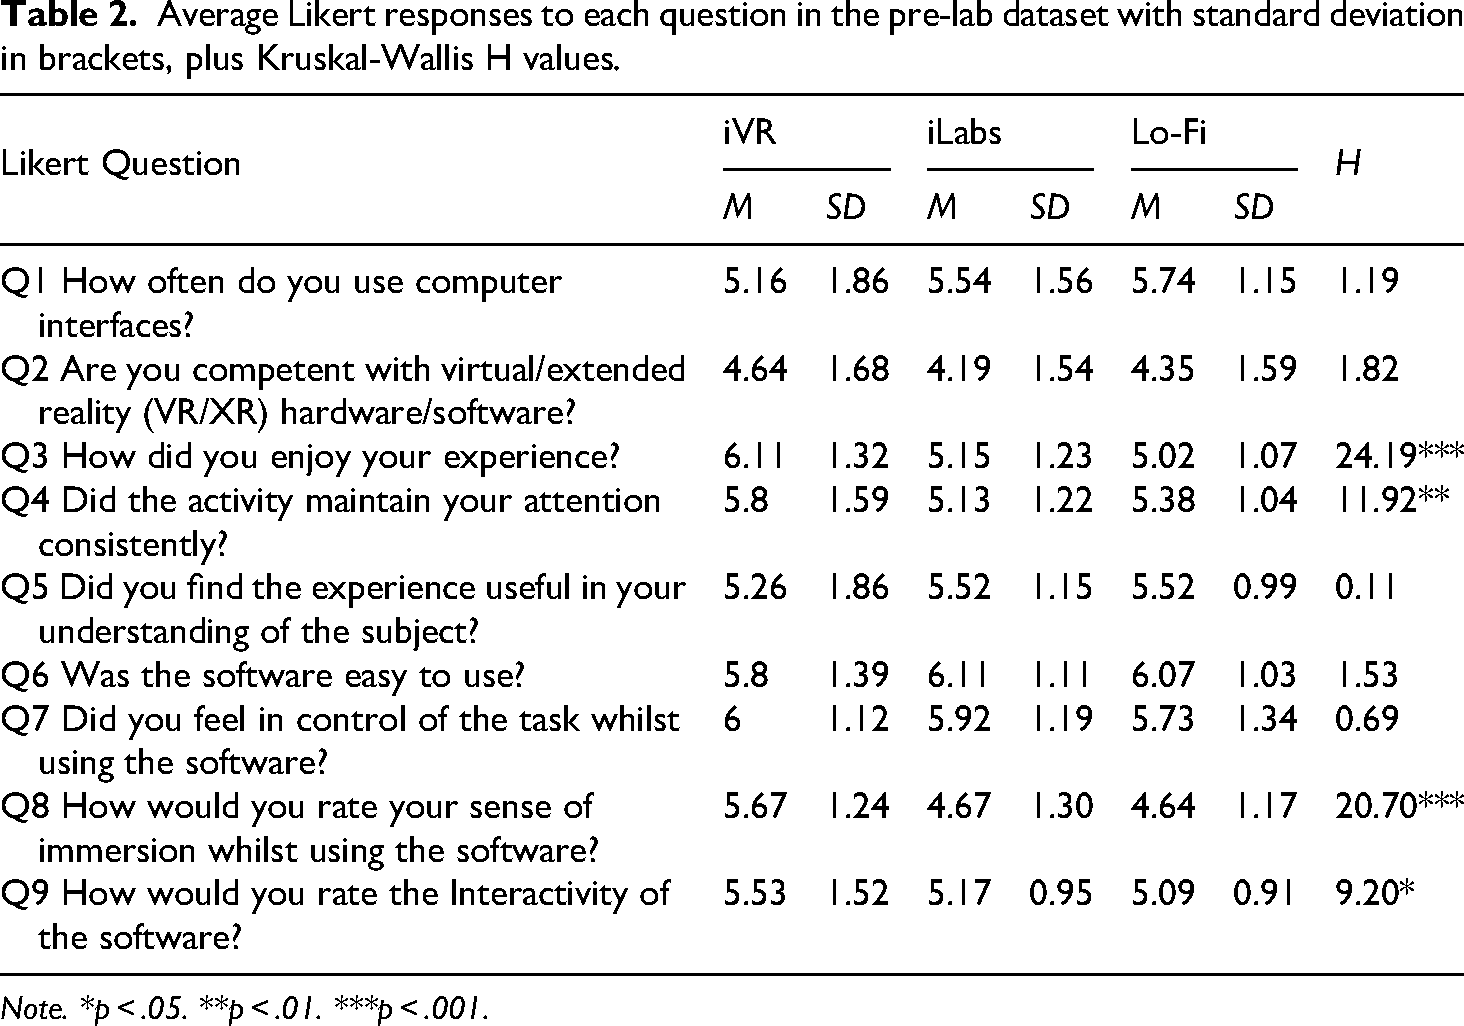
Note. *p < .05. **p < .01. ***p < .001.
TLX data
The data in Table 3 shows the mean TLX values for each workload criteria of the different datasets, the standard deviation for each value in brackets. The calculated Kruskal-Wallis chi-squared values (H) are shown in the column at the end of the table, results with an asterisk (*) demonstrating the TLX demands of statistical significance.
Average TLX responses to each type of workload (plus total) in the pre-lab dataset with standard deviation, plus Kruskal-Wallis H values.
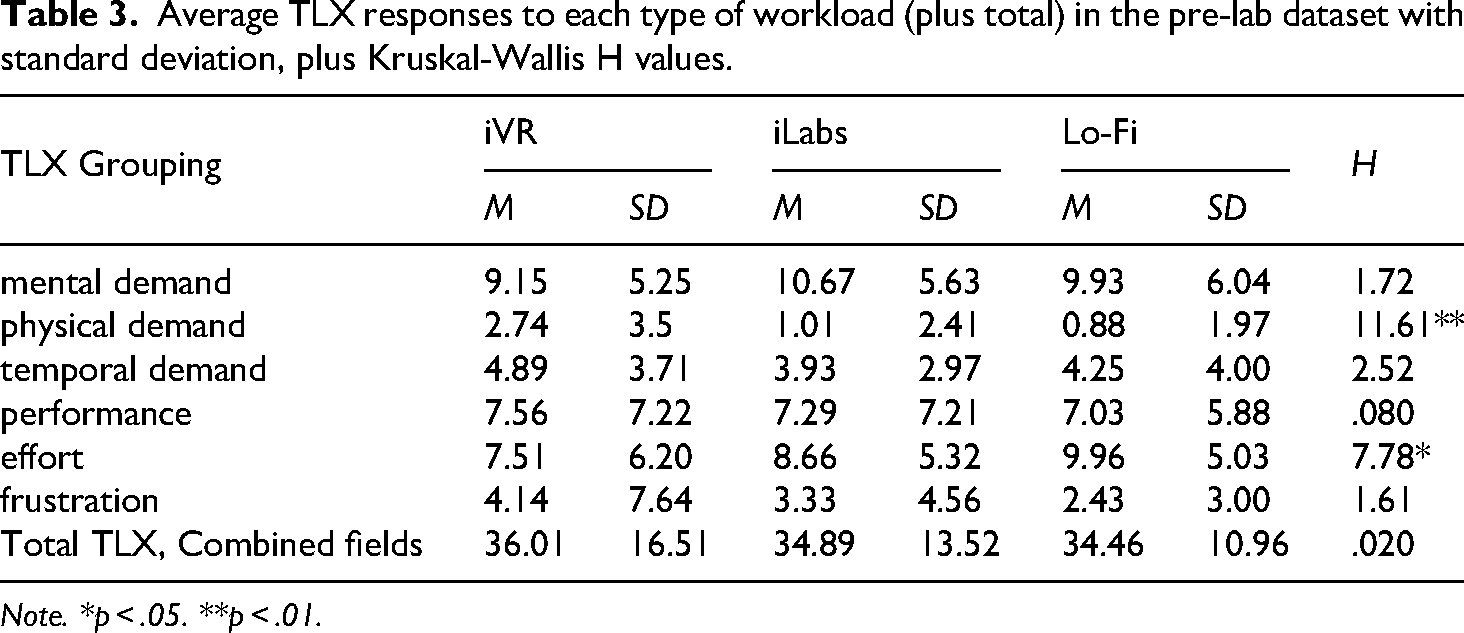
Note. *p < .05. **p < .01.
Open field data
The raw data for the responses, plus the transcripts of the thematic analysis are included in the dataset provided by the authors. 29 Relevant excerpts and analysis are summarised in section 4.5.
Post lab data
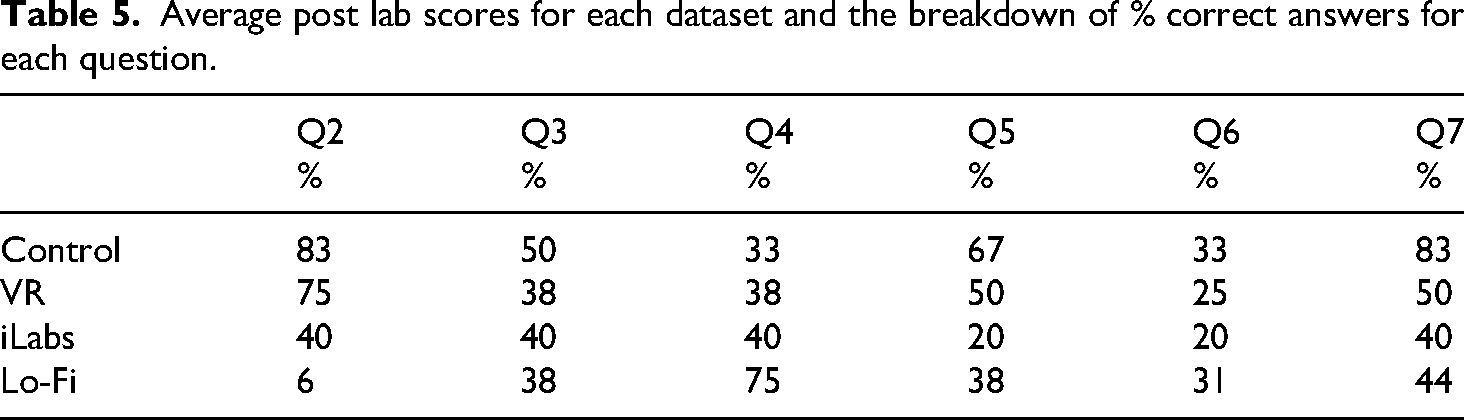
Table 4 shows the mean and associated standard deviation (in brackets) for the correct answer results of the four different post-lab datasets, including the control group. Three heteroscedastic independent T-Tests that were performed comparing the intervention groups with the control group are also shown. The average number of correct answers for each post lab question as a percentage are shown in Table 5.
Average post lab scores per dataset with standard deviation, plus control comparative T tests.
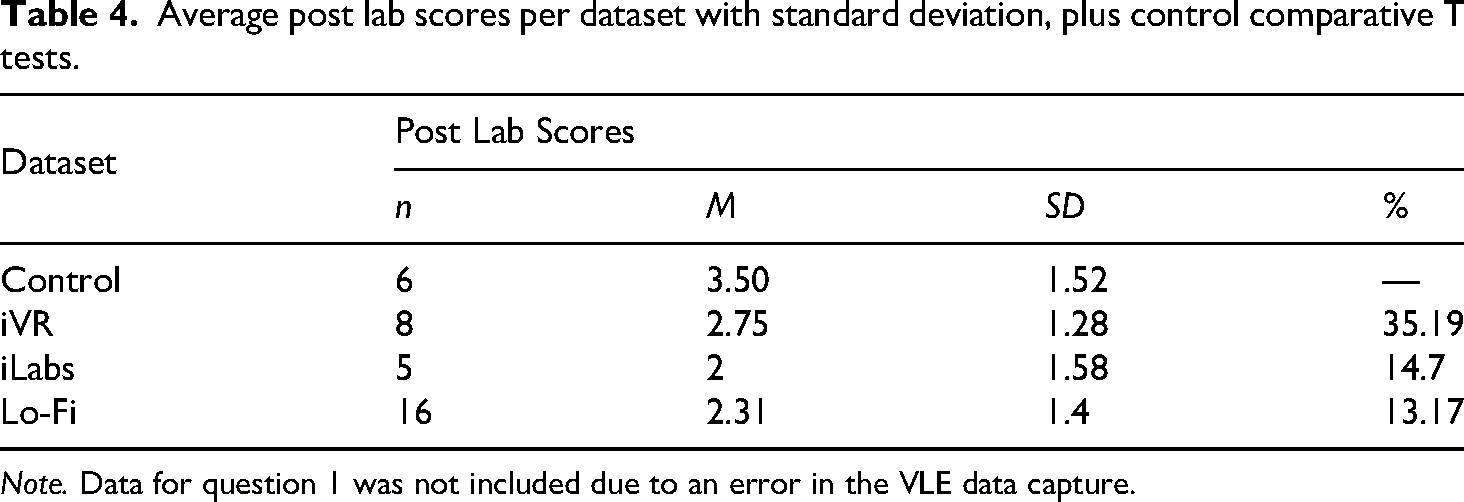
Note. Data for question 1 was not included due to an error in the VLE data capture.
Average post lab scores for each dataset and the breakdown of % correct answers for each question.
Analysis
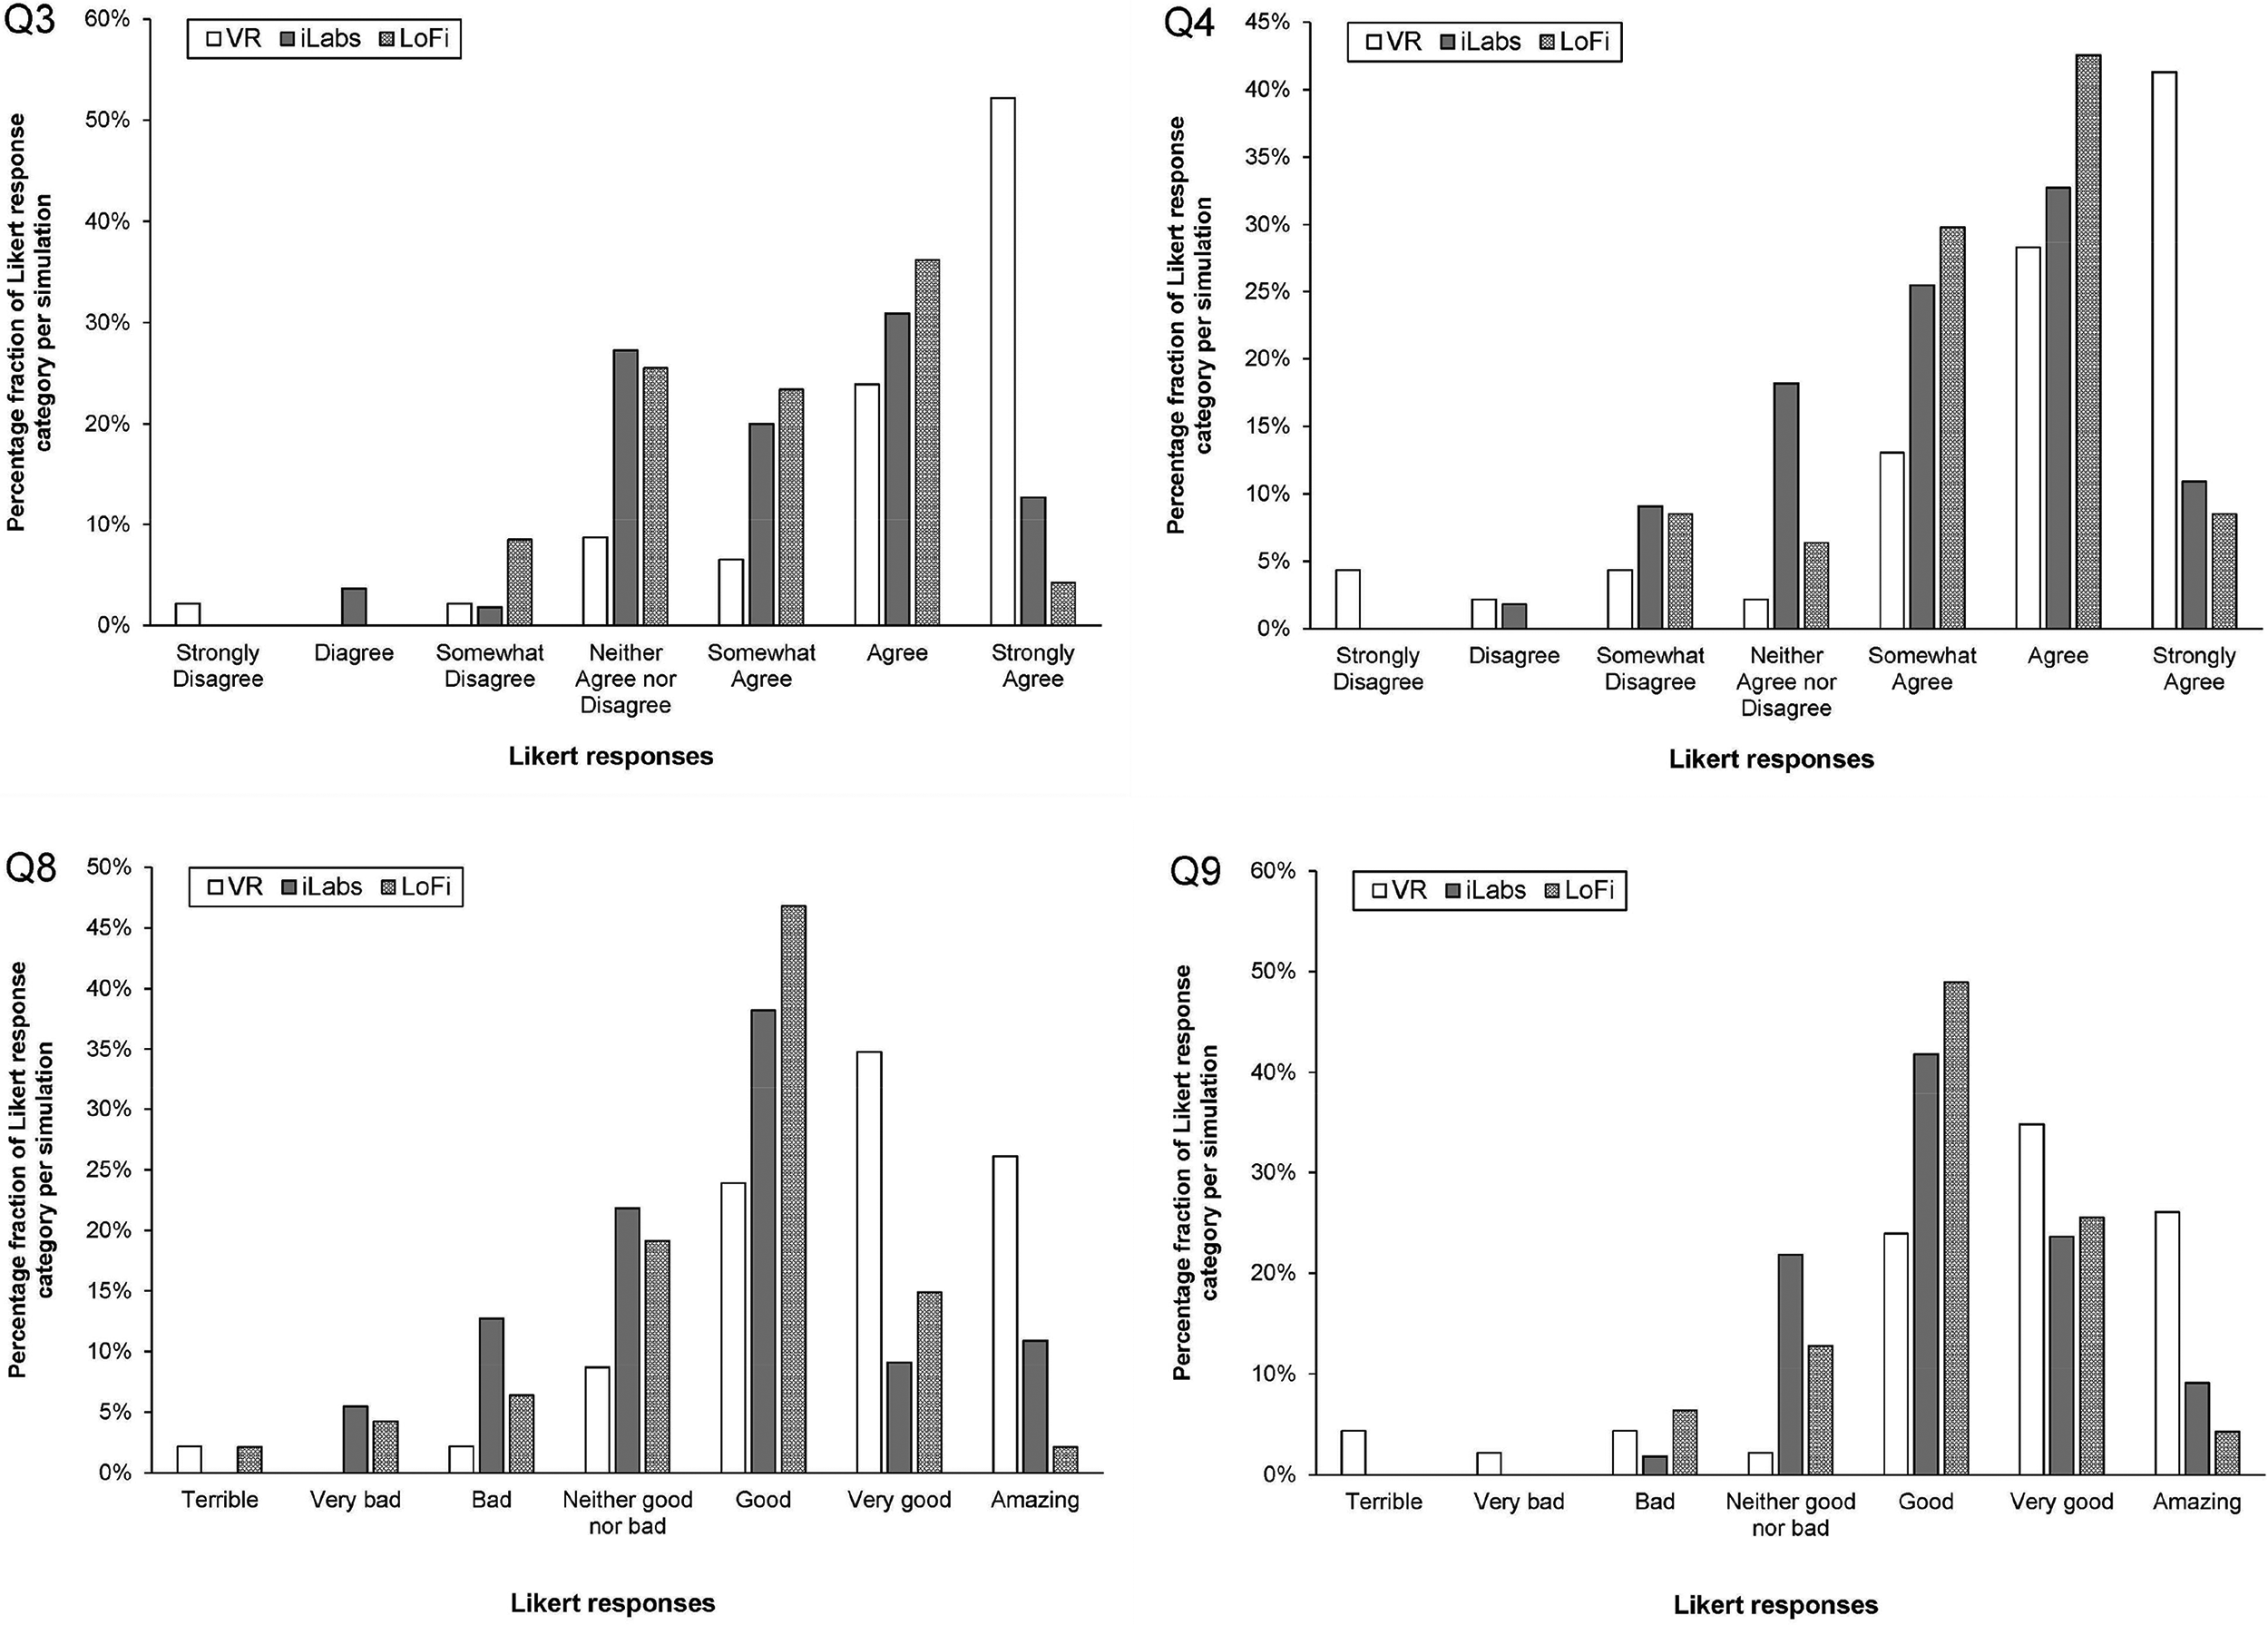
Based on the questions raised in section 1 (L1-5, S1-2), the results of the study provide many interesting insights into the students’ interaction with the three different types of digital lab simulations and their associated learning experiences. It should be noted, however, that no responses were submitted by the control cohort, who only completed the VLE-based quiz alternative. The pre-lab Likert and TLX datasets show remarkably consistent response metrics between the different simulation types, as reflected by the H values being lower than the critical value. The main exceptions to this trend in the Likert data (Table 2, Figure 3) are for the iVR, which had a positive correlation with respect to both the iLabs and Lo-Fi in the following areas; Q3: Enjoyment (H = 24.19, p = <.001), Q4: Maintenance of attention (H = 11.92, p = .003), Q8: Sense of immersion (H = 20.7, p = <.001) and Q9: Interactivity (H = 9.2, p = .010) where p is the asymptotic significance (p- value). The iVR values of H and the associated means were so large with respect to the other datasets, validation with the Mann–Whitney post hoc test was not deemed necessary.
Cronbach's alpha values by question grouping in Table 2.
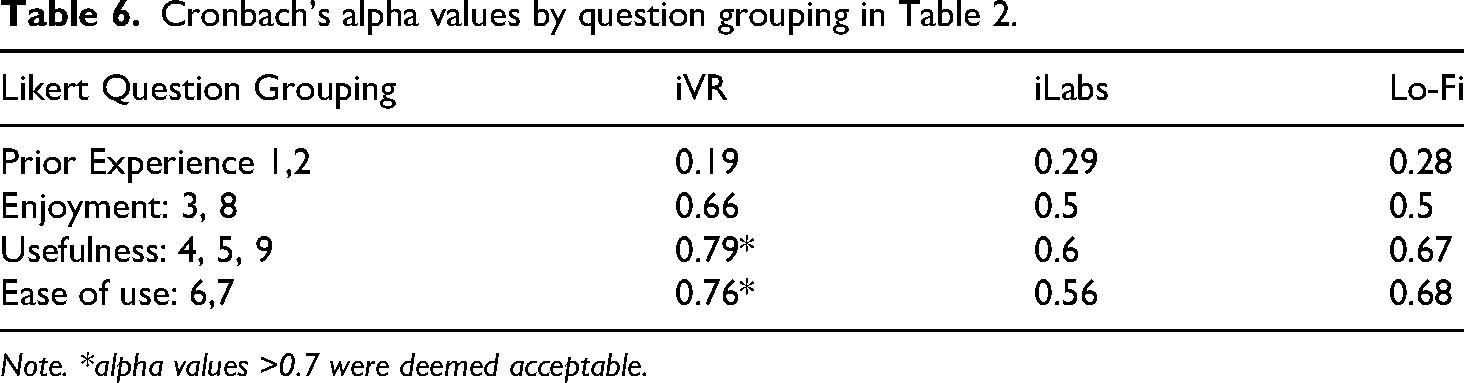
Note. *alpha values >0.7 were deemed acceptable.
The level of Cronbach's alpha correlation with the data sets (Table 6), was poor for Q1-2, 0.19, 0.29, 0.28 for iVR, iLabs & Lo-Fi, this was partially expected as they are assessing very different types of hardware/software. The other categories of Enjoyment and Usefulness, show much better alignment with 0.66, 0.5, 0.5 and 0.79, 0.6, 0.67 in the same sequence described above. These categories correspond to the significant H values associated with Q3,4,8 & 9, which adds credence to uniformity of response across the datasets and a genuine trend.
The TLX data (Table 3) showed two categories of workload that had significant H values; Physical demand (H = 11.61, p = .003) and Effort (H = 7.78, p = .020). It is worth noting that the Effort variance is not toward one dataset, unlike the iVR correlation with greater Physical demand. The increased physical demand for iVR is understandable, as the simulation required physical real scale movement in order to complete, just like the actual lab itself. The effort workload is interesting (Figure 4) as it seems to highlight the lowest fidelity simulation (Lo-Fi) requires the most effort to use, followed by the iLabs then iVR with M of; 9.96 (SD = 5.03), 8.66 (SD = 5.32) & 7.51 (SD = 6.20) respectively. Inversely, the frustration workload has means of 2.43 (SD = 3.00), 3.33 (SD = 4.56) & 4.14 (SD = 7.64), albeit this data spread is not seen as statistically significant. These trends could possibly be an artifact of difficulties with the hardware usage during the sessions, but warrant further investigation as the graduated trend could be indicative of variances in the simulation types. These results partially answer our research question (S1, section 1), as there is a clear workload difference between iVR and nVR simulations.
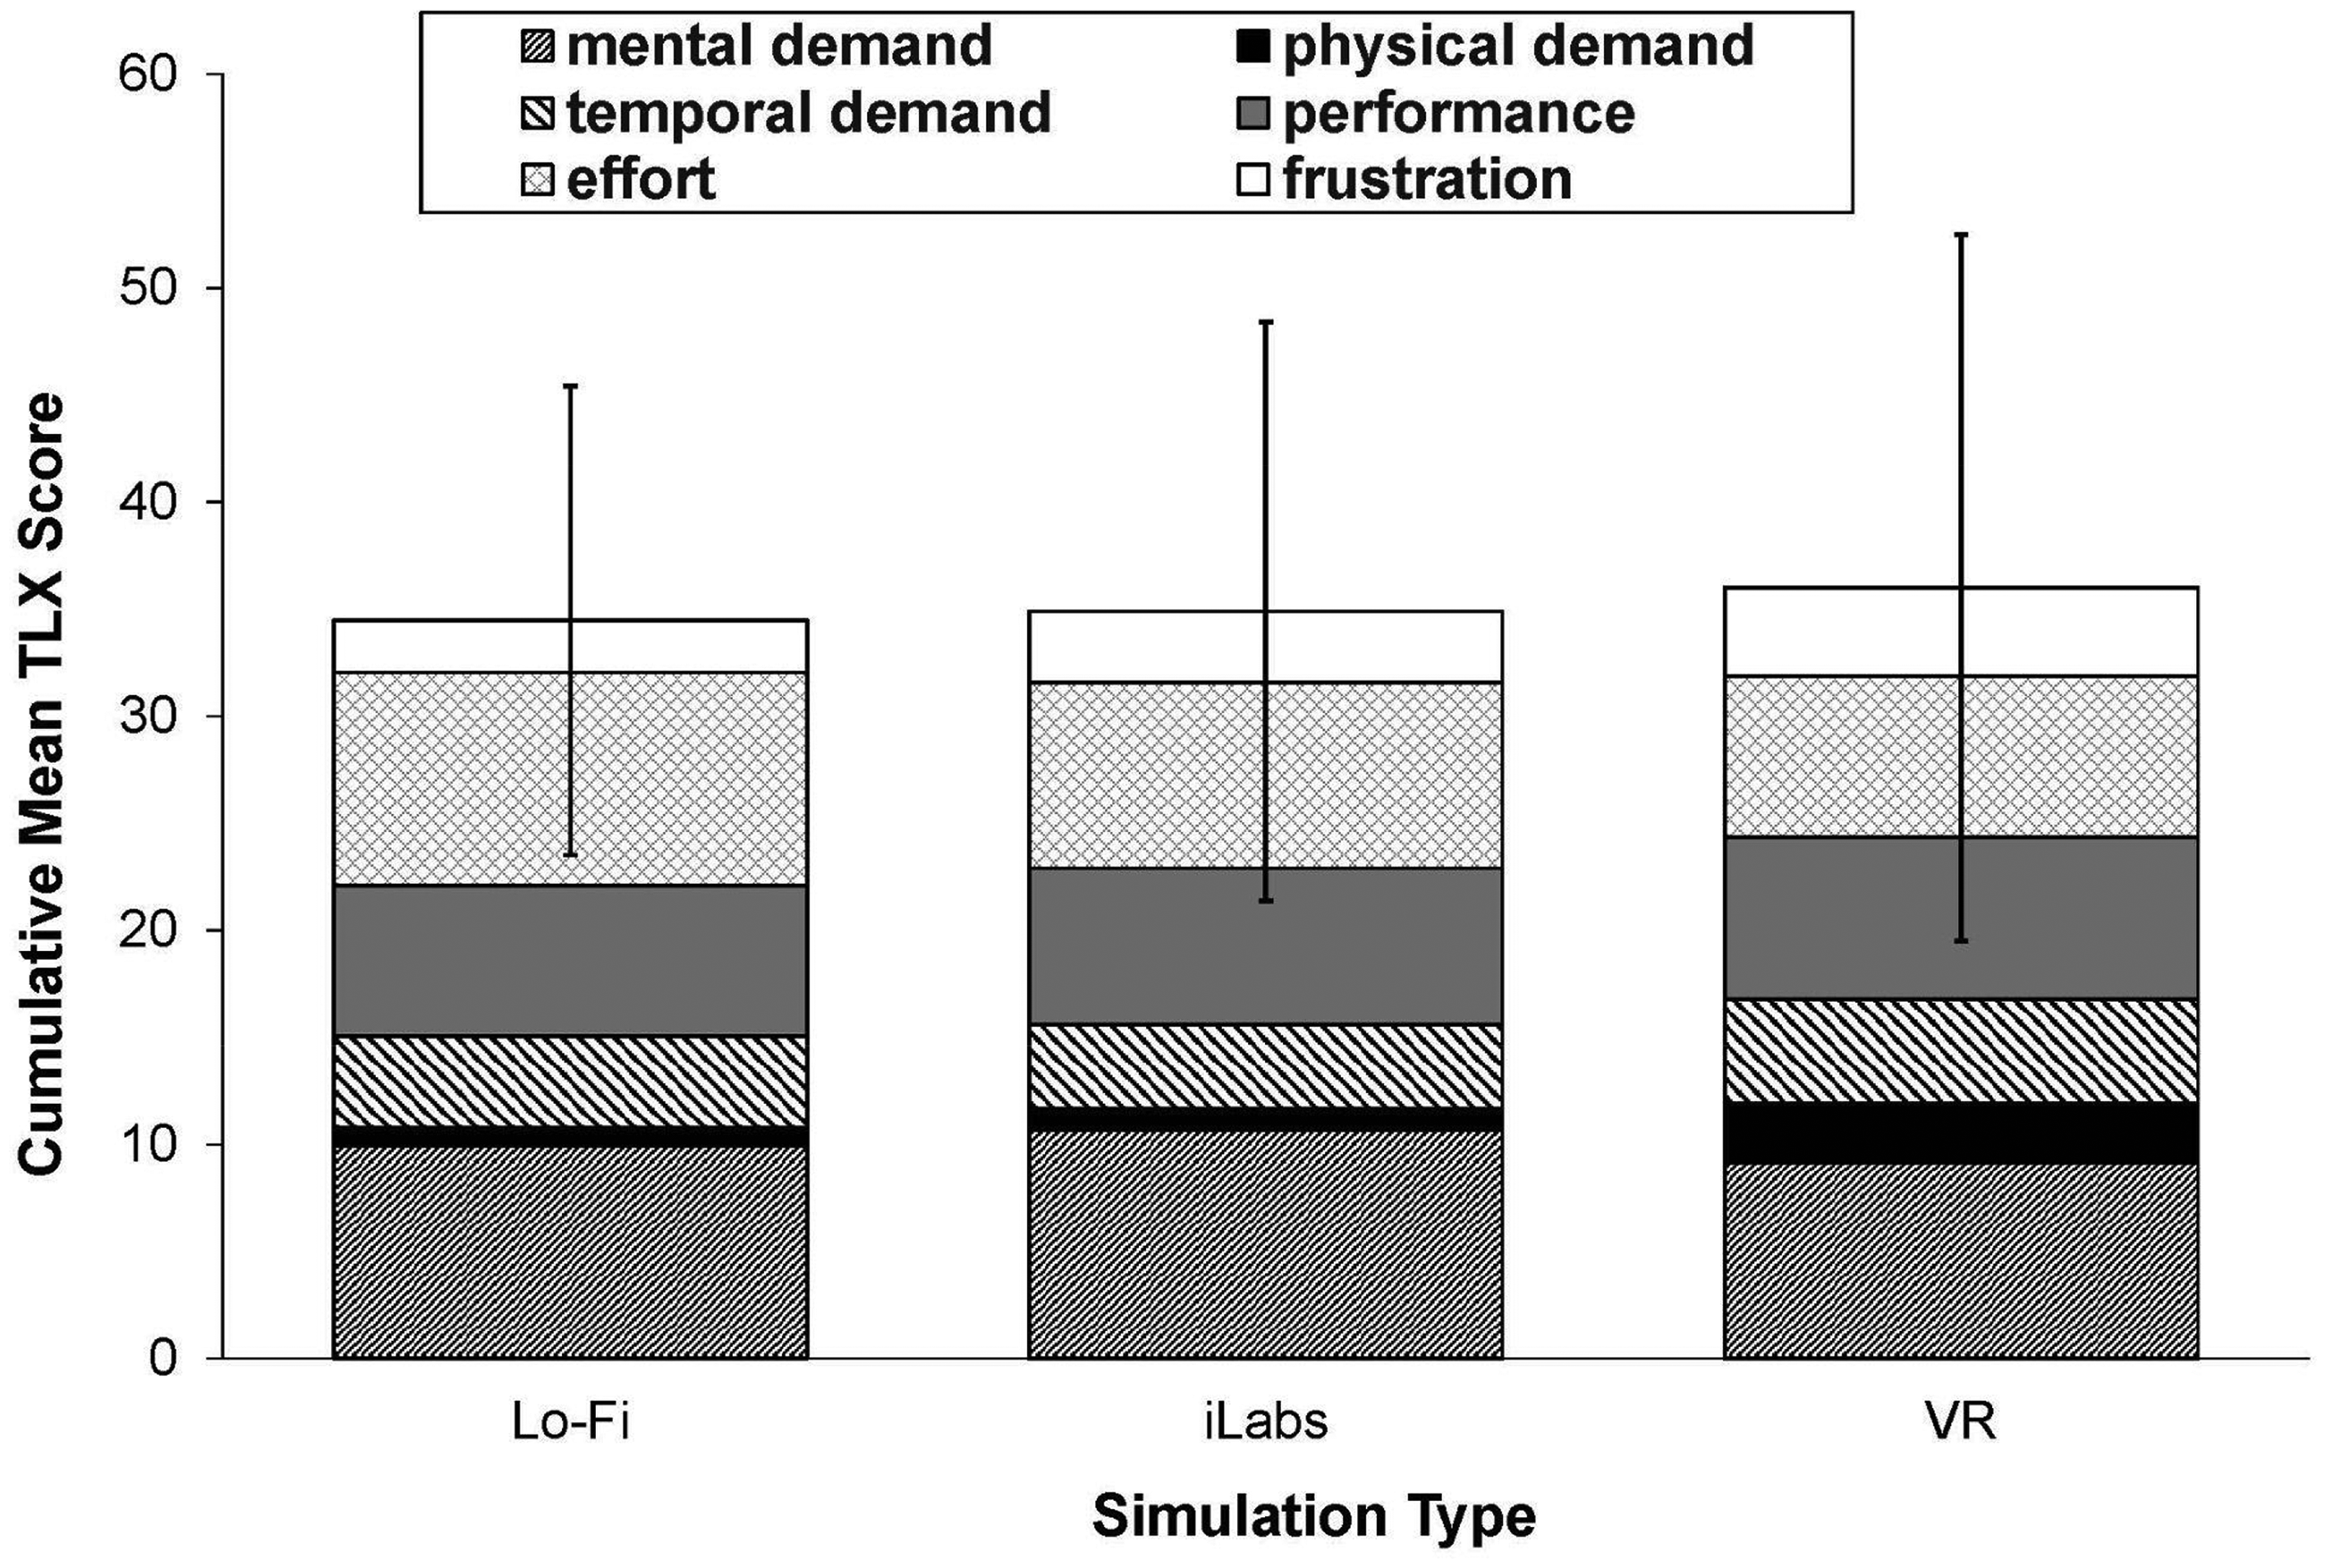
The cumulative mean values of each TLX workload per dataset. Error bars show SD for the combined workloads. Note. Error bars show SD for the combined workloads.
The basic thematic analysis of the iVR responses seems to correlate well with the Likert data trends, showing a minority of extremely negative responses and a majority overwhelmingly positive ones, with multiple comments relating to “experience” and overall enjoyment (Figure 3). The negative aspects were more related to the technical and physical (cyber sickness) issues, coupled with critique of the survey implementation itself rather than the experience of the virtual lab activity. Interestingly one student was highly negative in responses across the board, anecdotally this seemed to be a bias created by a fear that this kind of activity would replace the actual physical lab experience, rather than just augment it.
The written feedback for the Lo-Fi dataset again had mixed results, but with less extremes. Positive responses highlighted ease of use and the ability to be completed at a flexible time. One student also noted that it was good for “visualizing the real event,” which is an interesting reflection of how even lower-fidelity tools can support preparation in a flipped learning approach. Much like the iVR data, however, many of the negative comments referred to the survey implementation, interface issues, and time impacts outside the scope of the study. These highlight the importance of adopting user-centred design principles in simulation development. Future work will incorporate usability heuristics (e.g. Nielsen's framework) and iterative testing with student users to refine accessibility and interaction design. 30 The text data for the iLabs group, much like the iVR, was again very positive in terms of enjoyment and engagement. There were more mentions of feeling “better prepared” and the activity being “effective.” Negative comments were mainly critiques of the interface implementation and hardware, but none about the quiz itself. Only one data point was negative about the experience, stating that it was “not really engaging.” The Likert data correlates well with these comments (Figure 3), showing the iLabs to be the second most “polarising” option.
The impact of the different pre-labs on students’ learning outcomes (L1) was assessed based on the analysis of the post-lab test datasets in section 4.4 (Tables 4 and 5). Unfortunately due to the low sample size versus the pre-lab datasets, the pedagogical merits of each approach cannot be assessed with any degree of acuity. Three heteroscedastic independent T-Tests were performed, with a 95% confidence interval (two tailed), comparing the intervention groups with the control group. We found the test scores not to be significantly changed with respect to the control group, so questions L1, L2, L4 and L5 could not be directly addressed. However, this does not mean that the study has not produced a result. It is entirely possible that all of the pre-lab activities (including the control) in the context of the 3-point bend experiment, do not provide an additional benefit over and above the one gained by the students performing the practical activity alone. Further repeat studies with a greater participation are planned to test this hypothesis. Future work will integrate pre/post-lab tests into assessed coursework or sessions requiring attendance to increase adherence and will apply post hoc pairwise testing to refine group comparisons.
For question L2 the iLabs simulation seemed to have the most positive effect thematically, with multiple students making comments relating to preparedness for the actual lab, such as “It was fun and more engaging. Made me better prepared for the upcoming lab” and “Better than videos”. However, in the post-lab test the iLabs cohort actually scored the lowest (Table 4), but this is not definitive due to the low sample sizes and large variance.
The effects of visual fidelity (L4) were also ambiguous with regards to pedagogic performance, but a clear trend can be seen with favorable student satisfaction towards iVR in terms of experience, attention, immersion and interactivity (Figure 3, Table 2). In relation to our own study question (S2) looking for correlations between enjoyment (Q3 & Q8) and perceived usefulness (Q4, Q5 & Q9), there is evidence of a positive correlation for iVR, with the exception of Q5 which has a poor H value. The thematic analysis corroborates this, as only the iVR responses feature the word “experience” positively multiple times, whereas the nVR simulations are slightly more mundanely self referred to as “activities”. The iVR and iLabs virtual labs both also had positive feedback with regards to usefulness.
Research question L3, concerning multilingual interactions, was not addressed within this dataset. While not feasible in the current study, multilingual XR environments remain an important focus for future work, particularly to increase inclusivity with diverse international cohorts. 31
The work by Huang (2020) has shown that in other iVR studies, the “novelty effect” can be powerful in a science/engineering related context. Initially increasing the students’ motivation and engagement in the activities, then attenuating over multiple periods of exposure. 32 The link between this effect and increased learning outcomes, was also found to be highly dependent on the task being simulated. In our context, the novelty of iVR may explain the enthusiasm in self-reports without corresponding gains in short-term post-lab scores. Although short-term learning outcomes were not significantly different across modalities, the motivational advantages of iVR could support longer-term retention, increased preparation compliance and stronger affective engagement. This warrants follow-up work that tracks performance across multiple semesters or modules. Longitudinal studies are needed to test whether repeated exposure sustains, diminishes or transforms this effect into durable learning benefits.
With regards to question L5, it is quite clear that the iVR is the most expensive in terms of staff time for content development and in hardware, 12 with Lo-Fi the second most expensive in staff time for R&D but the cheapest in hardware (and iLabs the inverse). However, without better quality data of each approach's impact on student LOs, a true cost benefits analysis cannot be done with respect to pedagogical level of merit.
Conclusions
In this paper, we looked at three different types of virtual labs to see which method has the most beneficial effect on practical laboratory experiences in a flipped learning context. As each simulation was created at the university, the costs in terms of staff time and equipment were considered. 12 The results from feedback following each activity showed statistically significant differences in user experience, maintaining attention, immersion and interactivity in favor of iVR versus nVR alternatives and similar trends in workload relating to physical demand and effort. Written feedback, characterised thematically, corroborated the numerical results and also highlighted potential issues with the study questions and gave insights into further areas of research. Due to low levels of participation in the post-lab test, a clear causal link between learning outcomes and simulation type could not be established, further research and repeat tests are planned in this area to help clarify this aspect. We also plan to conduct further research into the effects of visual fidelity and multilingual interfaces on user experience and learning efficacy. It is our hope that the data in this study and our future planned research will help to inform the direction of virtual lab development for the educational community at large.
Footnotes
Acknowledgements
The authors would like to thank the team from Multidisciplinary Engineering Education (MEE) at the University of Sheffield for facilitating the study, in particular Sarah L Archibald for assisting with timetabling, Patrick Cropper for help getting the IT infrastructure in place to run the sessions and Dr Mohammad Asif Zaman at Stanford University for helping us with the iLabs software.
Ethics considerations
This study was reviewed and approved by The University of Sheffield Ethics Committee with the approval number: 051651, dated 23/02/2023.
Consent to participate
All participants were informed that consent to participate in the study and publish their data would be dictated by their completion and submission of the study consent form.
Funding
The author(s) received no financial support for the research, authorship, and/or publication of this article.
Declaration of conflicting interest
The author(s) declared no potential conflicts of interest with respect to the research, authorship, and/or publication of this article
Data availability
For the purpose of open access, the author has applied a Creative Commons Attribution (CC BY) license to any Author Accepted Manuscript version arising from this submission.
The data that support the findings of this study are openly available in COMPARING XR AND DIGITAL FLIPPED METHODS TO MEET LEARNING OBJECTIVES - MAIN STUDY 2023 at https://doi.org/10.15131/shef.data.c.7014354.v1
Declaration of generative Ai and Ai-assisted technologies in the writing process
During the preparation of this work the author(s) used OpenAI's ChatGPT LLM (v3.5) in order to perform a crude thematic analysis on one part of the datasets (see section 3.2). Both ChatGPT (v3.5) and Google's Gemini LLM (v2.5 Flash) were used for assistance in grammar, tone and construction to fit journal submission parameters. After using these services, the author(s) reviewed and edited the content as needed and take full responsibility for the subsequent content of the publication.