
Abstract
This article brings together various experiences aimed at achieving a better understanding of learning by students through the application of simple and easy experiments, oriented especially to understanding what
Introduction
The teaching of Materials Science, Engineering, and/or Technology has been evolving rapidly throughout, especially in recent years, incorporating new tools and new approaches every day. At present, some of the outstanding features that distinguish the teaching-learning process in this field are the fact that the activities to be carried out, preferably, are based on daily experiences, 1 indicate that the contexts linked to daily life are more attractive to students and are a more motivating way to advance in the learning process, 1 they recommend that solving real problems is an element that can influence achieving meaningful student learning. A third feature is the accelerated incorporation of technological resources from different origins that have come to revolutionize the way of teaching, accelerated even by the recent pandemic and still prevailing on our planet.2–7
One more characteristic is the possibility that the teaching of Materials Science and Engineering can be carried out from an STS approach, that is, Science–Technology–Society, particularly taking advantage of aspects of these branches that can be linked to economic and environmental issues. Other initiatives point to the use of various strategies for teaching some topics that, from our experience, have shown that they are difficult to understand for engineering students. Some proposals have been presented since the end of the last century, 8 and more recently the idea of applying a cooperative learning strategy was proposed.9,10 Particularly, the teaching of the concepts of Phases and Solutions as a background for the subsequent teaching of Phase Transformations and particularly Phase Diagrams, their construction, and interpretation, constitutes a very important part of the subject programs such as Science, Engineering, or Technology of Materials, which are part of Engineering careers, such as Mechanical Engineering, Mechatronics Engineering, and other similar ones. Some reference to the confusion that students present in the domain of the topic of Solutions can be seen by Krause and Tasooji. 11 The Phase Diagrams constitute a “door” to enter and be able to understand the alloys and compounds present in a multitude of materials and applications, allowing us to know under what temperature/composition conditions certain phases exist, and when the various reactions can take place can occur in different alloy systems. Phase diagrams and phase transformations are very important antecedents to understanding microstructure evolution (and hence properties) in relation to manufacture and processing. 12 The above is very valuable information for making decisions regarding the processing of materials, which is why it is important for students to begin the study of this type of tool, adequately understanding what a phase represents and what is being talked about when it is used. Given the above, this text includes a series of experiences in the classroom (eventually they can be carried out in the laboratory), the way in which they have been applied, and the results that have been achieved in the teaching-learning process of these topics. Considering that, additionally, in more recent times, new metallic and ceramic materials, and new processing methods have been incorporated in the form of themes and processing technologies, all of them linked to phase diagrams, such as shape memory alloys, 13 rapid solidifications,14,15 semi-solid processing, 16 high entropy alloys 17 or mechanical alloying, 18 mechanosynthesis, 19 nanostructured materials, 20 superplasticity 21 and some others, it is still more important that students have an adequate understanding of what a phase or component means, the construction and interpretation and the information that can provide a Phase Diagram, as well as the possible experimental techniques, by means of which it is possible to observe and characterize the phases of an alloy system.
Description of experiences
The following description lists the steps followed to carry out the different experiences that have been used to subsequently introduce the topic of Phase Diagrams to the students:
Students are asked to help write a definition of PHASE (F), COMPONENT (C), ALLOY (A), and the rest of ALLOY SYSTEM (SA), (as support for the teacher these definitions). They can be found in references such as Ashby 12 and Cisternas. 22 Some examples of Solid Solution and Phase definition are:
A solid solution is a solid in which one (or more) elements are dissolved in another so that they are homogeneously dispersed, at an atomic scale. 12
A region of a material that has a homogeneous atomic structure is called a phase.
12
A phase is a physically distinct, chemically homogeneous, and mechanically separable region in a system in equilibrium.
23
If more than one phase is present in a given system, each phase will have its own distinct properties and a boundary separating it.
23
Put some water in a beaker and ask the students about what they are seeing: F=? C=? Now add a little sugar (making sure that the solubility limit is not exceeded) and dissolve it perfectly in the water. Repeat the question about the number of phases (F) and components (C) in the system. This is a good time to remind students of the concept of solution, and its constituents (solvent and solute) and to ask what type of solution this case corresponds to (unsaturated solution). Figure 1 shows the scheme of how it is suggested to carry out the experiment. Now add a greater amount of sugar, so that a supersaturated solution of sugar in water is obtained in the glass, and repeat the question from the previous points about the number of phases (F) and components (C) in the system. These two proposals are schematized in Figures 2 and 3. It is suggested to complement the experience by asking the students and reviewing the concepts of saturated and supersaturated solutions, mentioning how solubility can change as a function of temperature. Thus, at this time it is recommended to approach with the system in use, that there is a “precipitate” (“Chemical precipitation is the process of conversion of a solution into solid by converting the substance into insoluble form or by making the solution a super saturated one,”
24
at the bottom of the glass and that they imagine a saturated solution of sugar in water at 90 °C and ask the students what the condition is of the number of phases and components. From this, ask them what they think would happen if the temperature were reduced to room temperature in that same system. The obvious answer is that that amount of water is not capable of dissolving the same amount of sugar at 90 °C as at, say, 20 °C, so a precipitation phenomenon would occur and this may be the starting point to mention that a similar situation can occur in many of the real material systems (as, e.g. in various alloys based on aluminum), of partial solubility in the solid state. Later, in the process of teaching the subject of Phase Diagrams (i.e. our experience in this regard), it is easier and more understandable to be able to explain this phenomenon to the students. Figure 4(a) shows the phase diagram, an example of an unsaturated solution condition, and Figure 4(b) shows a sample of the location of a supersaturated solution, the result of the decrease in temperature. Now add a small amount of alcohol, and again ask the students about the number of phases (F) and components (C). It is recommended to take the opportunity to mention that there are solutions that present total solubility and can become more evident by adding more alcohol. It should be noted that full solubility continues to occur in the water/sugar–alcohol solution system. In Figure 5, the process is schematized. Now place some ice cubes on the surface and reiterate the questions about the number of components (C) and phases (F) and which ones are present. This exercise provides an opportunity to highlight that the same component can be in more than one physical state in the same system. The aforementioned experiment is shown in Figure 6. Likewise, it can be used to highlight that this solid component will pass, after a while, to the liquid state and the system can be modified in terms of the number of phases depending on temperature changes. It is important to highlight that the test has been applied to environmental conditions where the pressure has not varied. Finally, add a little glycerine, oil, or another liquid that is not soluble in water and repeat the questions to the students about the phases and their number in this new system, this is, illustrated in Figure 7. It should also be noted that another type of condition between the components of a system is that there is no solubility between them.
Students are asked, based on these definitions, to determine the number of phases and components present in each of the following systems shown and described below:
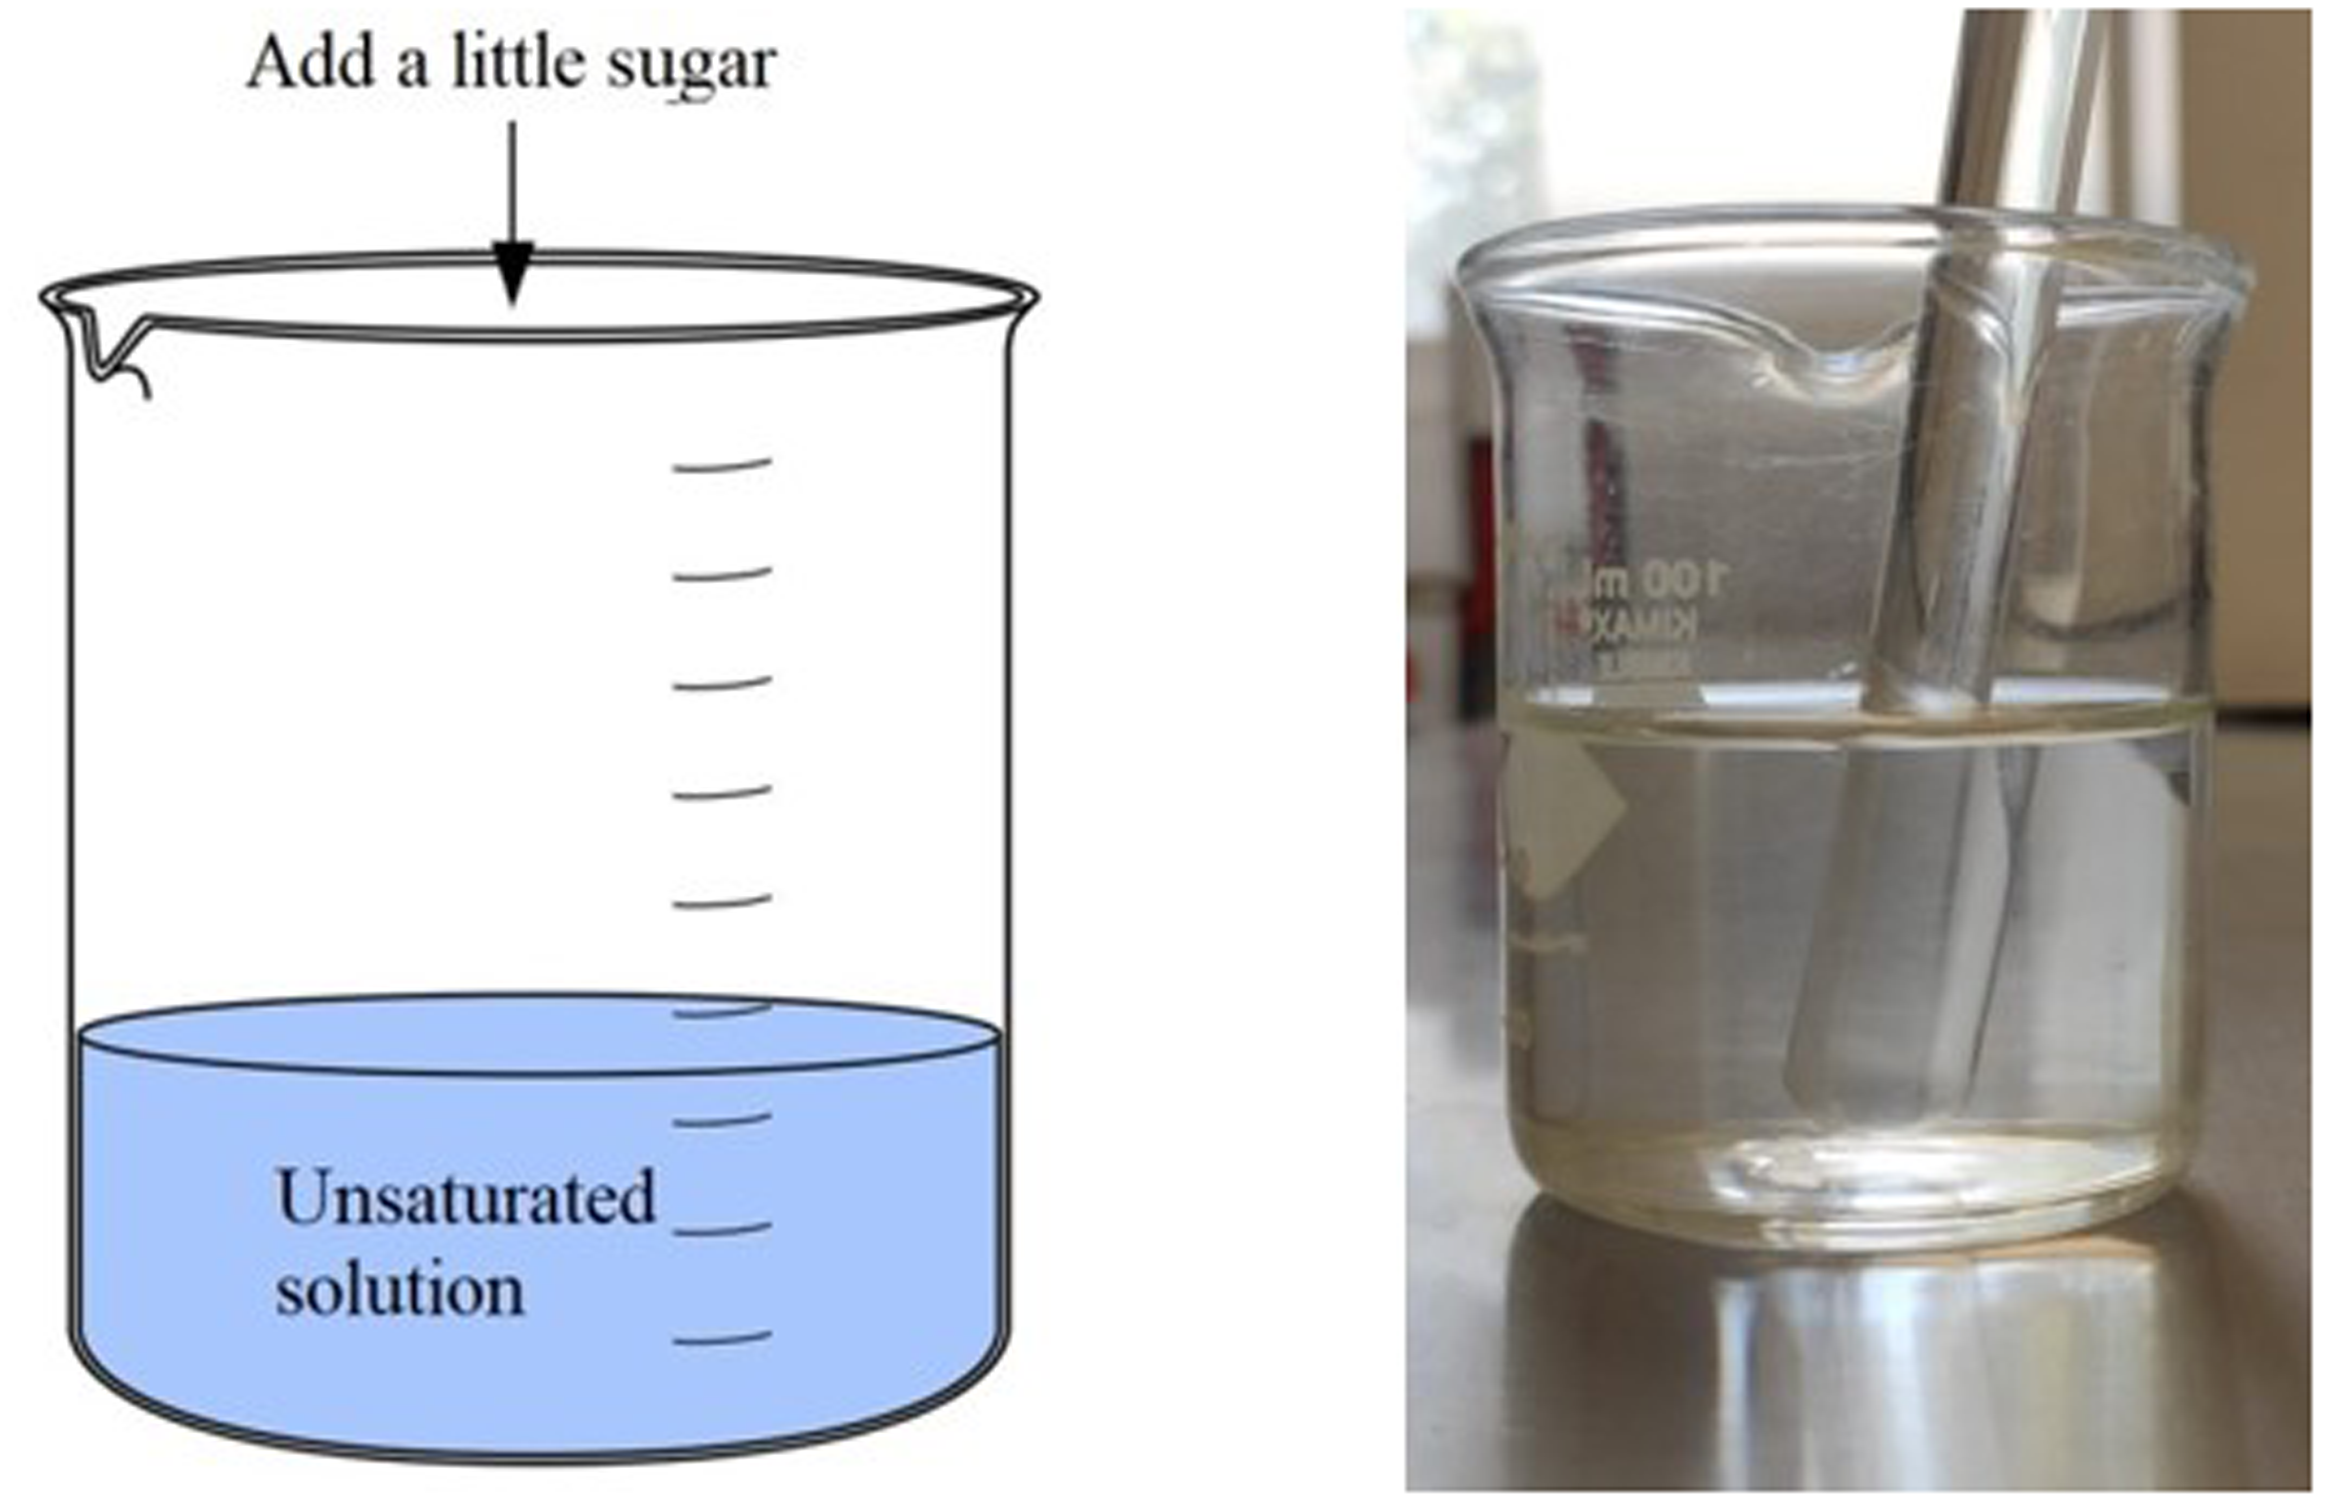
Diagram and image of a one-phase, two-component system. F = 1 (liquid, unsaturated solution of sugar in water) C = 2 (sugar and water).
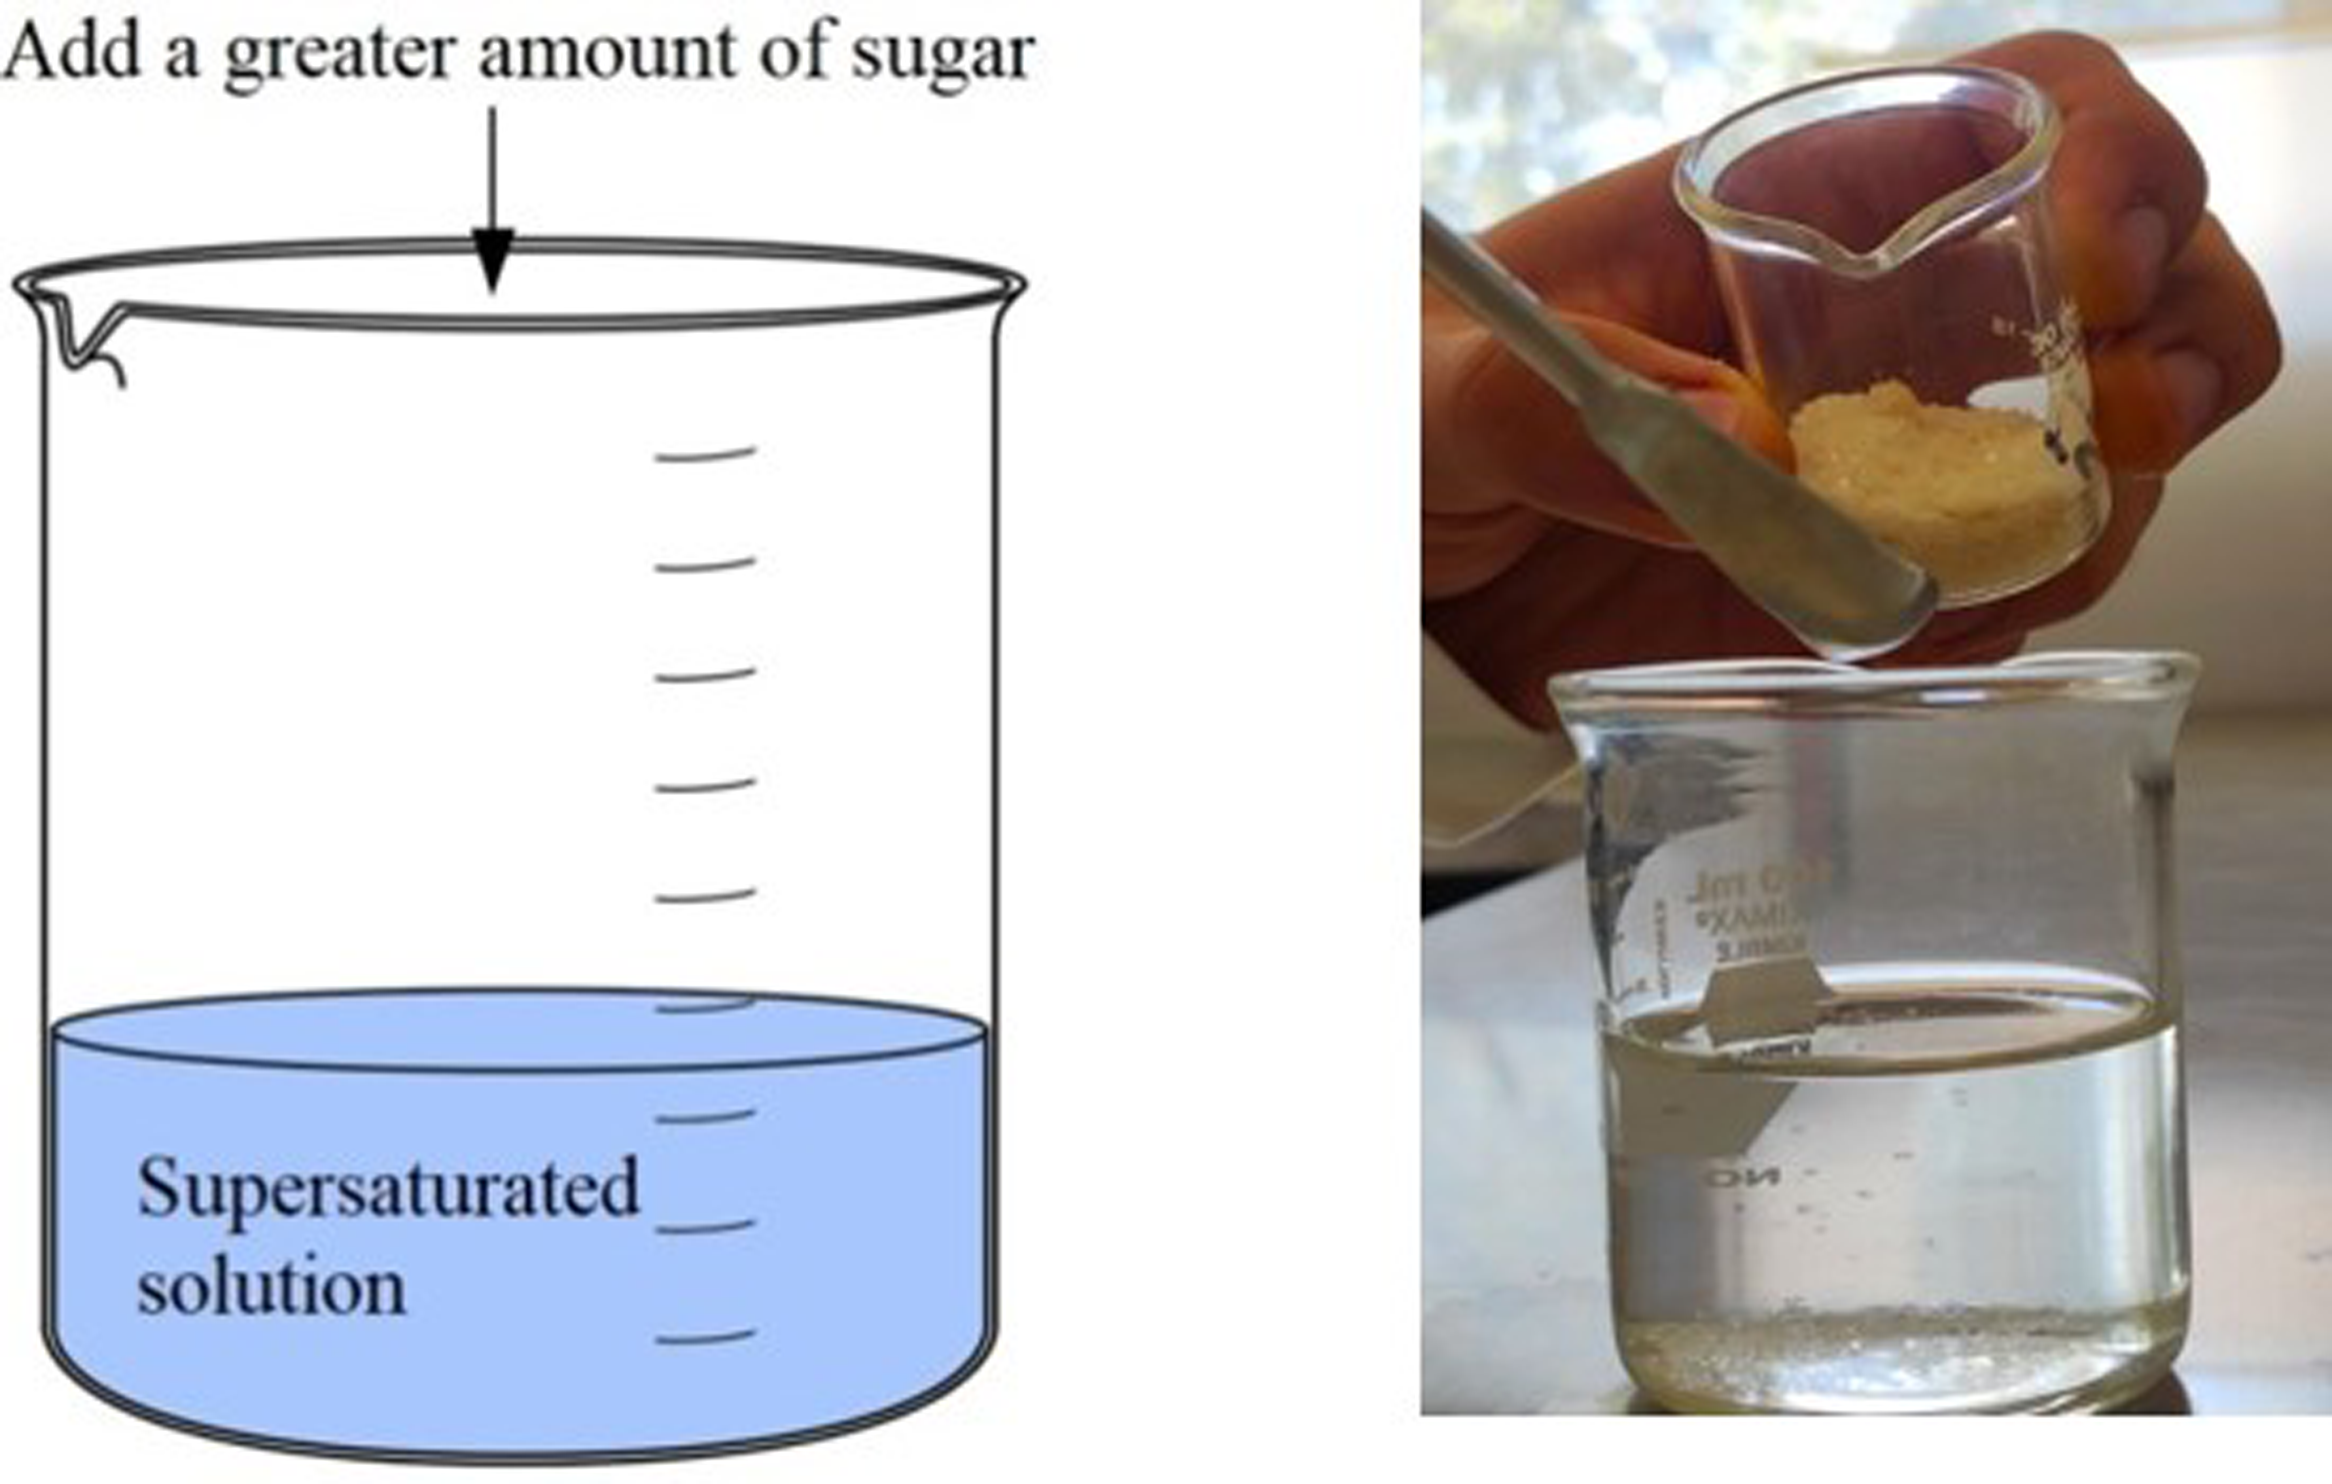
Scheme and image showing a two-phase, two-component system.
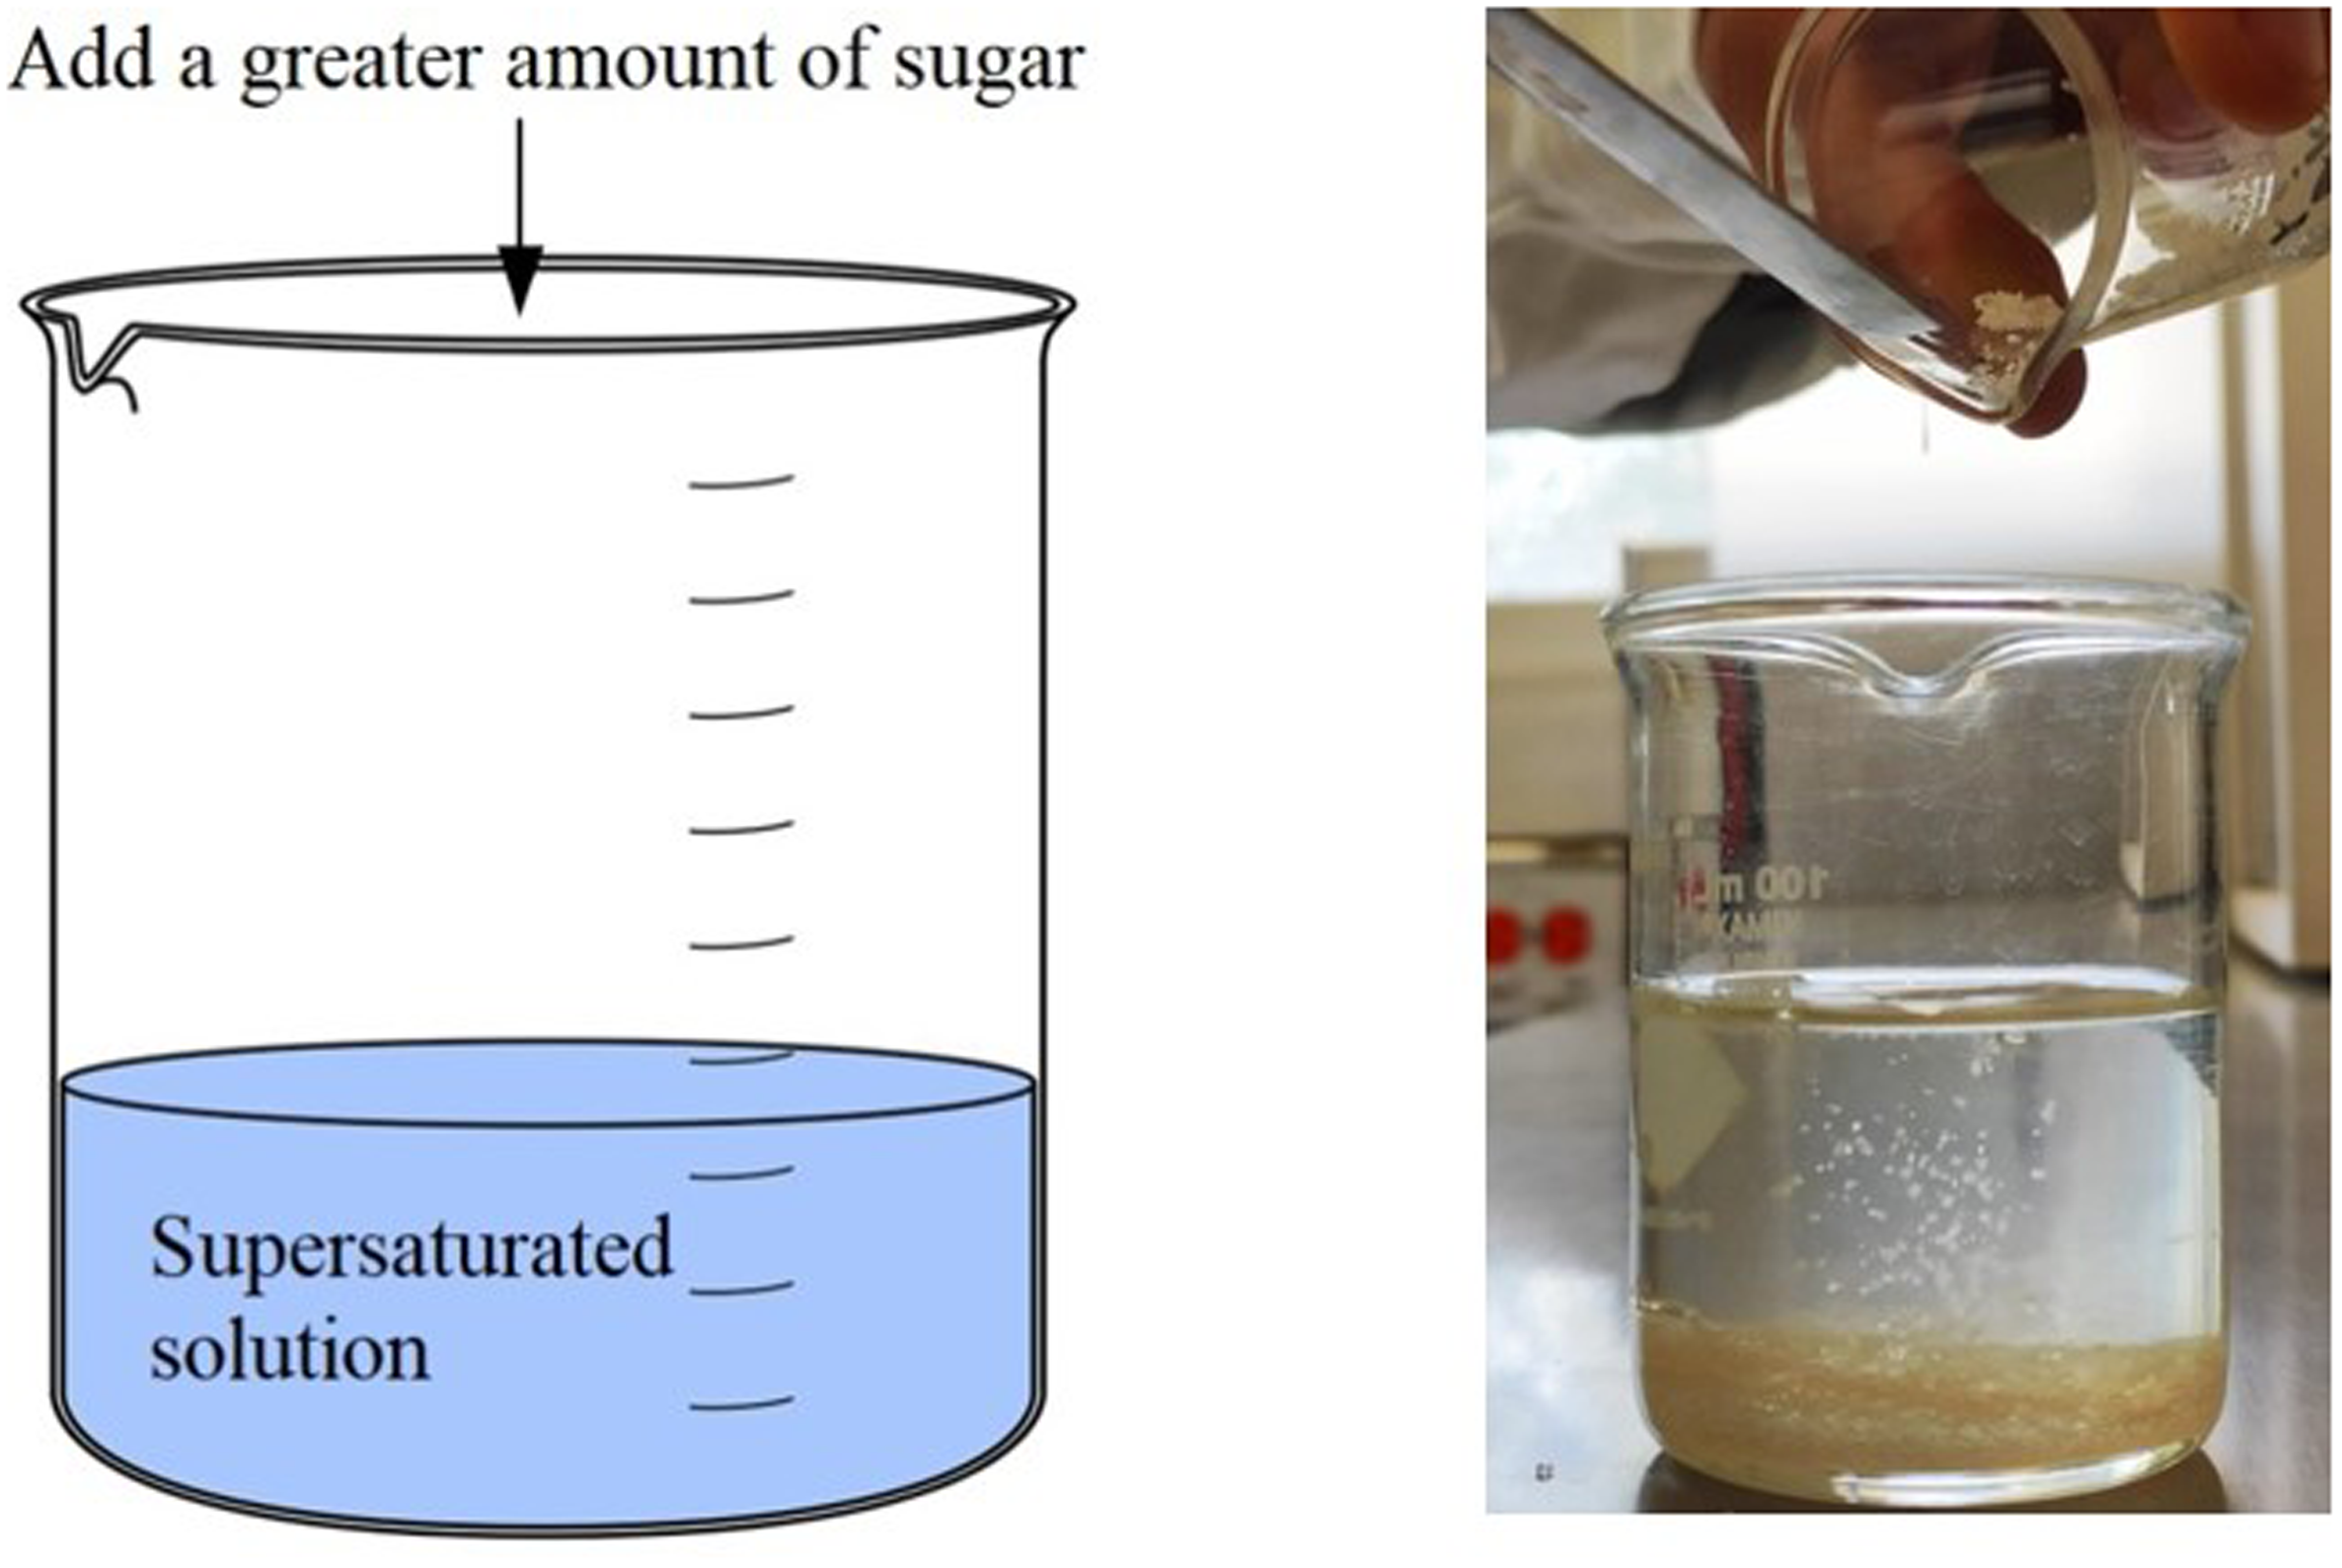
Scheme and image illustrating the formation of a “precipitate” in a system that is an example of a supersaturated solution.
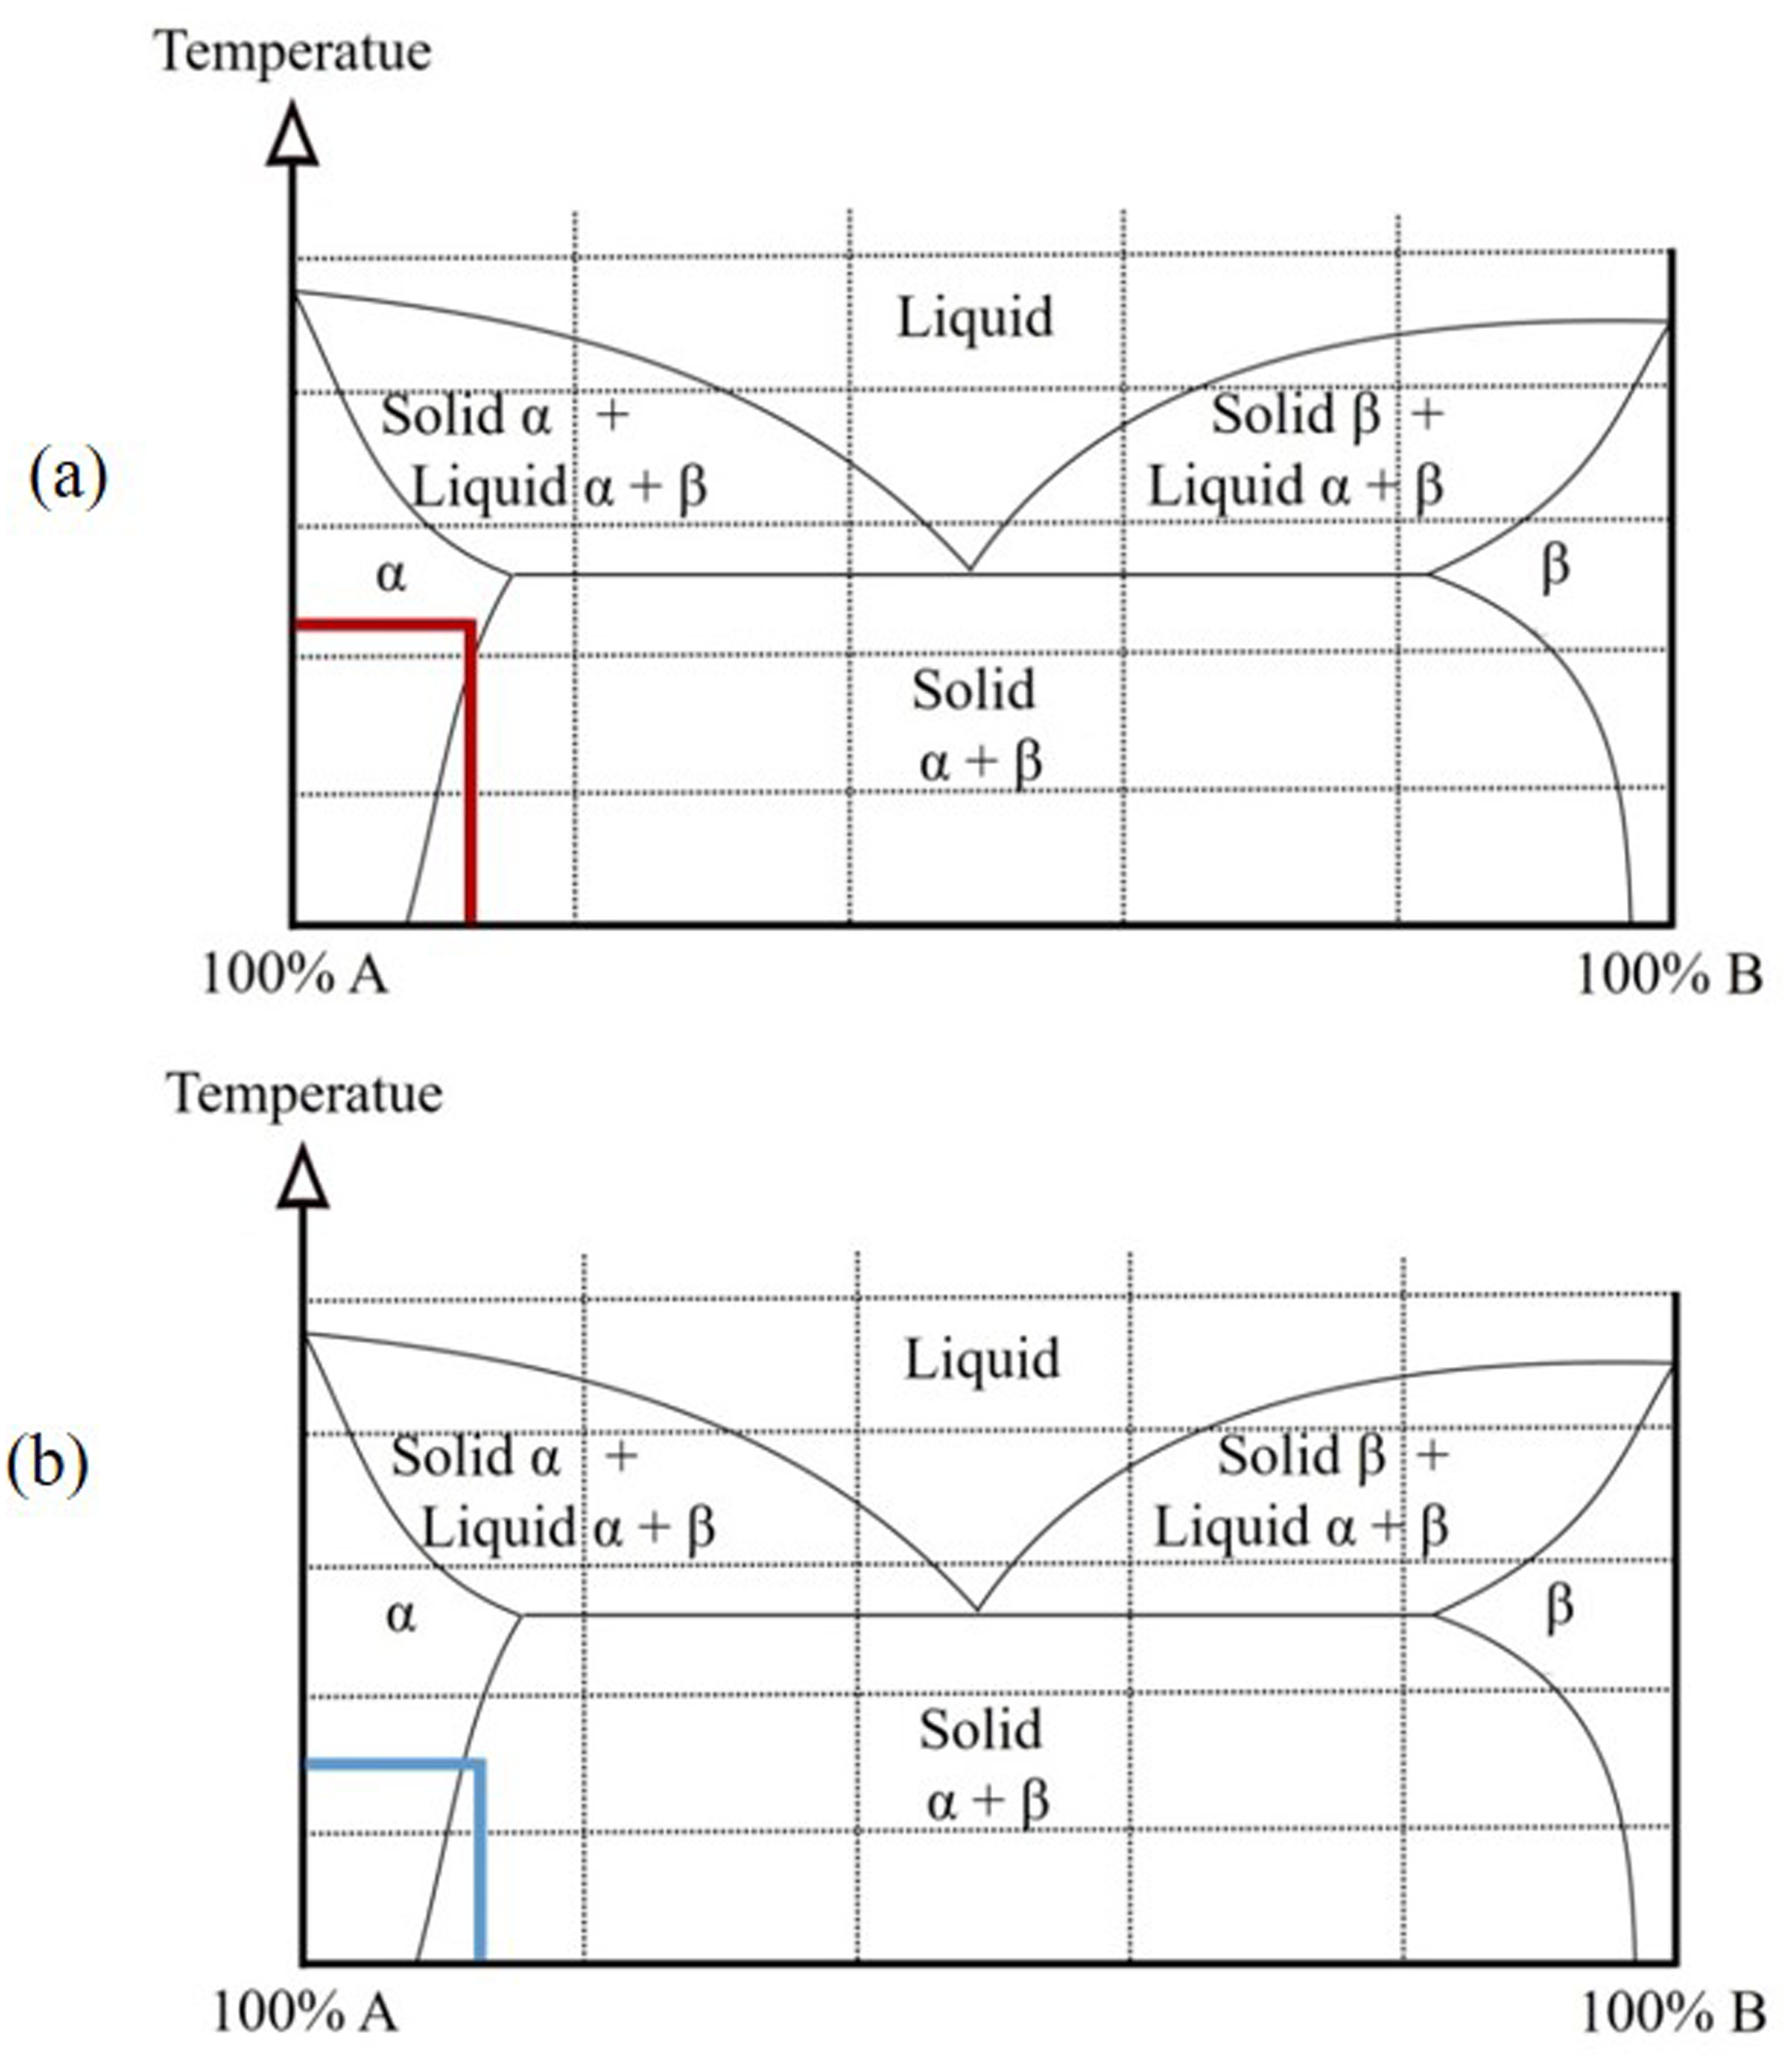
Location of an unsaturated solution (a) and a supersaturated solution (b) of a system of partial solubility, as a result of the decrease in temperature.
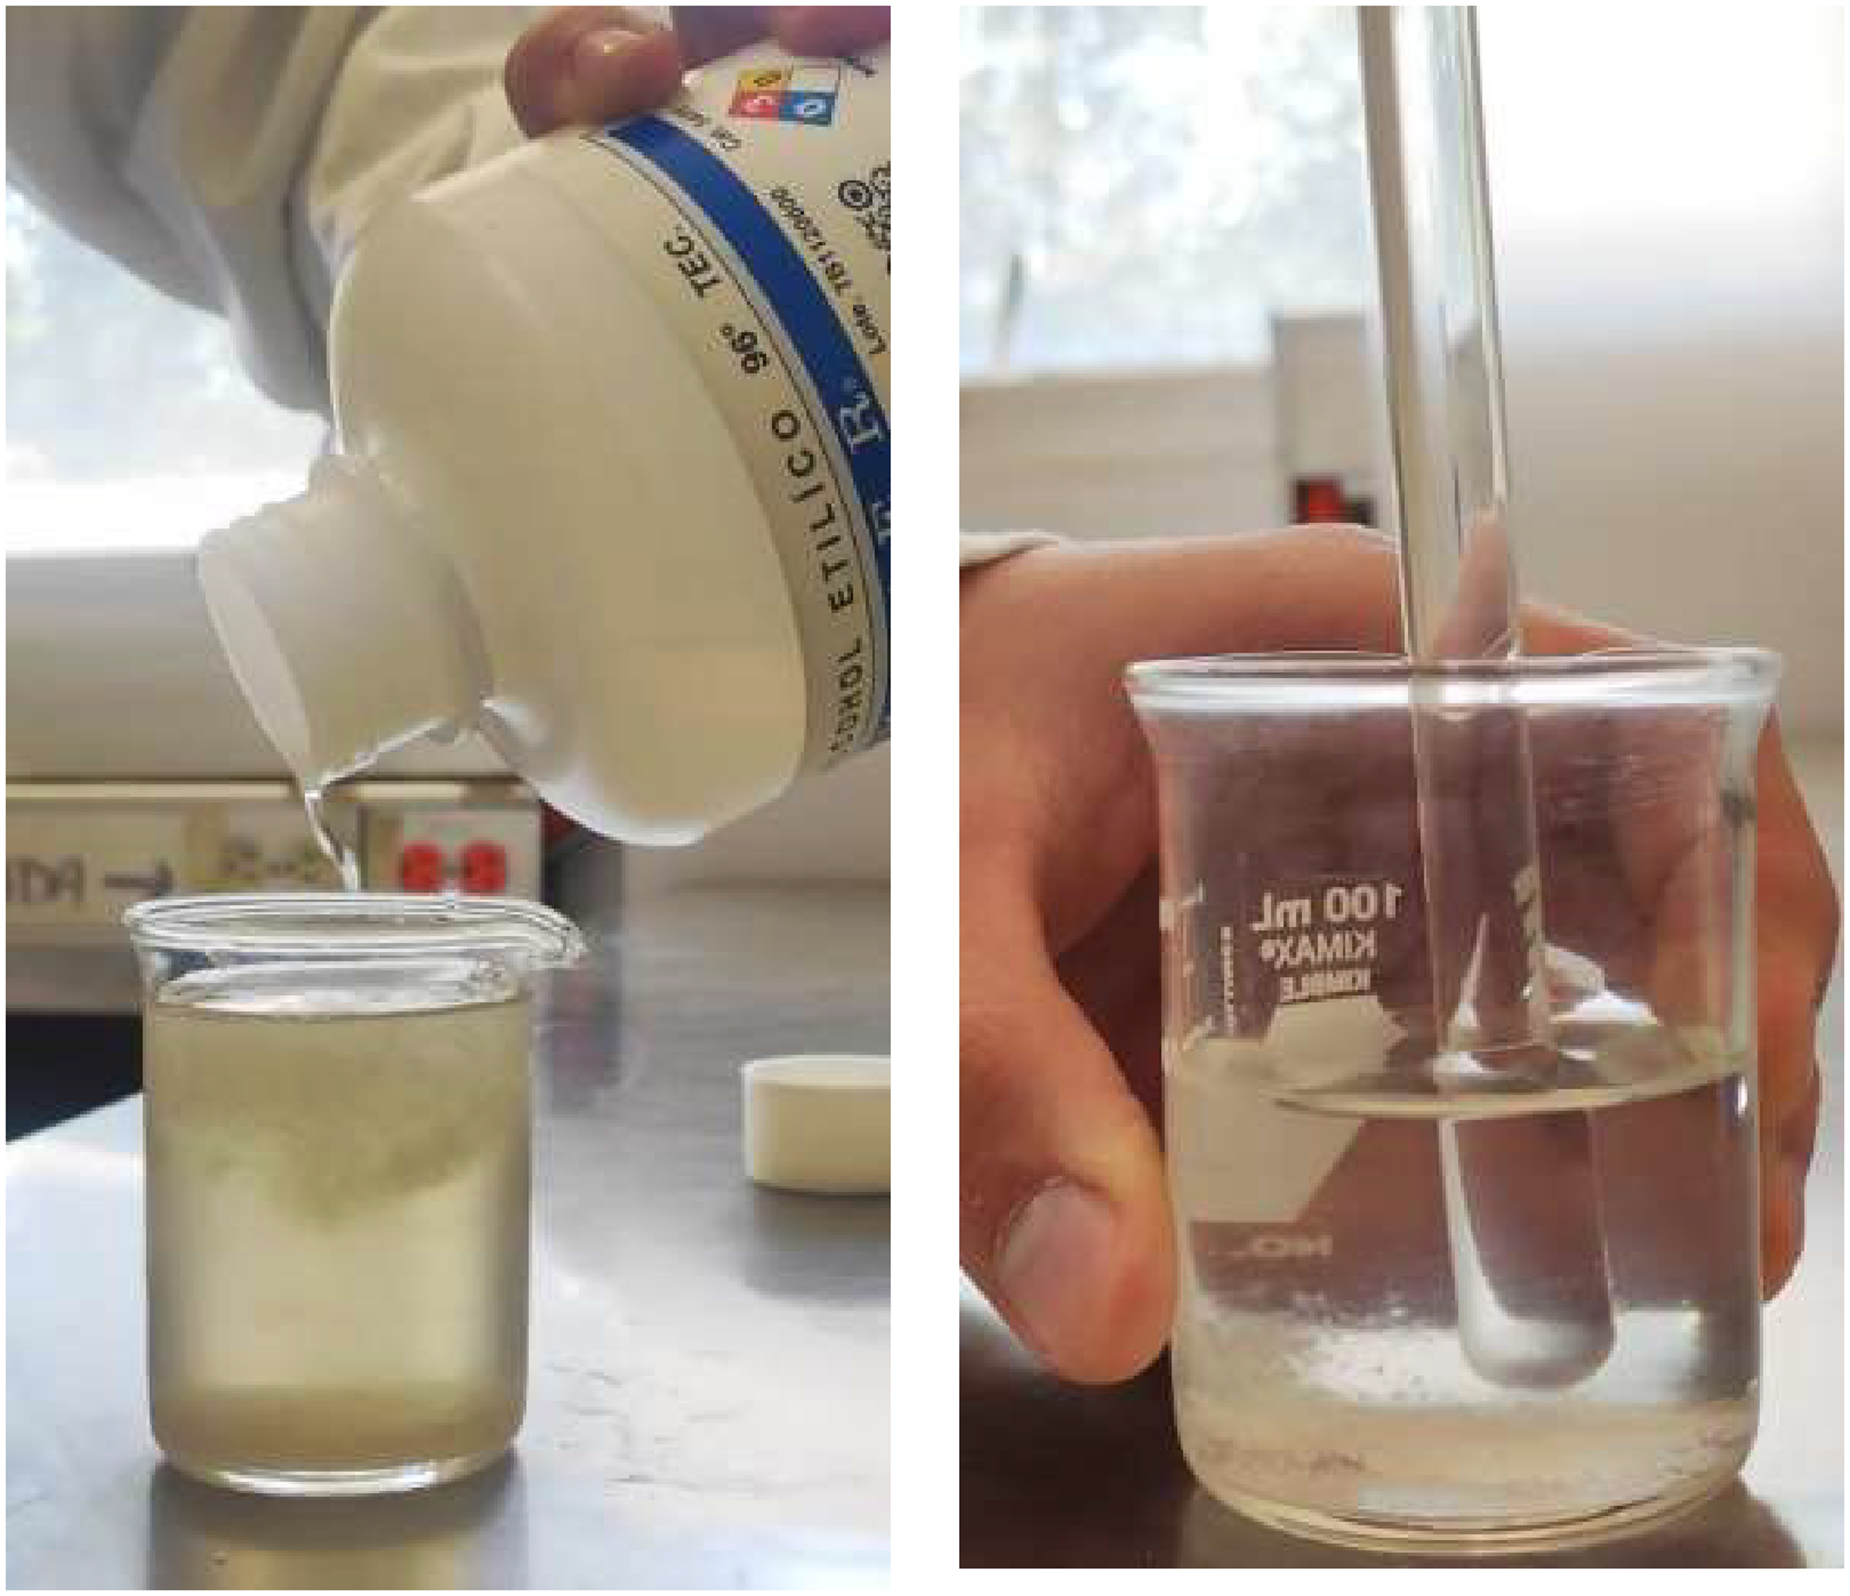
Images of a system (water, sugar, and alcohol) after the addition of alcohol and its agitation, with two phases and three components.
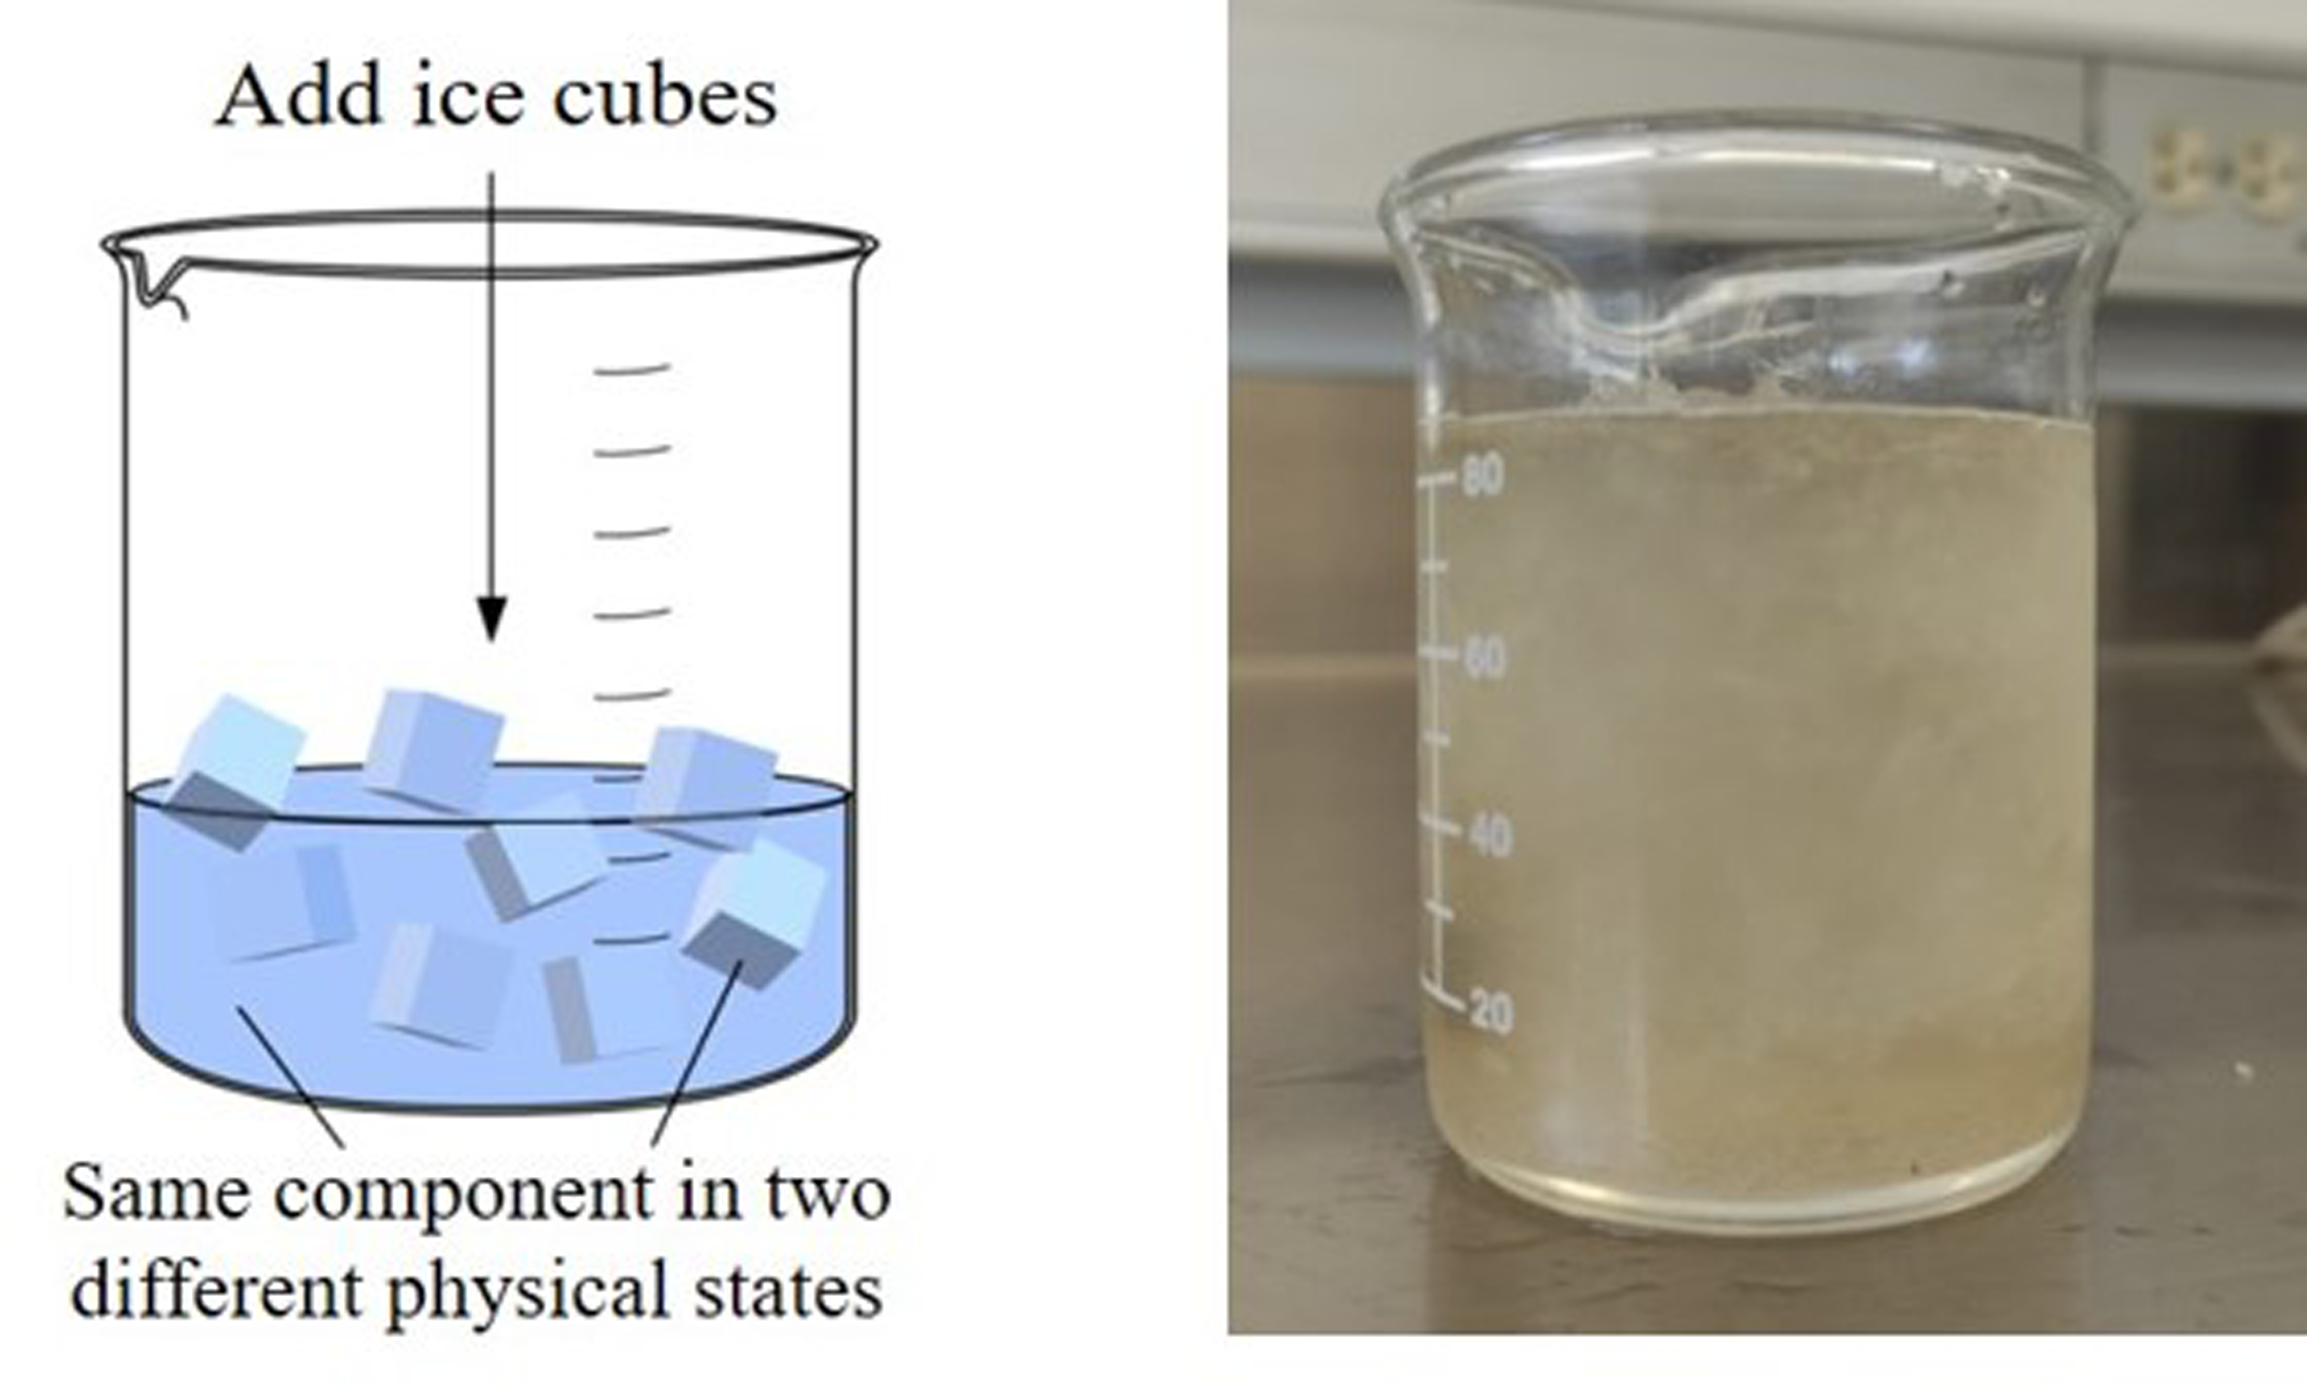
Diagram and image of a system showing the presence of ice on the surface of the solution, through which it is evident that the same component can occur in more than one physical state.

Scheme and image of a complete insolubility system.
It is advisable to complement this activity by telling the students that, in a real metallic material, the phases are differentiated and studied, in their most common way, through the use of optical or electron microscopy (or other types of microscopy). The scheme in Figure 8 represents the stages that commonly comprise a process of preparation and observation of a metallographic specimen and is a sample of what could be used to explain it, added to videos, for example:
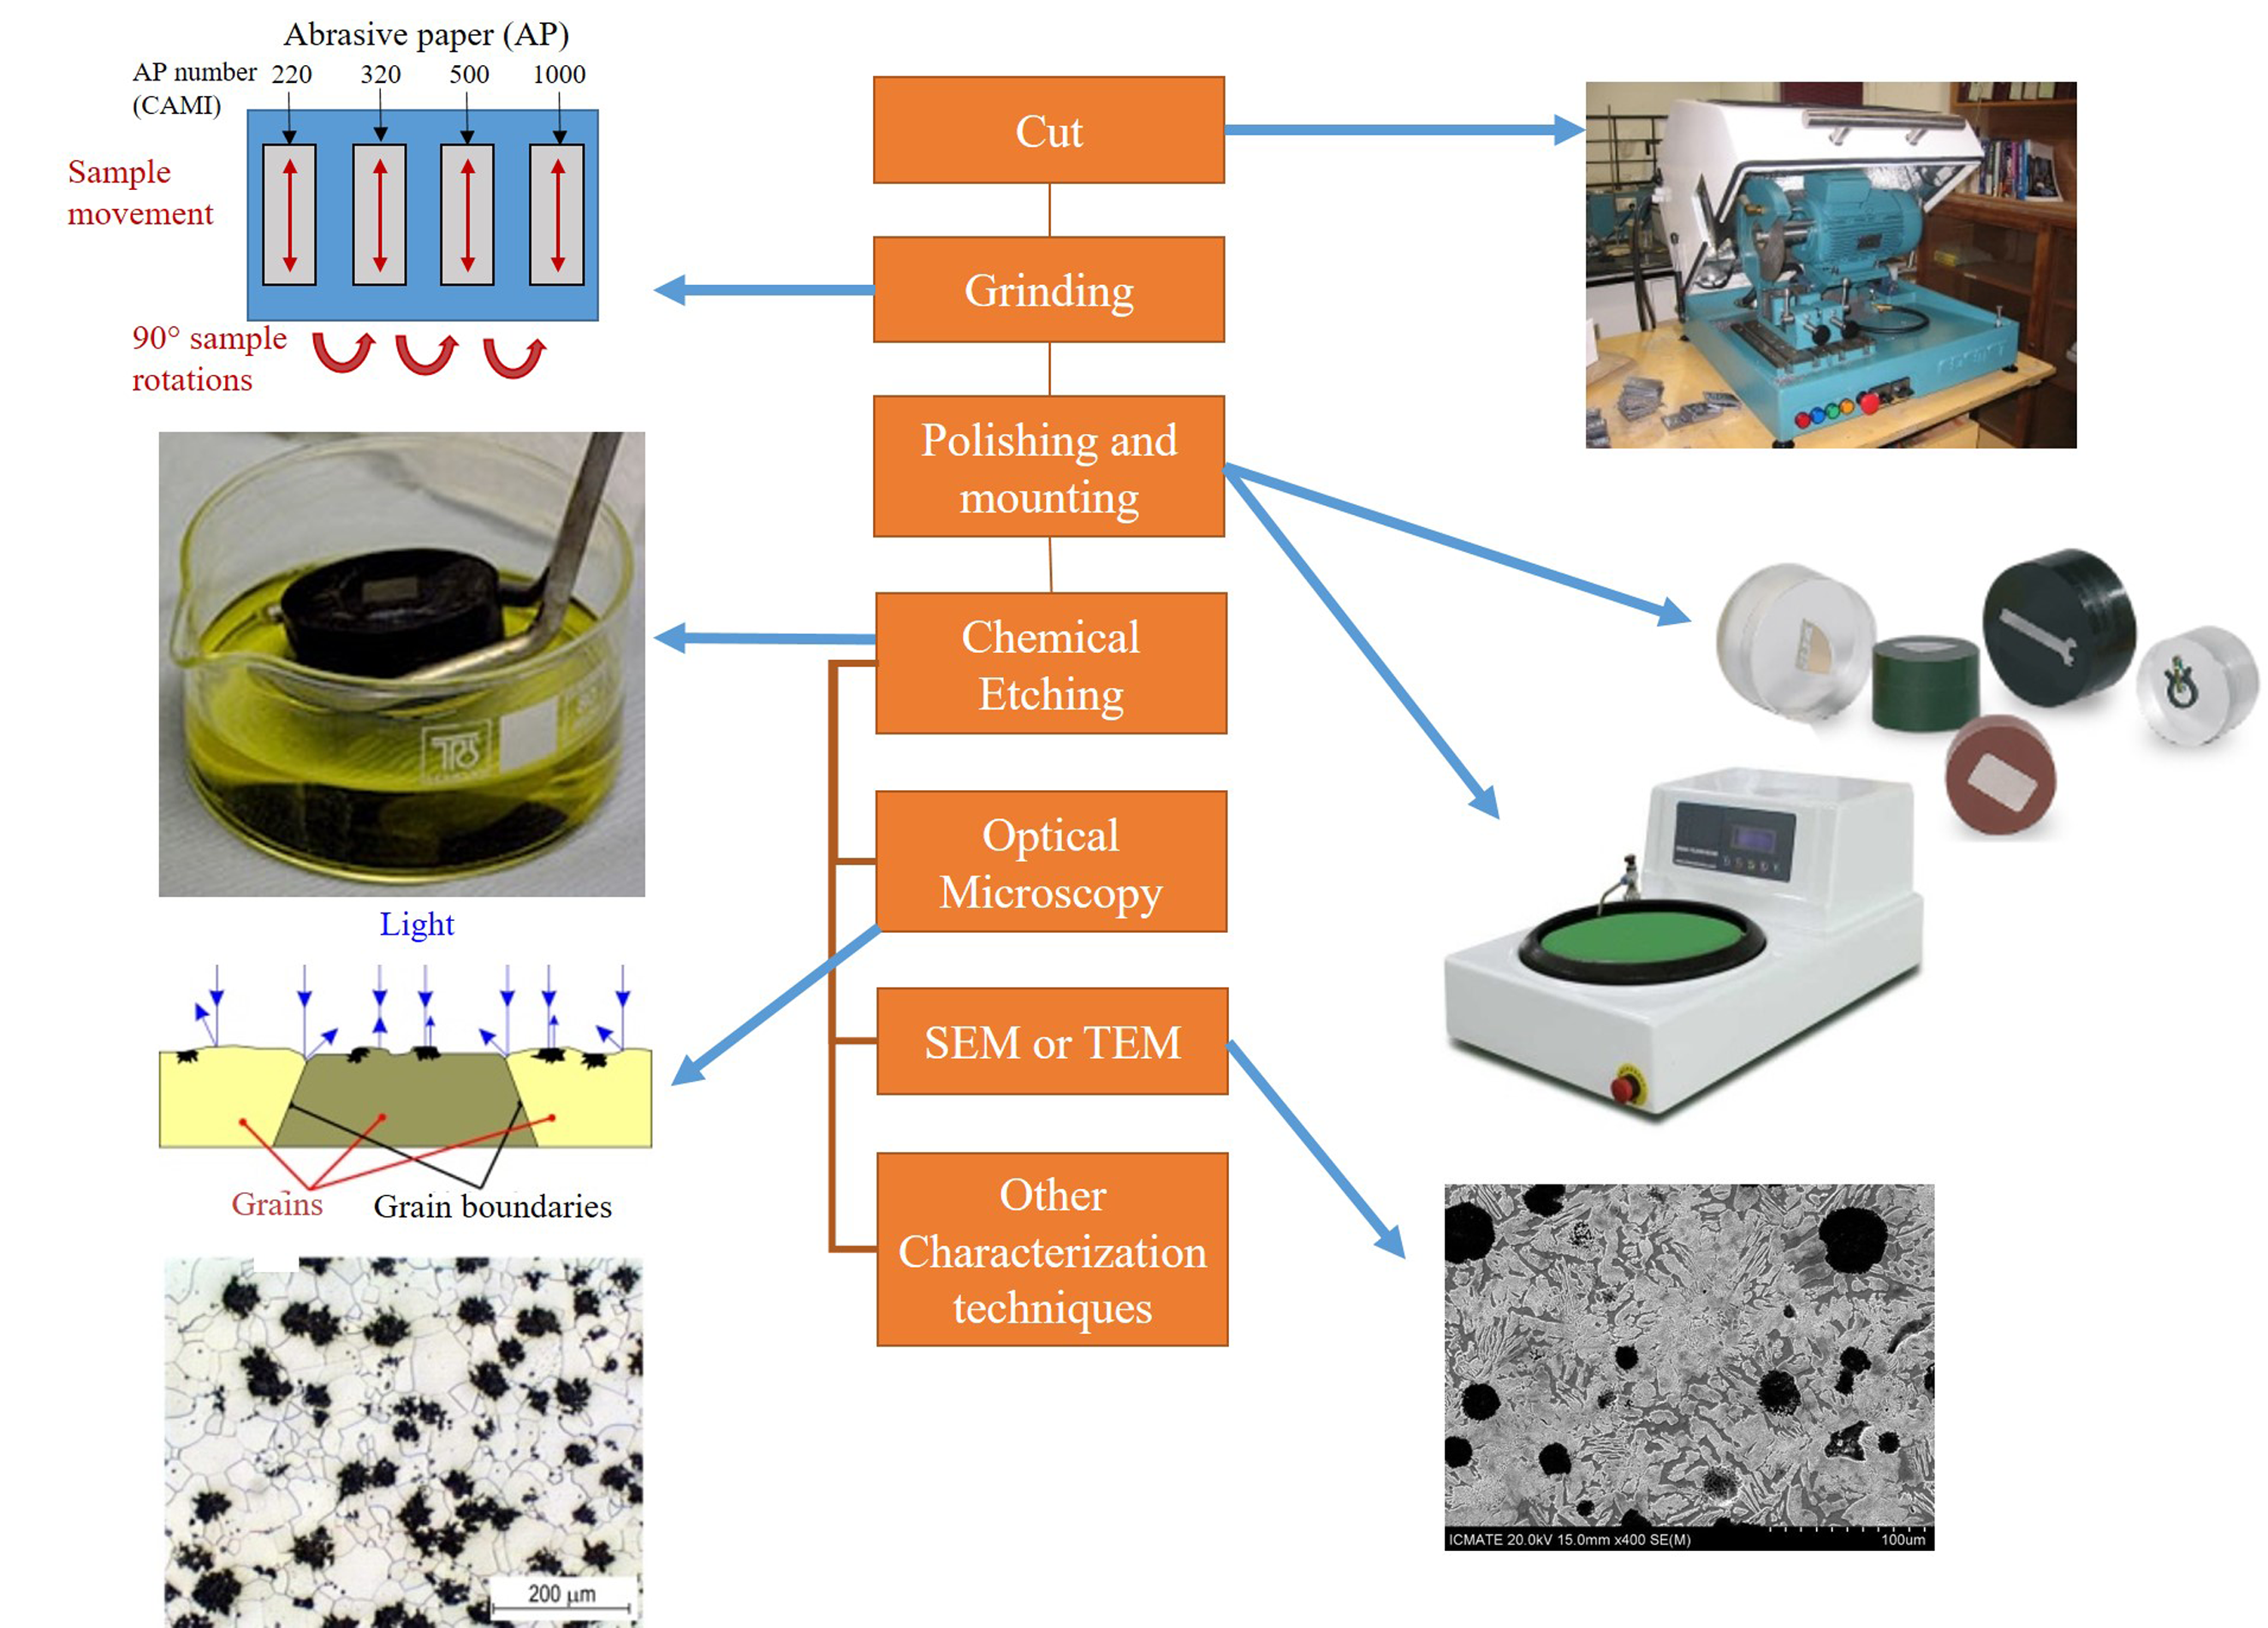
Scheme showing the preparation stages of a metallographic specimen for its observation in some type of microscope.
The connection with the activity in the classroom has been made through the presentation, in the classroom itself, of some samples for observation with the naked eye, with the help of a magnifying glass, a small portable microscope associated with a cell phone or in the laboratory, by observation in the metallographic optical microscope. It is appropriate, of course, to prepare a practice following the sample preparation methodology for metallic materials, so that students can later carry out metallographic observation.25,26 Figure 9 shows an example of a microstructure, generated in an optical microscope, of austenitic stainless steel, (widely used in industry and other fields, due to its excellent corrosion resistance), as a sample of the single-phase case (austenite).
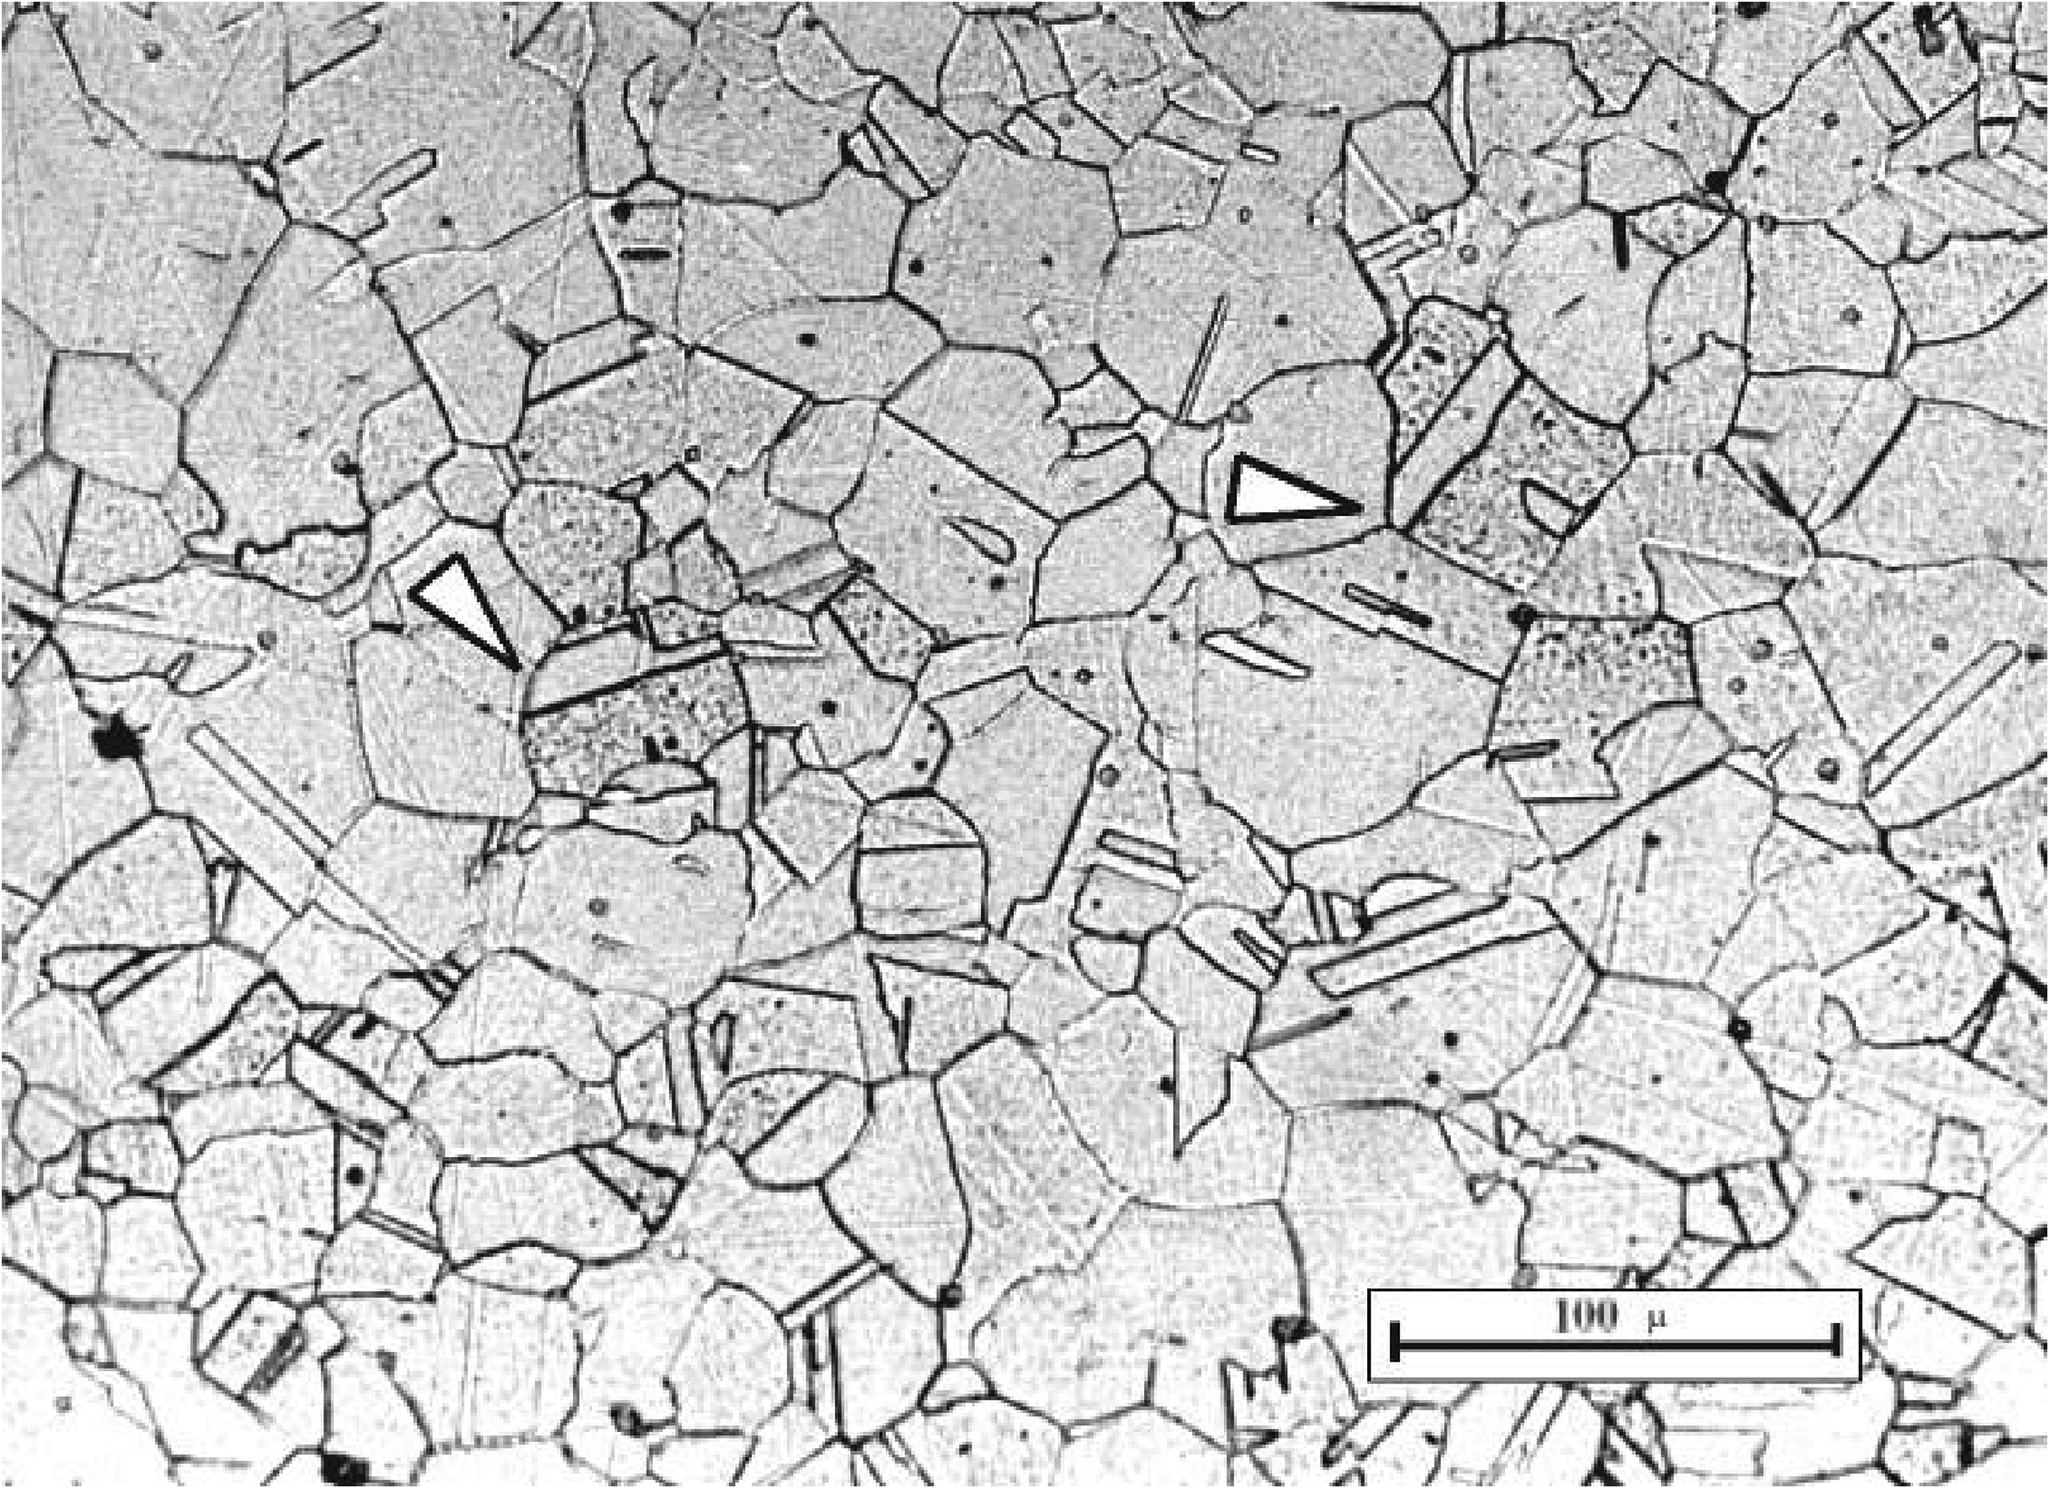
Metallographic image of an austenitic stainless steel, as a sample of a single-phase metallic material. 27
On the other hand, Figure 10 shows the microstructural observation in an optical microscope, of a metallographically prepared test piece of a ferritic nodular cast iron, consisting of two phases, ferrite (in the light areas) and graphite nodules, (darker areas).
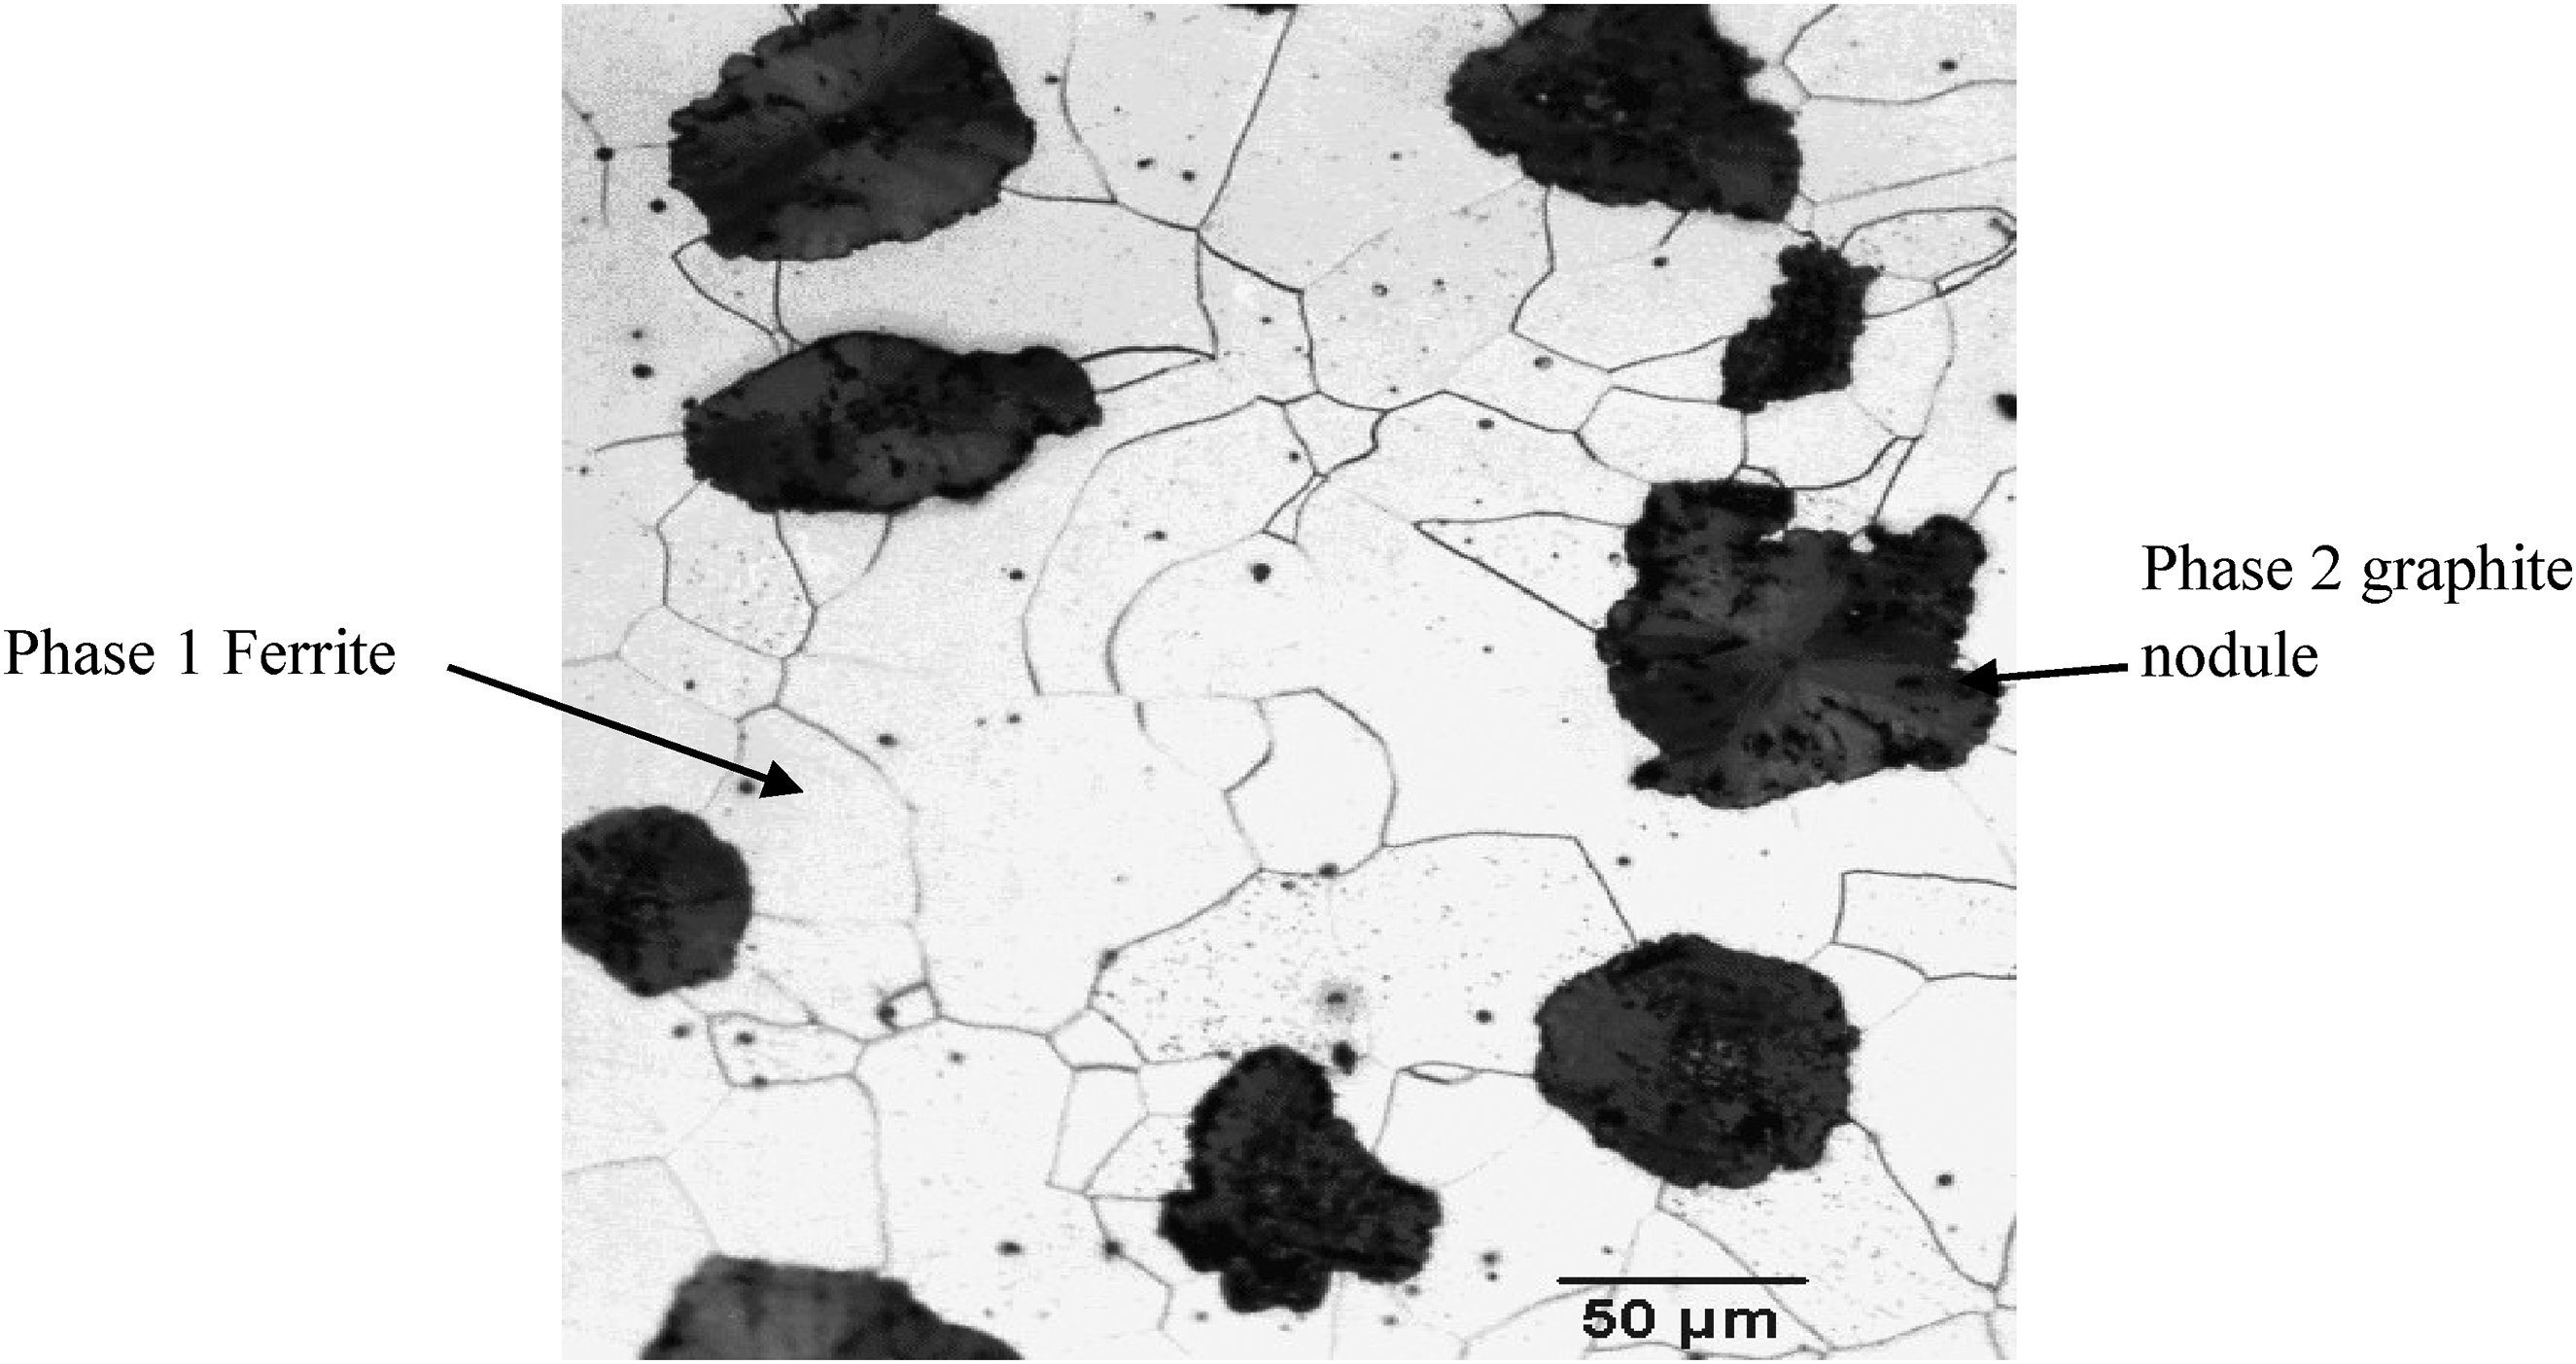
Metallographic image of a ferritic ductile iron, as a sample of a metallic material with two phases: one, which is observed clearer in the optical microscope, called ferrite, and another that appears darker, showing a graphite nodule.
Discussion
The use of these experiences has allowed to improve the learning of the students on the subject of Phases and Solutions, as an introduction and support to the subsequent one of Phase Diagrams. This has been assessed through various mechanisms: In the first instance, the participation of the students, after having carried out these simple experiences, and during the sessions corresponding to the topic of Phase Diagrams, has increased remarkably and this not only means, in itself, participation, but also in addition to questions, they have made various proposals about what would happen if parameters such as temperature and concentration of components are modified.
Secondly, the results of the evaluations associated with the subject, throughout several semesters, have shown improvements in the academic performance of the students. In this sense, after applying various questionnaires, throughout several semesters, with the theme of Phases and Solutions, the responses have increased until reaching, in various groups, greater than 90% correct responses and, on average, of the order of 82%. This has also been reflected when, in subsequent sessions, linked to Phase Diagram topics and exercises, it has also been possible to find greater participation and better answers associated with solving exercises in class and when they have been assigned to extra-class exercises, particularly in systems where the solubility is partial, which represent a significant percentage of the real systems of many industrial metallic materials.
Thirdly, it has been found that, with this background, the Laboratory Practice sessions, related to the subject, have been enriched with a greater participation of the students and have also produced a more thorough use by the students. However, it should be clarified that achieving Laboratory Practices in these topics that are as clear, simple and possible to carry out (in terms of elements and simple means for carrying them out) and, of course, with content, is still a pending issue. that helps to increase, to a greater extent, the understanding of the subject by the students. It is convenient not to forget, nor to leave aside, that the adequate understanding of the topic of Phases, Solutions, and consequently of Phase Diagrams, constitutes a very important key to facilitating the learning of topics such as Heat Treatments or various methods of Material Processing, which are have previously been mentioned and that are of recent appearance, such as high entropy alloys, materials with nanometric grain sizes, materials processed by mechanical alloying and mechanosynthesis, rapid solidification, processing of materials in semisolid conditions, or severe plastic deformation techniques, to mention some of the most relevant. The complementation with videos, interactive resources of the network, and exercises in class, among others, can become a very convenient and necessary strategy and it is evident that, depending on the needs of the group and its characteristics, it is convenient to add them to these activities. In order to reinforce the teaching of these concepts and improve the teaching–learning process in them, in the following series of references you can find videos on the thermodynamic foundations of the Phase Diagrams, interactive sites to build and interpret the diagrams, an important group of metallographic images of various alloys, brief explanations on the Phase Diagrams complemented with solved exercises for understanding the information that phase diagrams can provide, among other resources.28–33 Even recently, options for courses available online have been opened, on topics of phase diagrams on platforms such as CourseHero 34 and Coursera. 35 Likewise, it is necessary to add that the incorporation of tools such as calculation programs and other Software resources (i.e. Calphad and Thermo Calc) for equilibrium diagrams and other topics, have come to complement in a very relevant way the teaching processes of these topics.
From another perspective, in Barba et al., 10 the orientation and general contents of a series of international magazines are also described (others of a national nature can be added), through which teachers, in the first instance, and students also, can carry out oriented and analyzed readings to have a greater possibility of complementing their learning.
It is convenient and recommendable to mention that it is possible to substitute some of the substances proposed in the experiences (e.g. in the case of the possible substance to be used when it comes to insolubility systems) and add some more experience (preferably linked to your life daily) with the aim of increasing more significant learning in students. In all of the above, it should not be neglected that this proposal continues to be, precisely that, a proposal on which teachers, depending on the characteristics of the group and the particular conditions in their institutions, will be able to carry out the changes and adaptations that they consider appropriate and convenient to modify, enrich and complement this experiences.
Comments on the students’ responses during the experiences
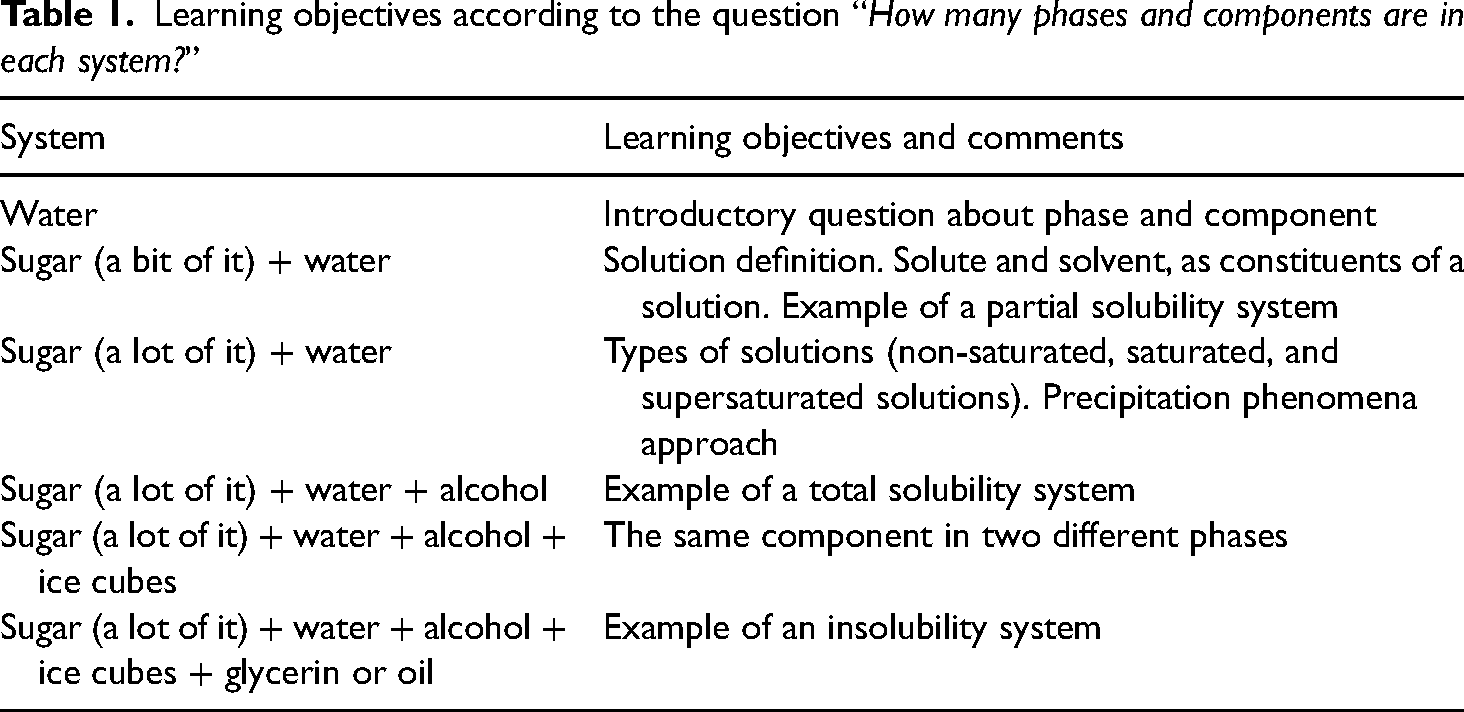
The students’ answers to the questions made during experiments serve as indicators of their prior knowledge. This provides an insight into their understanding and enables them to tailor the session to improve their learning. As can be seen in Table 1, the question about the number of phases and components—made when analyzing different systems—is intended to achieve various learning objectives.
Learning objectives according to the question “How many phases and components are in each system?”
Regarding the starting questions, asking about their prior knowledge of what phases and components are has revealed that whereas the understanding of the concept of component is immediate, understanding what a phase is generally implies students’ doubts; however, they are told that via the experiments, they will infer what constitutes a phase.
The answer to the question of how many phases and how many components are there when a small amount of sugar is added to the container may show if understanding of the number of both the number of phases (1) and the number of components (2) is achieved. However, given that this experience is also a question of what a solution is and what the constituents are (solute and solvent), we found deficiencies in their previous knowledge.
In relation to the condition of the water–sugar solution, when a greater amount of sugar is added (beyond what that amount of water can dissolve at that temperature), the response of the students in relation to the number of phases and components, has been, in most cases, correct. However, there are deficiencies in the prior knowledge about unsaturated, saturated, and supersaturated solutions and it is, as stated above, the time to remember and reinforce these concepts and note that the example system is of Partial Solubility.
On the other hand, when alcohol is added to the supersaturated water-sugar solution, the students’ responses about the number of phases and components are, in general, correct, although a relevant step is to add more alcohol to make it very clear visually, and thus note that it is an example (water–alcohol) of a system of total solubility.
A very interesting case is presented when adding ice cubes to the water–sugar–alcohol system, because, when students are asked about the number of phases and components, the students’ response has been that one more component has been added to the system, forming a new phase. At this moment, it has become clear that the ice cubes are a new phase, but it is very important to clarify that water and ice are the same components.
Finally, when, in the remaining experience, a liquid that is not soluble in water is added, such as oil or glycerin, the student’s response is usually adequate and perhaps the only thing to highlight is that this last experience represents the opportunity to reinforce the concept of an Insolubility system.
Comments regarding the evaluation of students’ learning
After carrying out this series of experiences in the classroom, different instruments have been applied with the purpose of evaluating the impact of the execution of these activities on student learning in relation to the initial learning objective of achieving a better understanding of the concepts of Phases and Components, as well as those related to the various degrees of solubility that can occur in real alloy systems. Among them we can mention:
The presentation of other case studies, in graphic or written form and in which students identify the number of phases and components. The one who, when faced with specific examples (clear and simple) of alloy systems, for example, Cu–Ni or Au–Ag, even those of some system of ceramic materials, such as the anorthite-albite system (as a sample of total systems solubility), of Cd–Bi, Au–Si, etc., as samples of cases of insolubility. Also others of partial solubility such as Al–Mg or Al–Cu. The students are able to identify, as an initial reinforcement activity, which systems correspond, depending on the shape of the diagram, to what type of system (with total or partial solubility, or insolubility) One more way that has been applied to evaluate the understanding and learning performance that students can achieve, after the activity reported in this text, is through the presentation of different micrographs (adequately selected) and that in them the students. Determine the number of phases observed in these micrographs. This has been done individually and collectively.
It should be taken into account that the general purpose of the series of activities described in this article is oriented to function as an introductory exercise that allows students when they come to study the process of construction and interpretation of the important information that a diagram can contain of phases, they can do so, starting from an understanding of the sufficient and appropriate level, of what it means and how the concept of Phases and Components is applied in real systems.
In this sense, moments after these activities and when the topic of Phase Diagrams is taught, there will be a broader portfolio of mechanisms and forms (which include the construction of phase diagrams, the calculation of the quantity and composition of phases, the identification of reactions and even the use of resources linked to internet sites, online courses, etc.) through which the learning of all the topics related to the teaching of Phase Diagrams can be broadly assessed.
Conclusions
Through the realization of the series of simple experiences carried out in the classroom, proposed and described in this work, it has been possible to improve the learning of the concepts of the topics of Solutions, their Constituents, and various levels of solubility that are they can present in different systems and materials, as well as the Phases in a system.
With the above, a teaching-learning process on the subject of Phase Diagrams has been achieved, which has produced better results in student learning, given the greater previous domain they have in the background related to Phases and Solutions.
The incorporation of other resources of various types (videos, internet sites, exercises, practical sessions in the laboratory, calculation programs, etc.), with an approach associated with the daily reality of the students and oriented, each time to a greater extent, towards visions such as those coming from trends such as STS, STEM, and others, they will enrich the teaching activity in this and other topics of the Materials Science and Engineering courses.
Footnotes
Acknowledgements
The authors of CENISA UNAM thank the Dirección General de Asuntos del Personal Académico (DGAPA) of the UNAM, for the support provided to carry out this work, through Project IT101221 “Desarrollo de Tecnologías Alternativas de Modificación de Superficies para la Mejora de Materiales de Potencial Industrial.”
Declaration of conflicting interests
The author(s) declared no potential conflicts of interest with respect to the research, authorship, and/or publication of this article.
Funding
The author(s) received no financial support for the research, authorship, and/or publication of this article.
Data availability
Data sharing is not applicable to this article as no datasets were generated or analyzed during the current study.