
Abstract
AMCAD (www.amcad.ai) is a web-enabled artificial intelligence (AI) system created to auto-evaluate students’ computer-aided drawing (CAD) work assignments and help students in self-directed learning. It compares two engineering drawings and highlights the differences (errors) between the two. The errors are classified into two categories: “Missing Line” errors shown in red and “Erroneous Line” errors in blue. AMCAD works in tandem with all CAD software. It uses computer vision technology to convert PDF drawings to raster subimages, and XOR to evaluate quantitatively the best-matched with best-aligned views. AMCAD, whose AI algorithms and web application were developed in Python, shows the comparison results in two display modes: superimpose and side-by-side. To encourage students in self-directed leaning, instructional videos can be included in each CAD work assignment.
Introduction
Many schools have adopted home-based learning in the current COVID-19 pandemic to combat the spread of the virus in the community. This however poses challenges in lesson delivery, especially in the field of technical education where learning is experiential and hands-on. Home-based learning has deprived lecturers from conducting physical demonstrations and providing immediate corrective actions when students make mistakes. As such, learning is compromised.
Since 2003, many researchers and educators have developed automated evaluation tools to assess two-dimensional (2D)1–11 and three-dimensional (3D)12–18 computer-aided drawing (CAD) assignments. The purpose of using automated evaluation tools is to provide a fair and objective evaluation, quickly, accurately, and consistently, and to eliminate human errors in the evaluation. If errors in the students’ assignments are marked up, students can, self-directedly, correct the errors and resubmit their work for further evaluation.
Auto-assessment for 3D CAD models
The first 3D CAD model auto-evaluation program for SolidWorks was developed by Baxter and Guerci 12 in 2003. The program compares key data from the user's submitted CAD drawing with the teacher's CAD drawing entities. However, the tool is not able to grade CAD drawings on its own; it requires manual grading as mentioned by the author.
Sanna et al. 13 described another automated assessment tool for 3D model but the tool is for assessing artistic modeling instead of the precise geometry of mechanical 3D models.
Ault and Fraser 14 used PTC Precision learning management system (LMS) designed by PTC technology to automate the grading of 3D Creo files. Similar to 16 this autograding system assesses both geometries and design intent of 3D models. It compares the information of 3D models of users and solution. The information compared includes model volume, surface area, moment of inertia, critical dimensions and the presence and/or absence of 3D features such as extrude, revolve, hole, and pattern features. It also checks if a dimension exists within a sketch. However, there are several limitations with this system. As the system does not accept alternative modeling strategies, the evaluation may be incorrect if users used different approaches from the prescribed solution model. Shape assessment based on volume, surface area, and moment of inertia leads to incorrect grades being assigned. Looking for a specific dimension may not be the best, since there are multiple ways to dimension a single object. In addition, the written evaluation feedback does not show precisely where errors are found in the users’ 3D model.
A Siemens NX-based automarking program for 3D model developed by Kirstukas 15 assesses Siemens NX 3D CAD models using two criteria: geometry and changeability. The program uses Siemens NX Open application programming interface (API) to extract model information from two drawings for comparison. The information includes units, dimension, sketches, shape size, and solid bodies. Comparing drawings with such information, the author realized the program limitations, it cannot correctly evaluate 3D models when reduced to a list of dimensions or instances of certain nonpattern-based features.
KaurJaakma et al. 16 proposed two auto-assessment tools: geometry assessment tool and design intent assessment tool. In geometry assessment tool, mistakes such as missing features and wrong size features are highlighted on the solution drawing. The visual feedback of geometry cannot tell which exact feature has wrong shape or dimension. Moreover, there is no targeted guide to the users on how to correct the geometrical mistakes. In design intent assessment tool, the tool evaluates users’ drawings based on prescribed modeling strategy suggested by the solution. As 3D features can be created by different methods for example, a cylinder can be created by extrude or revolve command, design intent assessment tool will invariably penalize users when the different methods are used in their 3D models. Design intent assessment tool cannot generate visual feedback of discrepancies on the model. The author acknowledged that the auto-assessment is limited to models that fulfill predefined criteria and thus cannot be used to assess open-ended exercise.
Garland and Grigg 17 used commercially available program Graderworks to assess users’ 3D models created in SolidWorks. Graderworks grades Solidworks files and flags user plagiarisms automatically. Graderworks loops over Solidworks files, extracts mass properties and meta-data, and compares the geometry of the users’ drawings to the solution drawing. Gradeworks has built-in rubric for autograding. However, the rubric is not customizable. Gradeworks can evaluate only 3D model created in Solidworks, and provides limited and specific feedback to users on their models.
Nenad et al. 18 developed an auto-evaluation program for 3D CAD models created in different CAD platforms. The program generates XML-structured files from Solidworks and Creo 3D models. The main grading criteria are correctness of features and correctness of dimensions. The program provides written evaluation feedback in PDF. It however does not provide visual cues.
To summarize, the above auto-assessment tools for precise geometry model check the correctness of 3D model geometry by calculating part volume, surface area, and moment of inertia of the model. This method is a flawed proxy because a very dissimilar 3D model can have similar volume and surface area. As such this method is not reliable.
Auto-assessment for 2D CAD drawings
The approach described by Karna 1 and Ivaturi 2 compares AutoCAD DXF (ASCII method of capturing drawing information) files on a web application. Both applications recognize and use the attributes of lines, arcs, ellipses, and circles for comparison. The applications provide only written feedback on users’ drawings errors.
A Windows-based automated grading system designed by Hekman et al. 3 converts students’ AutoCAD drawing (DWG) files to the ASCII DXF file format. The lecturer grades the DXF files for one answer key in a batch format. This system provides both visual and written feedback. However, as the comparison of both drawings is based on geometry attributes (e.g. orientation of line and length of line) in DXF format, the system occasionally matches incorrectly the drawings views. The system also cannot detect noncompliance of orthographic projection drawing standard in user's drawing.
Goh K.N et al. 4 created a software application to perform automatic assessment for 2D AutoCAD drawing. The algorithm converts AutoCAD DXF file to scalable vector graphics (SVG) format and compares the attributes of the individual geometries such as lines, arcs, circles, and ellipses. The application does not provide users with written or visual assessment feedback other than the grade score. Users have to figure out what and where the errors are in their drawings.
Kwon and McMains 5 proposed an automated grading system for native format AutoCAD file (DWG/DXF files). Although the system is translation and scale invariants, the transformation of solution drawing to user drawing may invariably lead to errors. The algorithm is perceptible to grading error when user drawing contains multiple errors as it sometimes fails to transform appropriately.
A master degree project by Ingale 6 developed a software in MATLAB which evaluates sectional and isometric views submitted as picture files by the users. As the evaluation is image-based, the software is not CAD software dependent. However, because the sectional and isometric images in the solution file is predefined in the assessment rubric, and therefore not exhaustive, the evaluation software is not foolproof and is only suitable for simple CAD geometries. The software does not take into account hatching pattern, and is limited to sectional and isometric views; it does not evaluate an entire drawing which may contain views other than the former. Evaluation feedback is presented in written form which is subject to user interpretation, and not user-friendly in terms of self-directed correction. Rabih and Diana 11 further improved the system, however the above issues still existed.
Di Beneditto et al. 7 added more features to the software developed by Ingale. 6 Instead of comparing image files, their web-based application highlights differences such as missing lines, different line colors and line types, line thicknesses, hatchings, etc. between the user and solution drawing in PDF. However, the application does not address the limitations present in Ingale's 6 work. In their article, there is no evidence that the application is translation invariant. One major drawback is the lack of autograding; evaluation scores have to be manually assigned, and therefore subjective. There is no evidence to proof their system can detect the alignment of the views in orthographic projection drawing.
Bryan 8 developed a system that operates both online and offline to compare the properties of geometries (line, arc, circle, and ellipse) in DXF file of two drawings. Unlike other autograding DFX file software, the system compares the necessary features that can correctly describe feature geometries instead of unnecessarily penalizing discrepancies such as overlay or intermediate geometries, and extraneous features, for example, additional layers, line types, viewports, etc. However, this system is coordinate-driven and therefore translation variant. The grading software does not recognize poly line. Therefore, users who use PLINE (command used to draw polylines) command to create the objects instead of using the LINE (command used to draw lines) and ARC (command used to draw arcs) commands, will graded wrongly. Users are unnecessarily inconvenienced to save their DXF files with a name identical to the solution file.
AutoCAD provides a comparison tools called Drawing Compare. 9 It compares changes in a drawing and therefore is not suitable for comparing two different drawings which have the different coordinate or view offsets. Another similar comparison tool to Drawing Compare 9 is ABViewer. 10
As outlined above, presently there is no commercially viable auto-assessing tools for 2D CAD drawings. The 2D CAD drawing auto-assessing tools developed to date cannot fully automatically assess users’ 2D CAD drawing comprehensively.
This article outlines the web application (www.amcad.ai) developed by the authors to address the limitations discussed above. This application automatically evaluates students’ CAD drawings by comparing their submissions with the solution CAD drawing preloaded when students upload their drawings in PDF. The outcome of the evaluation is presented to both lecturers and students quantitatively (scores) and qualitatively (errors). The errors in the students’ drawings are highlighted as either “Missing Lines” in red or “Erroneous Lines” in blue. This comparison aids student self-directed learning as they are guided to correct their mistakes before submitting a fresh submission for further evaluation by the system. The application is scale and translation invariants. It is also equipped with instructional videos to help students with their CAD drawings.
Objective
The objective of AMCAD is three-fold:
Lightens teachers’ workload by replacing manual evaluation with artificial intelligence (AI) evaluation, so teachers have more time to attend to weaker students who need more guided coaching and instructions. Encourages self-directed and blended learning. Students are encouraged to explore and learn at their own pace as the system is available anywhere anytime. To provide a fair and objective evaluation, quickly, accurately and consistently and eliminate human errors in the evaluation.
Flow chart of AMCAD
Figure 1 shows the workflow chart of the evaluation engine (AI algorithm) of AMCAD.
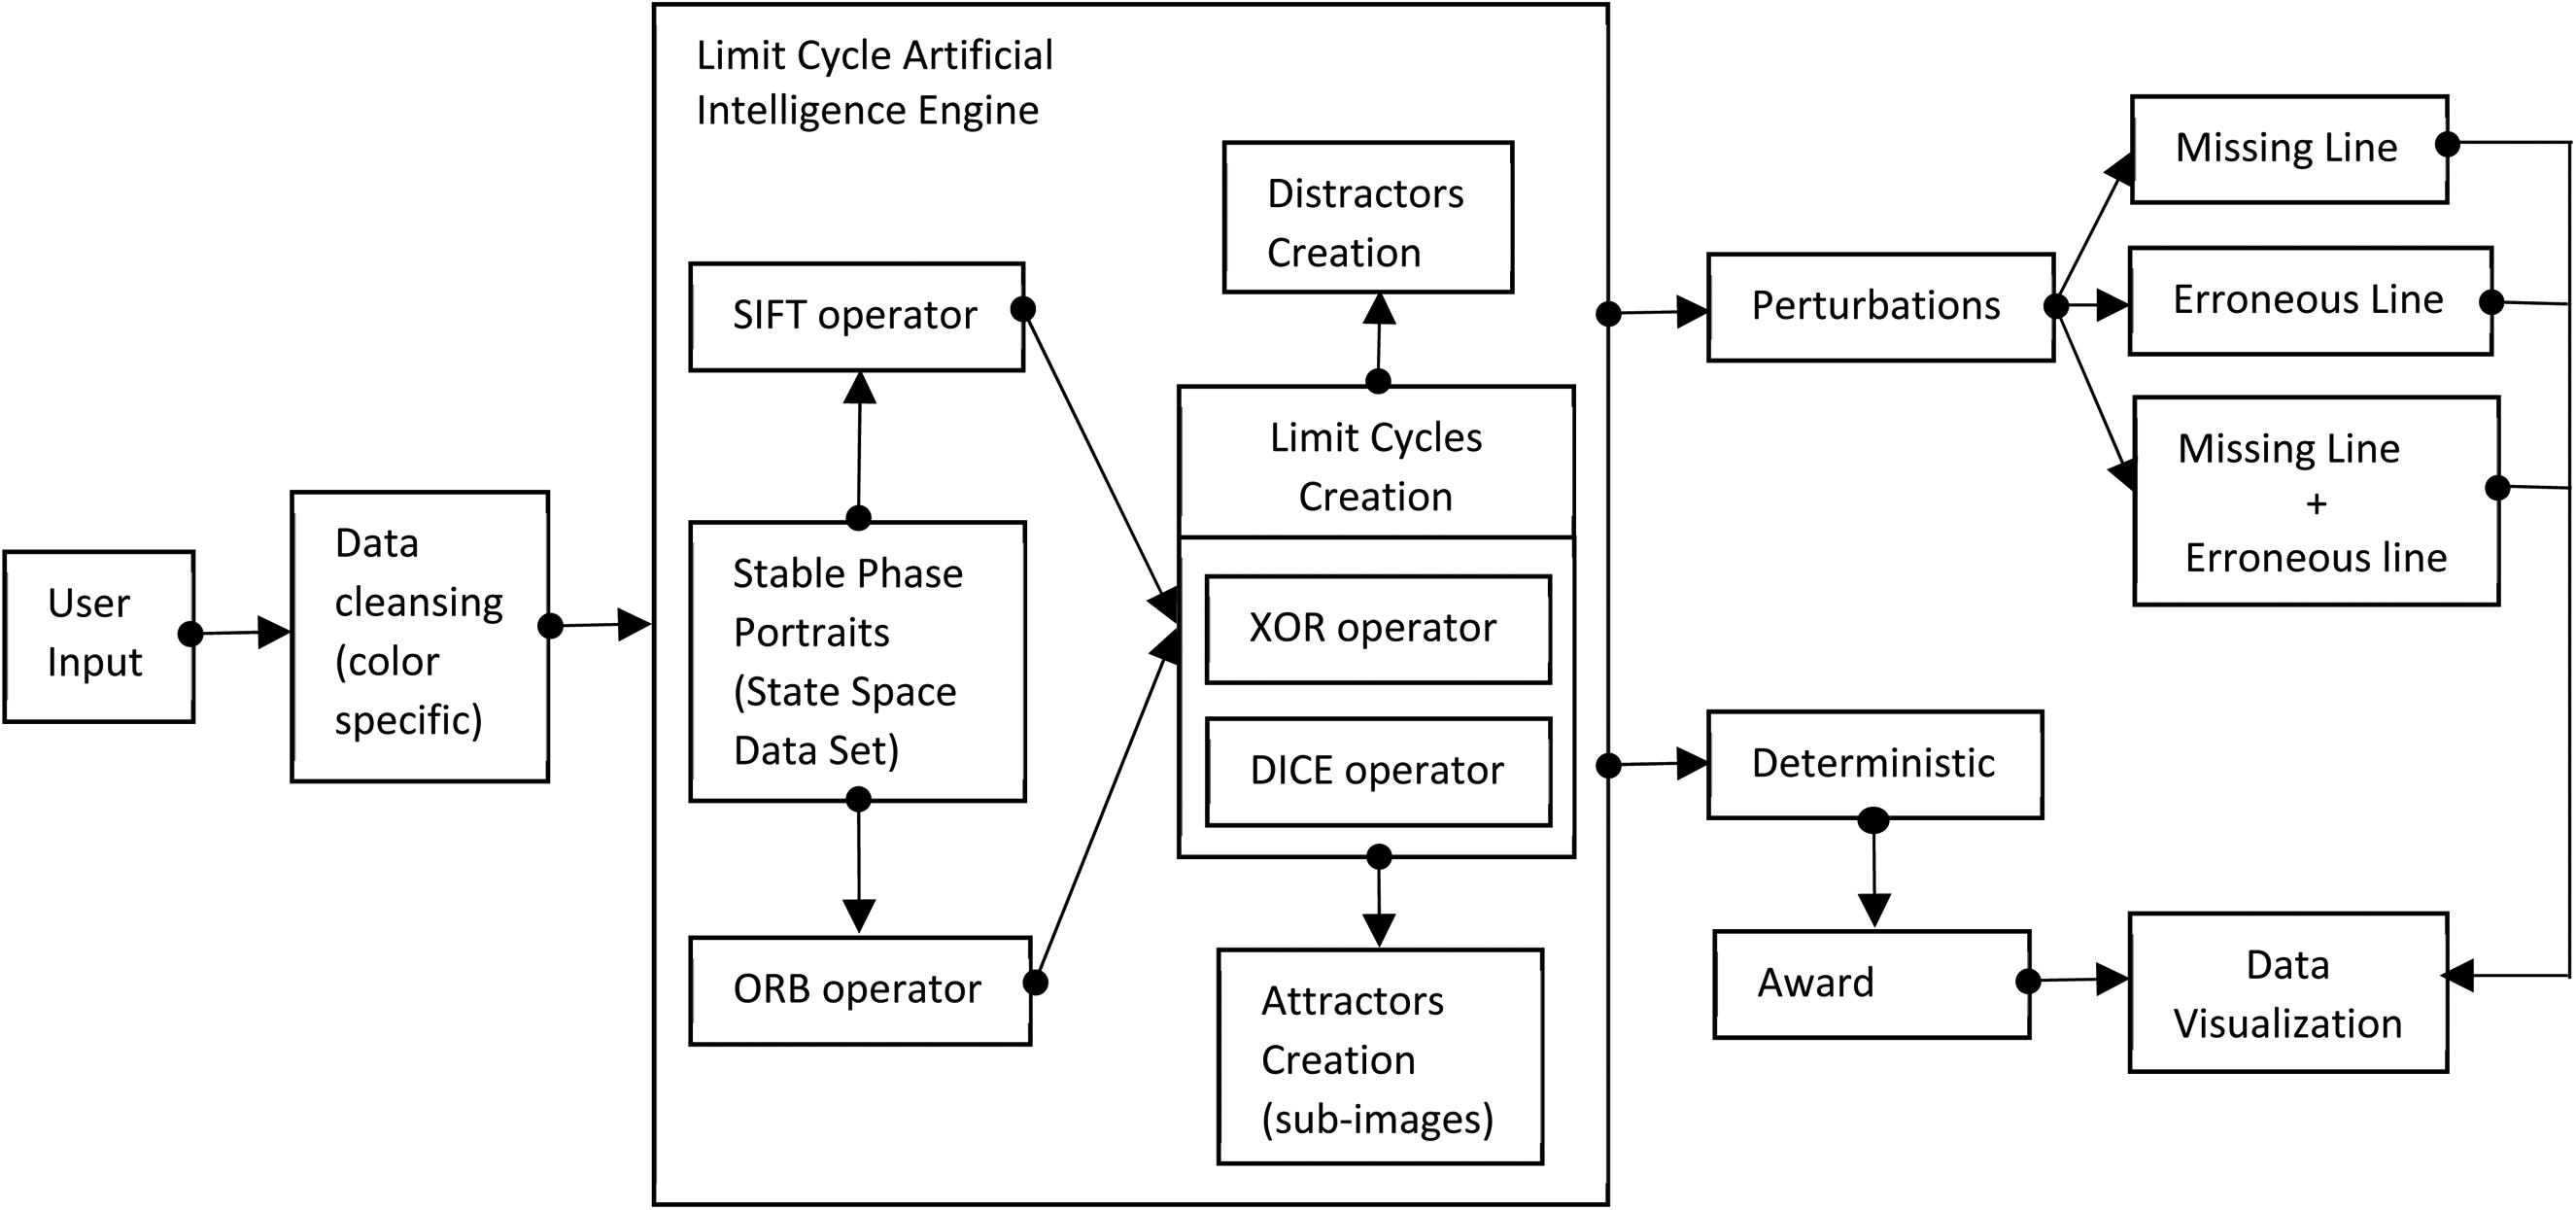
Evaluation engine (AI algorithm) workflow chart. AI: artificial intelligence; ORB: Oriented fast and Rotated Brief; SIFT: Scale Invariant Feature Transform
Figure 2 shows workflow chart of the web application.
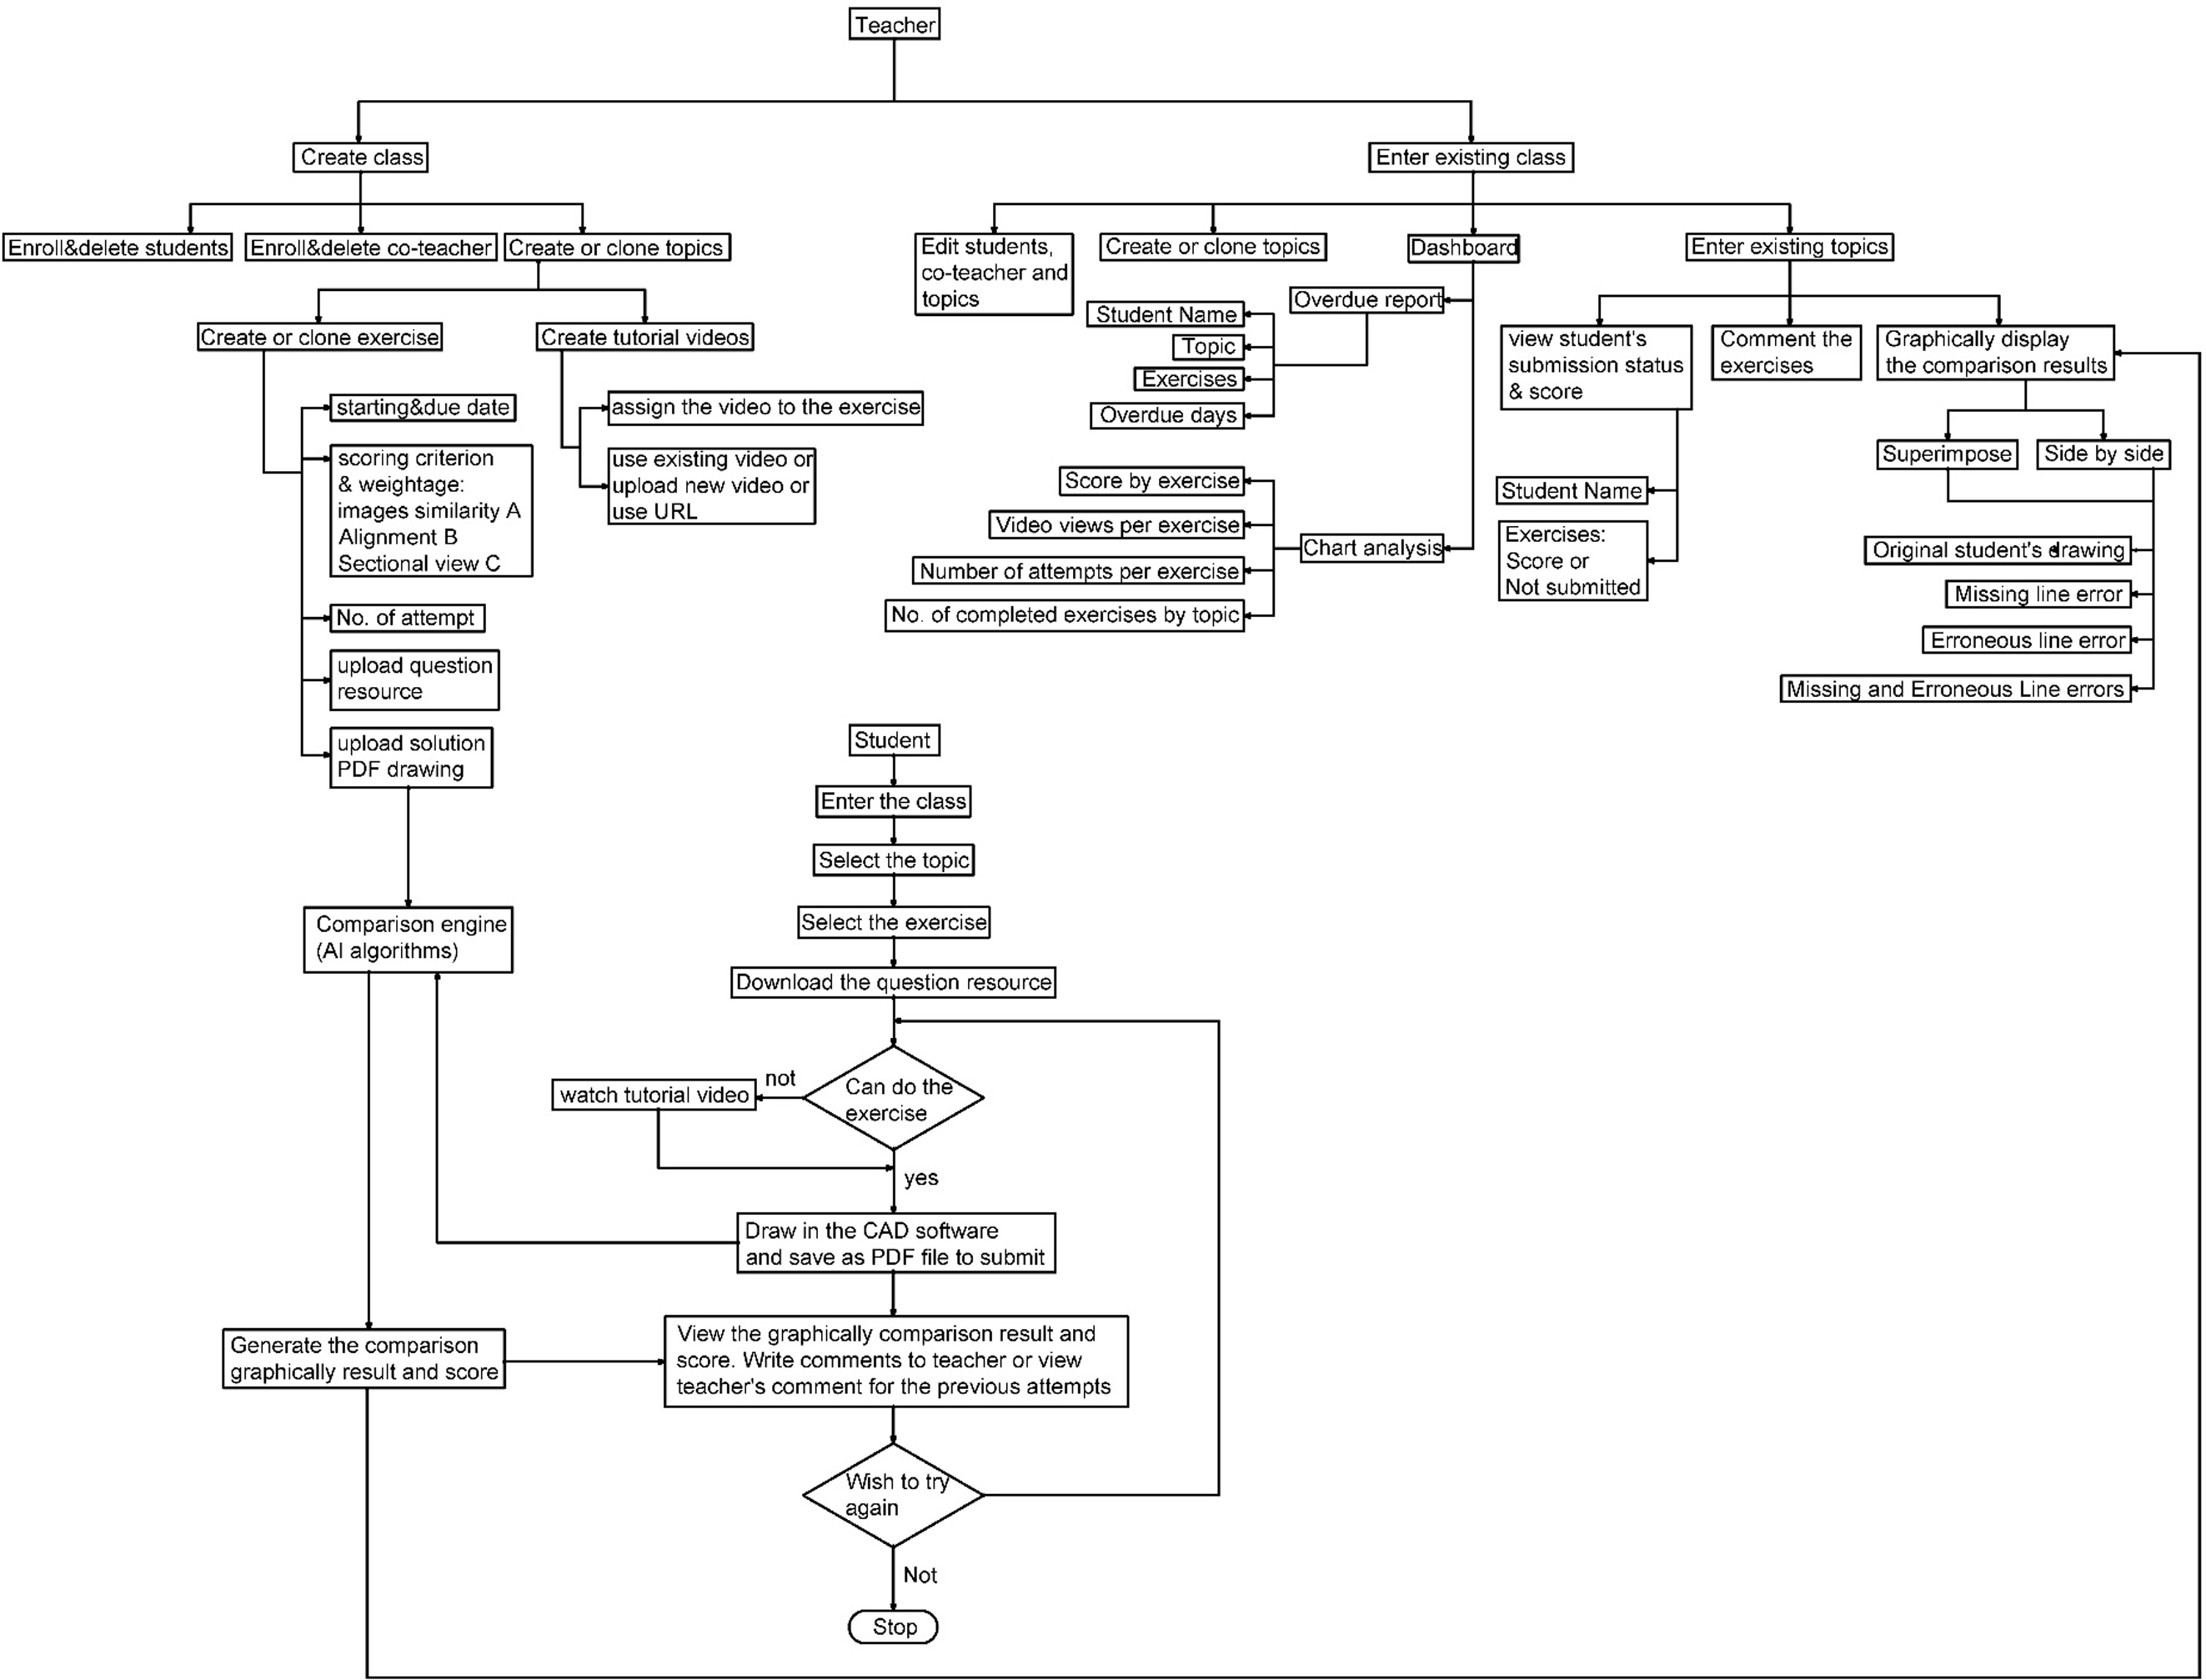
Web application workflow chart. AI: artificial intelligence; CAD: computer-aided drawing.
AMCAD AI algorithm
AMCAD locates two corresponding views in two CAD drawings and detects the following scenarios:
Similarity of the images (correctness of the views), Correctness of angle projection (1st or 3rd angle projection), Correct alignment of various views in orthographic projection drawings, Hatching in sectional drawing. AMCAD assesses the hatching boundaries regardless of the hatching pattern.
AMCAD uses computer vision to process the image, recognize the features, and align the best-matched views. The AI algorithm is divided into three architecture blocks: Image preprocessing, Image convolution, and Scoring of drawing.
In this article, the authors will use a student's CAD drawing as an example to explain the AI algorithm. Figure 3(a) is the student's CAD drawing and Figure 3(b) is the teacher's CAD drawing (solution) preloaded in AMCAD.
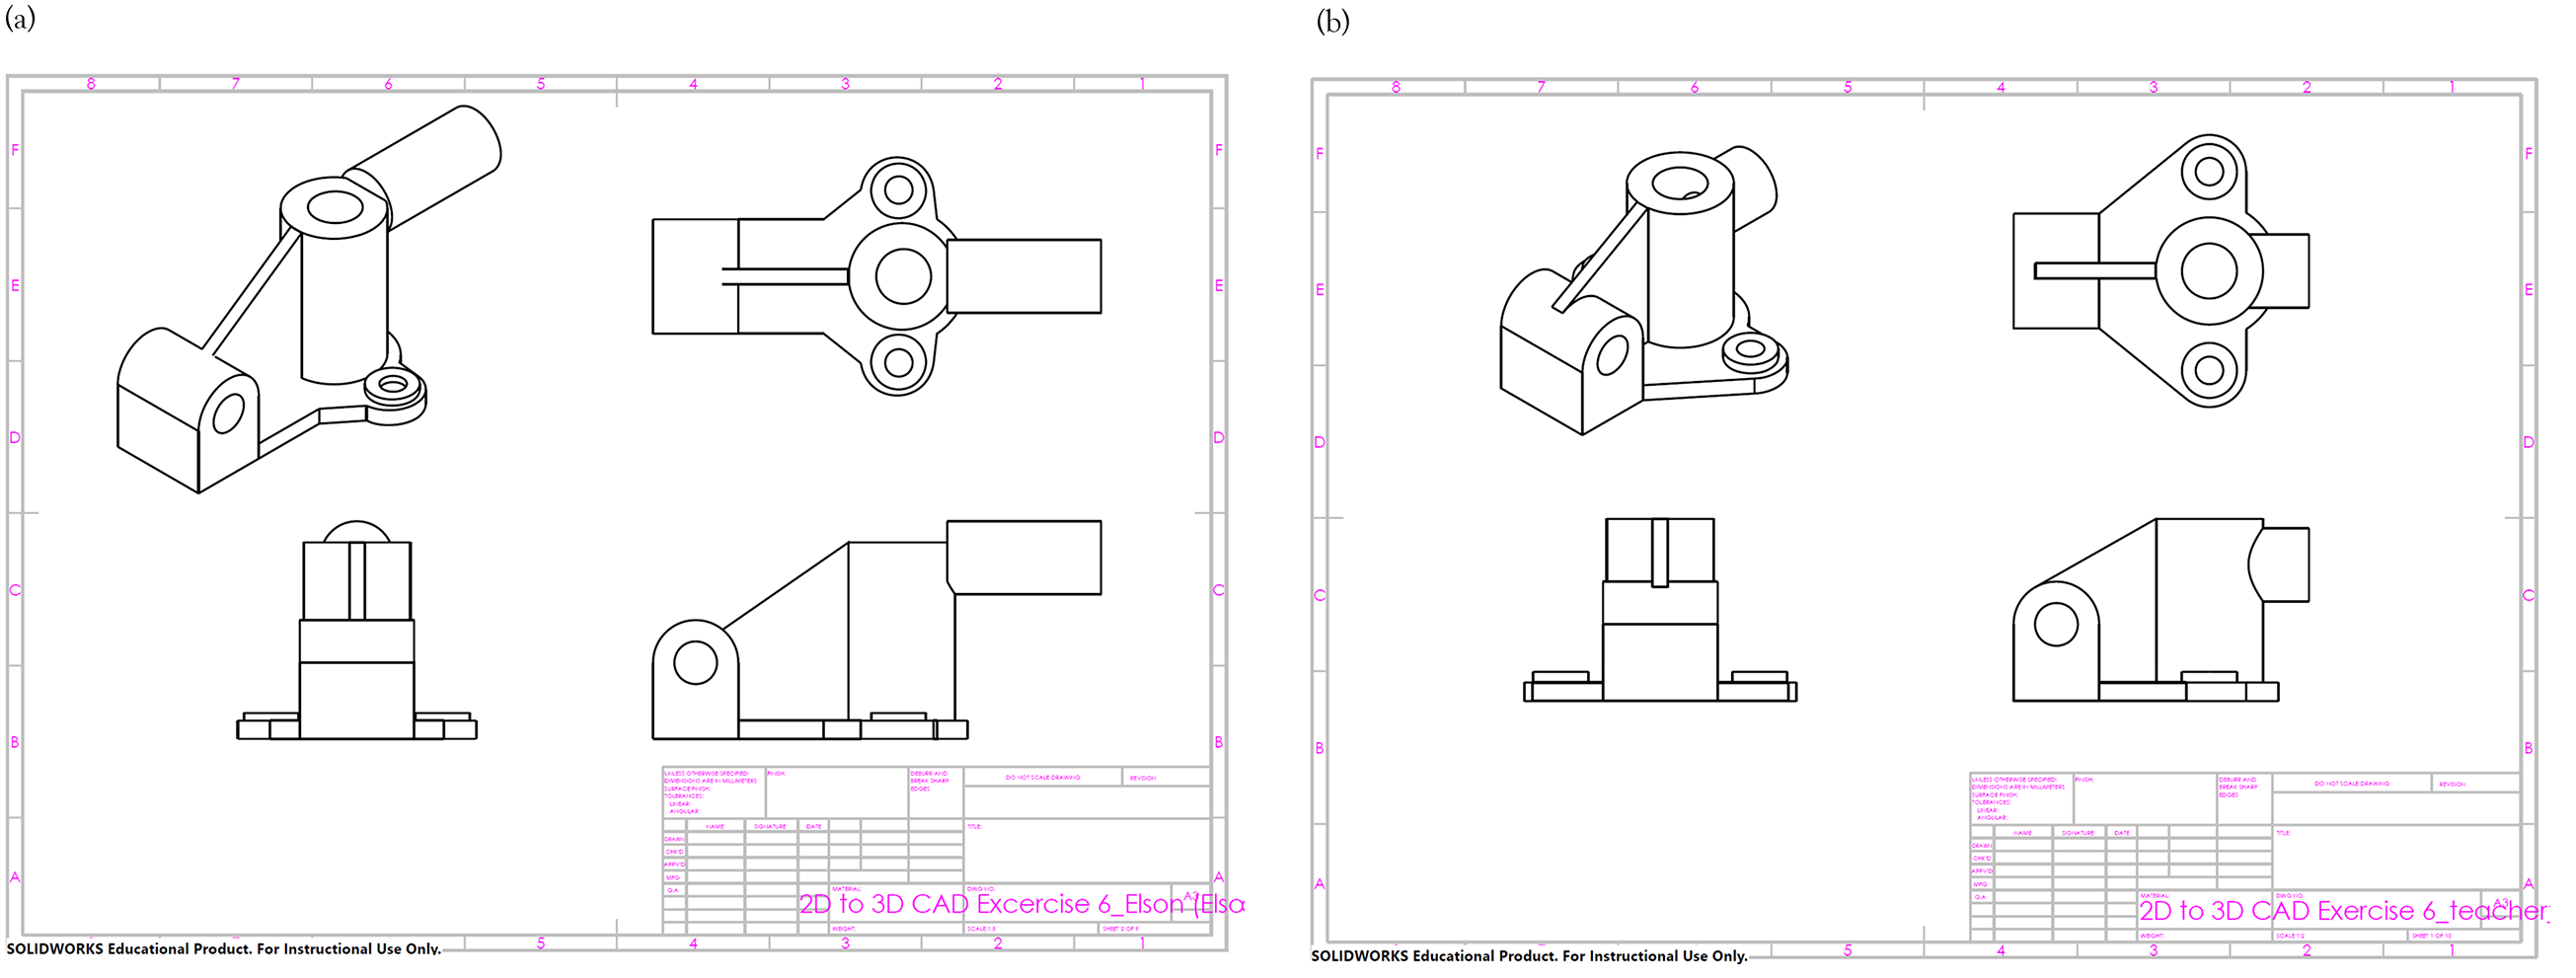
Example used in this article: (a) student's CAD drawing and (b) teacher's CAD drawing. CAD: computer-aided drawing.
Image pre-processing
AMCAD uses OpenCV to process the image. To make it accessible by any CAD software users, AMCAD compares drawings in PDF instead of users’ native CAD format. There are two types of images: vector and raster images. AMCAD uses raster image. This process is shown in Figure 4.
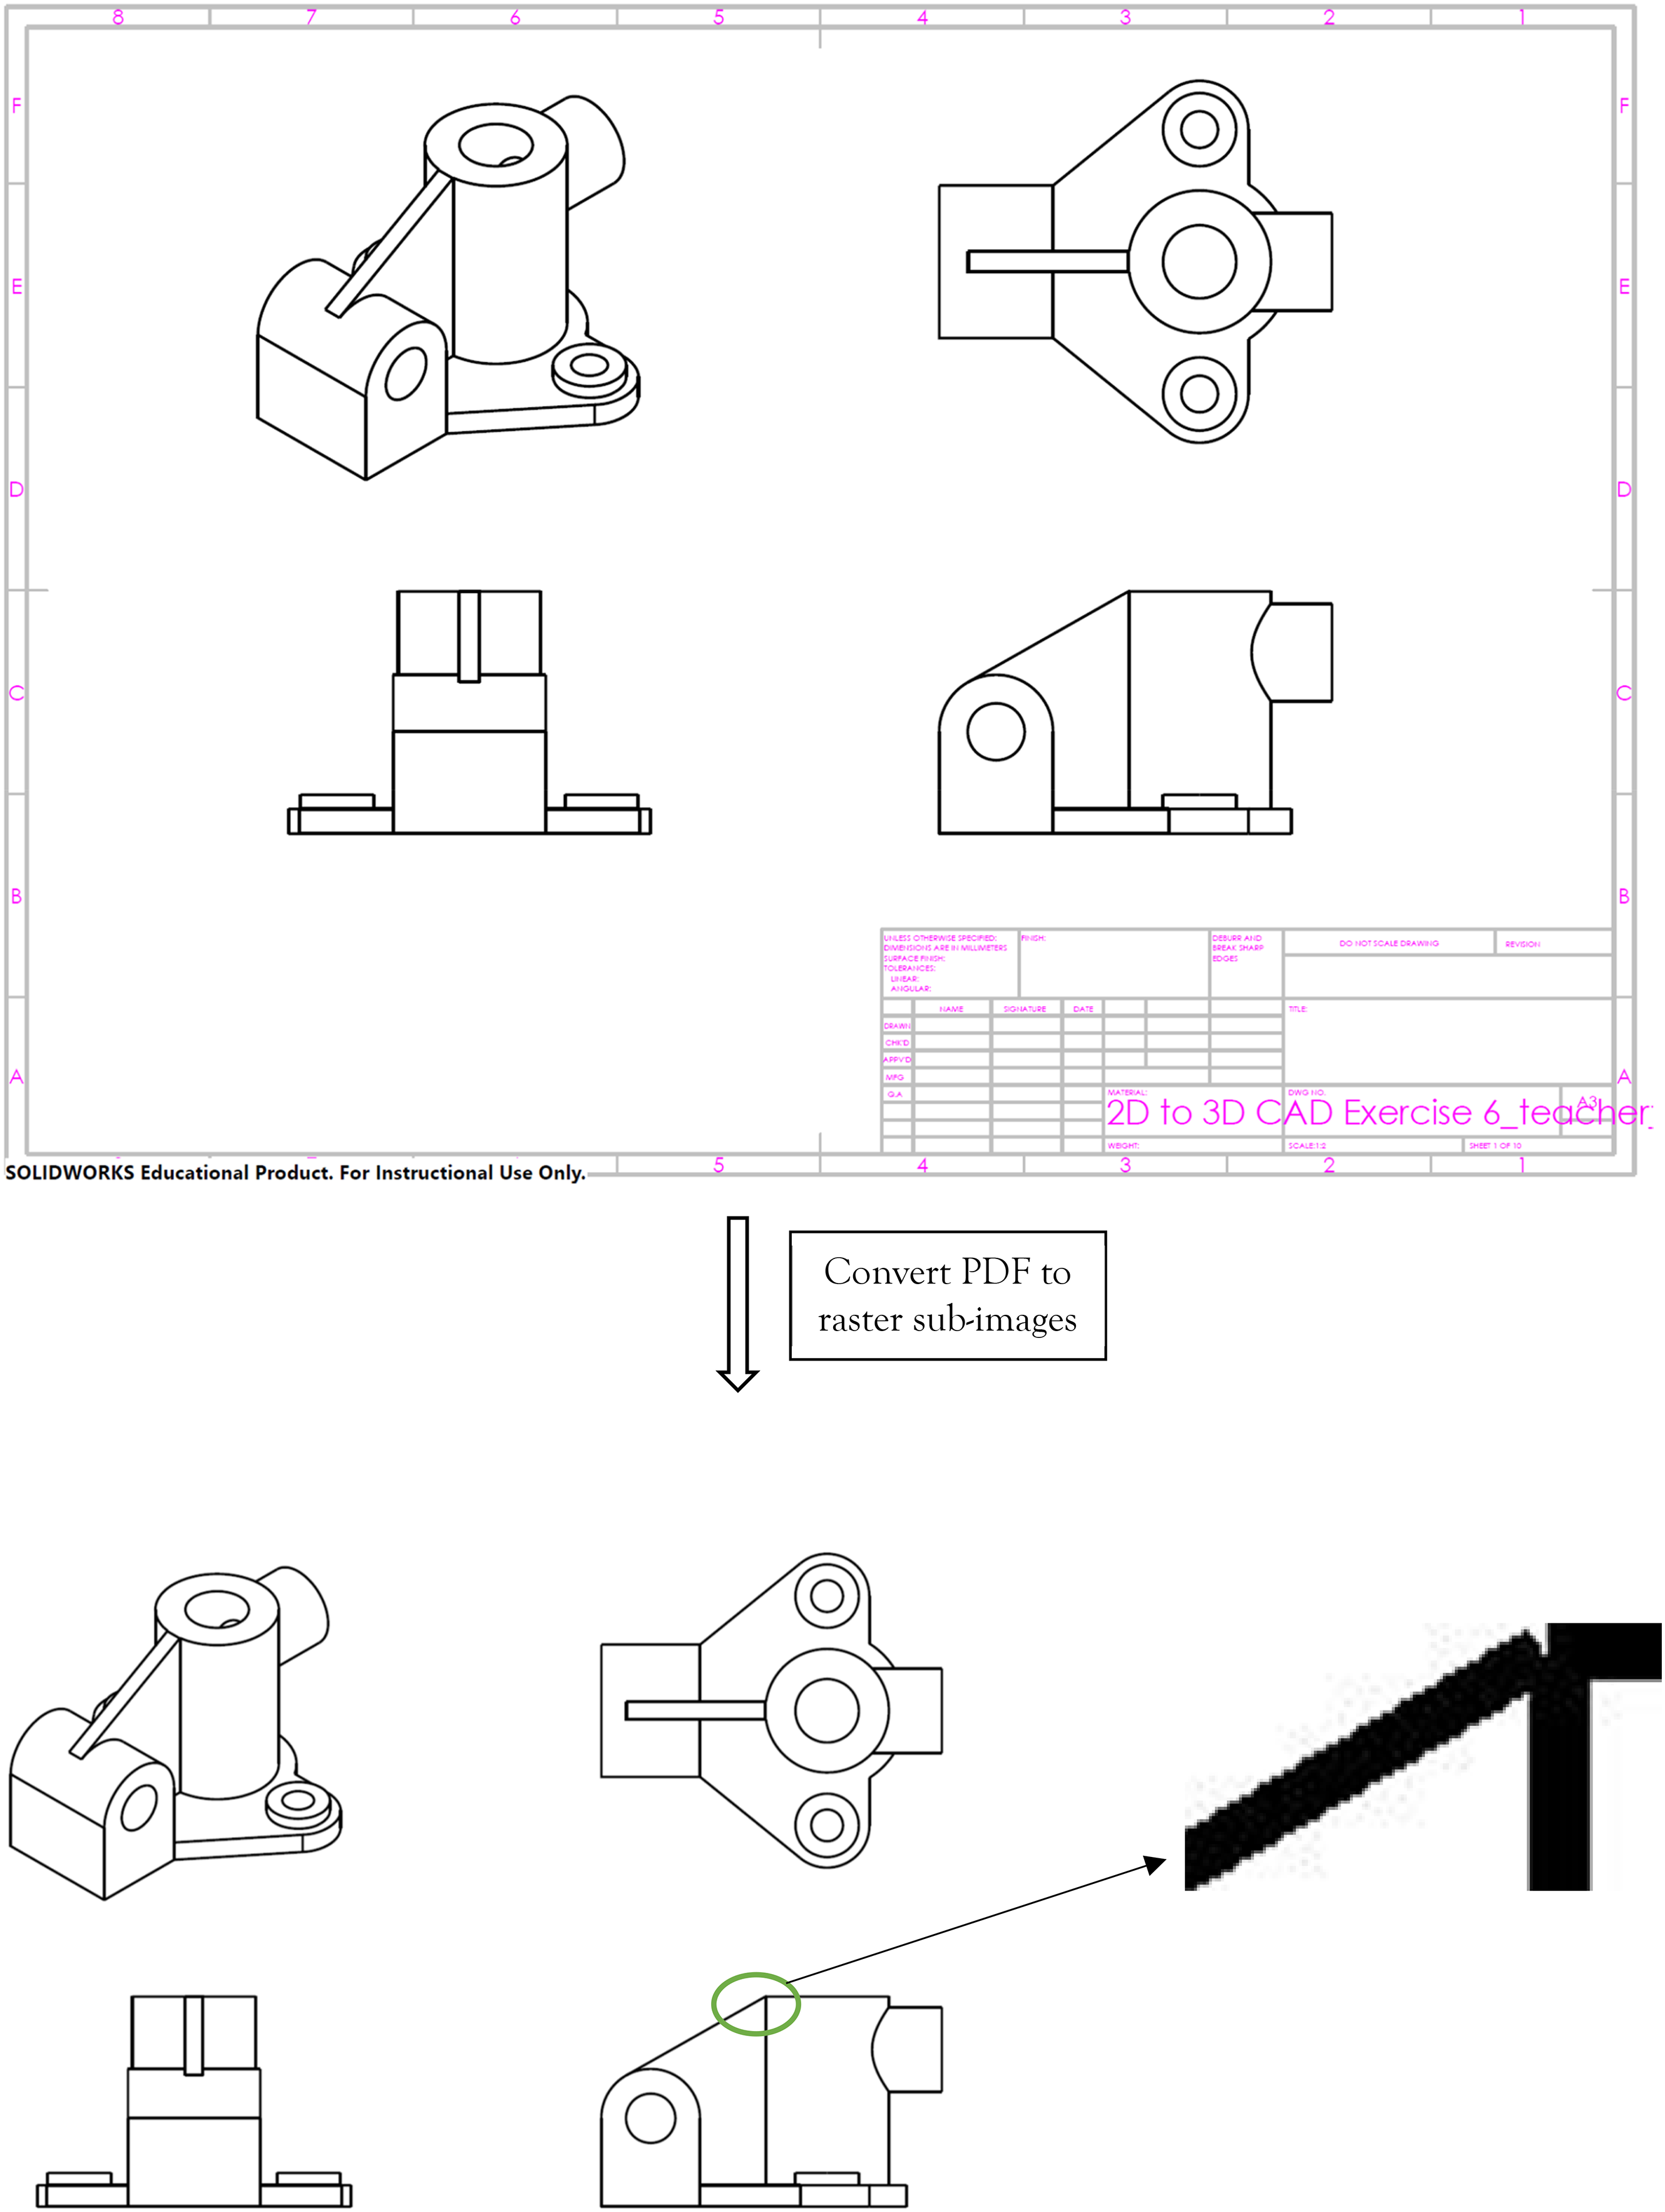
Preprocess images in AMCAD.
Image convolution
Translation invariant
AMCAD uses the combination of Scale Invariant Feature Transform (SIFT) and Oriented fast and Rotated Brief (ORB) to detect the features, match the subimages so as to find the best-matched views with best alignments regardless of their locations. The combination of SIFT and ORB can give high precision rate of matching. 19 AI algorithm identifies the best-aligned subimages, and among these best aligned subimages identifies the best-matched subimages. XOR score is used to evaluate quantitatively the alignment and matching performance. When two images completely overlap, XOR returns a 0, else XOR will be greater than 0. The XOR score depends on the number of nonoverlap pixels.
Figure 5 shows the matching process of raster subimages of the student's and teacher's drawings illustrated in Figure 3. As both drawings have 4 subimages, there will be 16 matching pairs. AMCAD AI algorithms uses SIFT and ORB to match subimages and calculate the XOR score for the 16 pairs to get the best-matched subimages with best alignment.
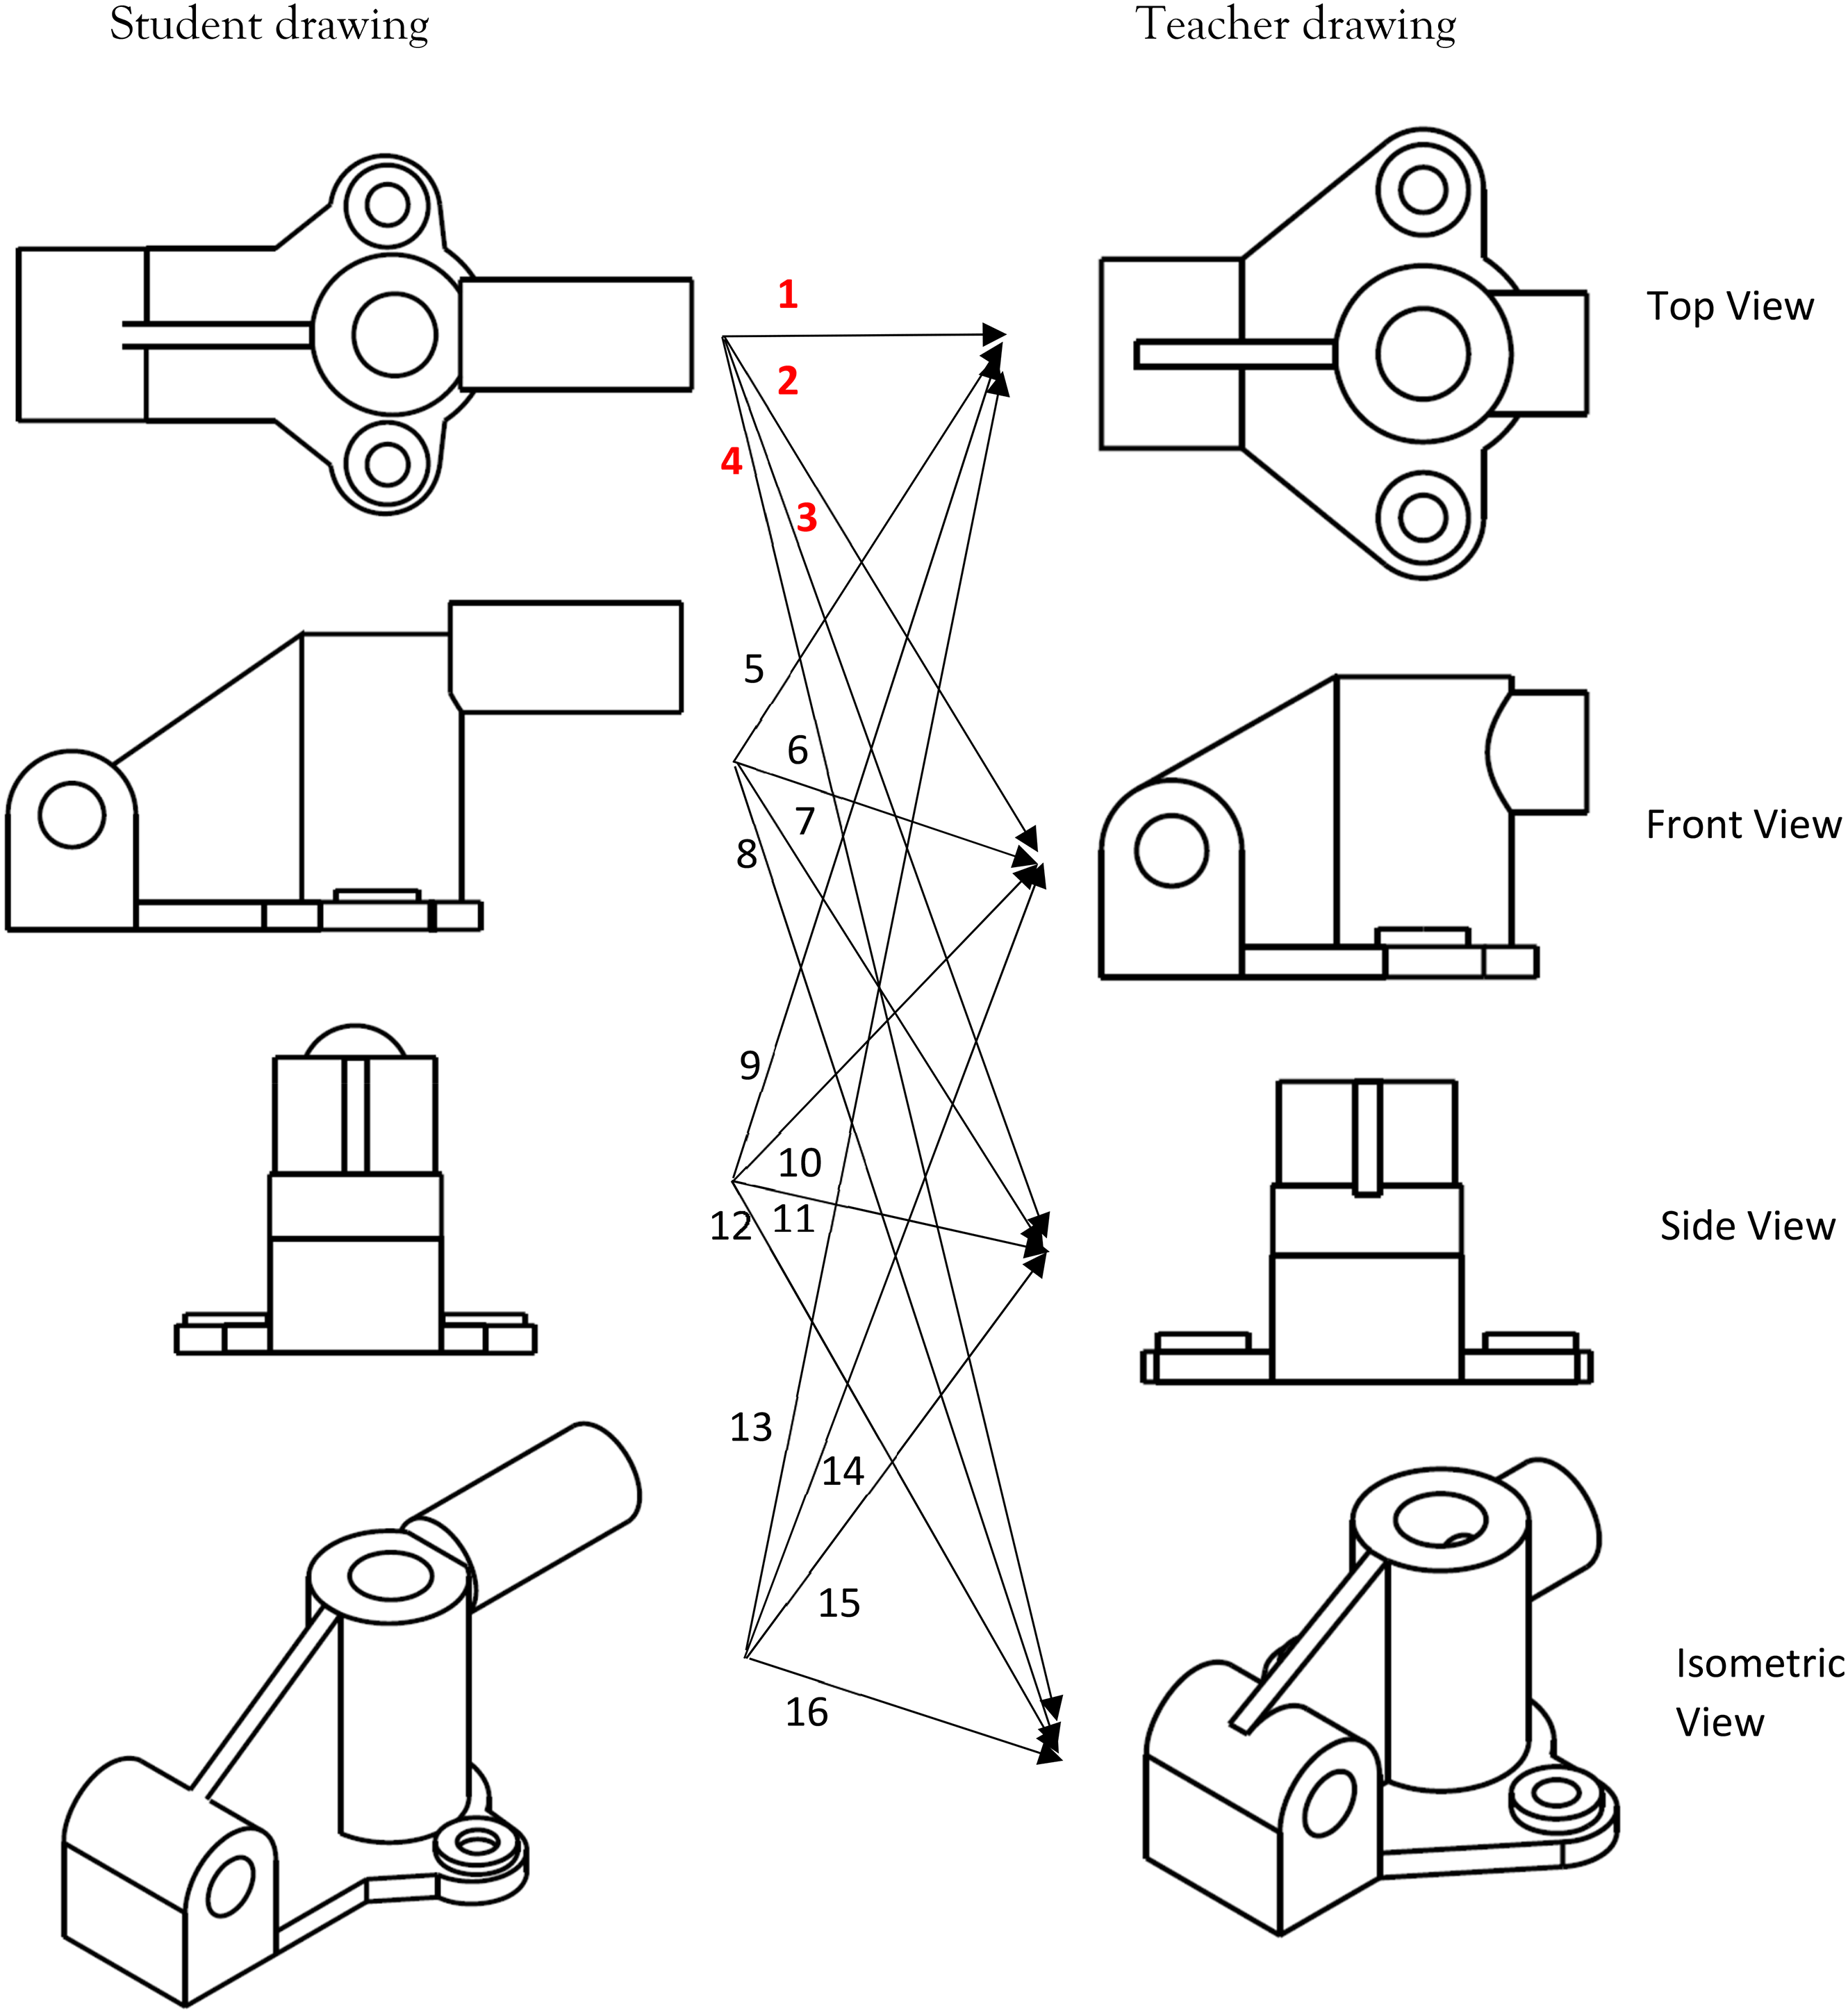
Matching of subimages.
The algorithm finds the lowest XOR (Exclusive OR) score (best alignments) for the 16 pairs at different alignment shown in Figure 5. The results are summarized in Table 1. As shown in Table 1, the best-matched subimage with the best alignment has the lowest XOR score.
Minimum XOR score of 16 pairs of subimages at different alignments.
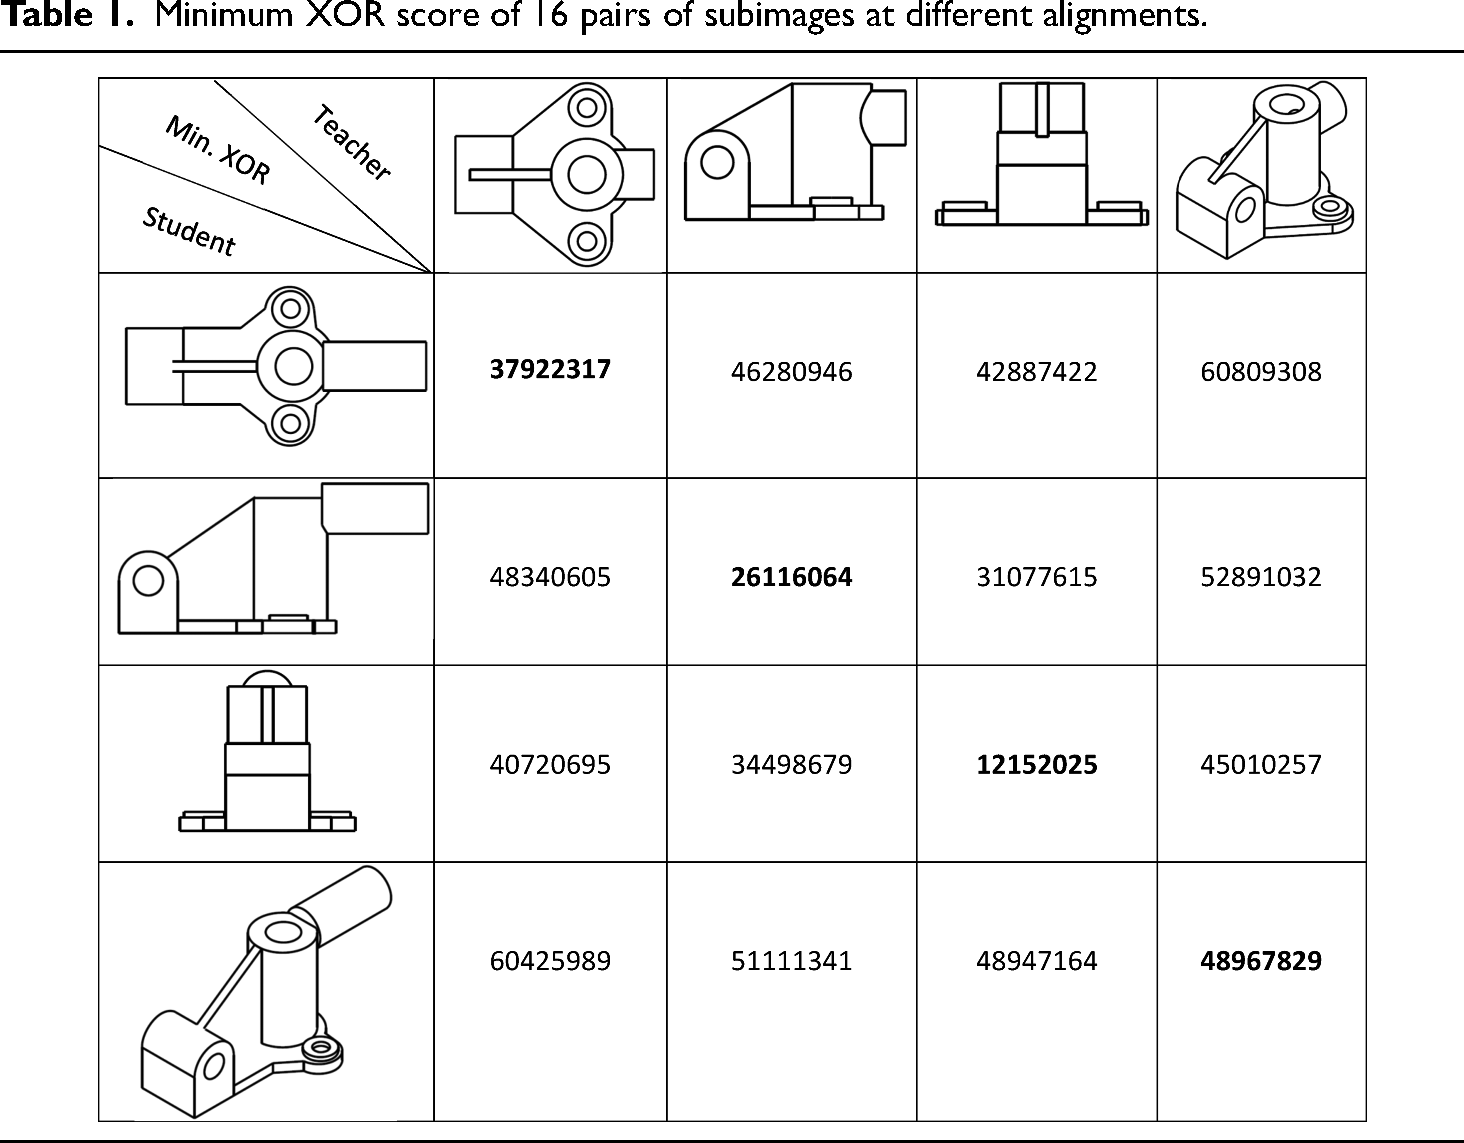
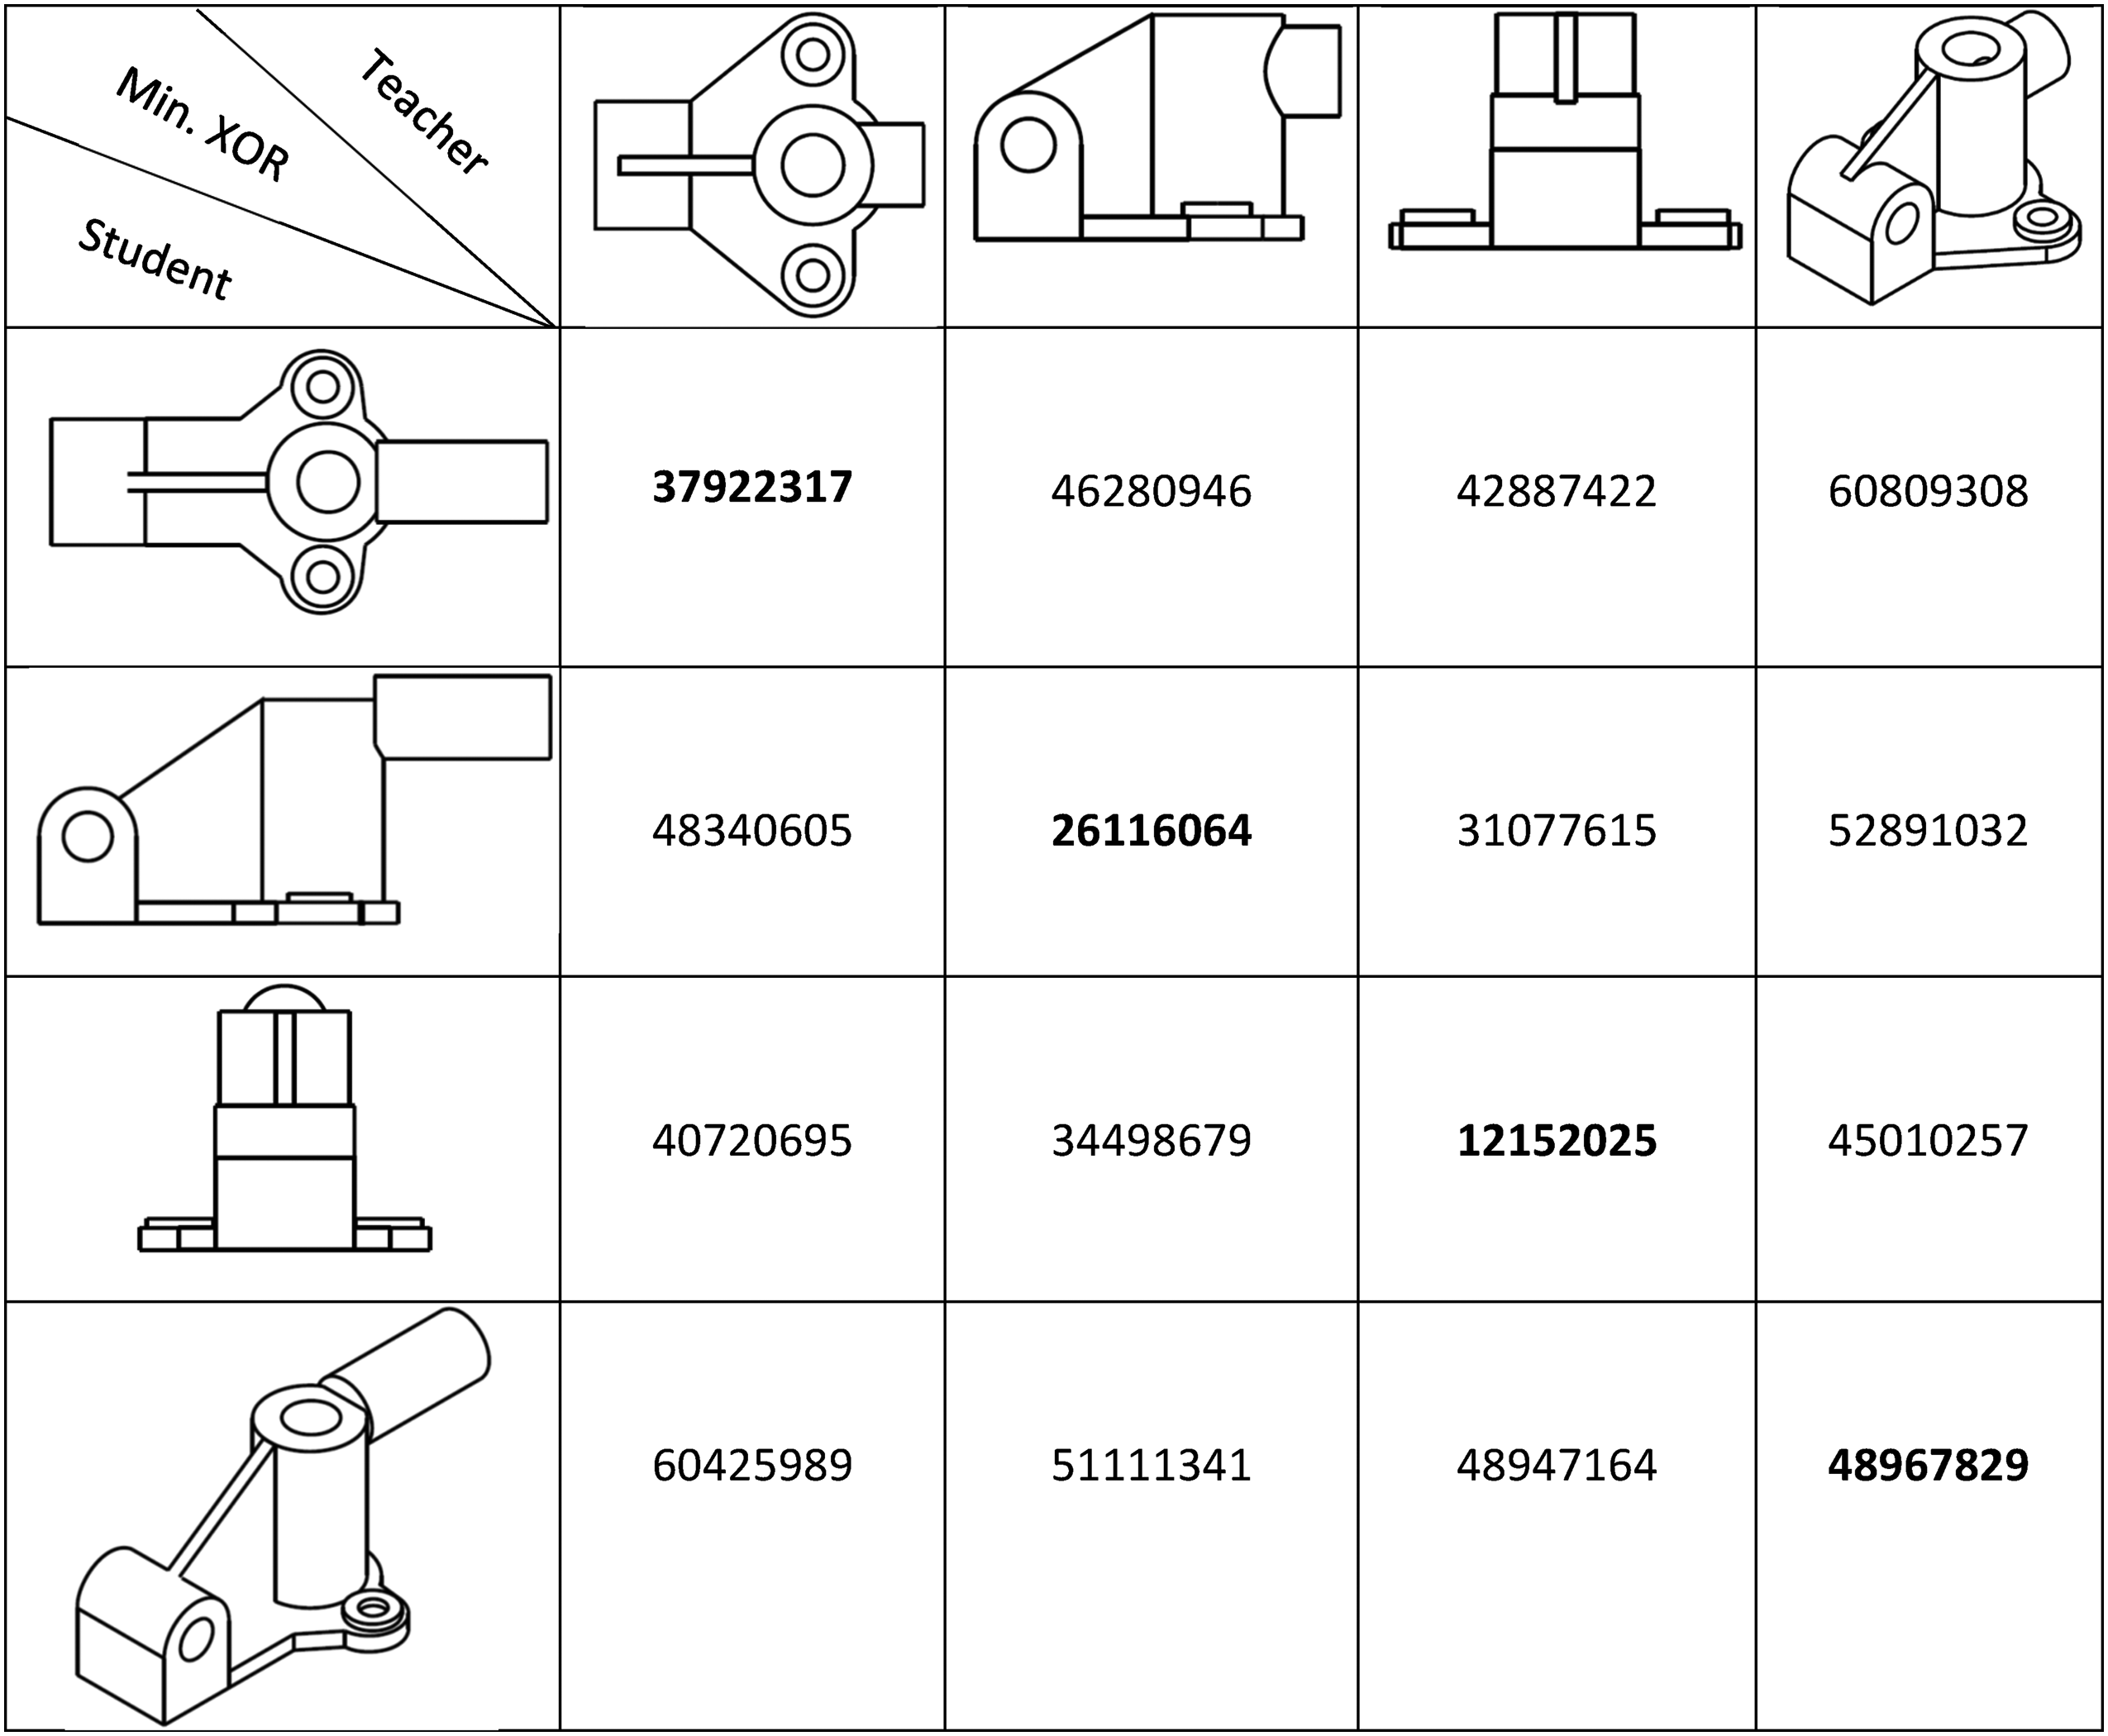
Figure 6 shows the best matched with best alignment of four subimages: pairs 1, 6, 11, and 16 as in Figure 5.
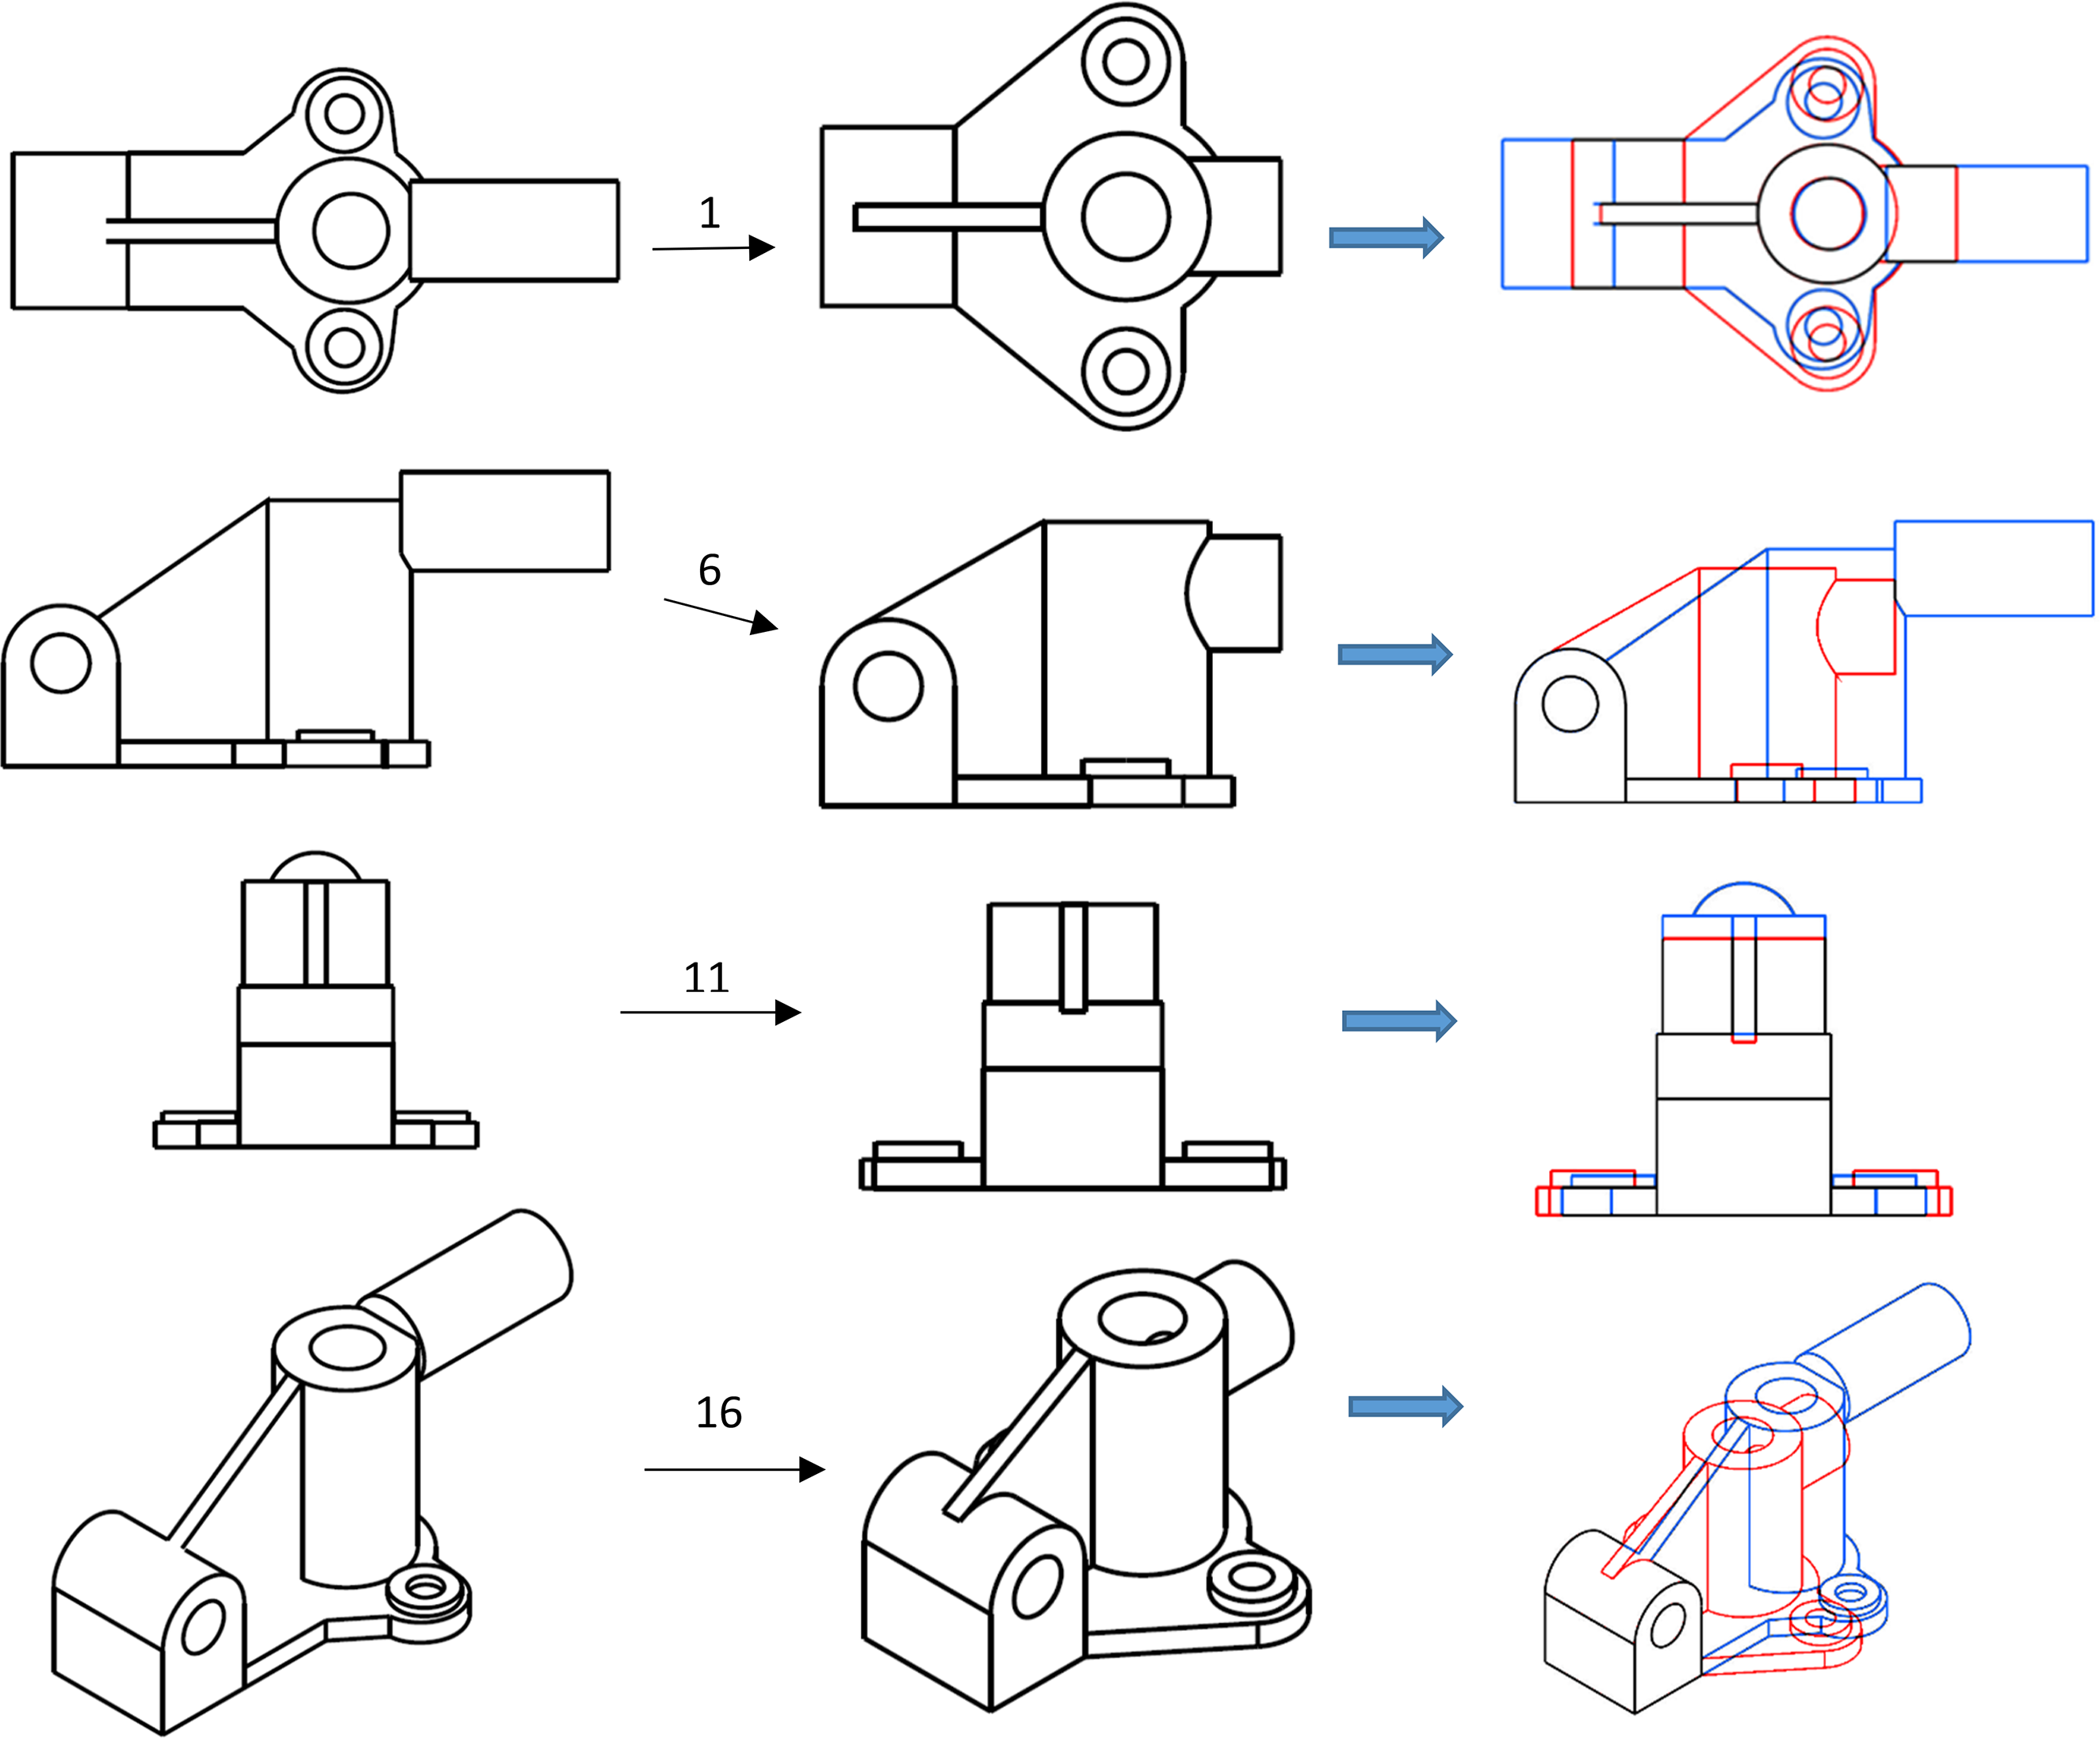
Best-matched subimage with best alignment.
Alignment of subimages (views) in the drawing
In engineering drawing, there are two standard orthographic projections: first angle projection and third angle projection. The drawing views must be projected and aligned in accordance to the angle of projection used in the drawing. AMCAD detects and penalizes for noncompliance. The system learns the requirements of alignment for the multiple subimages (views) in the teacher's drawing based on the pixels in the extreme locations (highest, lowest, leftmost, and rightmost) of the views. AMCAD uses these learnt requirements to check the alignments of the multiple subimages in the student's drawing. By using this method, AMCAD is able to detect if the student's drawing complies with the drawing standard in projection and alignment of the various views.
Scale invariant
Although engineering drawing does not have variant in orientation and illumination, we still need to consider the scale variant. SIFT and ORB matching techniques are scale invariant, so the best matched views will not vary if the scale is different. Figure 7 shows the matching of subimages at different scale. It proves best subimages matching in AMCAD will not be affected by scale changes and will still be able to detect the alignment error (for orthographic projection drawing) as described above.
Best-matched subimage at different scale.
Scoring of the drawing
The scoring of drawing in AMCAD consists of three portions:
Similarity of images (drawings)—weightage A; Alignments of subimages (various views in the drawing)—weightage B; Hatching boundaries (for sectional drawing only)—weightage C.
The weightages A, B, and C are determined by teacher when he/she creates the question.
DICE coefficient (a spatial overlap index and a reproducibility validation metric) is a similarity index with score ranging from 0 to 1. 1 corresponds to a pixel perfect match. Zero means there is no pixel overlap. The student's drawing similarity score is based on DICE coefficient, which is 2× sum of intersection pixels/sum of all union pixels. The formula of DICE is shown in Figure 8(a). The higher the score, the higher the degree of similarity between the teacher's and the student's drawings.
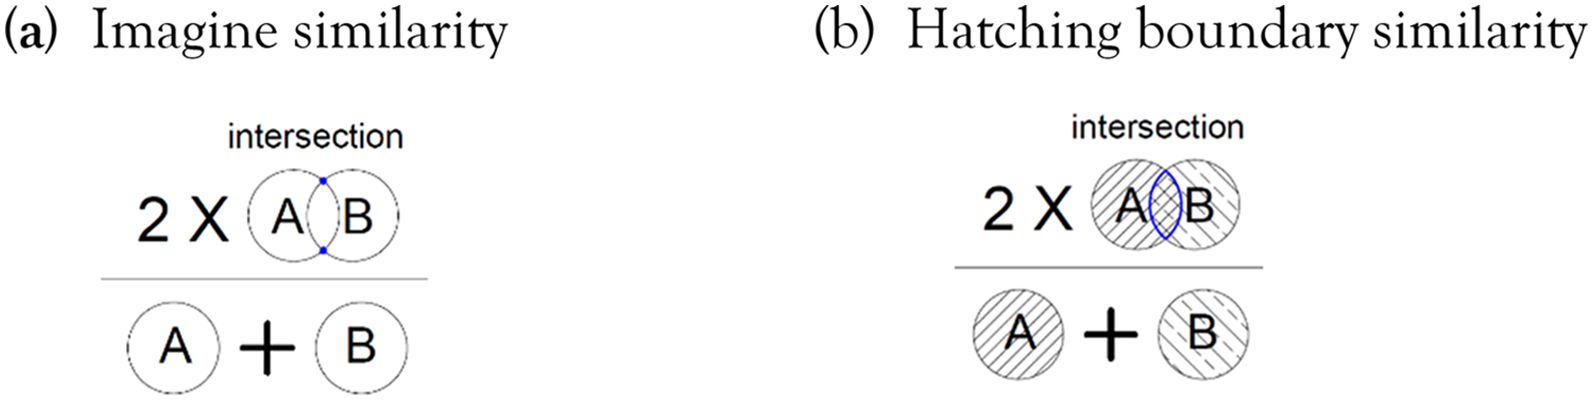
DICE formula. (a) Imagine similarity. (b) Hatching boundary similarity. Total score for the drawing = Total DICE × weightage A + (1 or 0) × weightage B + DICE × weightage C.
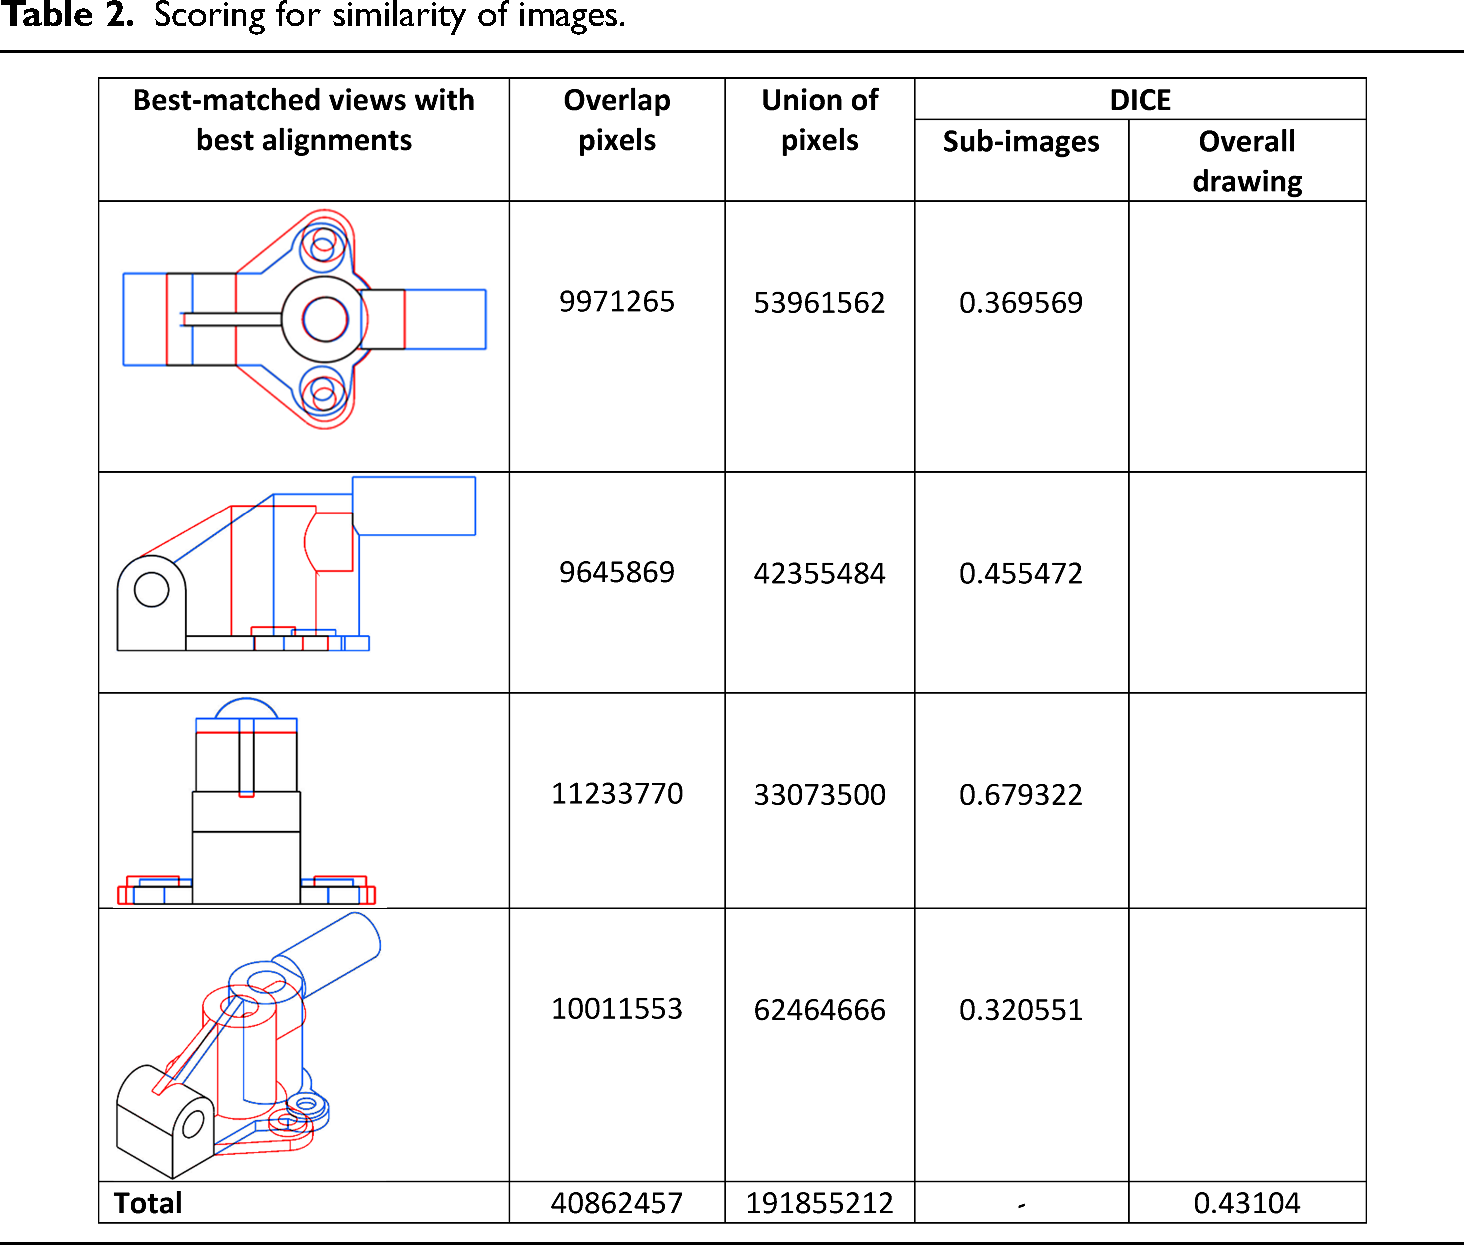
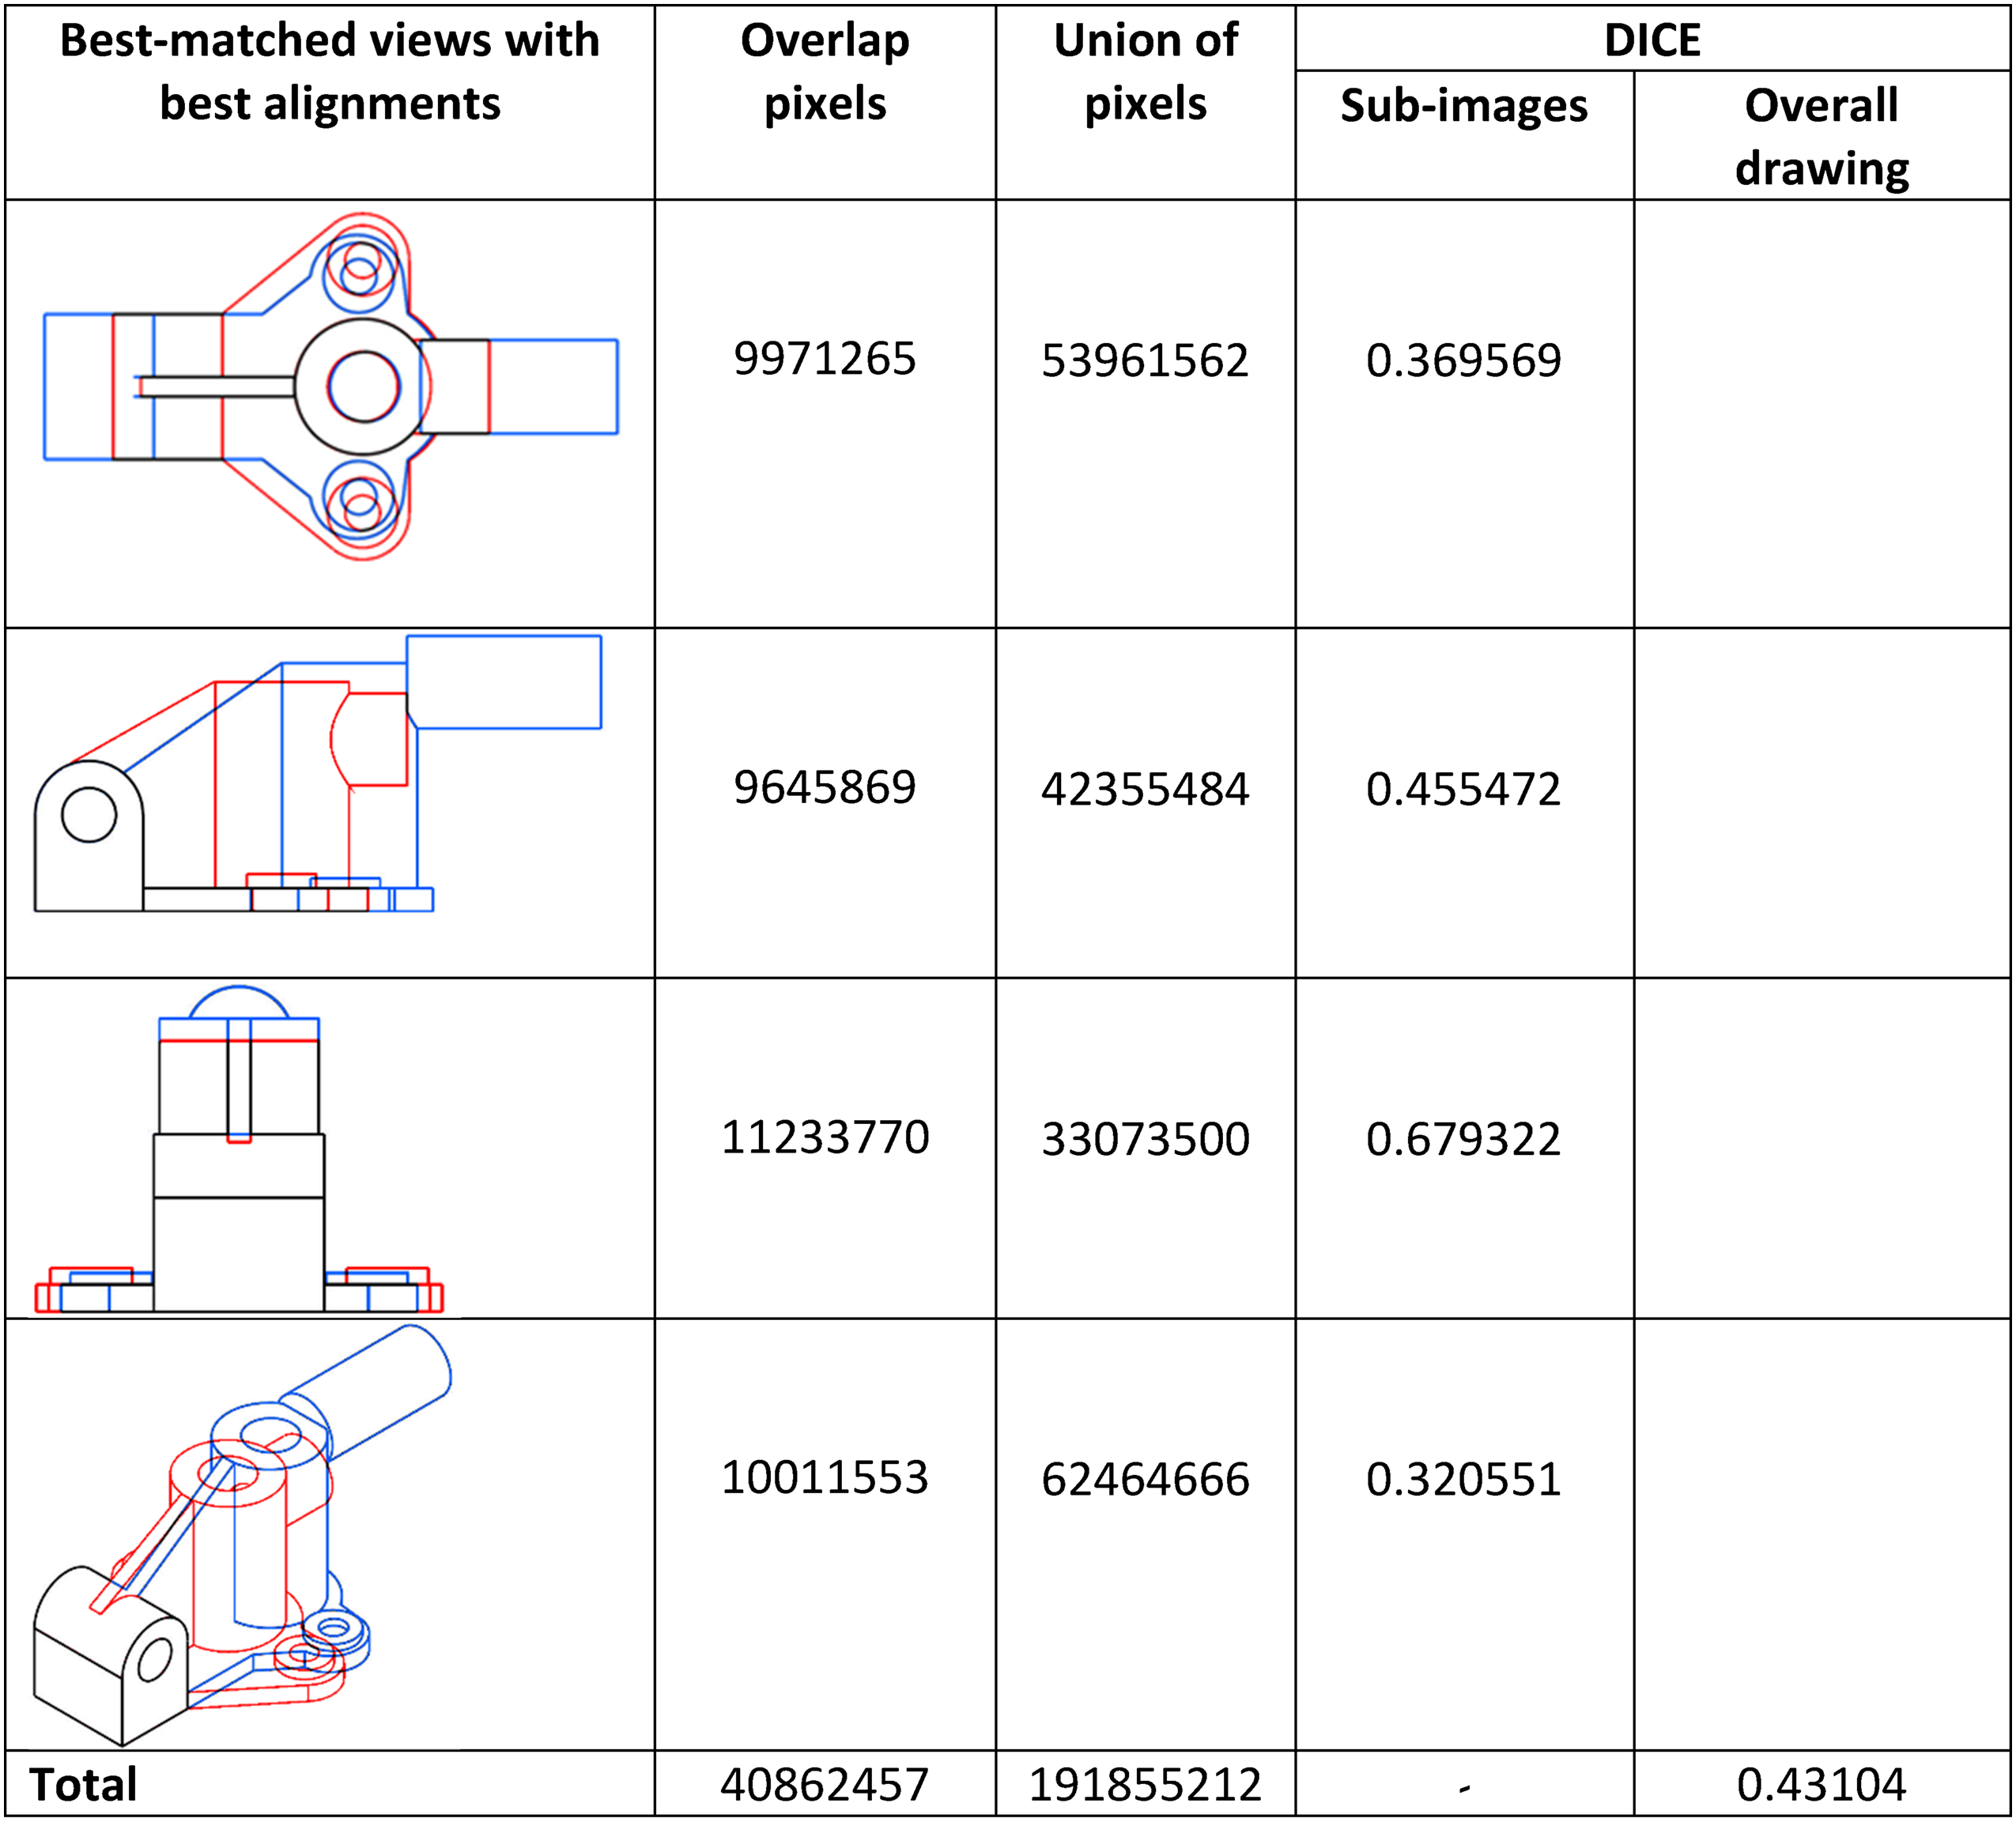
Table 2 shows the DICE coefficient for each individual best-matched subimage with best alignment, and the total DICE coefficient of the drawing. The total DICE coefficient is the score for similarity of images.
Scoring for similarity of images.
As scoring is based on pixel count, both teacher's and students’ drawing must have the same scale although the matching of views are scale invariant.
The alignment criterion is Boolean-based: “Yes” for compliance, “No” for noncompliance. The teacher decides the weightage B for alignment criterion. If compliance is met, alignment score is 1 of the weighted score. Else, 0.
The hatching boundaries score is also based on the DICE coefficient. Unlike the image similarity DICE score, it uses hatching boundaries instead of pixels count. AMCAD calculates the areas enclosed by the hatching boundaries in both drawings and the area of intersection of the best aligned sectional views. In the DICE formula shown in Figure 8(b), assume A and B are the hatching areas in the student's and teacher's drawing, respectively. The sum of A and B is the denominator and the area of intersection of the hatching is the numerator. The DICE coefficient is used to evaluate the percentage of the hatching boundary similarity.
Implementation strategies
Three scenarios detected in AMCAD
Similarity of the images (correctness of the views)
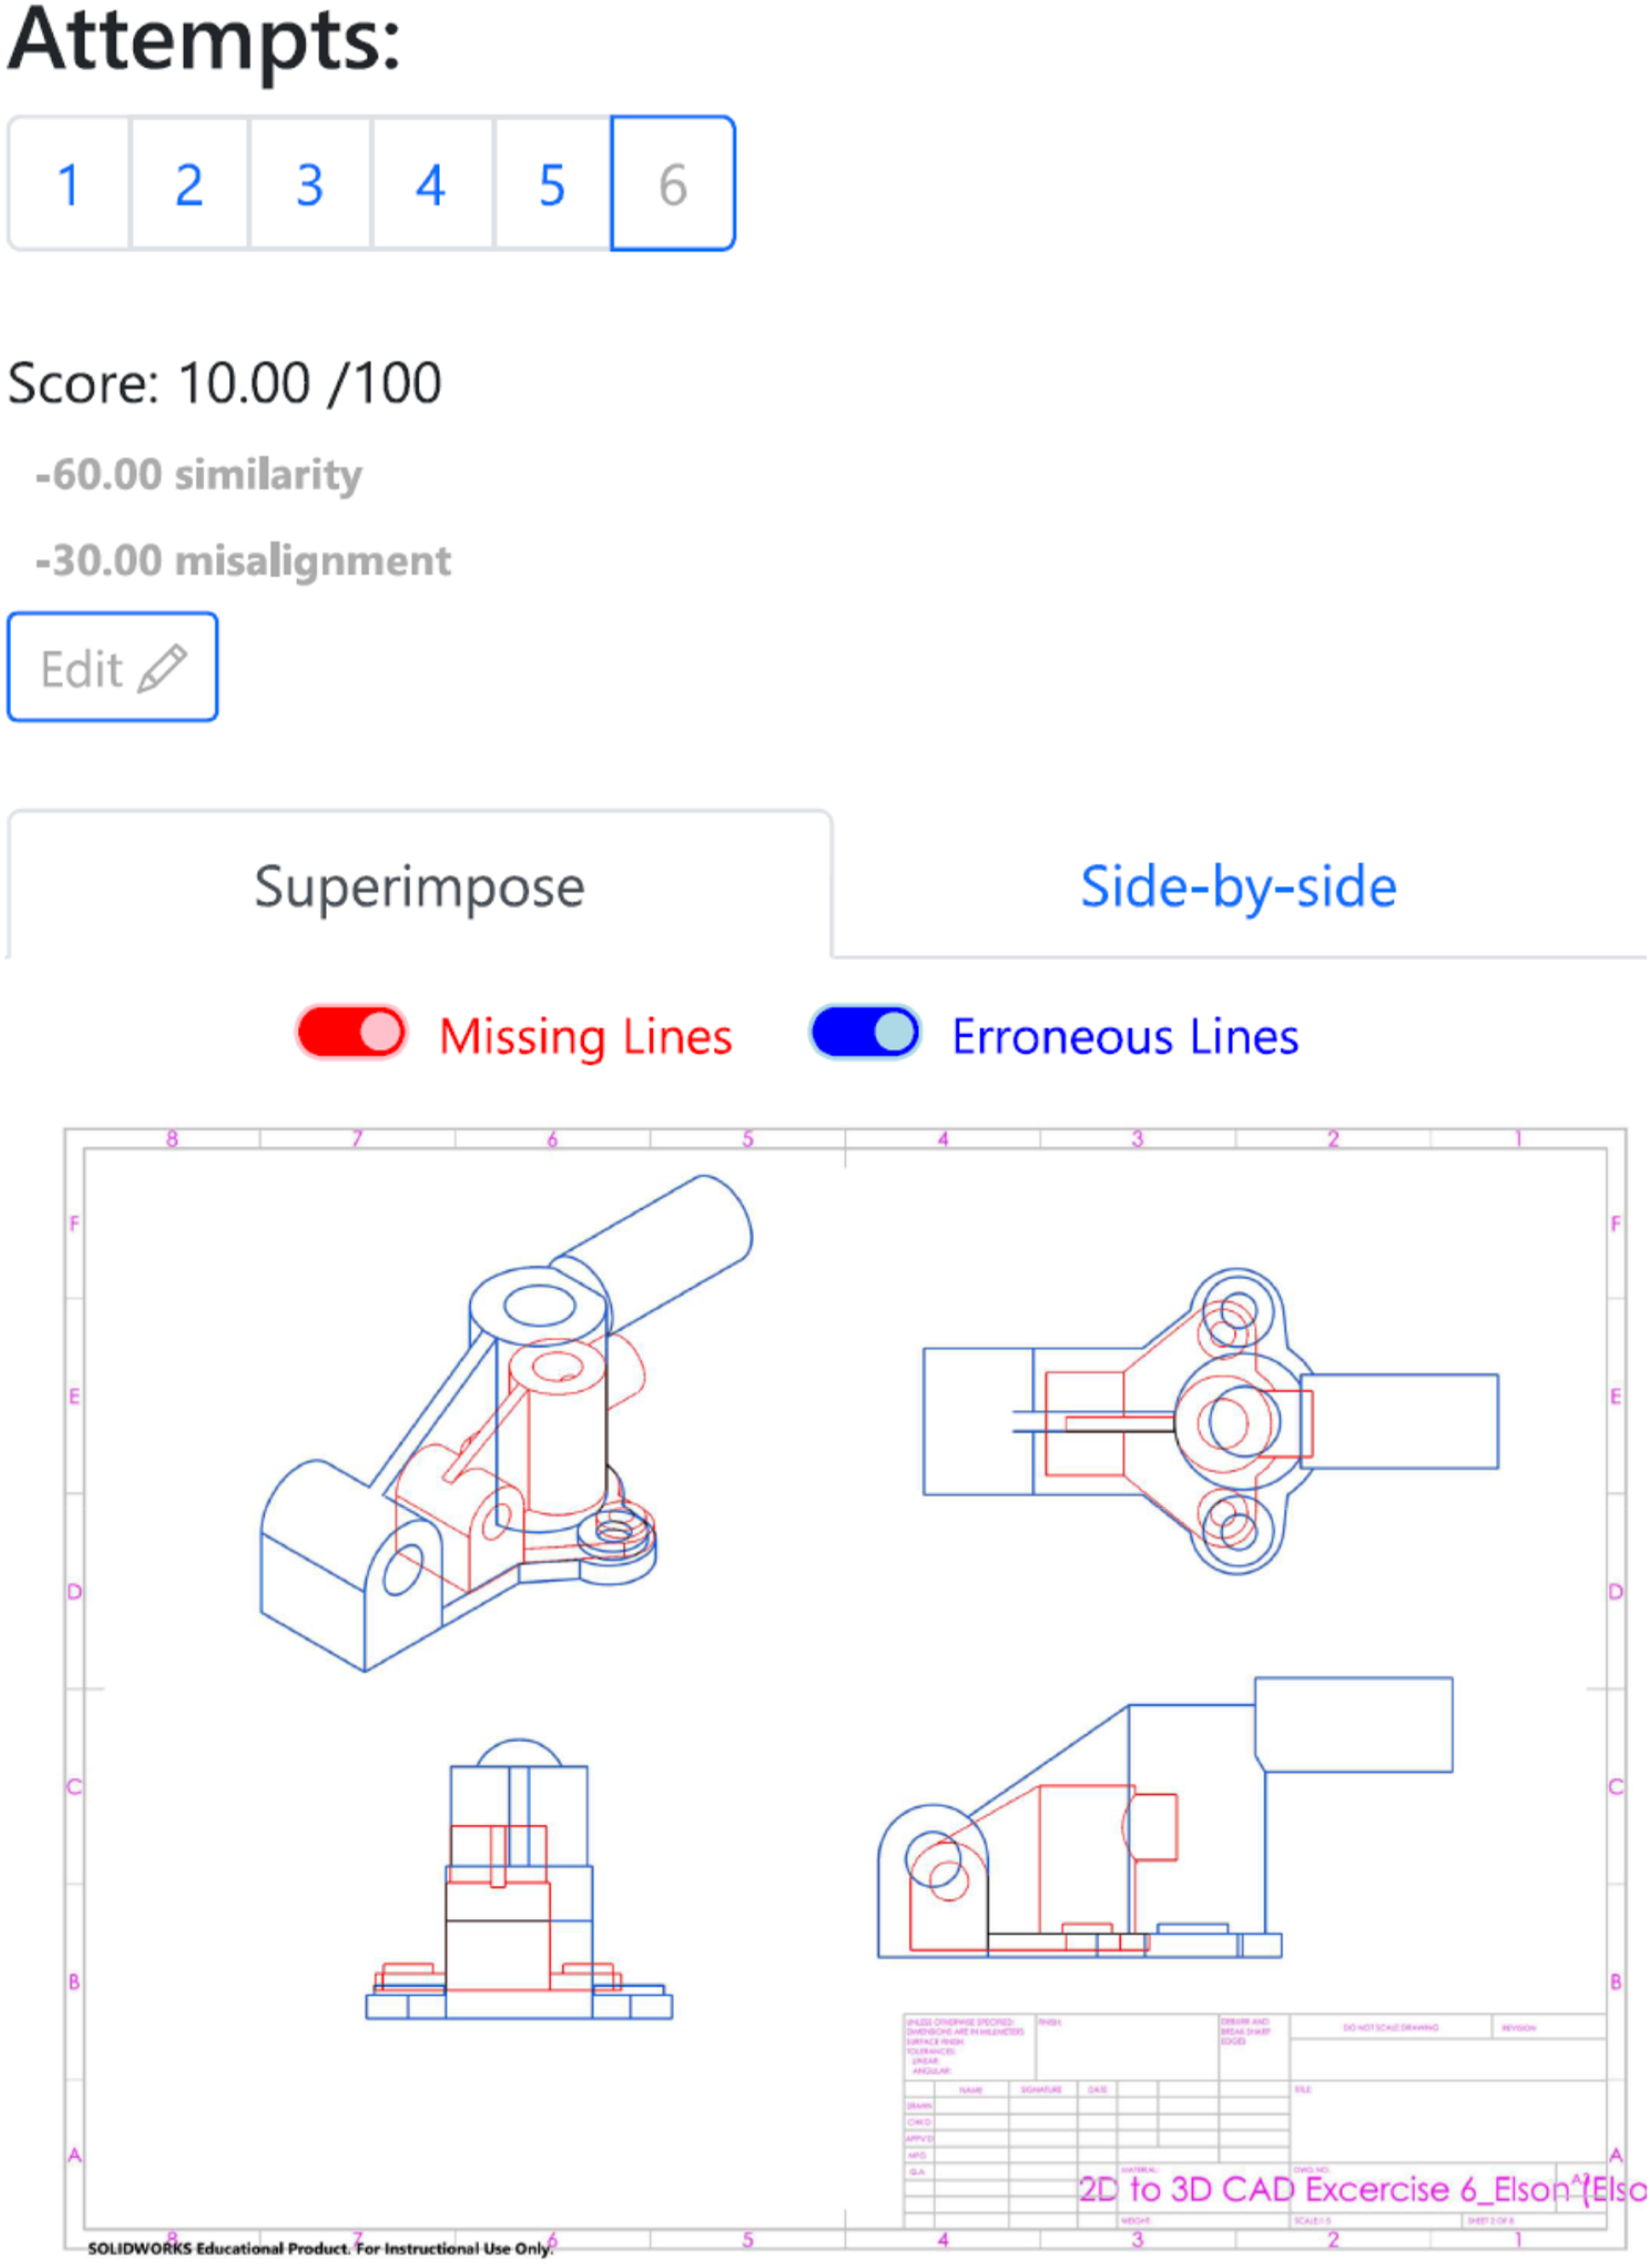
Figure 9 shows the comparison between the teacher's and the student's CAD drawings in superimpose mode (the users have the option to view the comparison in side-by-side mode). The number of attempts allowed for each exercise is predetermined by the teacher. AMCAD captures and displays the score for each attempt.
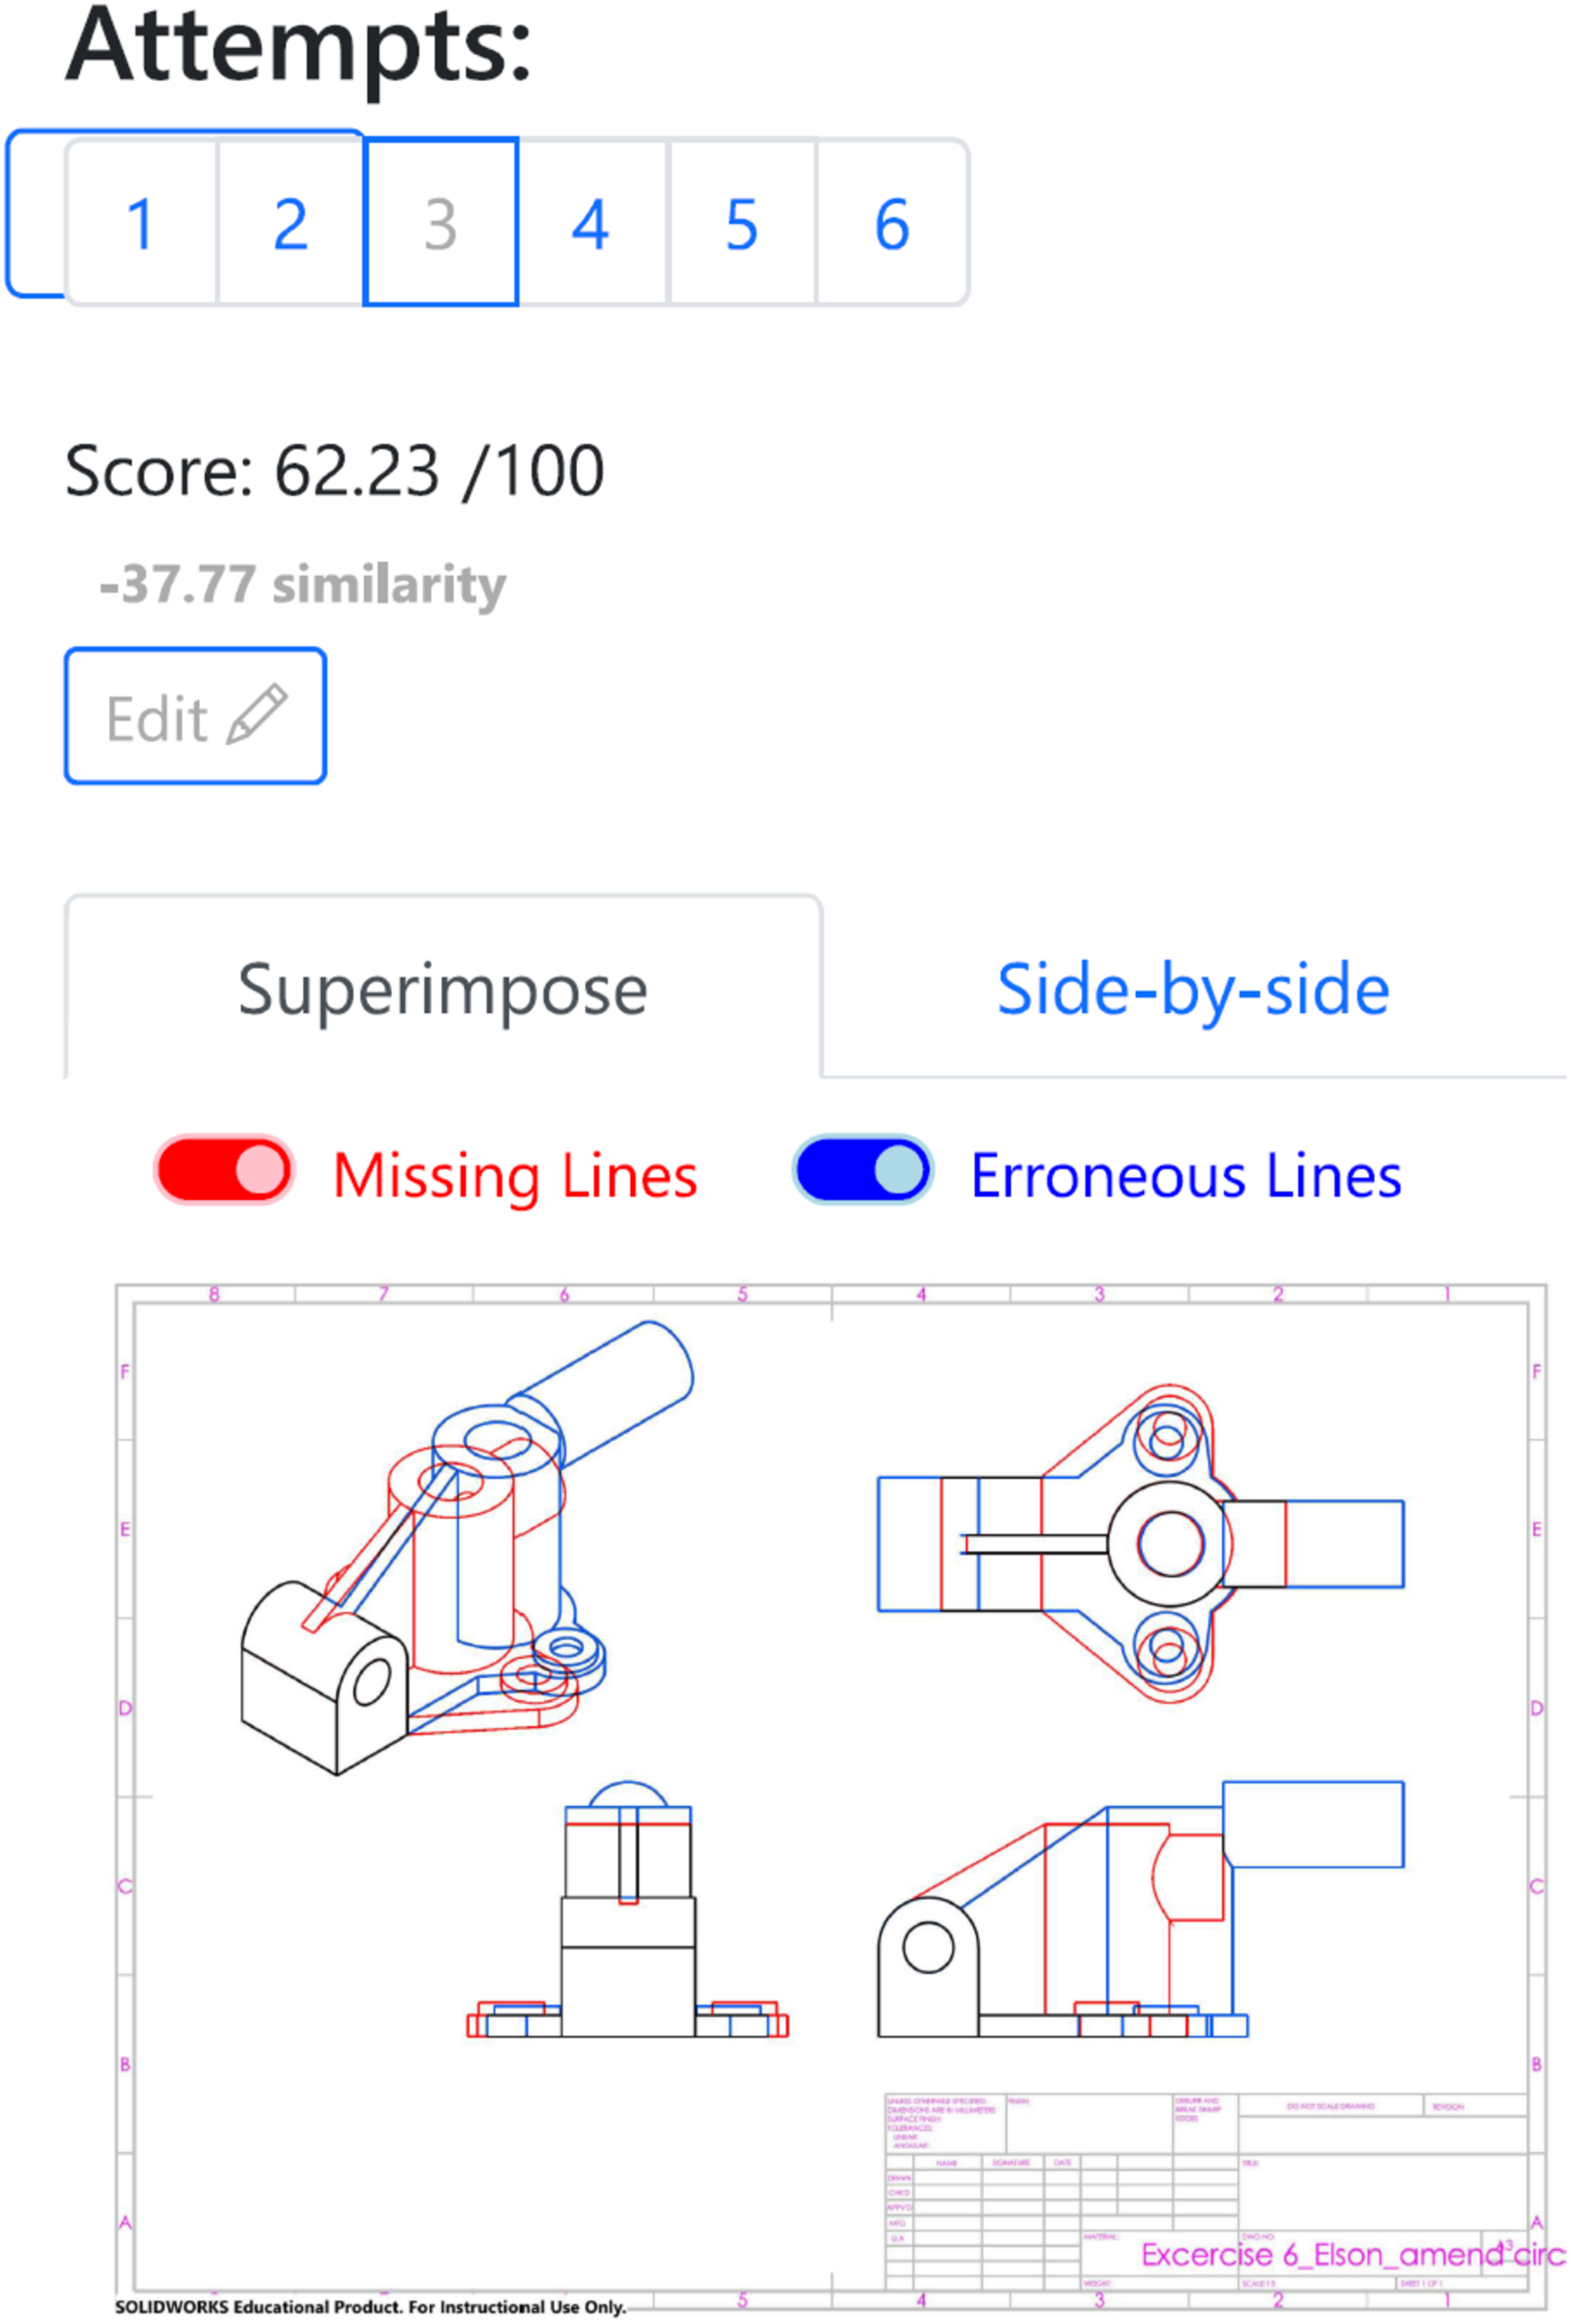
Student's drawing marking in AMCAD.
AMCAD classifies the drawing differences (errors) as “Missing Lines” or “Erroneous Lines.” “Missing Lines”’ means the lines exist in teacher's drawing but not in student's drawing. The converse is true for “Erroneous Lines.” Turning off the “Missing Lines” and “Erroneous Lines” options reveals the student's original drawing.
Alignments of multiple views in the orthographic projection drawing
Figure 10 shows the student's CAD drawing created in first angle projection. However, the teacher's CAD drawing shown in Figure 3(b) is in third angle projection. The misalignment penalty is the weightage for alignment criterion. In this example, the student scores 0 for incorrect angle of projection used in his drawing (−30 marks for misalignment).
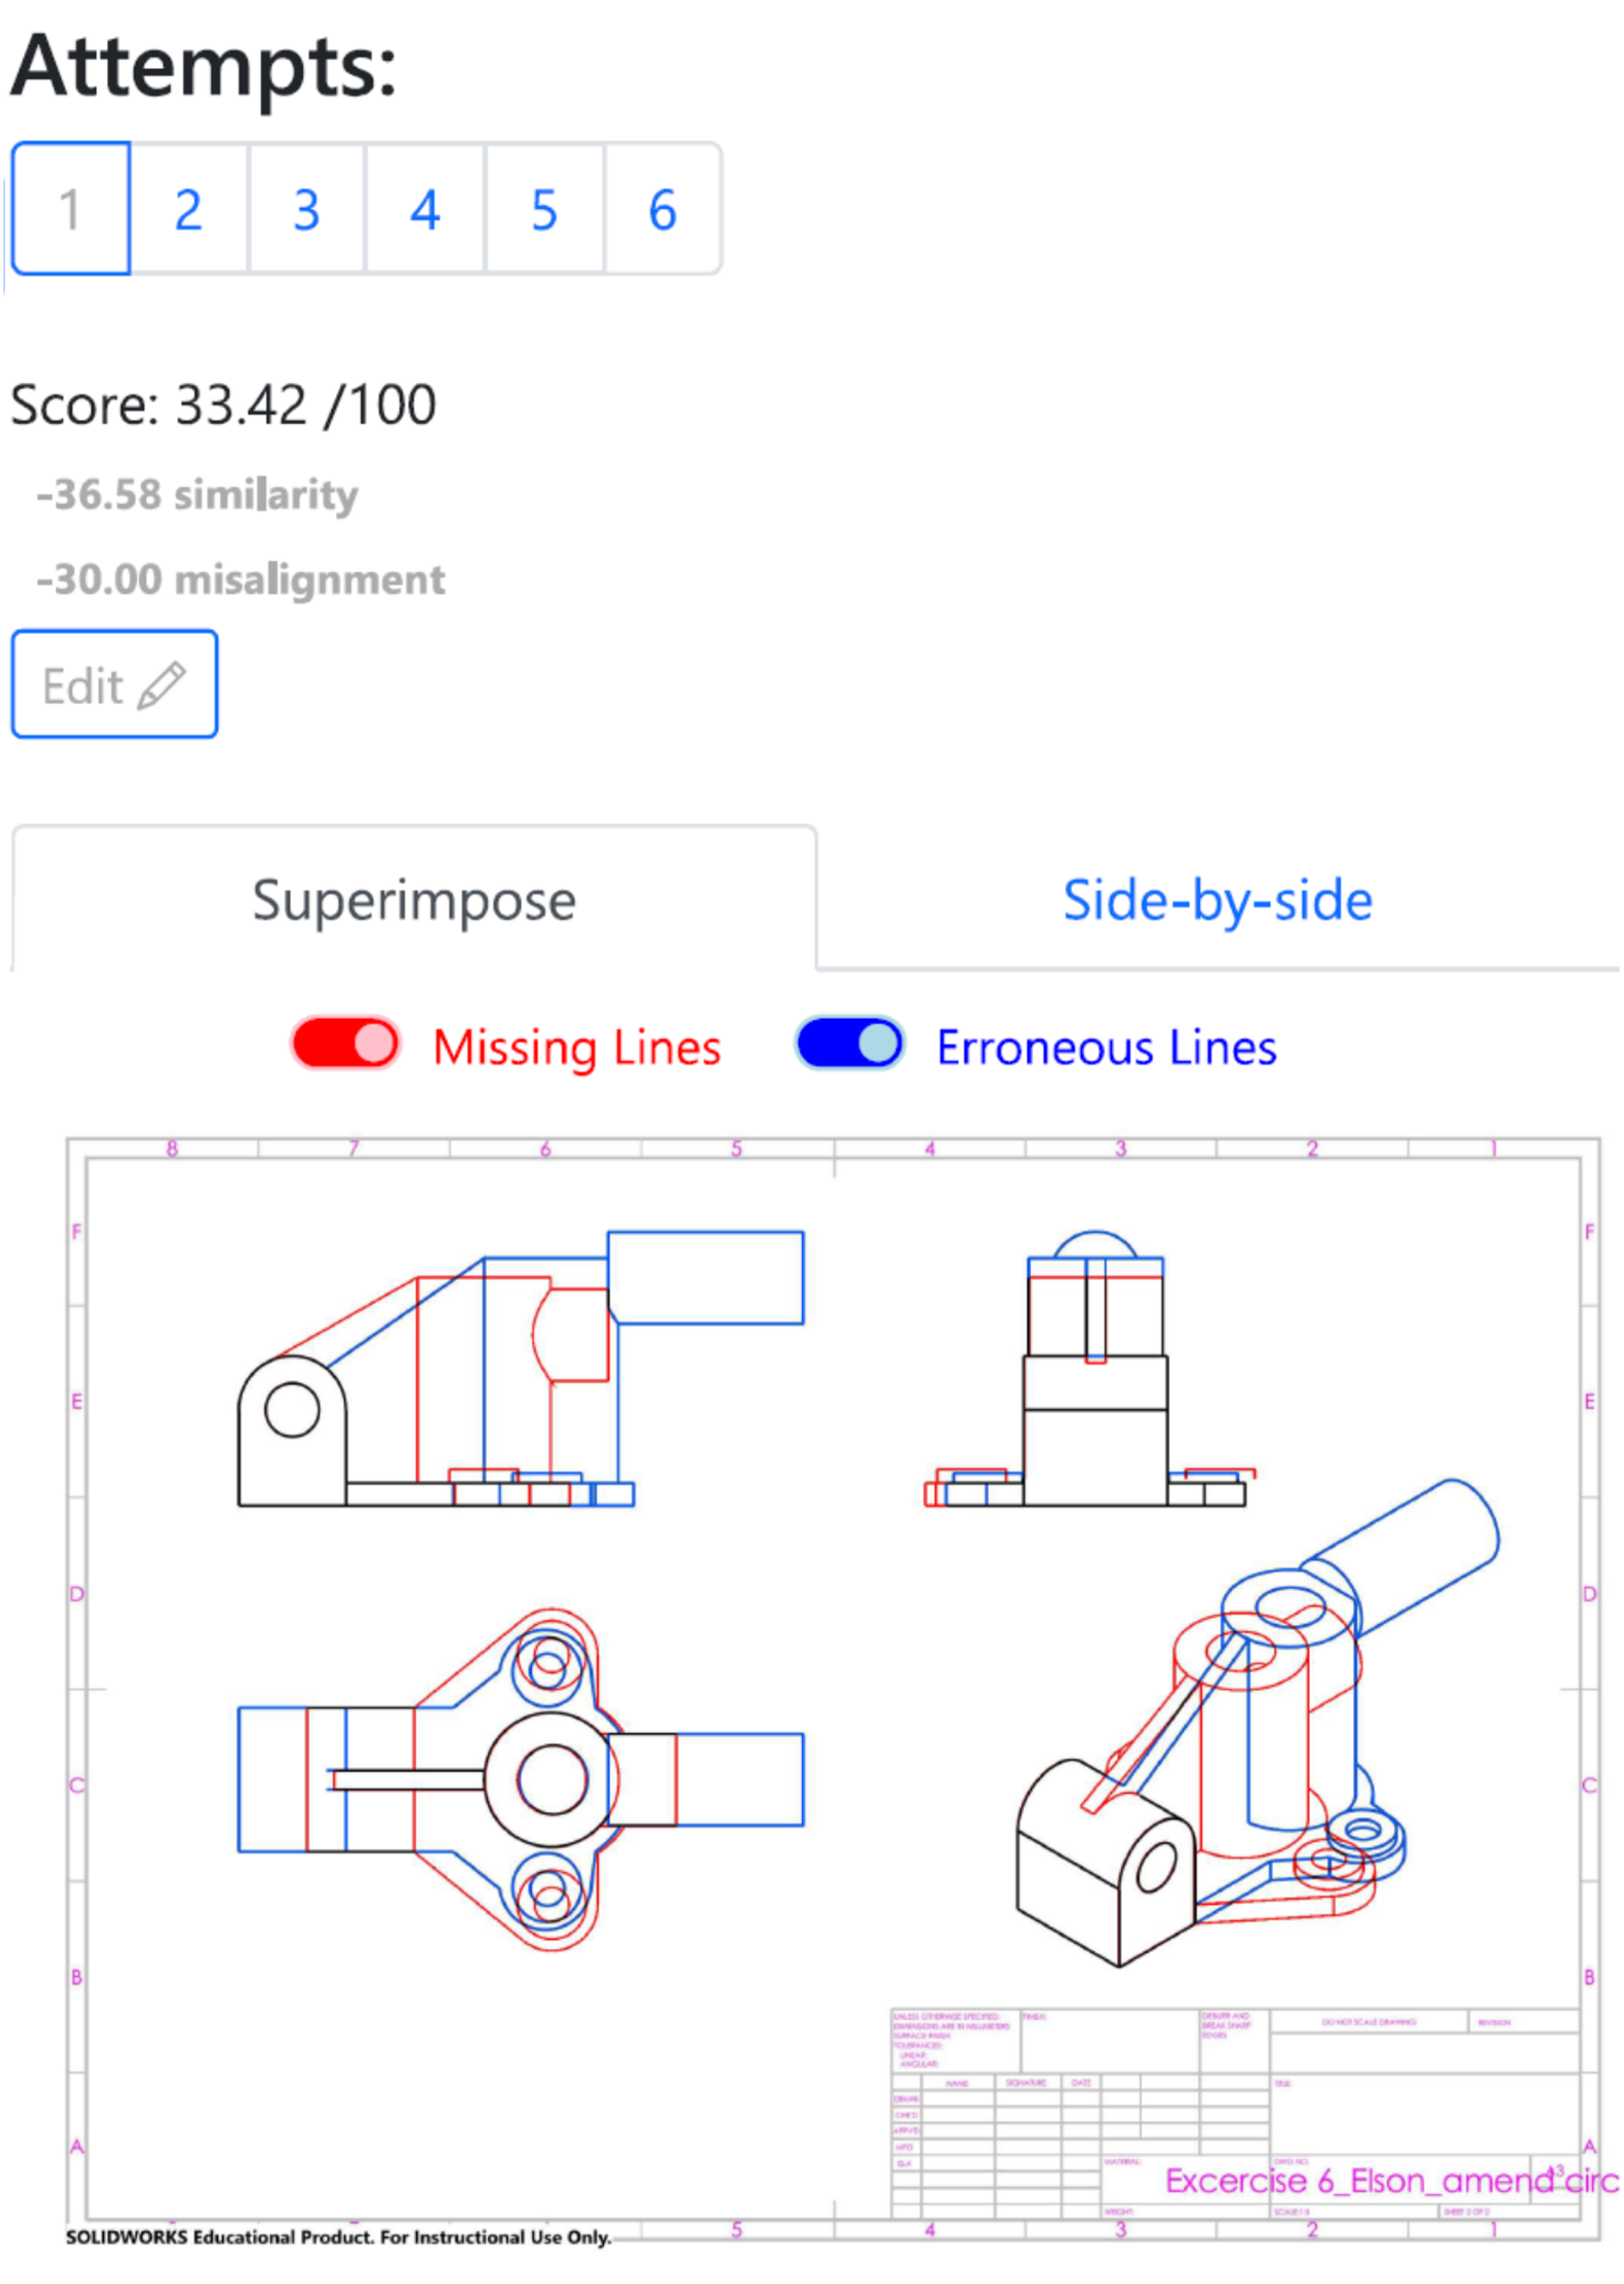
Student's drawing in first angle projection.
In another example shown in Figure 11, the student's drawing was created correctly in third angle projection. However, as the three orthographic views are not in correct alignment, the student also scores 0 for the alignment criterion (−30 marks for misalignment).
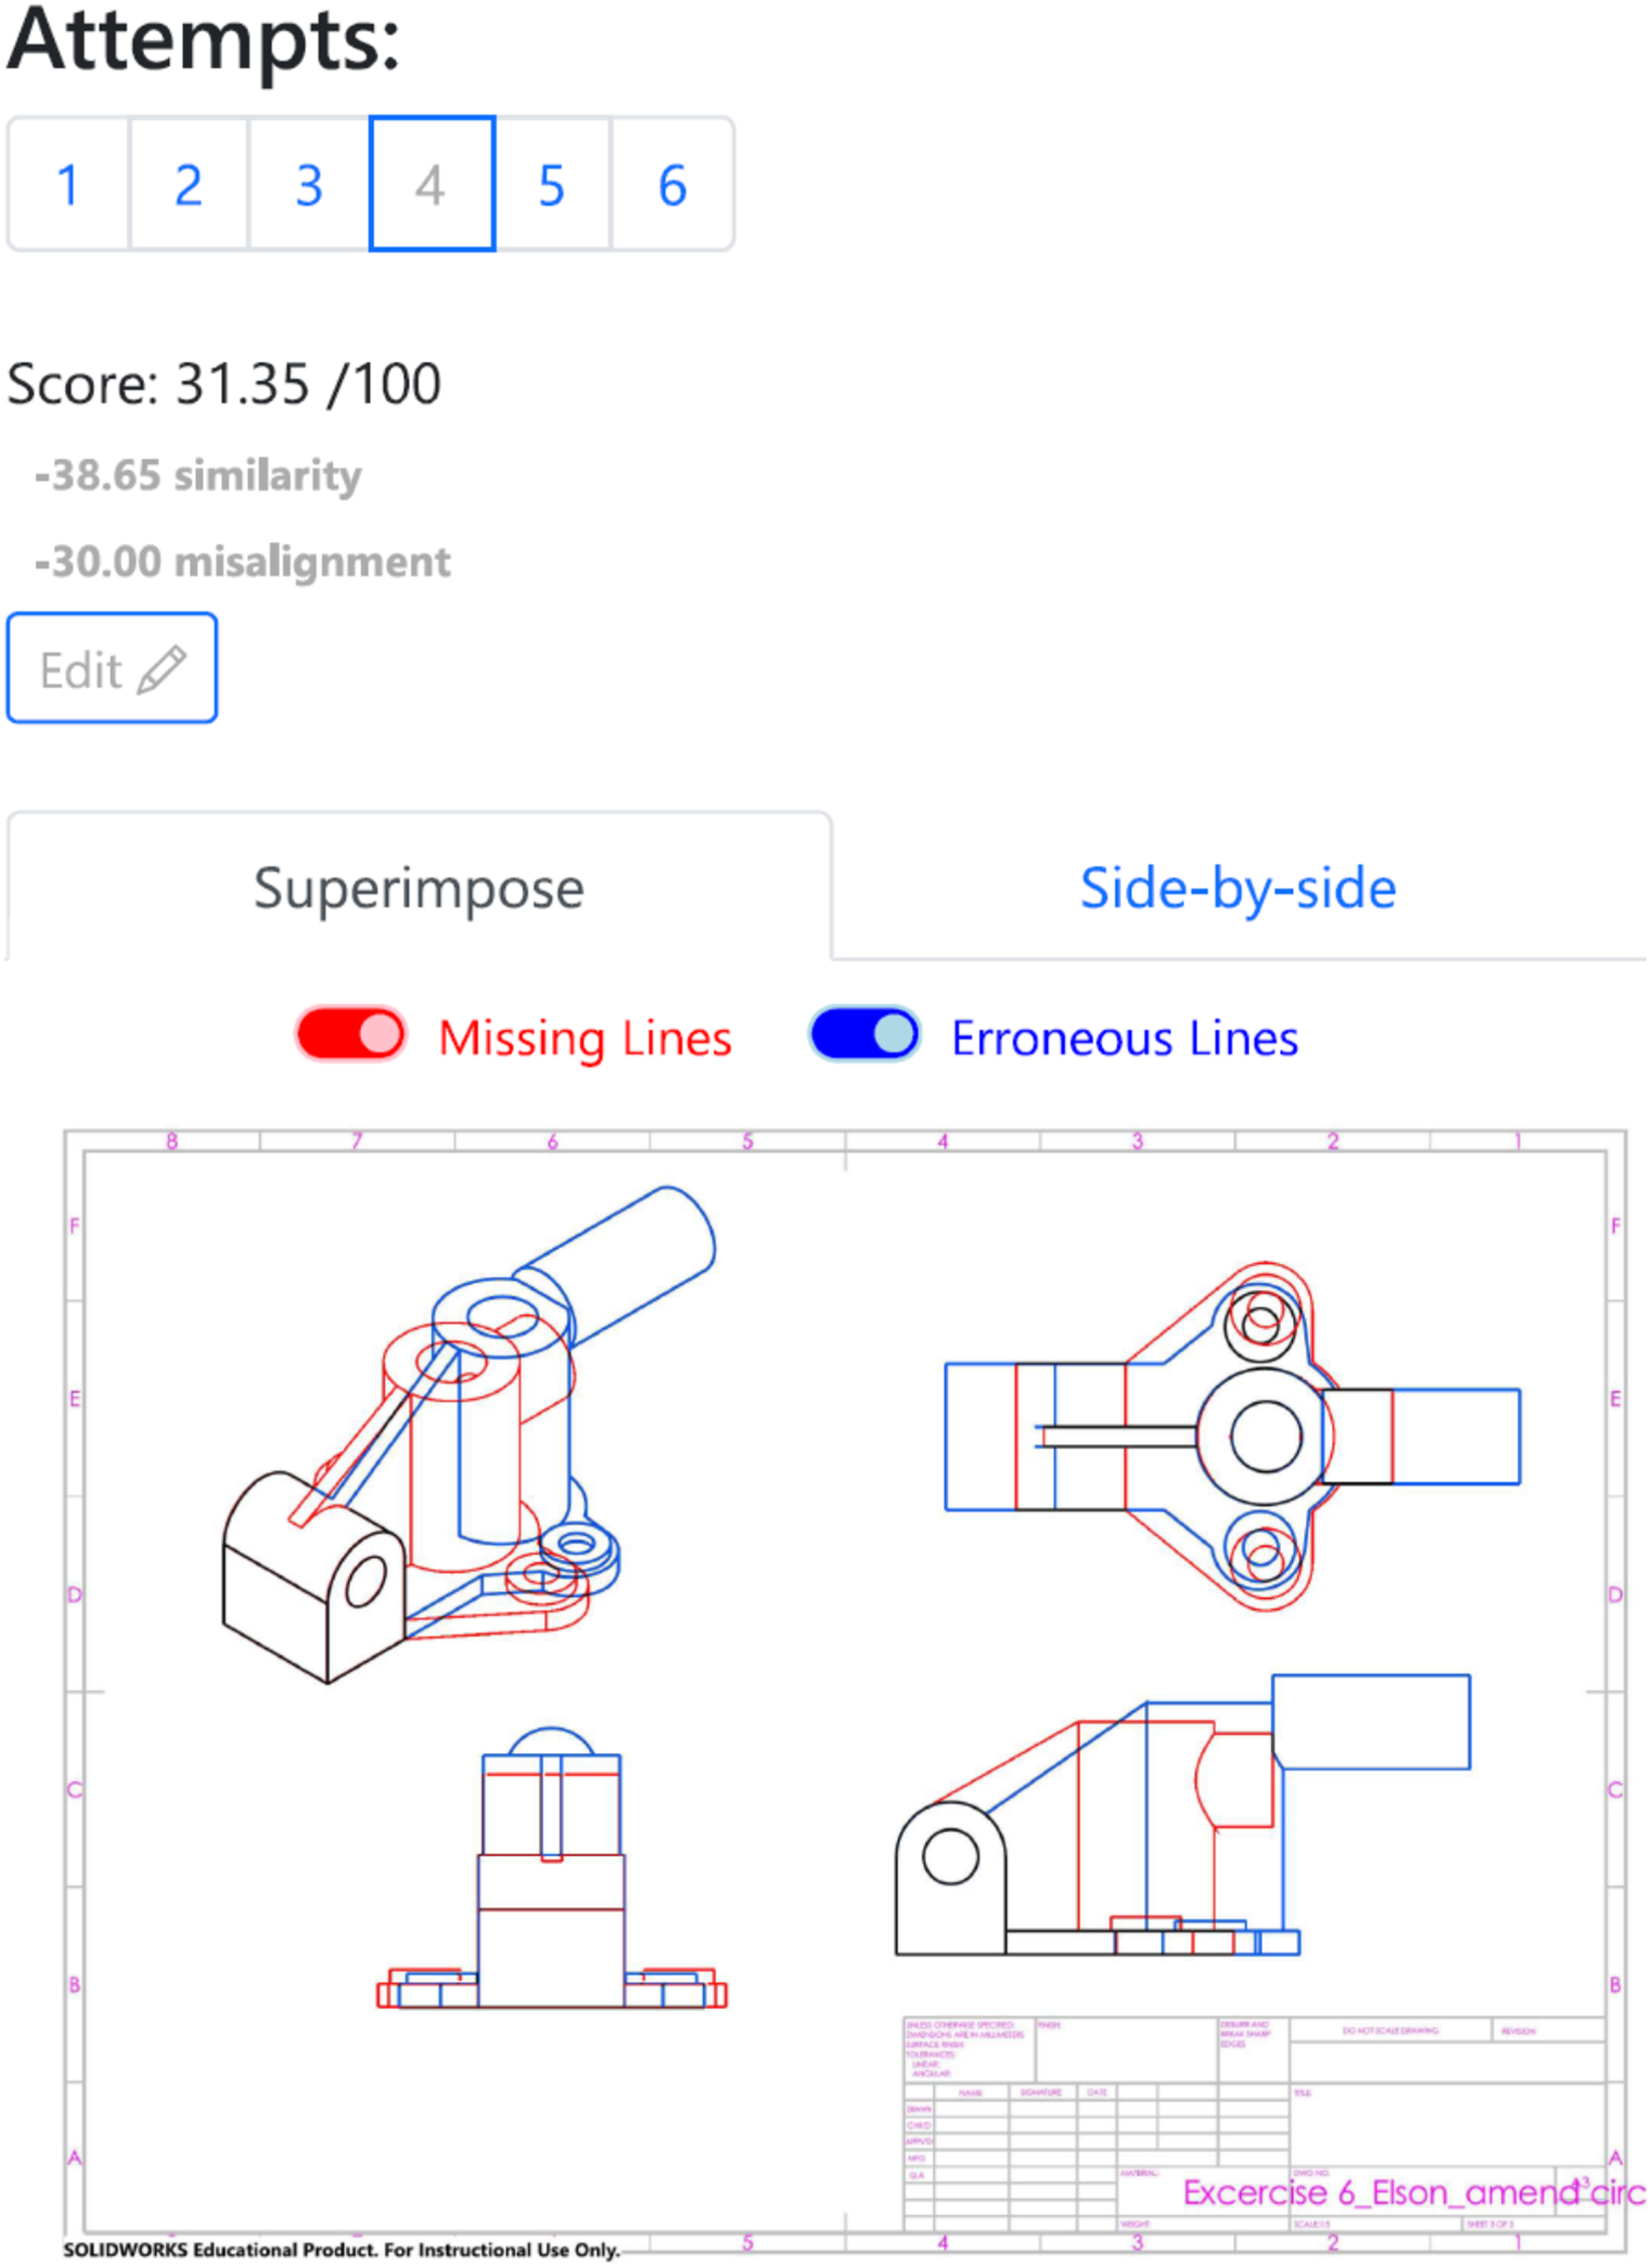
Student's drawing in correct third angle of projection but views are misaligned.
Hatching boundaries for sectional views
AMCAD detects hatching boundaries in sectional views. Figure 12 shows an example drawing. When AMCAD detects incorrect hatching boundaries, the weighted hatching score is deducted from the overall score.
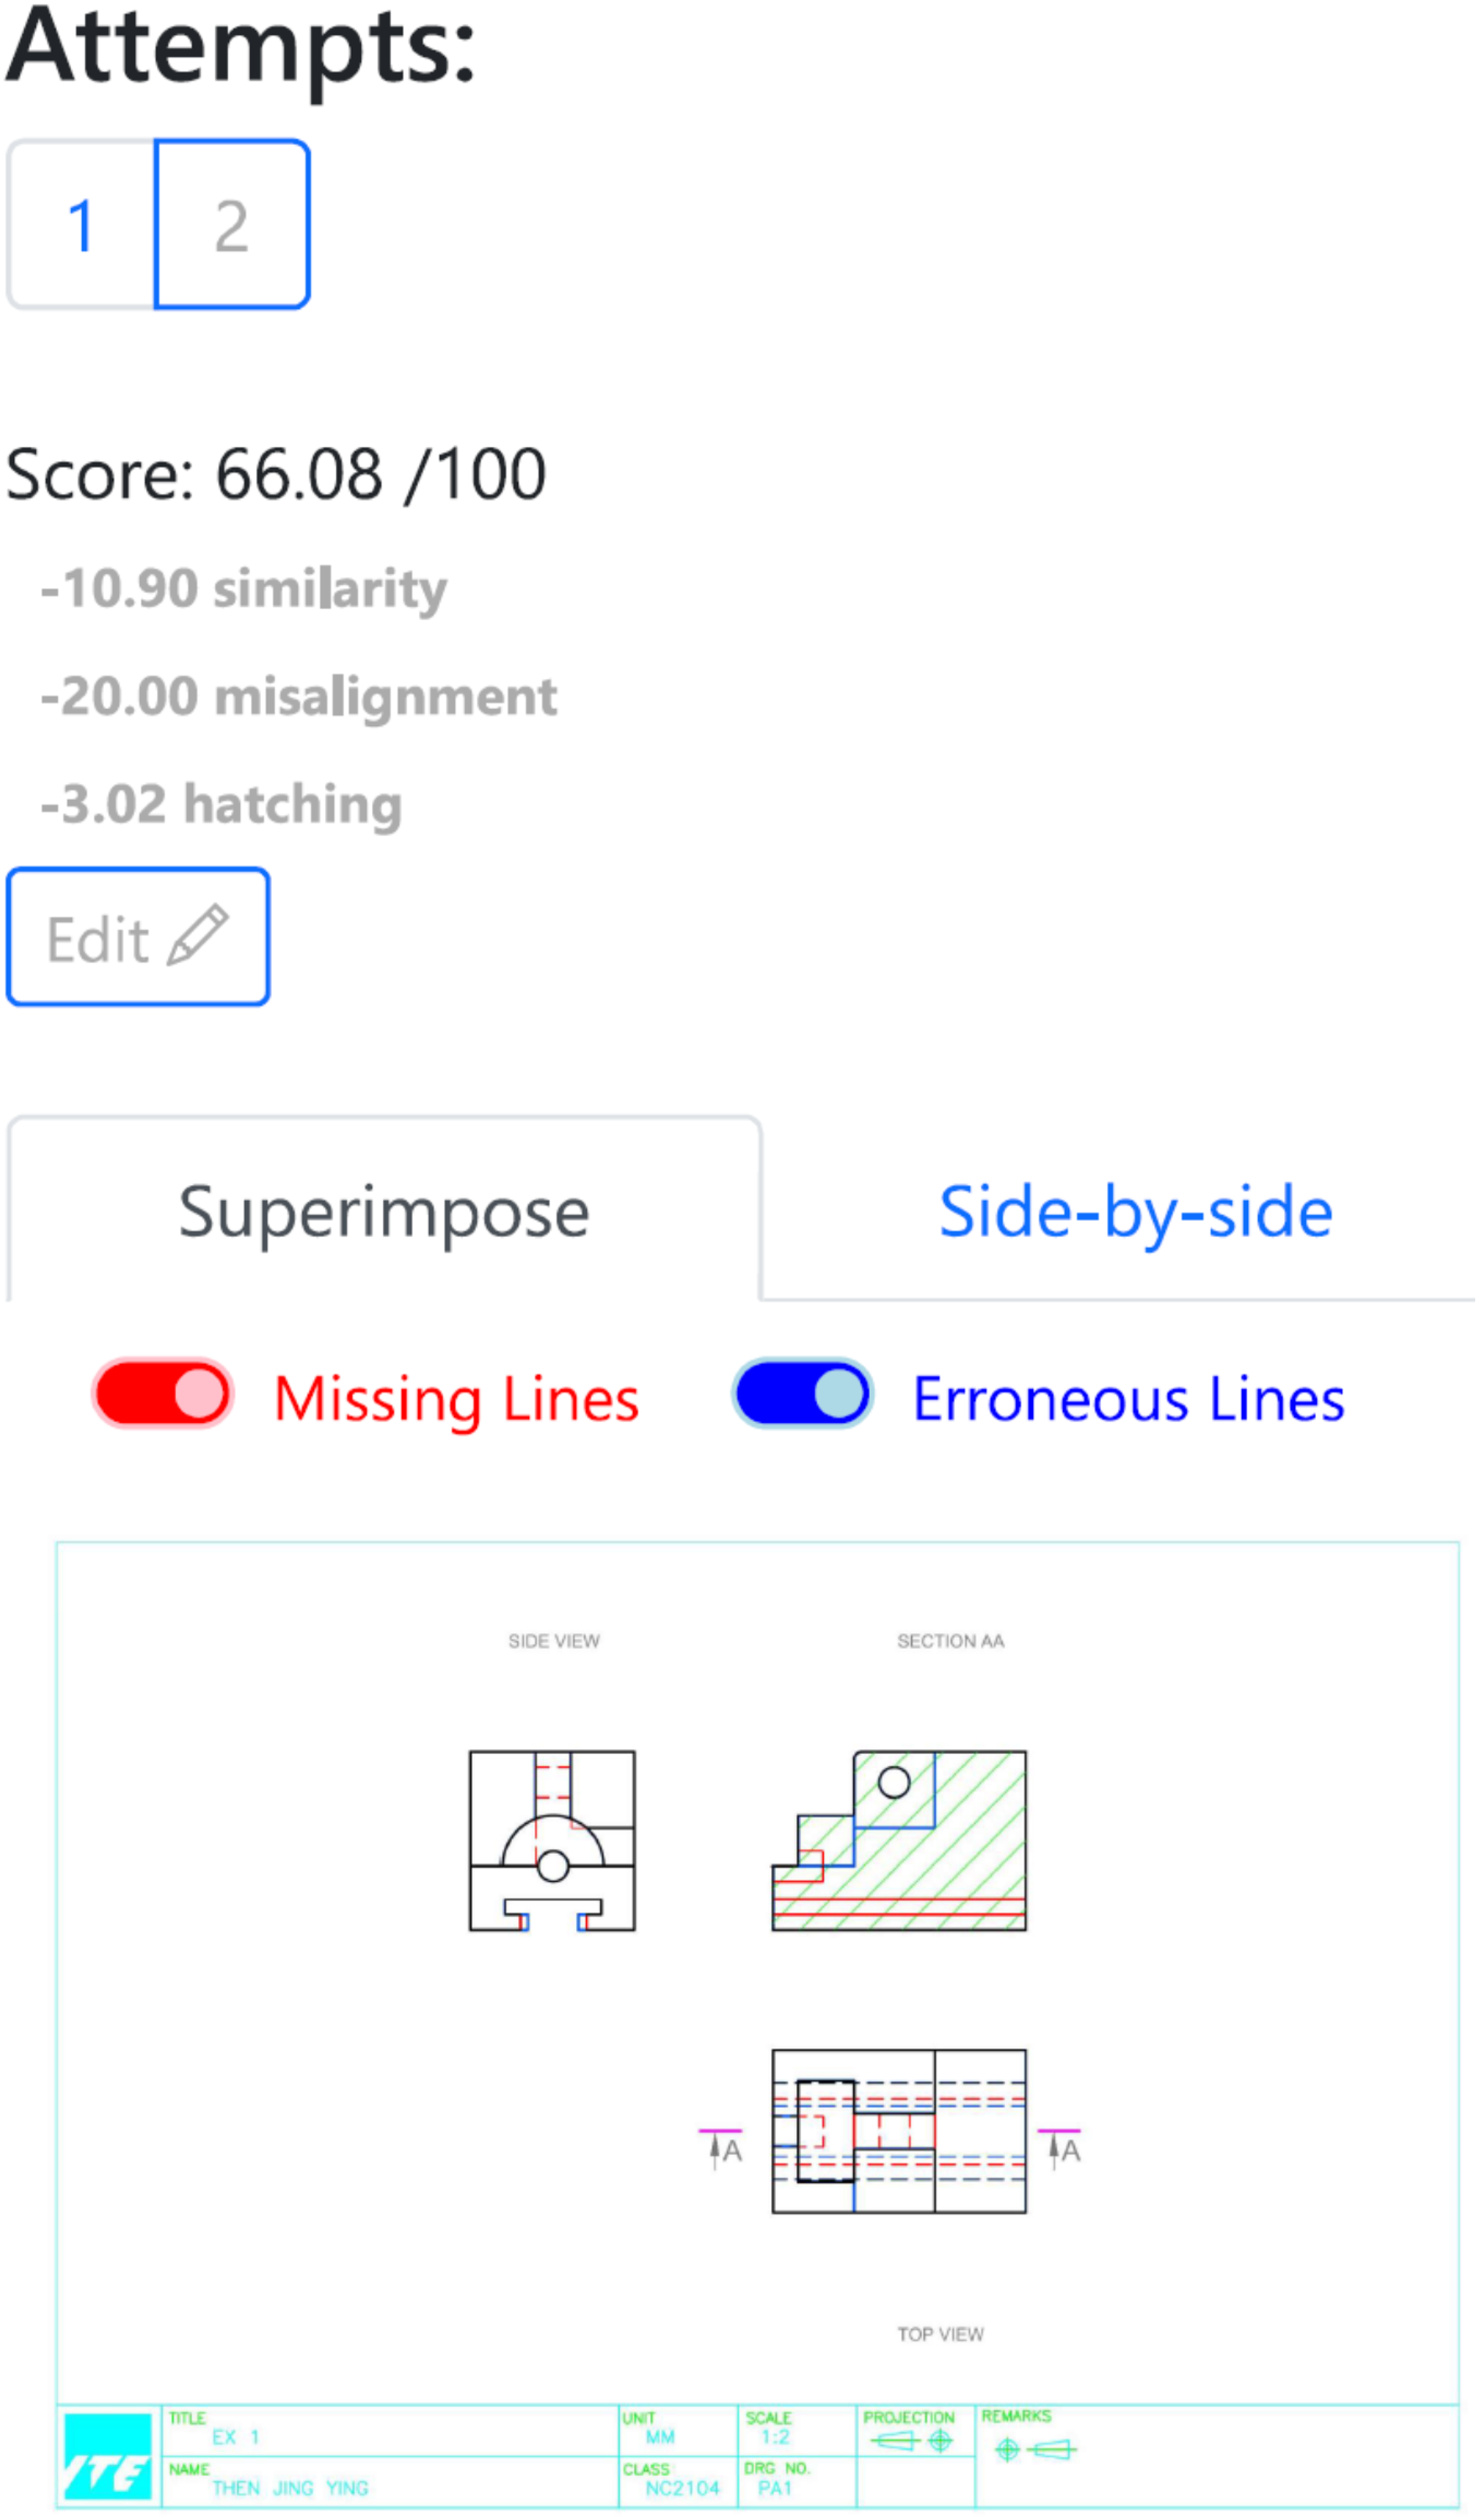
Hatching boundaries detection in sectional drawing.
Dashboard in AMCAD
Students’ performances are summarized in the Chart Analysis tab on the dashboard in AMCAD. The Chart Analysis tab displays graphically the following:
Score by exercise, Video views per exercise, Number of attempts per exercise, Number of completed exercises by topic.
Figure 13 shows the “Score by Exercise” page. In this illustration, the Image Similarity and Drawing Alignment criteria are presented by the blue and orange bars, respectively. Hover the mouse over the bar reveals the score for each criterion.
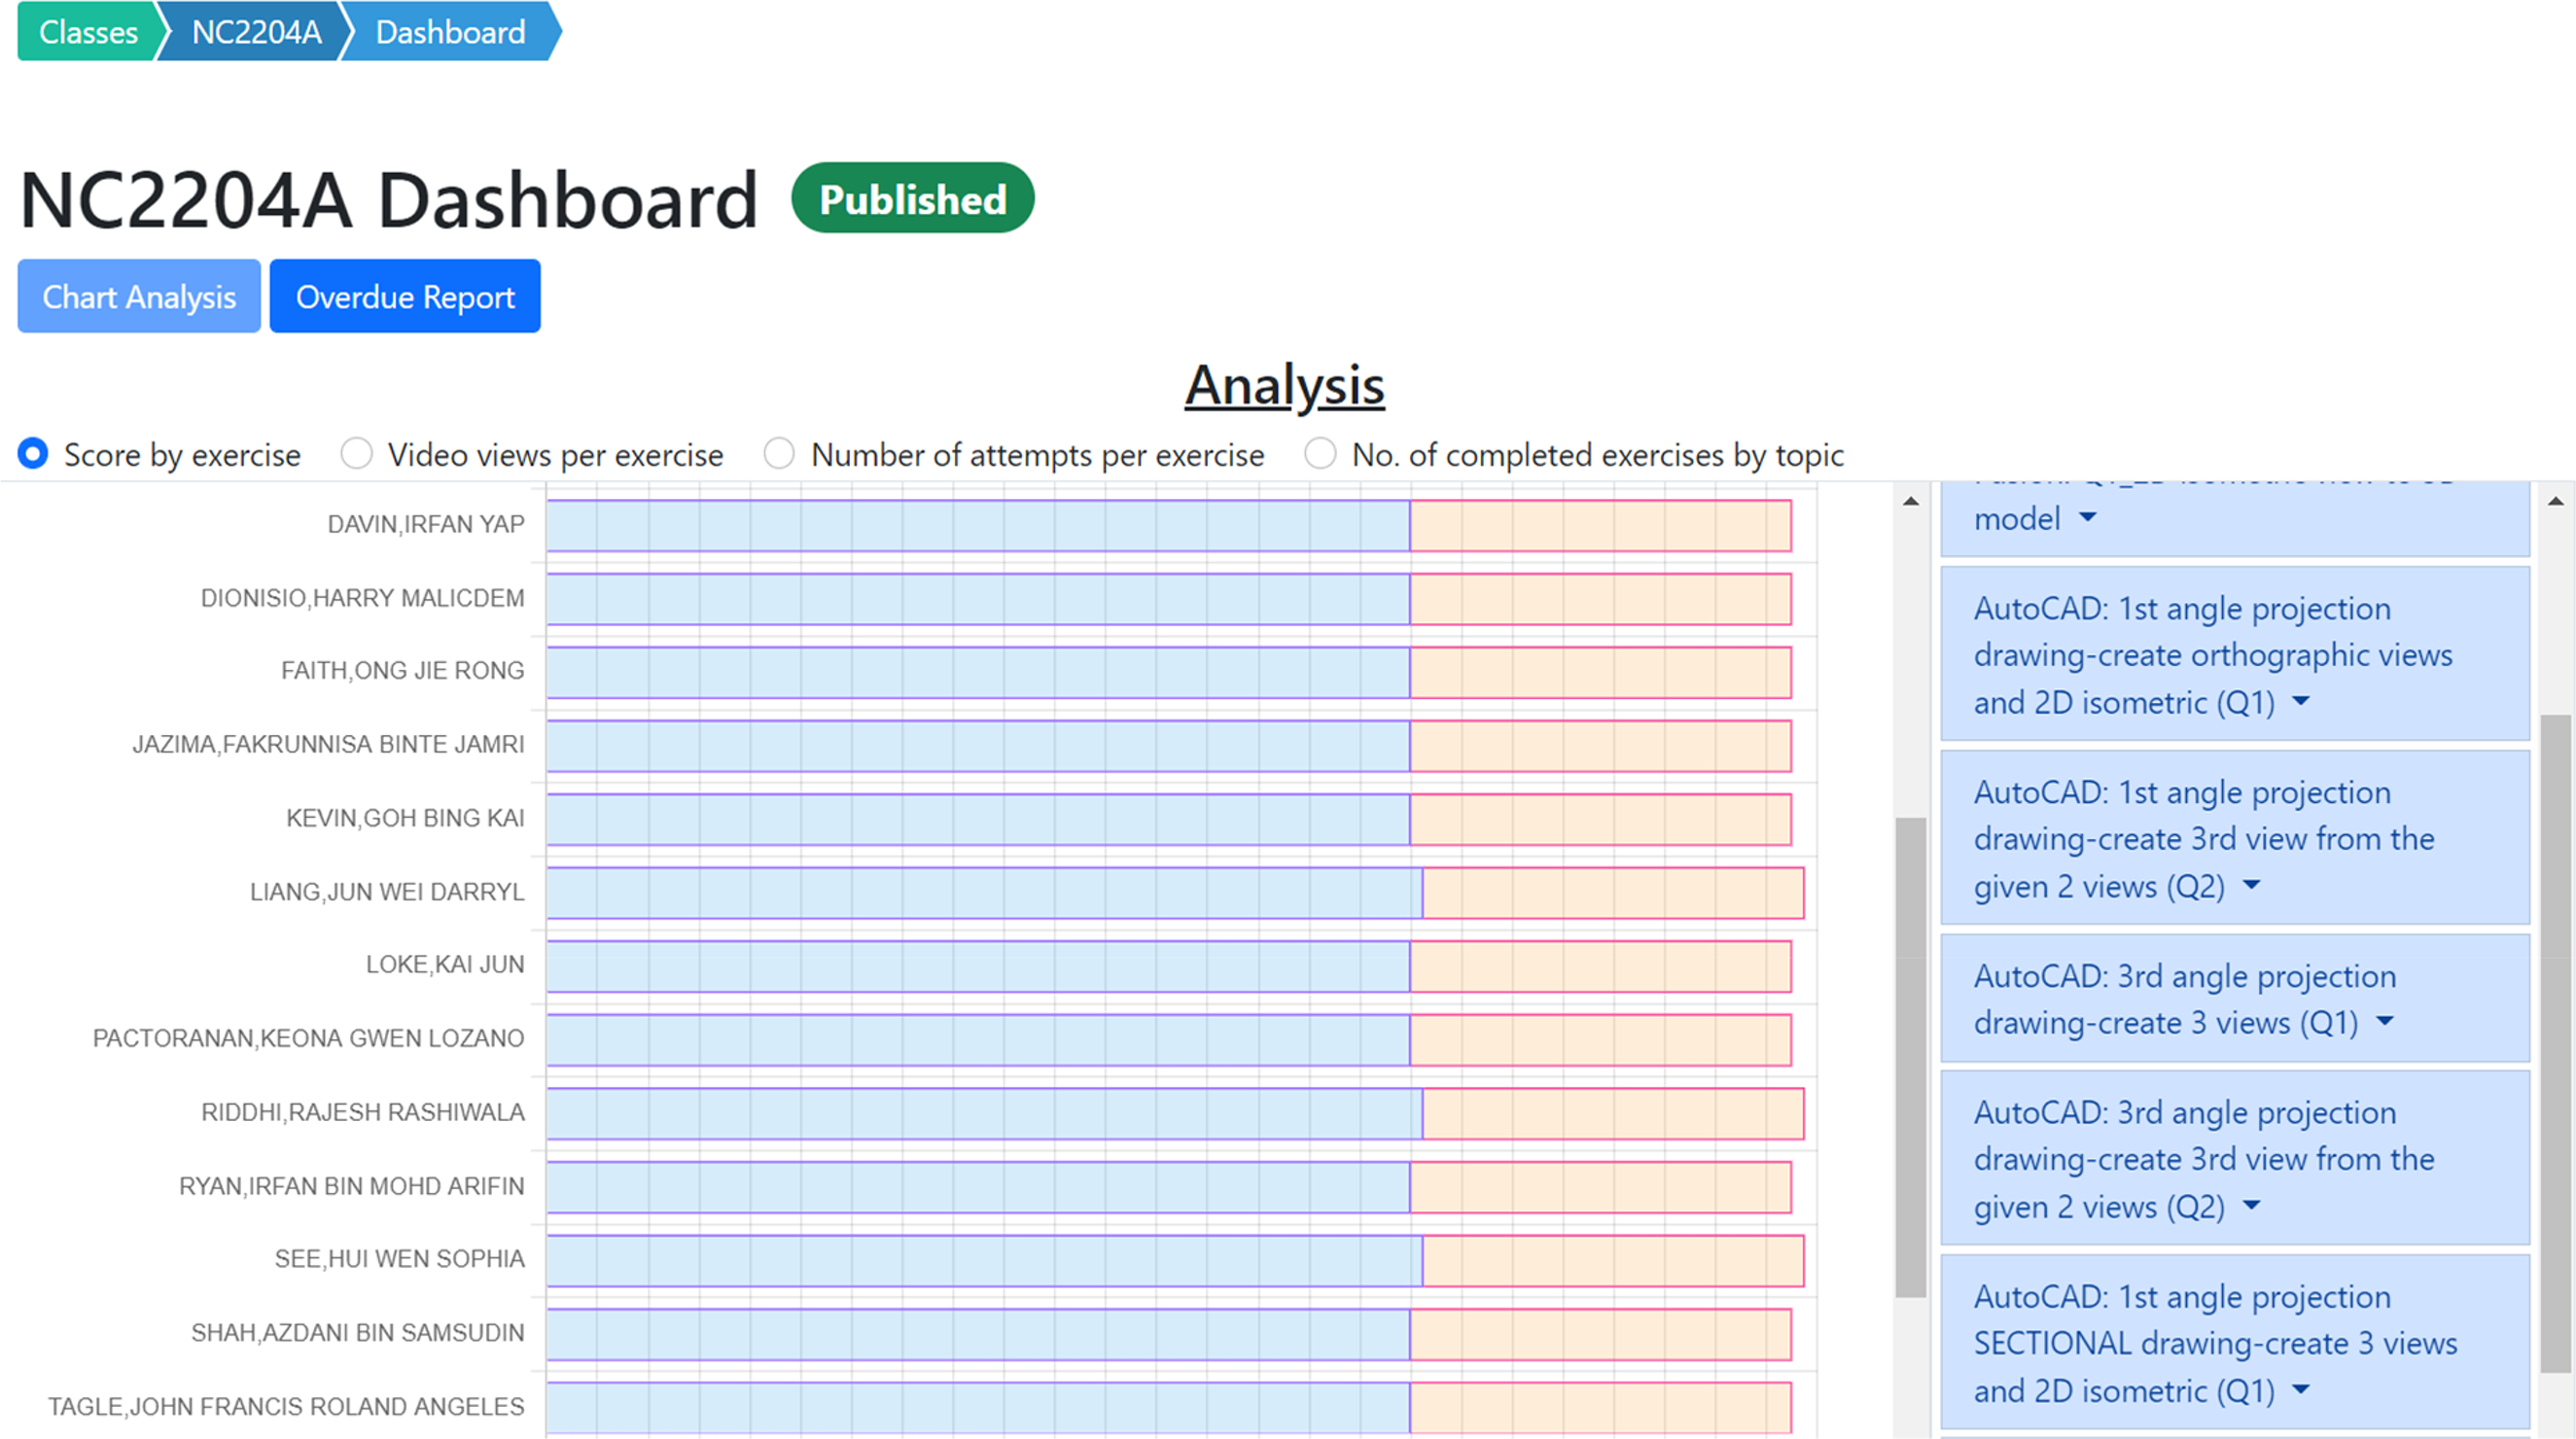
Chat analysis in dashboard.
The Overdue Report on the dashboard shown in Figure 14 allows the teacher to track student's overdue assignments. Students are reminded of these overdue assignments.
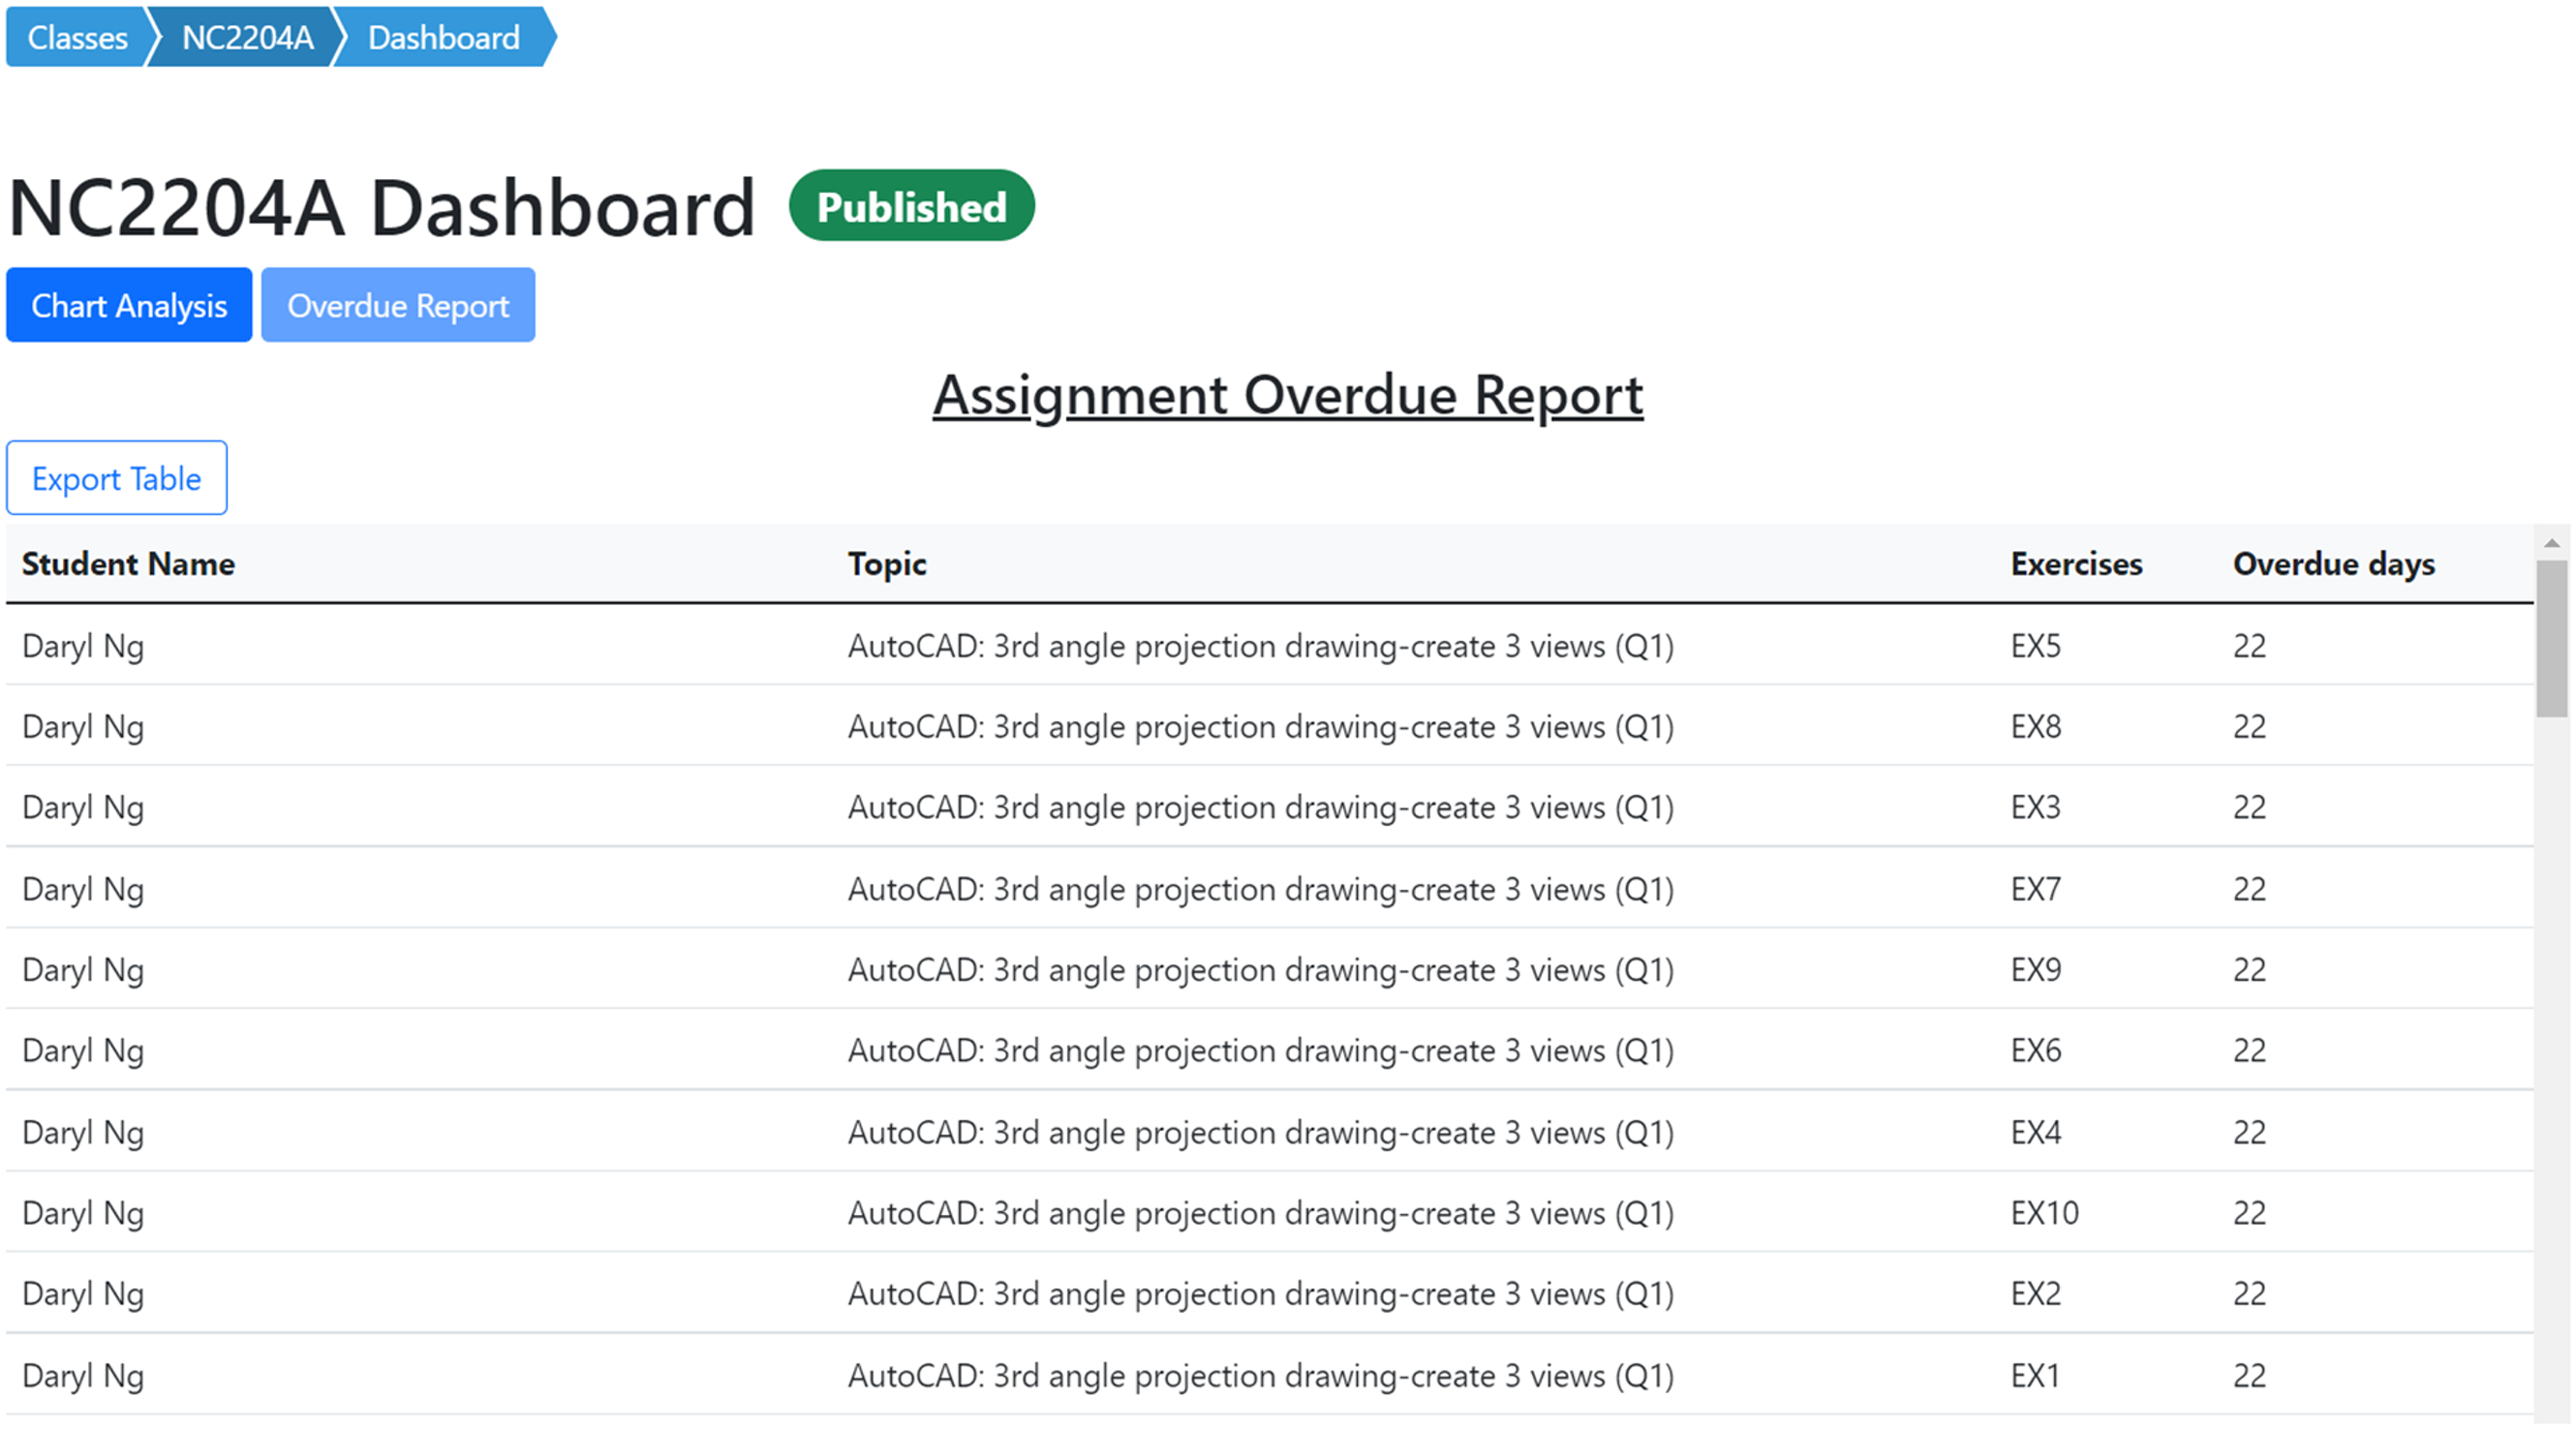
Overdue report in dashboard.
Comparing AMCAD with the auto-assessing system developed by others
As discussed in this article in the earlier section, auto-evaluation tools developed by authors3,5,7 provide visual feedback for 2D CAD drawings. In this section, comparison is made between:
AMCAD and the abovementioned auto-evaluation tool, AMCAD and AutoCAD DWG Compare.
9
Automated grading of first-year student CAD work 2013
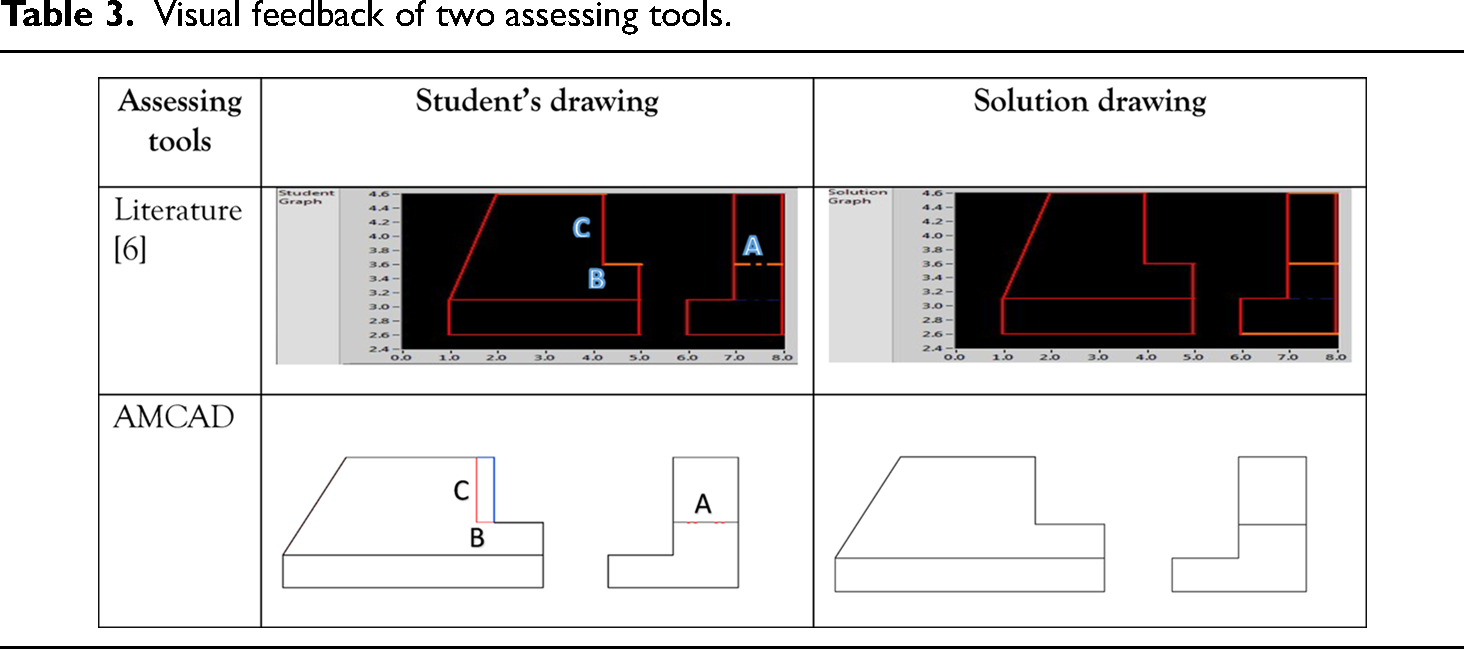
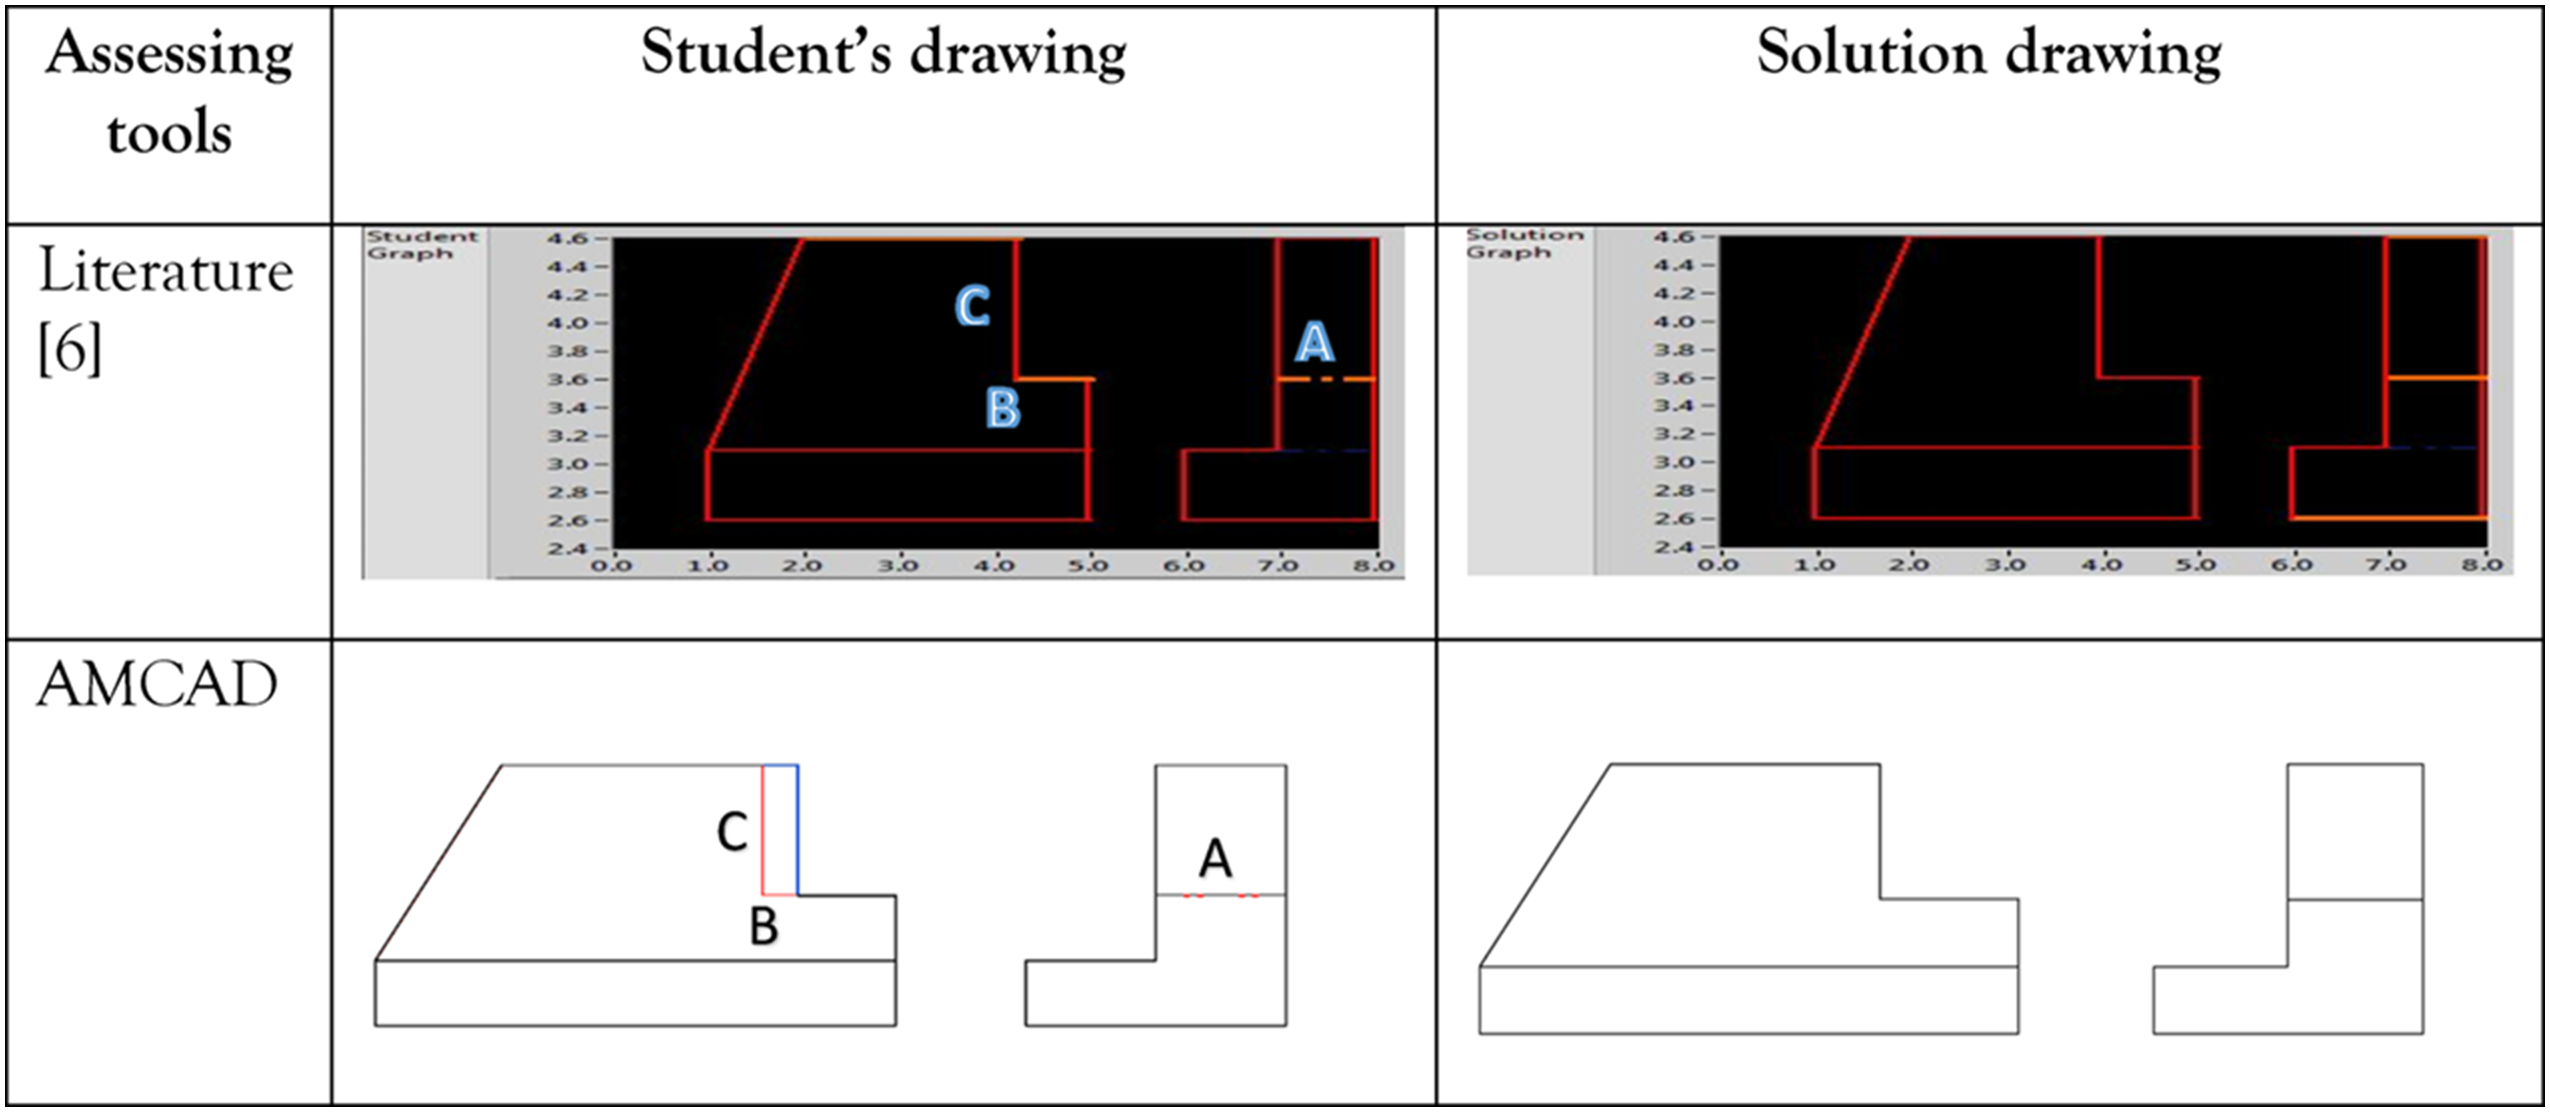
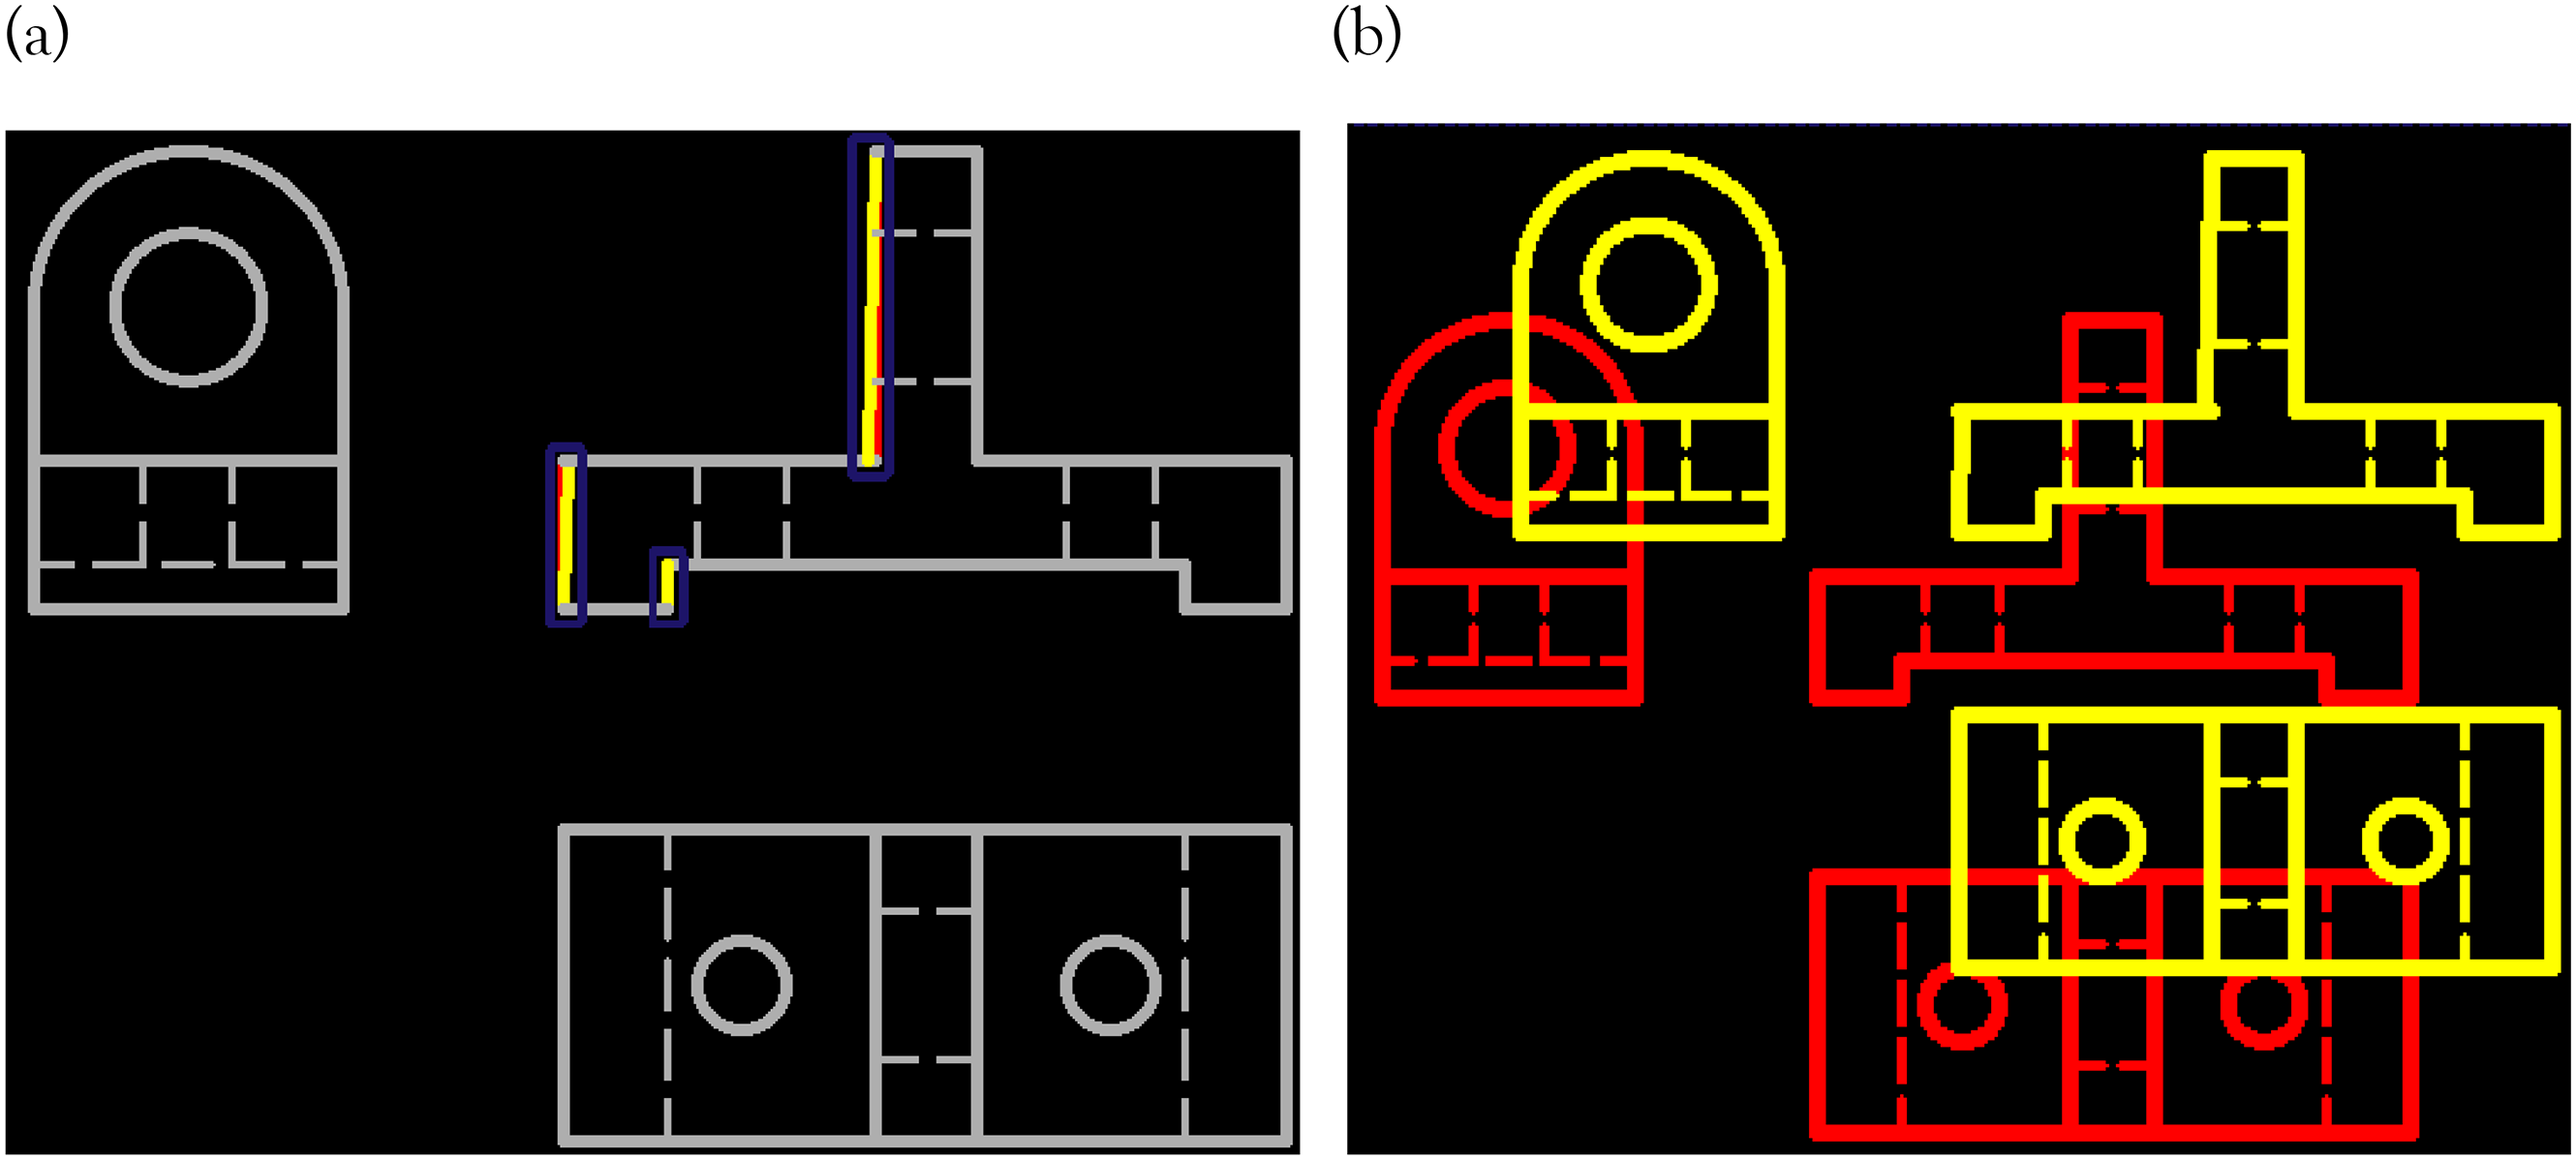
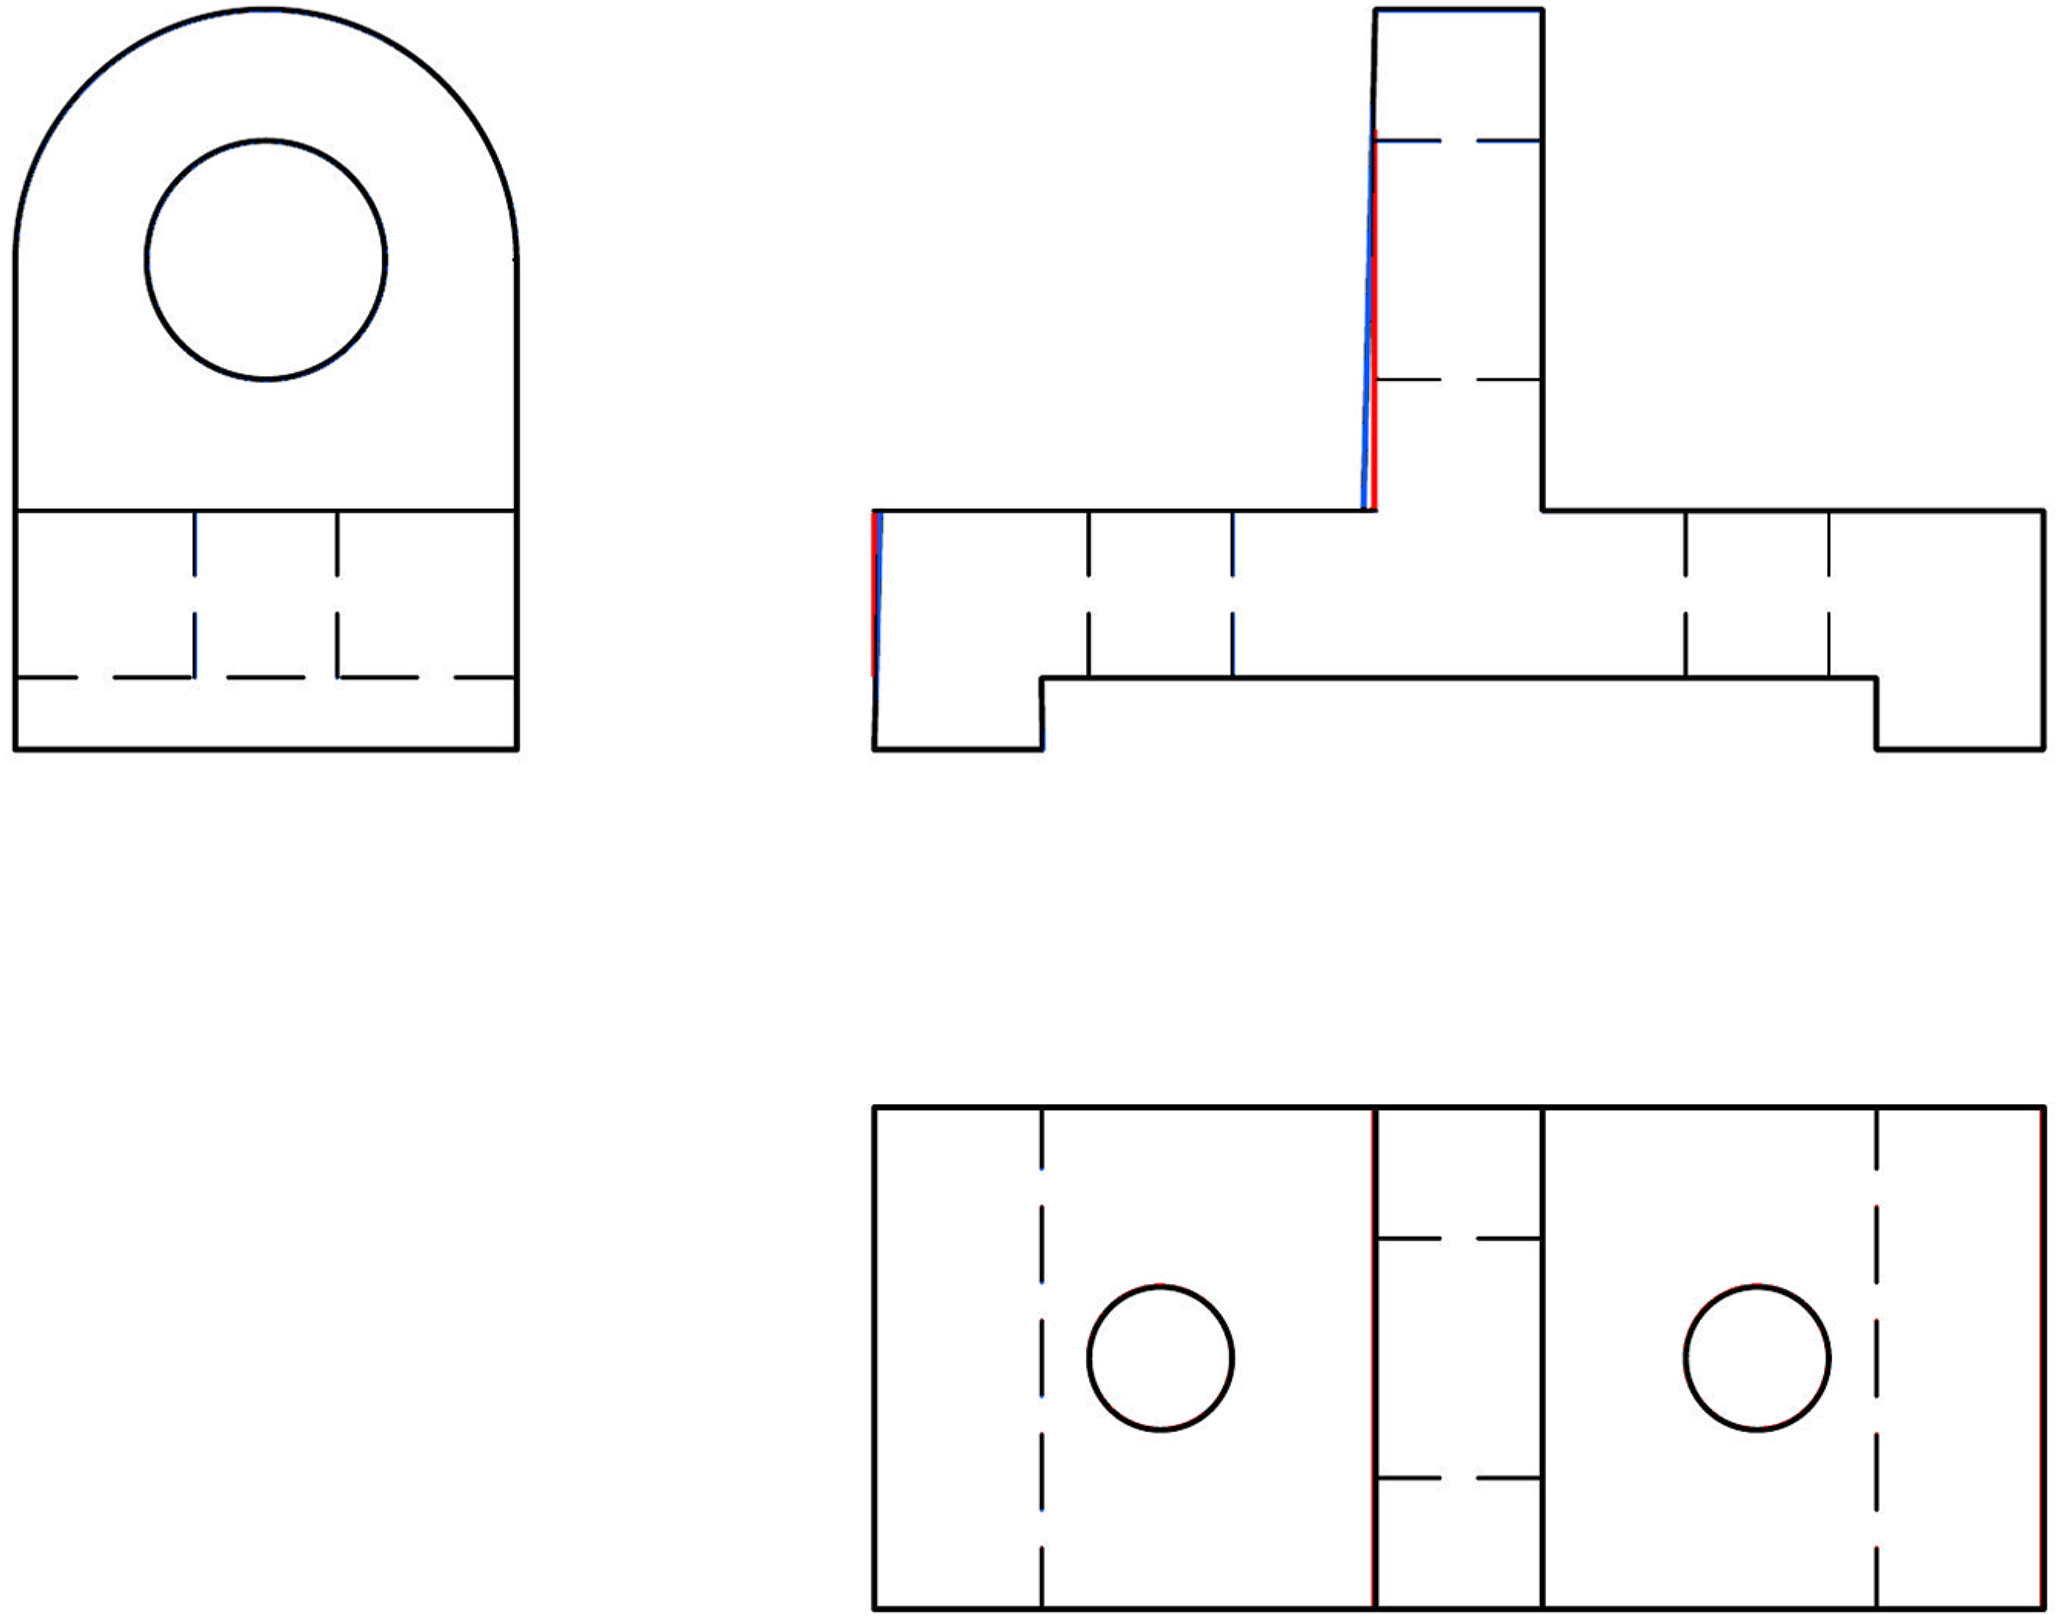
As shown in Table 3, both AMCAD and grading system 3 highlight line type error (labeled “A”) and horizontal line length error (labeled “B”) in the student's drawing. However, the location error of the vertical line (labeled “C”) arising from error “B” is not highlighted as it should be in. 3 AMCAD correctly captures this location error and displays it as Erroneous Line (in blue) and Missing Line errors (in red) in the student's front view. The blue and red lines identify the source of error in the student's drawing. The student can easily amend their drawing without having to consult the teachers.
Visual feedback of two assessing tools.
An automated grading/feedback system for three-view engineering drawings using RANSAC, 2015
The drawing in Figure 15 is used to illustrate the evaluation comparison between Kwon and McMains’ study 5 and AMCAD. Figure 16(a) shows the algorithm developed by RANSAC method failed to estimate an appropriate transformation for the front view of the solution drawing when the front view of the student's drawing has multiple errors (labeled “A” and “B” in Figure 15(b)). However, AMCAD is able to correctly match the three views highlight both Missing Line and Erroneous Line errors correctly on the student's drawing as shown in Figure 16(b).
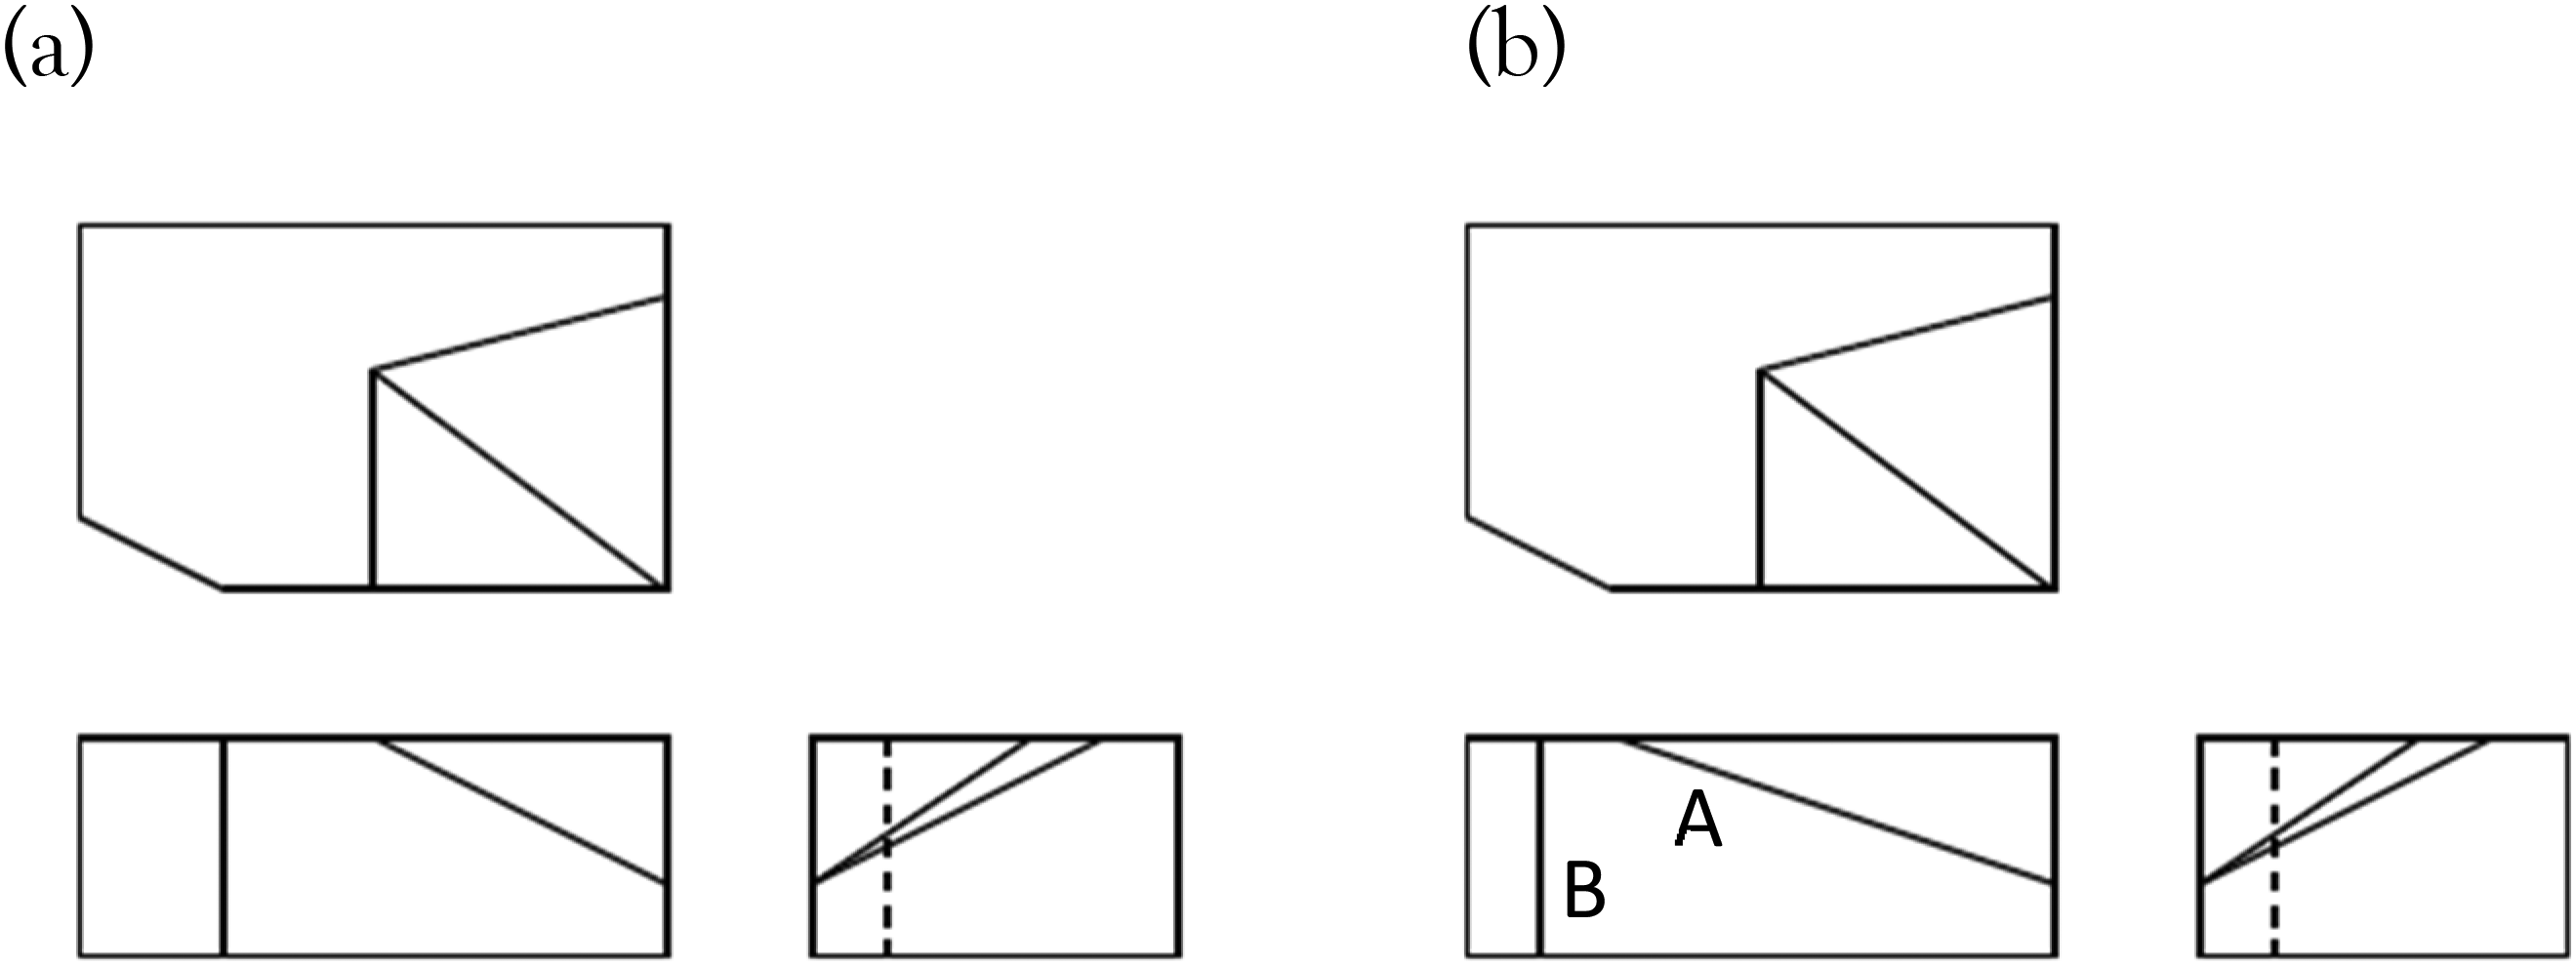
Sample drawing used in: (a) solution drawing and (b) student drawing. 5
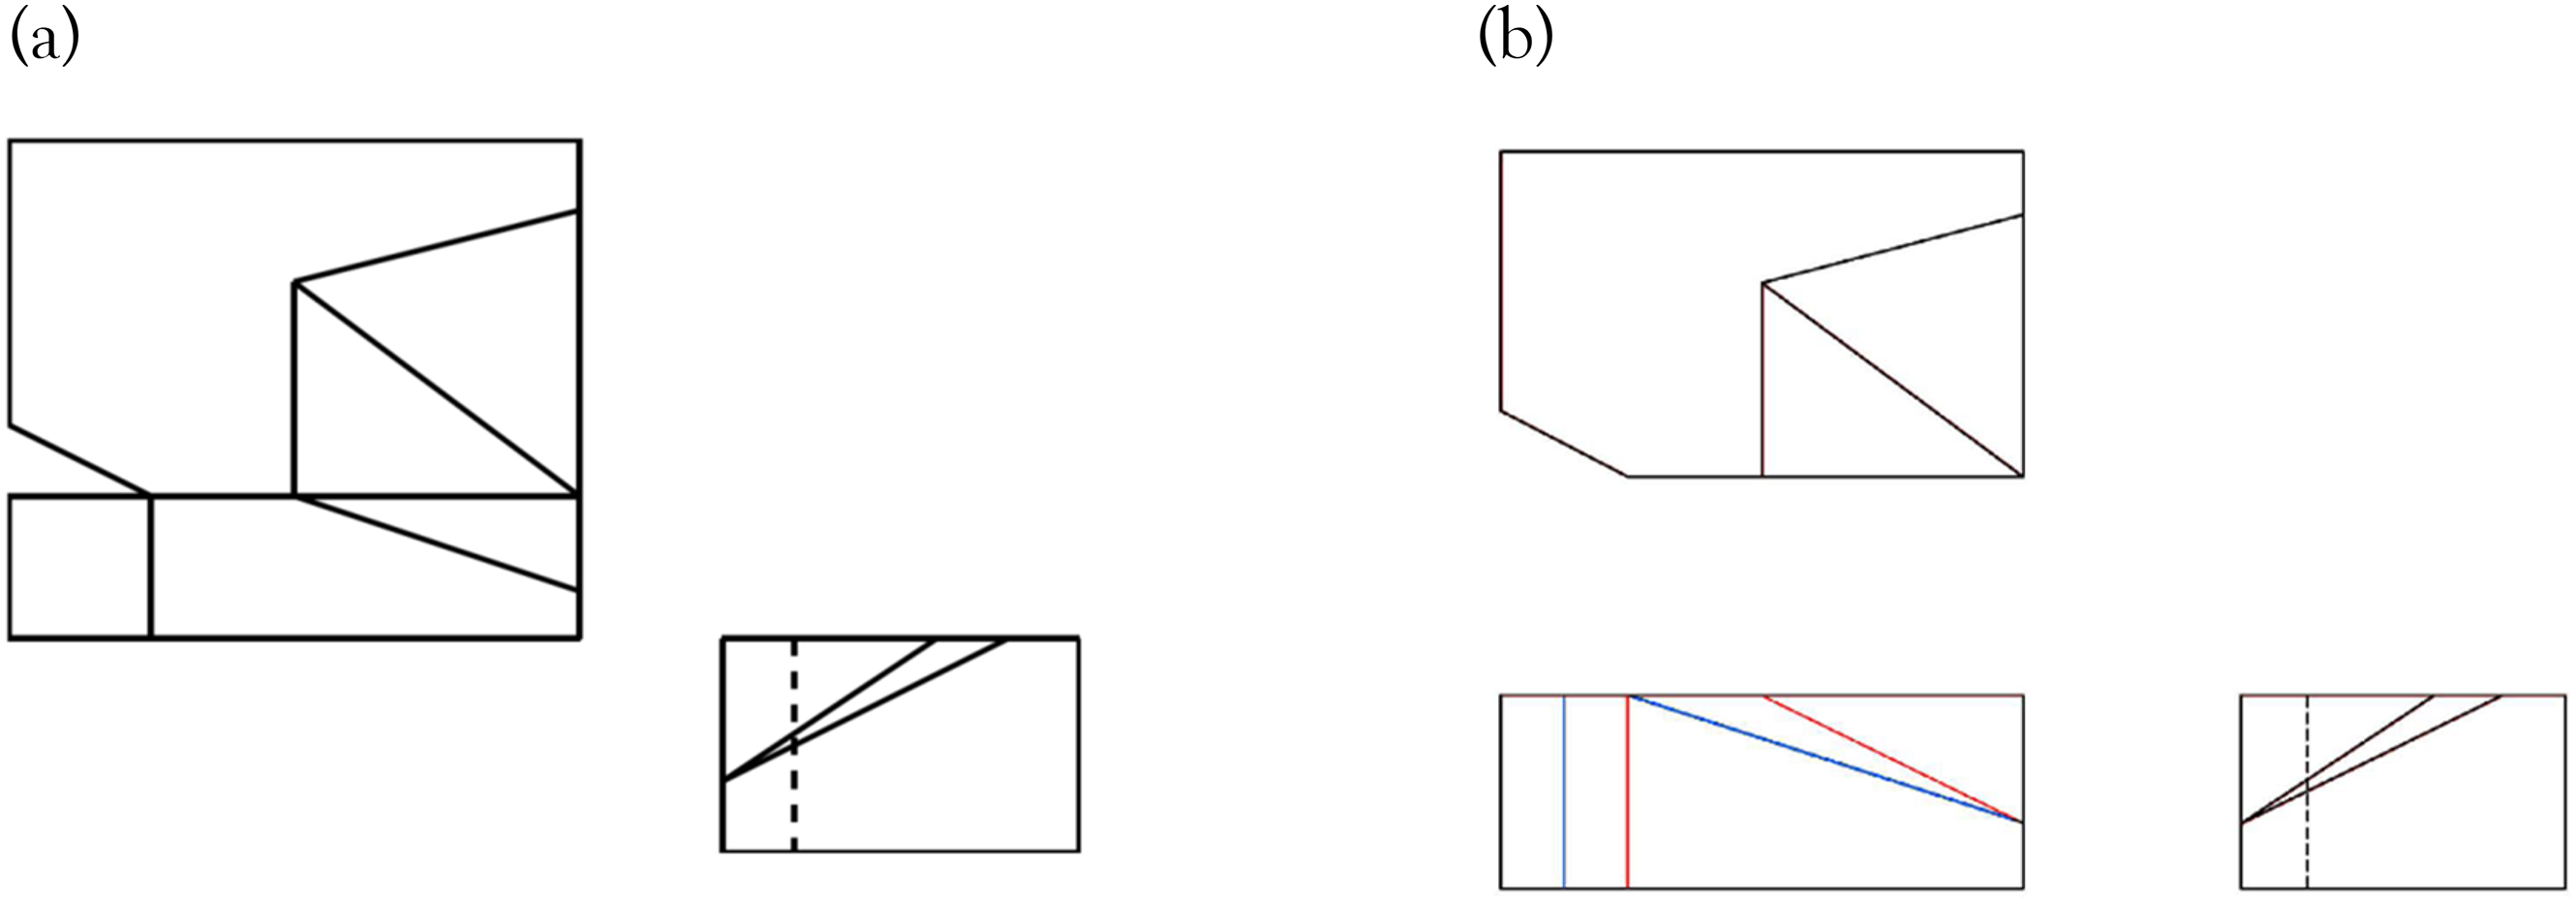
Comparison of auto-assessing in: (a) literature 5 and (b) AMCAD.
CADcompareTM: A web-based application that compares PDF CAD drawings, 2018
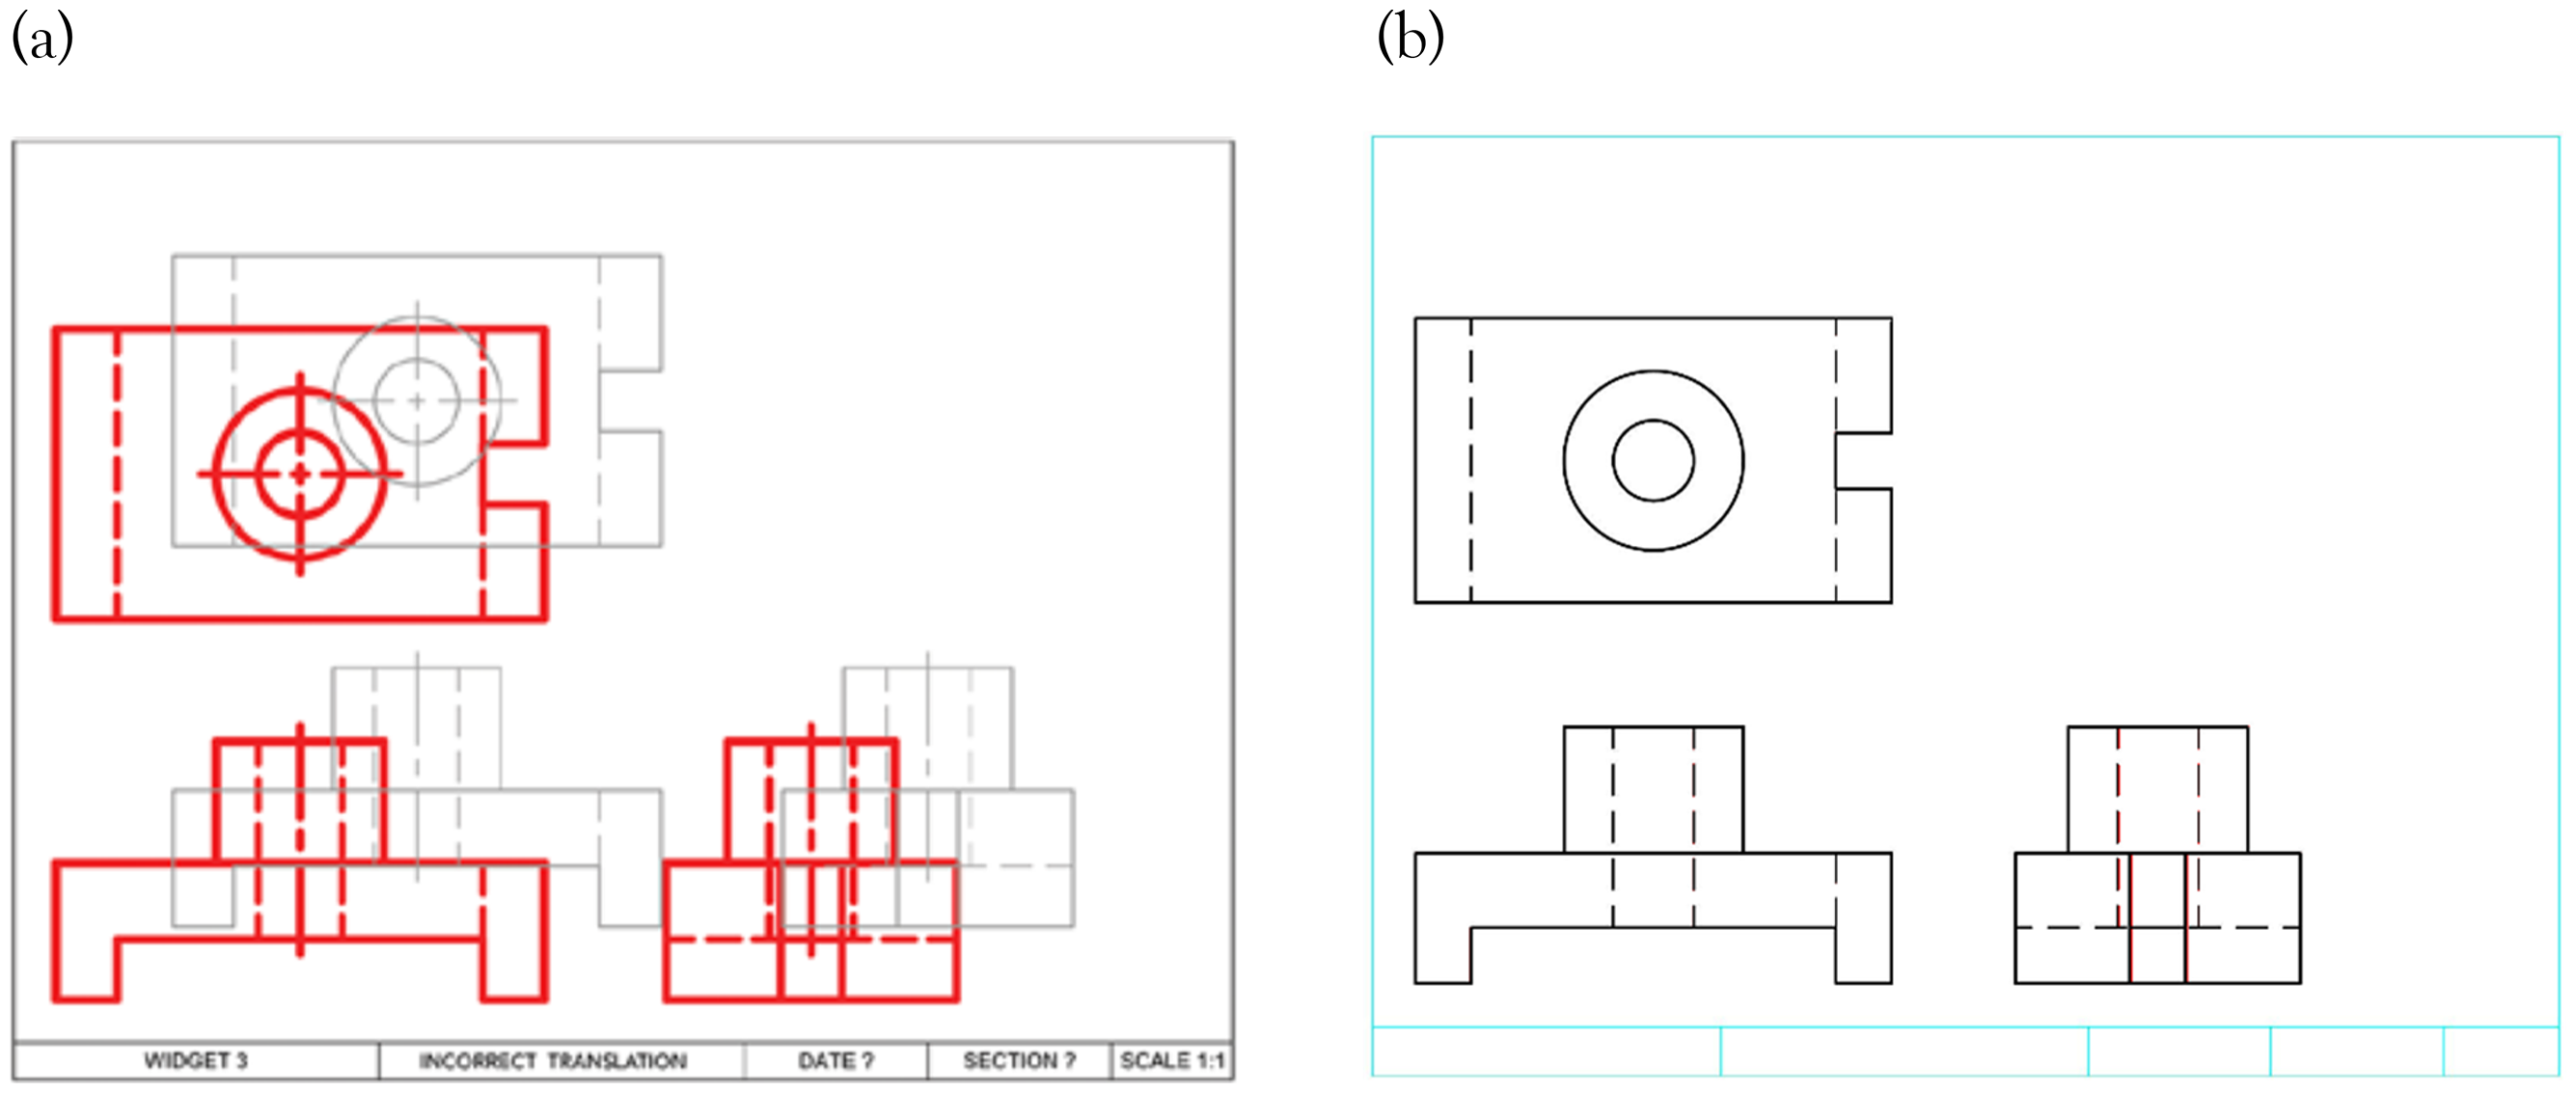
The drawing in Figure 17(a) and (b) were used to illustrate the evaluation comparison between Di Beneditto and Webster’s study 7 and AMCAD, clearly show that the location of each views in both the student's and teacher's drawings are different.

Sample drawing used in: (a) solution drawing and (b) student drawing. 7
Although all the views in the student's drawing are drawn correctly, 7 incorrectly flags this as errors as shown in Figure 18(a). AMCAD which translation invariant, avoids this evaluation pitfall in the comparison as illustrated in Figure 18(b).
Comparison of auto-assessing in: (a) literature 7 and (b) AMCAD.
AutoCAD drawing compare plug-in, 2019
AutoCAD drawing comparing tool (DWG compare) has the same problem as Di Beneditto and Webster’s study. 7 The authors used DWG compare to assess the two students’ drawings, A and B with the same drawing errors (labeled “a”, “b”, and “c” as shown in Figure 19(a) and (b)). Views in drawing A are located the same as the teacher's drawing (see X and Y coordinates) whereas views in drawing B are located differently. In the comparison result shown in Figure 20(a), AutoCAD correctly highlights the errors in drawing A whereas in Figure 20(b), it shows that all the views in drawing B are incorrect. For marking of CAD exercises manually or otherwise, exact location of the views in the drawing is not important, and should not be used as a criterion. Figure 21 is the comparison of drawing B (Figure 19(b)) by using AMCAD. It highlights the errors (“a”, “b”, and “c” shown in Figure 19(b)) in the student's drawing even if the error is very minor.
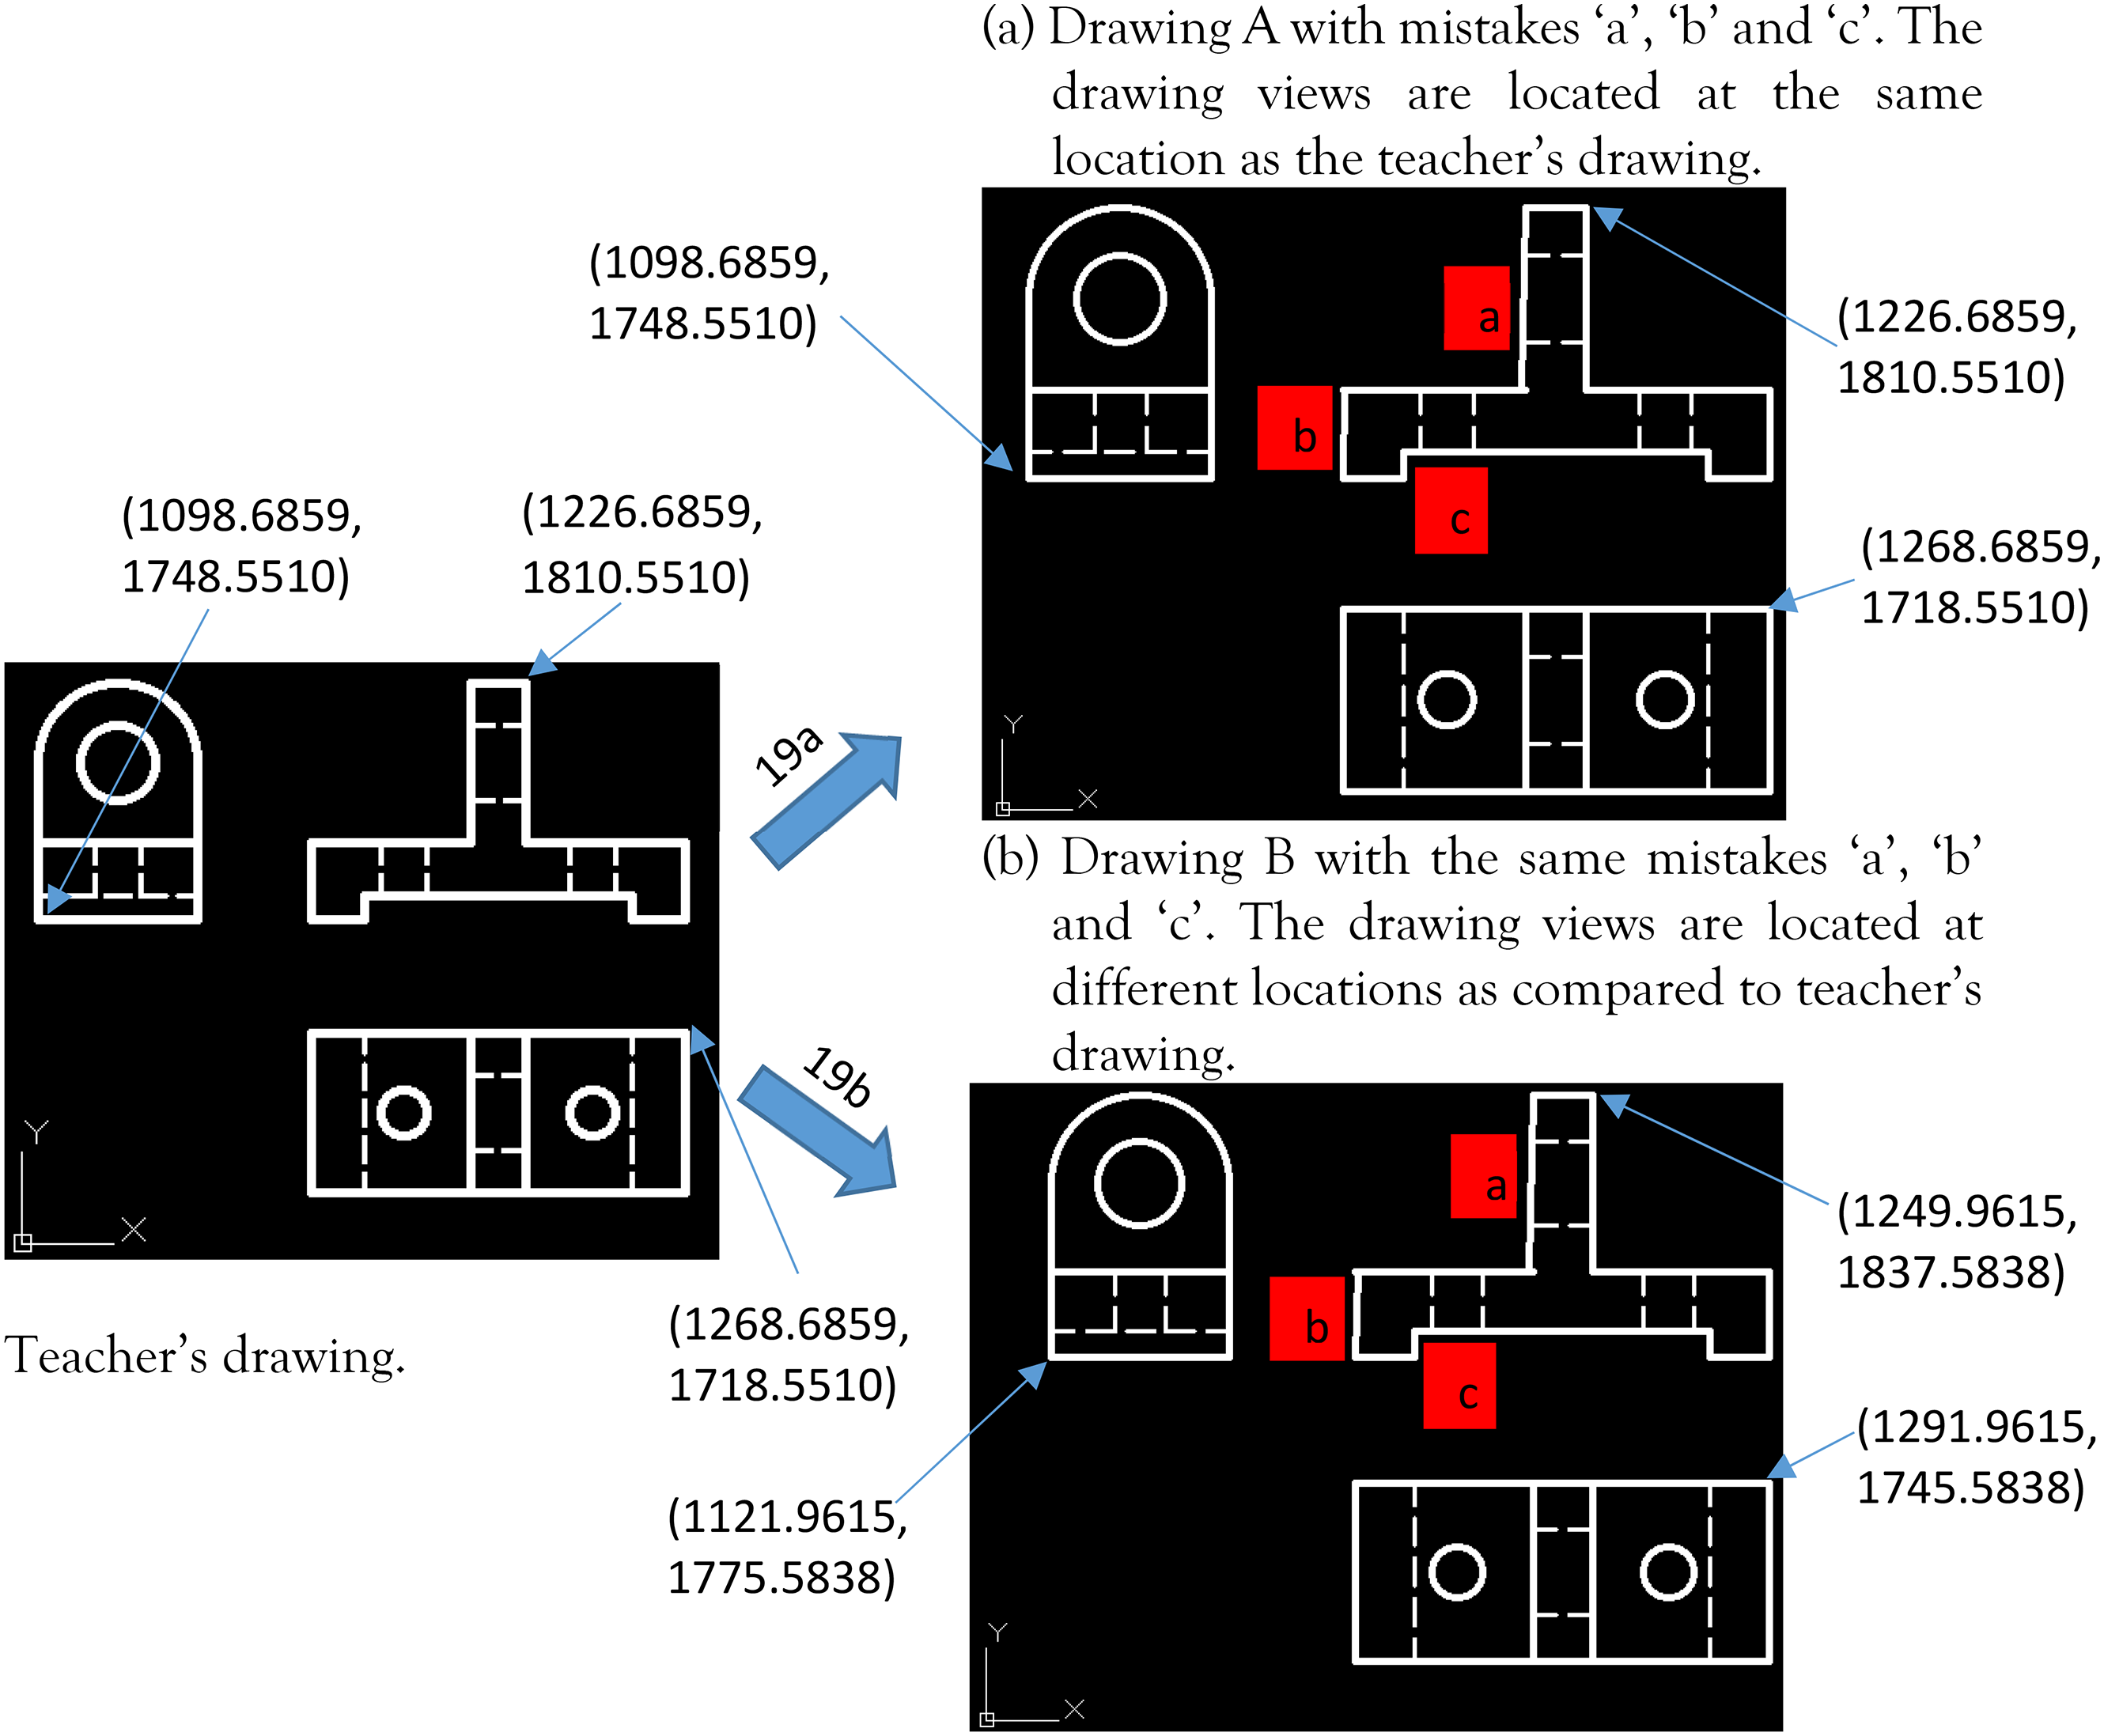
Comparison of teacher's drawing (left) with two drawings (right) with DWG compare.
AutoCAD drawing comparison (DWG Compare). (a) Errors are correctly highlighted. (b) Errors are incorrectly highlighted.
Automarking for drawing B by using AMCAD.
Limitations
Presently, AMCAD does not detect, and differentiate entities such as dimensions, GD&T symbols, center lines/center marks, notes, and title blocks. It compares and grades only drawings views created in black color. As such, drawings entities that are not covered in the present scope of AMCAD must be presented in colors other than black and green colors. Graded objects in a drawing are therefore color-sensitive in AMCAD.
Users have to adhere to specific instructions in the CAD exercise or use the drawing templates provided. Otherwise, AMCAD will generate unexpected results.
Drawings submitted in different scales
AMCAD compares drawings based on pixels. If students use a different scale, either in the view creation or PDF export process, other than the one specified in the CAD exercise, AMCAD grading will be incorrect. This is illustrated in Figure 22. Figure 22(a) shows a drawing submitted with views created using a different scale. Figure 22(b) shows the same drawing exported in a different scale. Figure 22(c) is the teacher's drawing. As shown in Figure 22(d) and (e), although both drawings (Figure 22(a) and (b)) are technically correct, AMCAD indicates otherwise.
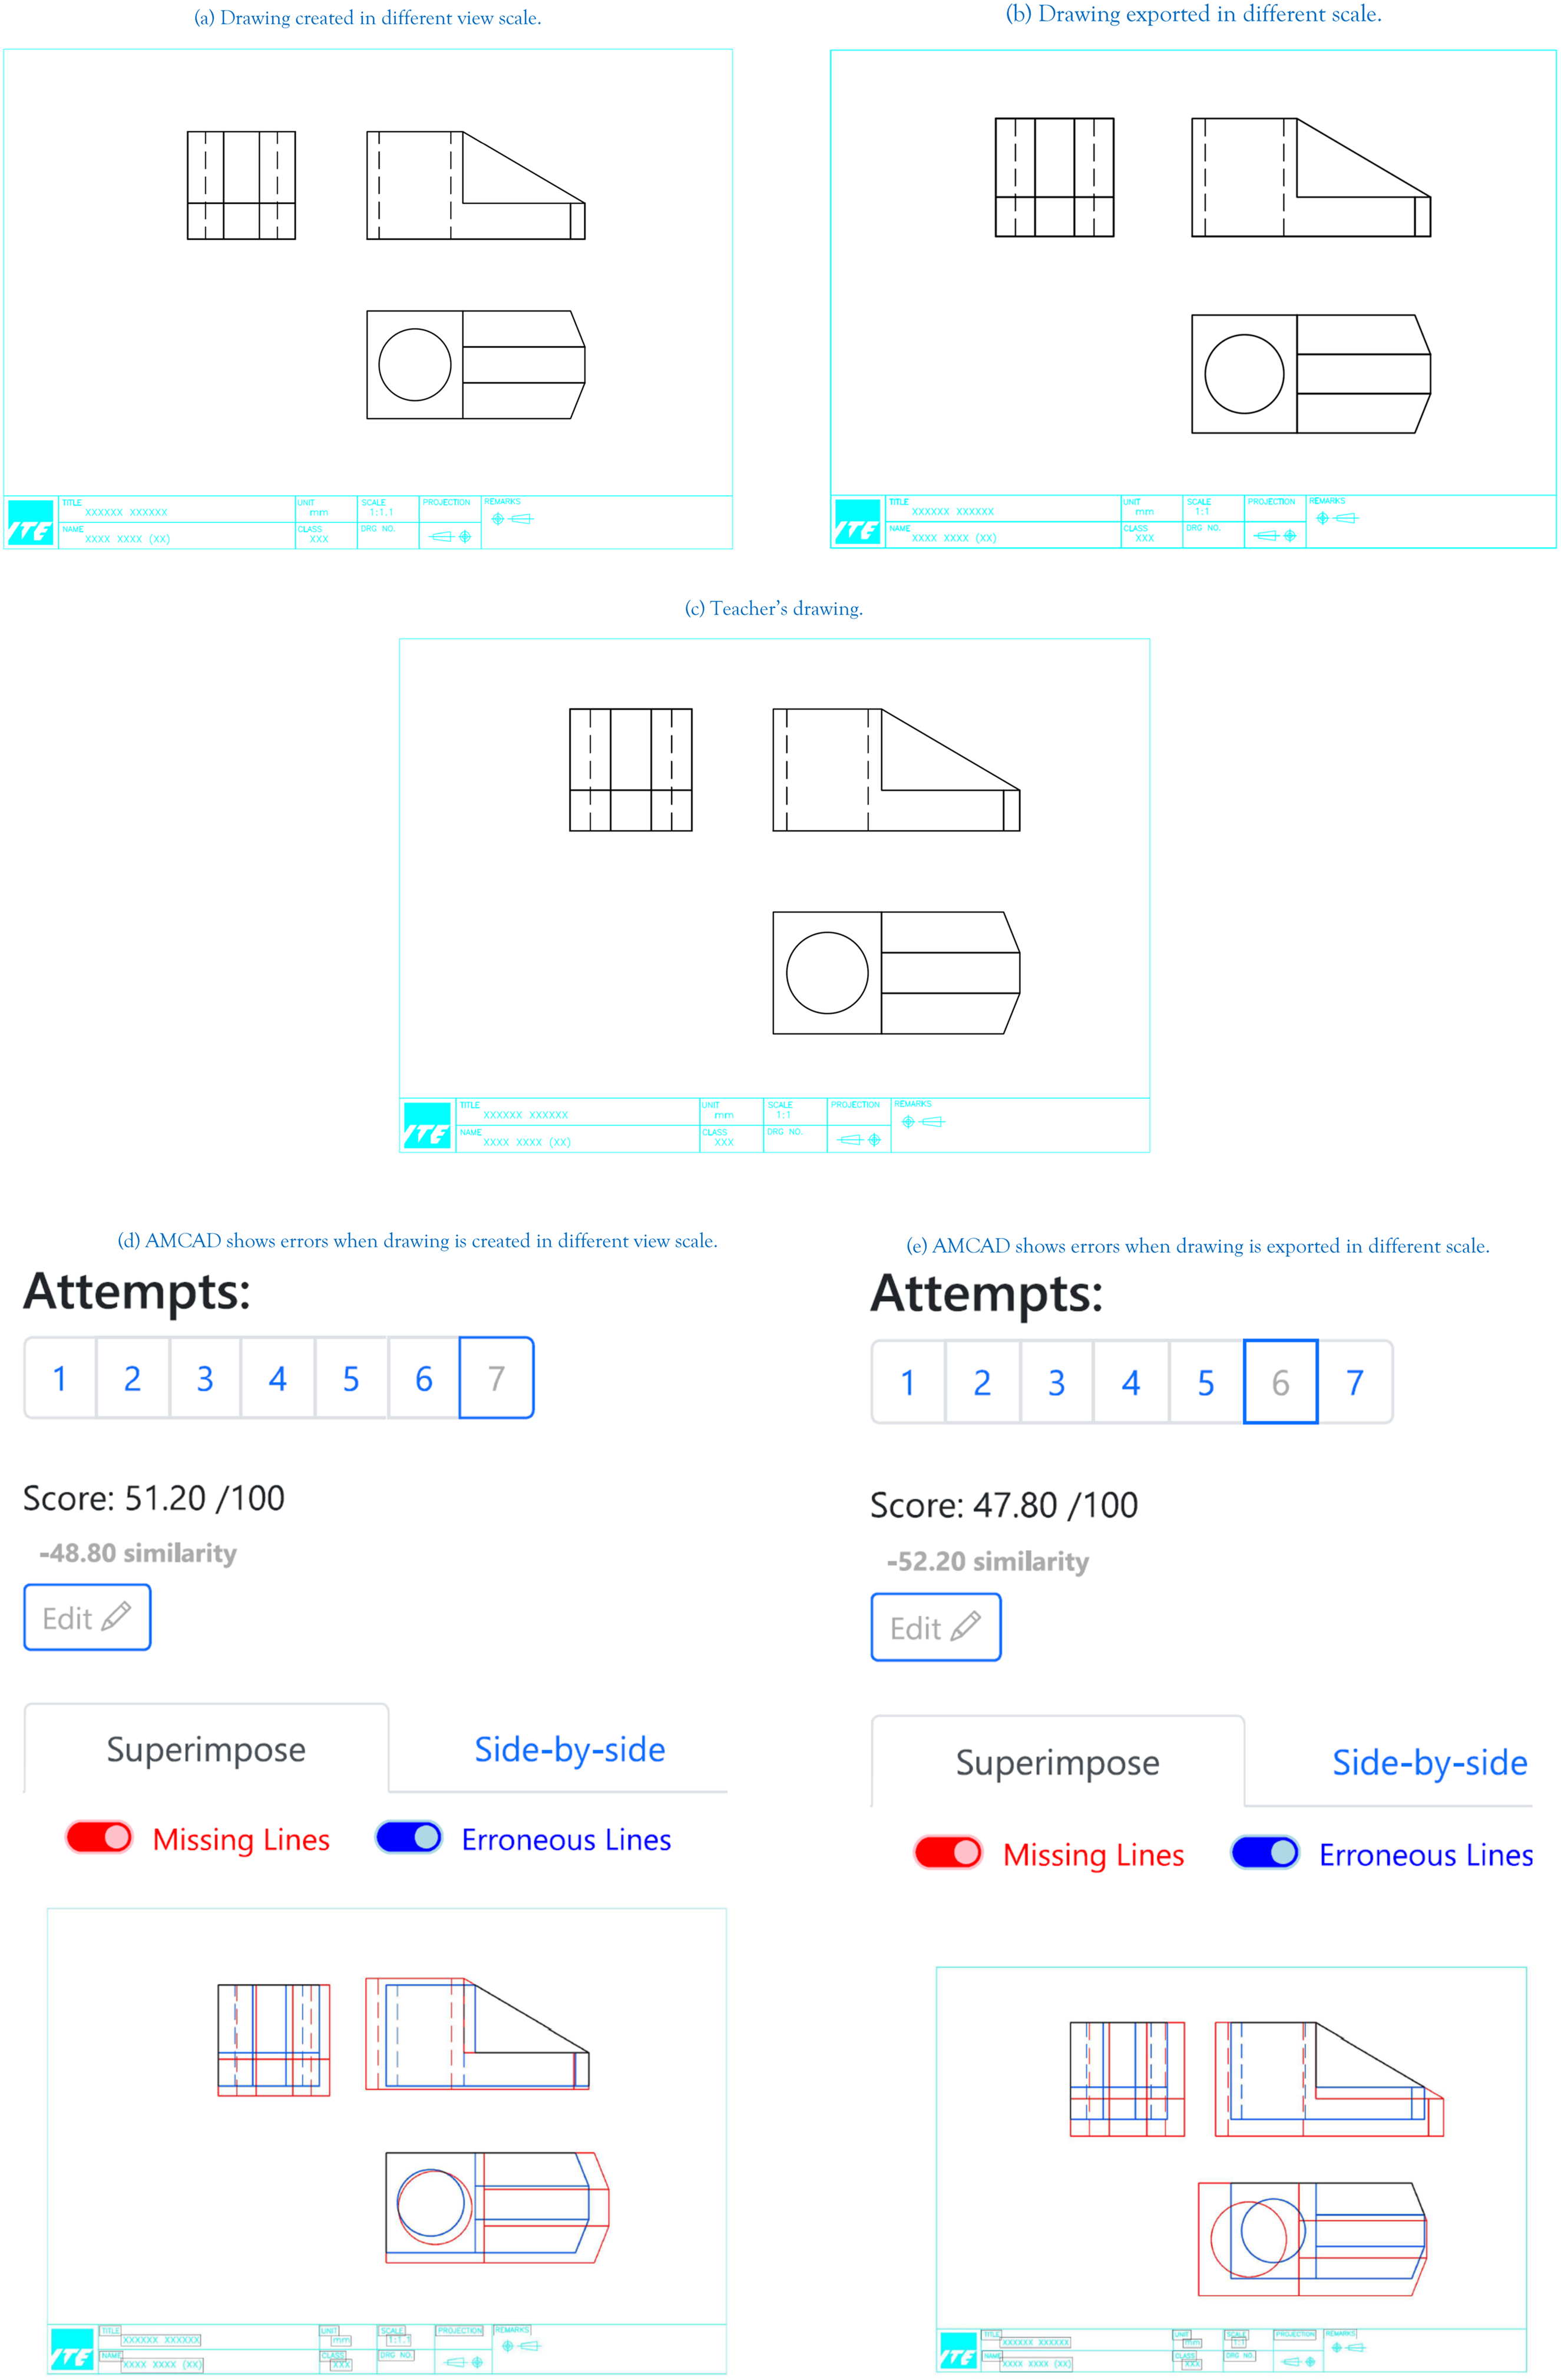
Drawings submitted in different scales. (a) Drawing created in different view scale. (b) Drawing exported in different scale. (c) Teacher's drawing. (d) AMCAD shows errors when drawing is created in different view scale. (e) AMCAD shows errors when drawing is exported in different scale.
Nondrawing standard line type thickness
AMCAD complies to, and assesses drawings based on standard line type thickness. Deviations from these standards will result in unexpected errors in the AMCAD output (see, e.g., Figure 23). Figure 23(a) is a student's drawing created using different line type thicknesses. Figure 23(b) is the teacher's drawing. Again, although the student's drawing is technically correct, AMCAD return a zero score as shown in Figure 23(c).
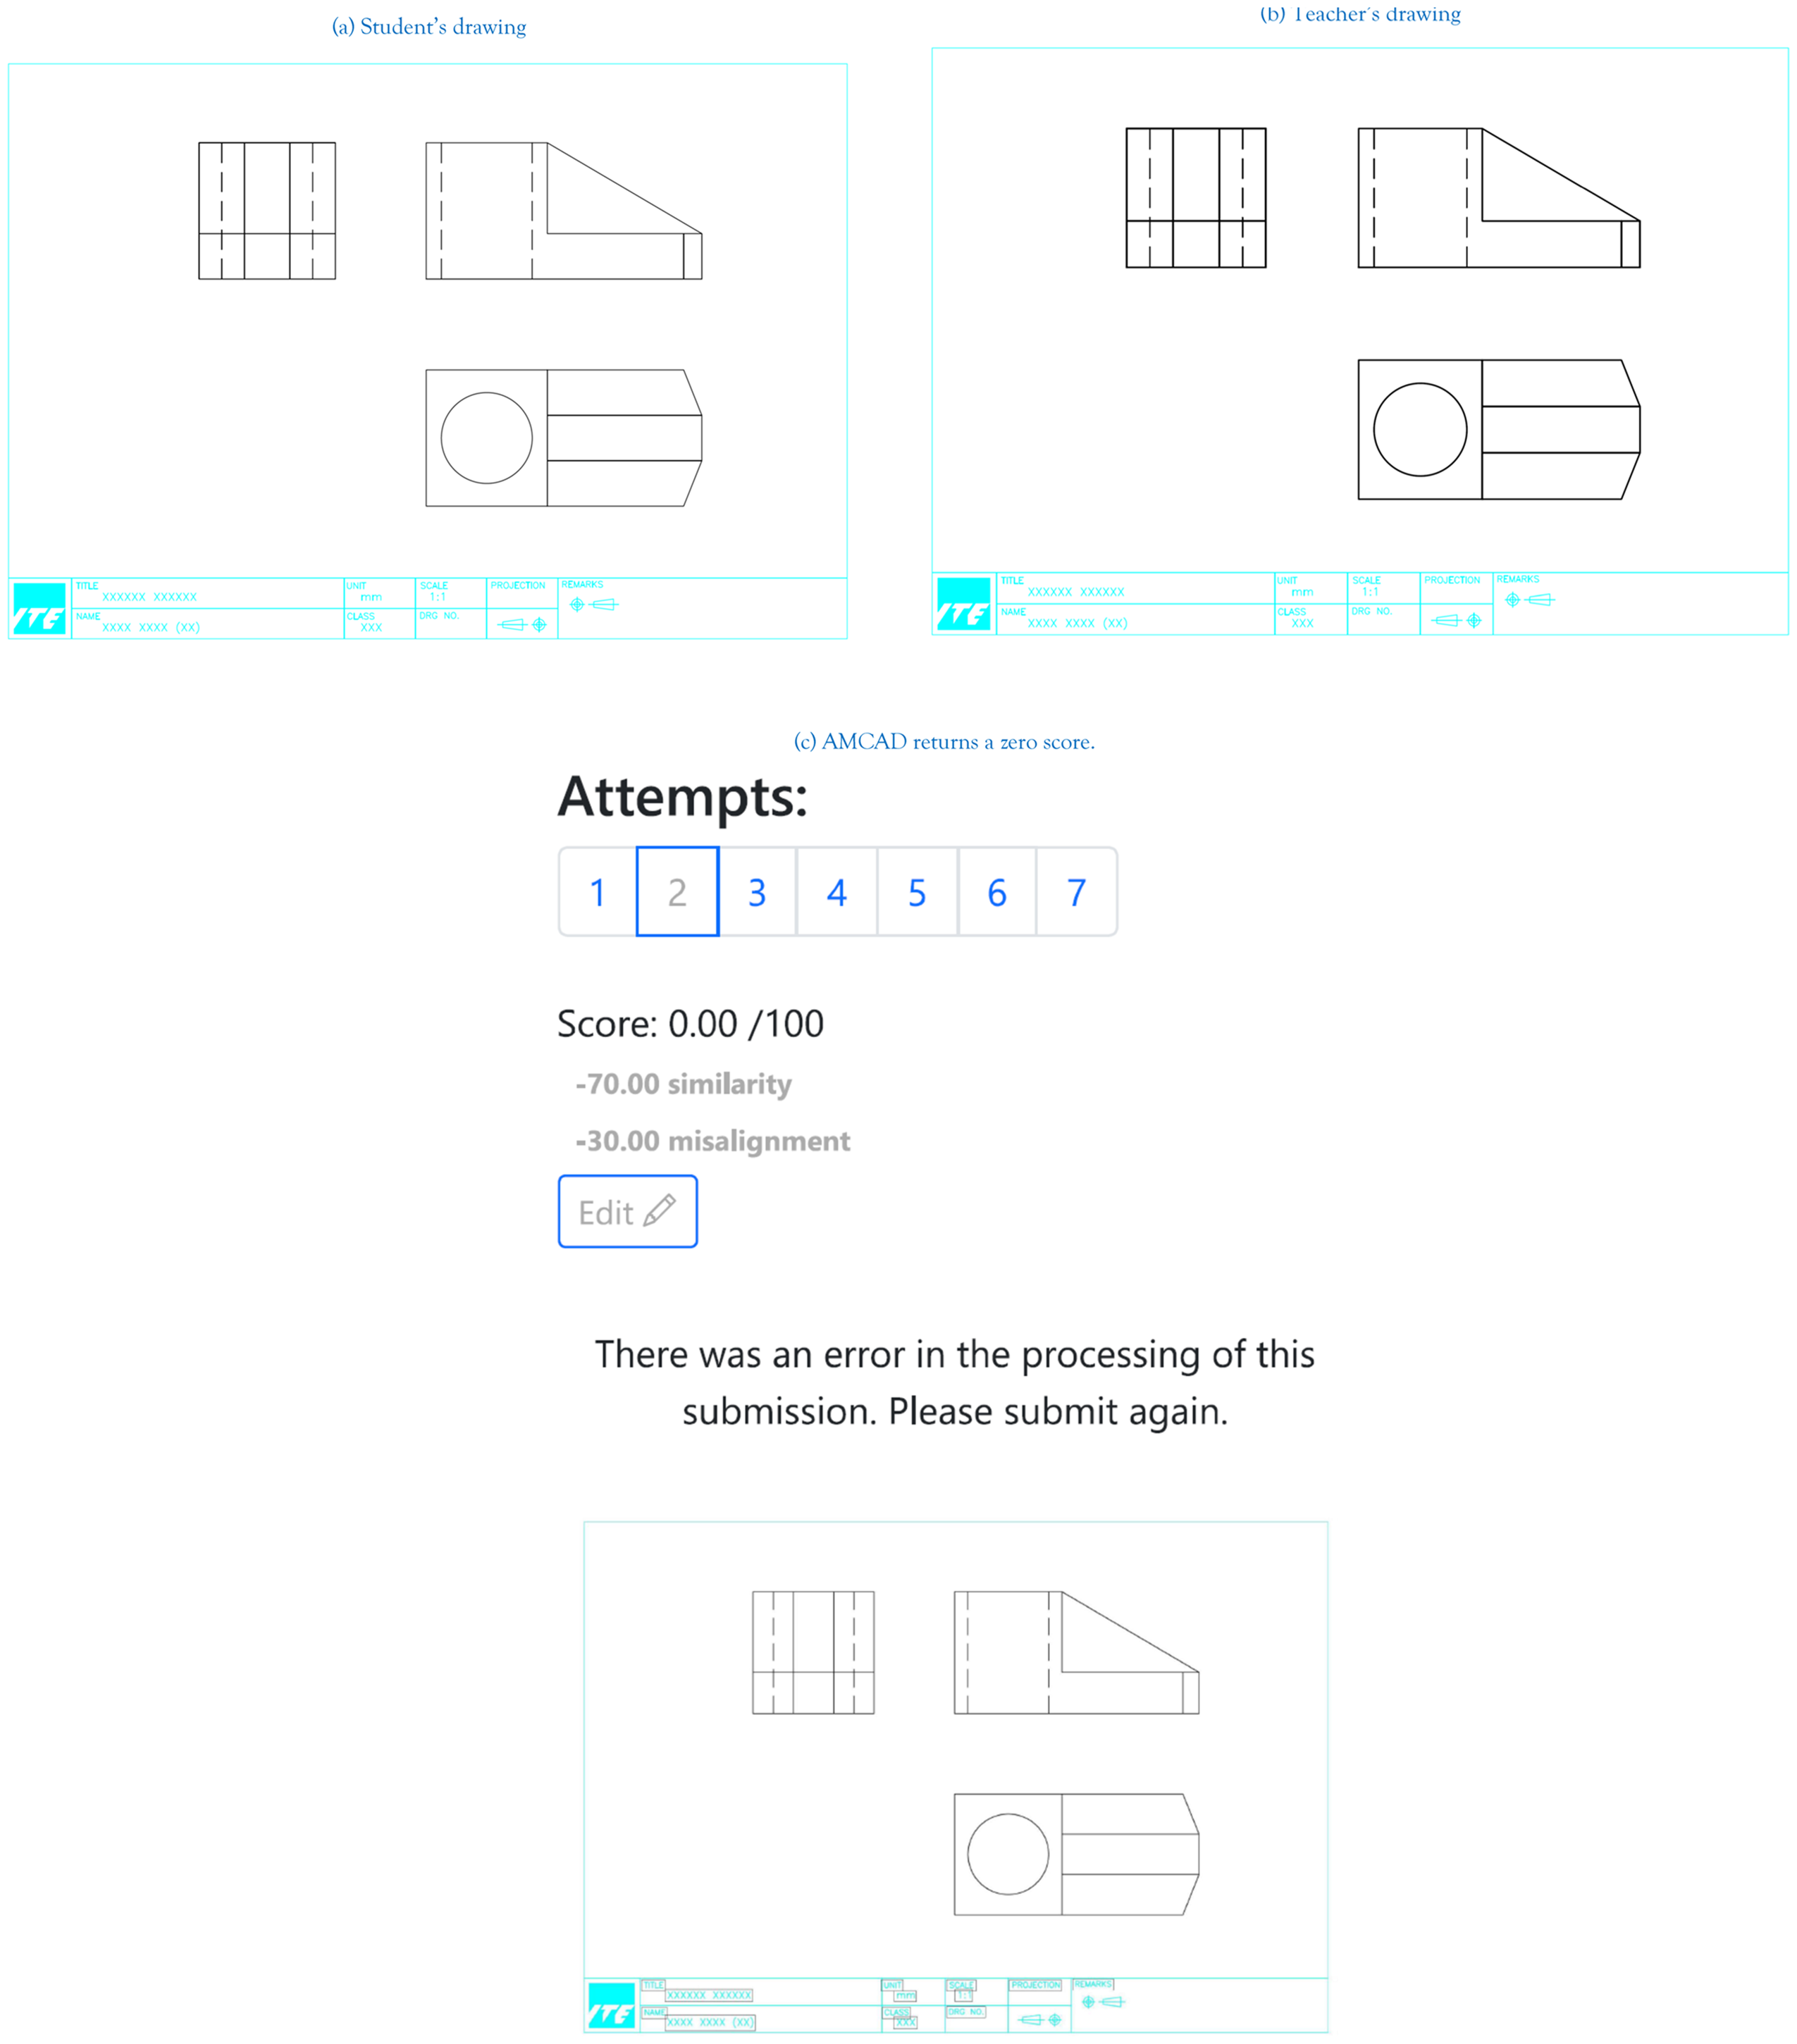
Noncompliance of line-type thickness in drawing. (a) Student's drawing. (b) Teacher's drawing. (c) AMCAD returns a zero score.
Incorrect color used for grading objects
As mentioned above, graded objects in a drawing are color-sensitive. AMCAD detects and grades drawings based on pre-defined colors. For example, entities such as lines, circles, arcs, ellipses are black color. Section lines are green color. Similarly, noncompliance will result in unexpected outputs. Figure 24(a) is a student's drawing with title block in black. Figure 24(b) is the teacher's drawing. Figure 24(c) shows the comparison output.
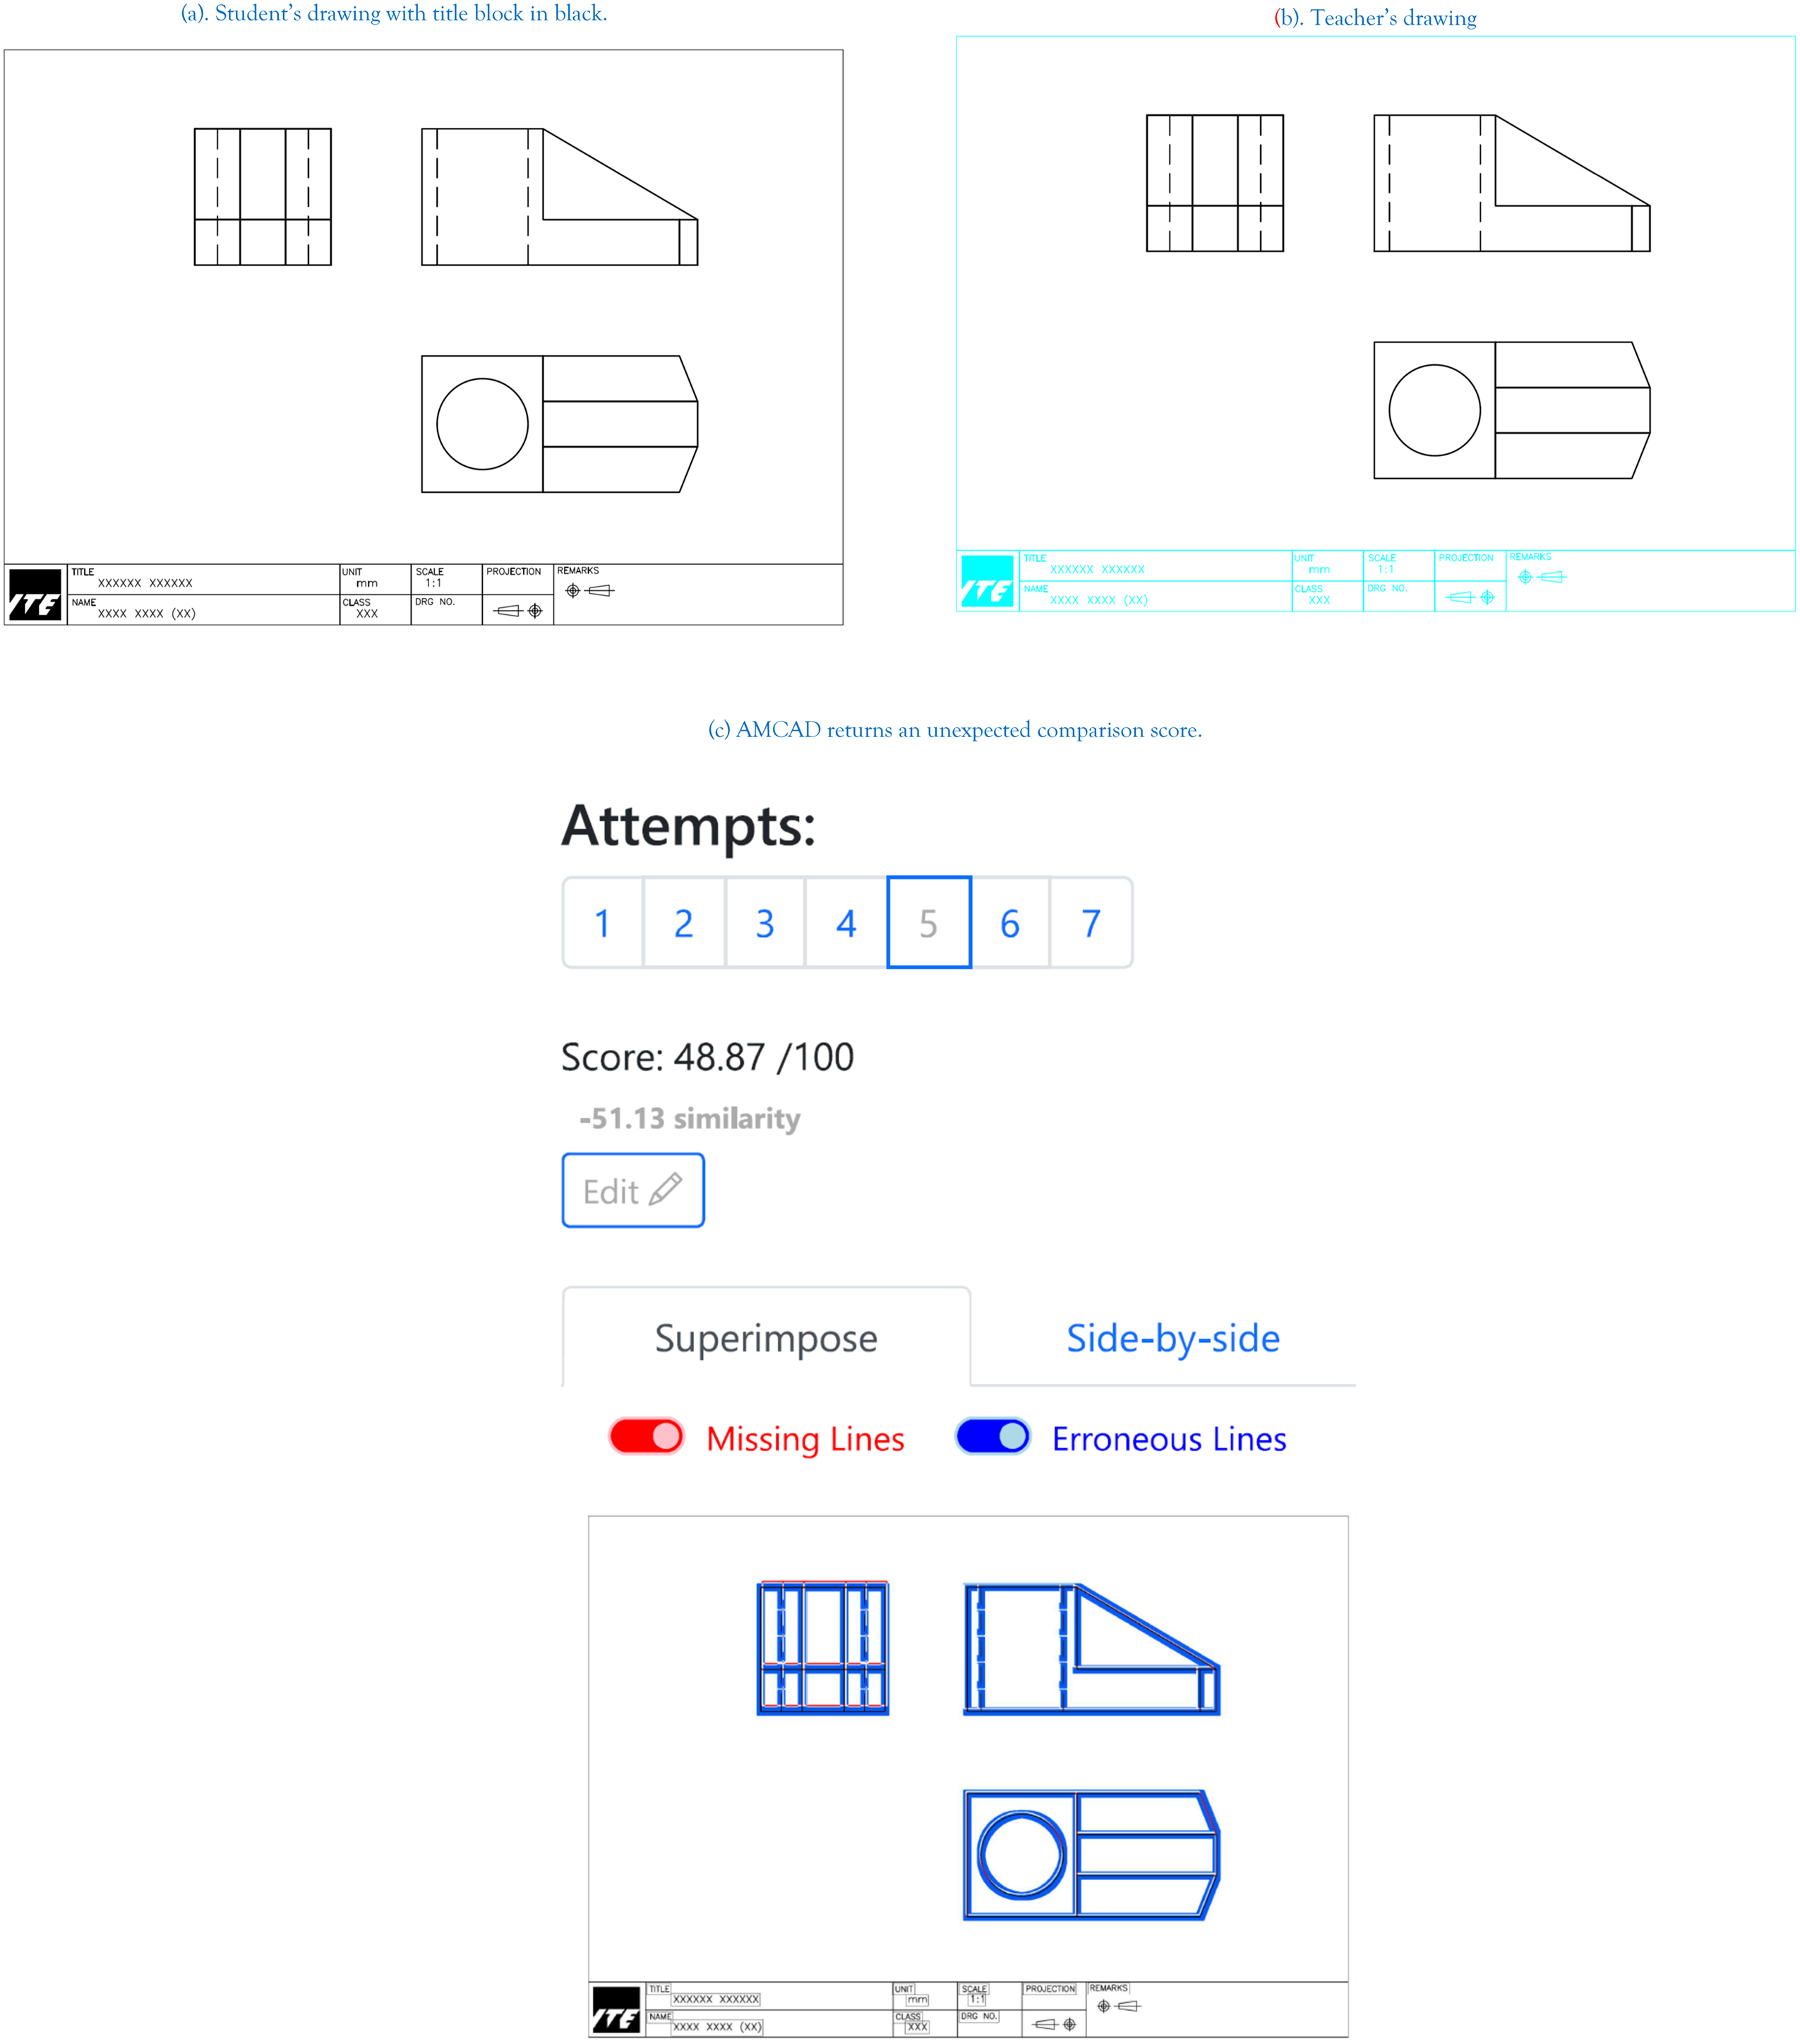
Wrong color are used for the grading objects in a drawing. (a) Student's drawing with title block in black. (b) Teacher's drawing. (c) AMCAD returns an unexpected comparison score.
Conclusion
AMCAD was developed with AI evaluation in mind and is timely in its deployment for technical education particularly during home-based learning. AMCAD is now successfully implemented to assist teachers in teaching engineering CAD drawings in ITE.
Footnotes
Acknowledgements
We are grateful to Reluvate Technologies Pte Ltd for the support rendered in this project.
Declaration of conflicting interests
The authors declared no potential conflicts of interest with respect to the research, authorship, and/or publication of this article.
Funding
The authors disclosed receipt of the following financial support for the research, authorship, and/or publication of this article: ITE for provided the funding.