
Abstract
This paper is concerned with the determination of the yield surface in a two-dimensional stress field within an undergraduate Mechanics of Materials student laboratory experiment. In this experiment, the two-dimensional stress field is obtained by subjecting a steel specimen to a combined bending and torsion load. The motivation for the paper was the lack of correlation between the von Mises and Tresca yield criteria and the principal stresses calculated at the load at which students were predicting material yielding. The latter yield loci were based on the uniaxial 0.2% proof stress. The lack of correlation was creating a lot of frustration amongst students. This is undesirable, especially within an undergraduate student experiment. Two hypotheses for the lack of agreement were considered. The first hypothesis was the uncertainty involved in the method that the students were using to predict the onset of material yielding. The second hypothesis was that the specimens being used for the experiment had anisotropic properties, given that little information on their manufacture was provided. The need for determining accurate yield stress values and on methodologies found in literature that are used to determine the material proof stress or lower yield stress in a uniaxial tensile test are discussed. Four methods taken from literature are used and adapted to detect the first yield of the specimen under a combined bending and torsional load. The resulting experimentally yield loci are compared with the theoretical von Mises and Tresca isotropic yield loci over half of the second quadrant of the two-dimensional principal stress field plot. Correlation between the four methods was quite good but not so when compared with the von Mises and Tresca’ loci. A lack of correlation occurred for an increasing torsional load indicating a possible anisotropy in the material properties. These results hinted towards the second hypothesis. A number of tensile test specimens were hence heat treated so as to induce isotropy in the material properties. The combined loading experiments were repeated using the heat-treated samples. A very good correlation was obtained between the experimental yield points for the two-dimensional stress field and the von Mises and Tresca yield loci. This good correlation for the heat-treated specimens confirmed the authors’ second hypothesis on the anisotropic properties in the as-received state and, therefore, the requirement to heat treat the specimens for a meaningful student undergraduate laboratory activity.
Introduction
In an undergraduate Mechanics of Materials study unit, students are introduced to direct stresses, bending stresses and shear stresses and how to calculate these depending on the type of loading. Stresses are then compared with the allowable to determine the failure modes of the mechanical component. One of the fundamental failure modes is material yielding that is the change of the material behaviour from elastic to plastic. Other failure modes such as low cycle fatigue and ratchetting are related to material yield. Illustrating yield failure in a 2D or 3D stress system is therefore important in an undergraduate mechanical engineering course. Having said that, experience has shown that the combined bending and torsion experiment 1 can, however, have a counter/undesirable effect on the student. This is due to the uncertainty experienced in determining the uniaxial yield point and in the correlation with yield criteria. Determination of the yield stress is essential for design and stress analysis. Measuring the material yield stress was the subject of a long history of research that at the end resulted in a code of standards that allow stress analysts to design with confidence and repeatability. From the point of view of students, there is a need for a good correlation between experimental results and theoretical modelling. Only this would allow students to build credibility in stress analysis and design methodologies.
Running the combined bending and torsion experiment is hence a key experience for students following the said Mechanics of Materials study-unit. Over the years, informal student feedback on this laboratory exercise was not good, mainly because results were not matching the expected material response, which took away from the students the experience of reinforcing the theoretical concepts with practical results. The motivation of this work is hence to improve this experimental set-up so as to ensure that students have a positive experience, which reinforces crucial study-unit learning outcomes, and hence gives them the opportunity to successfully develop their knowledge and skills within a mechanical engineering undergraduate degree course. The authors decided to address this by investigating the experimental set-up and addressing the research question of whether this laboratory work can be improved for the benefit of the student experience. To this end, two hypotheses for the poor performance are proposed:
Uncertainty involved in the method that the students were using to predict the onset of material yielding. Suspected anisotropic properties specimens being used for the experiment. Carry out a literature review on the determination of yield, in order to ensure that the students are exposed to the most appropriate and important concepts on this topic. Review the current experimental set-up and the unexpected results. Investigate the two hypotheses for the poor performance mentioned above. Investigate any remedial methods that can be applied. Test any new proposed experimental procedure/set-up with students.
The objectives of this work are hence to:
To this end, the paper starts with an important literature review, which also gives important historical perspectives, on the determination of yield, followed by the description of the experiment procedure, and results obtained with current set-up and finally the improved set-up.
Literature review
During the second half of the last century, the International Organisation for Standardisation (ISO) initiated work on an international code of standards for stationary boilers. The draft code that was subsequently prepared at the time, introduced relatively new design criteria relating to boiler steel material properties. These design criteria were not always the same as those used in a number of different countries. For example, in the new draft, the ISO standard code for stationary boilers used a factor of safety of 1.6 for the 0.2% proof stress (or lower yield stress) determined at the relevant elevated temperature between 250°C and the creep temperature. For temperatures below 250°C, the new ISO code used a factor of safety of unity for the 0.2% proof stress (or lower yield stress) measured at 250°C. Other new factors of safety relating to material tensile strength, creep rupture and creep strain were also adopted. The major implication, in the right direction, of these new design criteria was that design calculation for components operating between 250°C and the creep temperature was based on a 0.2% proof stress guaranteed at the actual operating temperature. In a later publication on a new design standard for unfired pressure vessels (B.S. 1515: Part 1:1965), this factor of safety on proof stress was reduced to 1.5. 2
The factors of safety were and are still pivotal in determining the design stresses to be used in all design calculations. The methodologies used for determining mechanical properties involve a number of uncertainties mainly due to material property variations from one batch of specimen to another and also due to the different material processing techniques which may change isotropic properties to anisotropic ones. An example of the latter is when steel billets are rolled into plates without any further heat treatment or when billets are extruded into round bars, flat bars and other prismatic cross sections.
The international drive towards new design standards affecting the design stresses created a need for mechanical property testing for the relevant steels used in boilers and unfired pressure vessels. At the time, the reported mechanical properties of the same steel material varied from one country to another. This was mainly attributed to the different testing techniques being used. For example, the strain rate during the tensile test has a major impact on the resulting proof stress or lower yield stress. It was also found that the proof stress for carbon and low alloy steels was proportional to the room temperature tensile strength but not so much for austenitic steels. The proof stress was also dependent on the metallurgical variations in the steel material and on the heat treatment and fabrication processes of the testing coupons and supplied material. 2 In this situation, interested parties had the right motivation to develop common testing standards that would serve the purpose of having common international boiler and unfired pressure vessel design codes. These codes required specifications for the acceptable materials, their heat treatment, supplied conditions and manufacturing processes.
Over the years, a number of techniques to determine initial yielding were developed by different researchers. Naghdi et al. 3 identified material yielding in a uniaxial test as the stress level at which the loading path suffered a change in direction as loading proceeded. In the case of biaxial loading such as the case of combined tension and torsion, Naghdi et al. used constant deformation rates for both load actions.
Moreton et al. 4 indicated that for strain-hardening materials the usual technique is to use the proof stress rather than the lower yield stress. This eliminates the subjectivity involved in identifying the elastic limit or else the limit of proportionality. Moreton et al. 4 were interested in the limit of proportionality rather than in the elastic limit or the yield stress (proof stress). For most materials, these points are very close and it is rather difficult to distinguish between their exact value. Having said that, this statement may not hold for other materials. In order to define the limit of proportionality, the authors in Moreton et al. 4 used a technique developed by Philips 5 in which a plot is made of load against strain so that a ‘best’ straight line is fitted to the data below the yield stress once enough points are available. On subsequent loading and when three successive points lie to the right of the ‘best’ straight line, loading is terminated. A second ‘best’ fit straight line is passed through the three data points and extrapolated backwards to intersect the first ‘best’ fit line. The value of stress where the two lines meet is taken to be the yield point. Moreton et al. 4 , 6 claim that for a steel material that has a gradual strain hardening response and using the above technique, the limit of proportionality can be accurately detected by incurring only about five microstrain permanent strain. They emphasise that yield stress values (rather than the limit of proportionality) obtained in this way using the deviation from linearity would be lower than would normally be expected. In Ellyin et al. 7 , in their experimental investigation on the development of the yield surface of 2024-T351 aluminium, determined the yield point to be that corresponding to the point where the stress–strain curve deviated from linearity within 20 microstrains.
Hahner et al. 8 present developments of the small punch test to determine the yield stress of a material. In this type of test, a rig is usually used to load a small 8 mm diameter disc at a constant rate and a force–displacement curve is obtained. The tensile bending stress at the centre of the disc is analytically related to the applied force through the elastic bending theory of plates. The yield stress is then approximated by observing the departure from linearity of the elastic part of the force–displacement curve. Since this deviation takes place gradually it was somewhat difficult to decide on the value of the force that causes yielding to take place. The authors in Hahner et al. 8 working on developing the small punch test method reported that other researchers used graphical methods to deduce the applied force that causes yielding. These methods were the offset method and the two-tangent method. In the offset method, a straight line is drawn parallel to the elastic part of the load–deflection curve at an offset small displacement of 50 mm for a standard specimen disc of 0.5 mm thickness and then using the force value at the intersection of this straight line with the force–displacement curve to calculate the yield stress. In the two-tangent method, two tangents were drawn to the elastic and plastic part of the curve, and the force to calculate the yield stress is taken from the point where these two tangents meet. Force displacement curves normally have a point of inflection at low loads due to the settling of the specimen in the test rig. This creates some uncertainty as to where to draw the tangent to the elastic part of the curve causing an error in calculating the yield stress. Another method described in Hahner et al. 8 and that was decided upon during the CEN Workshop on the Small Punch Test Method for Metallic Materials, CWA 15627:2007, uses bilinear regression fits to the force–displacement curve. The method is quite similar to the two-tangent method but rather than drawing tangents to the load–displacement curve to obtain the two intersecting lines, the latter are obtained using linear regression to the experimental points.
Janca et al. 9 developed a new criterion in which the force level to cause yield in the small punch test was defined by the point on the force–displacement curve, for which the area under the curve (representing energy) is 1.5 times the complementary area above the curve. Traditionally, in a uniaxial tensile test, the onset of yield is determined by intersecting a line shifted at the 0.2% strain value and parallel to the elastic loading line with the load–deflection curve. Janca et al. argued that this can also be achieved by comparing the area A, under the elastic part with its complement Ac above the curve. During the elastic response part of the curve, A is equal to Ac. This is not so on the onset of yield where A would be greater than Ac. Similarly, Isselin and Shoji 10 have also proposed an approach based on elastic energy. Rather than searching for the elastic–plastic transition force, the authors in Isselin and Shoji 10 used a load/unload test so as to evaluate the area under the elastic part of the force–displacement relation. The elastic part is defined by measuring the elastic reverse displacement during the unloading phase. The elastic reverse displacement is then applied at the beginning of the load–displacement curve to determine the first yield in the small punch test.
Ichinose et al., 11 in order to detect the onset of yield, used the appearance of Luder lines on a polished tensile test specimen of low carbon steel plate. The authors argue that the onset of yield precedes crack formation so that the appearance of Luder lines can be used to anticipate cyclic loading failure due to fatigue. Luder lines can be seen forming during a tensile test but require the surface of the specimen to be polished or at least ground. For a machine-finished specimen, Luder lines can only be clearly seen after removing the specimen from the testing machine, polishing the specimen and etching its surface with dilute nitric acid. 11 This would create an inconvenience during batch material testing.
Krause et al. 12 studied the effect of work hardening and low temperature on the yield stress of austenitic stainless steel grade X2CrNi18-10. The authors conclude that the isotropic yield criteria of Tresca and von Mises are versatile to use but are not suitable for anisotropic material. Such anisotropy can be induced during the processing of the material such as in rolling of plates. For such cases, anisotropic, rather than isotropic yield criteria need to be used. An example of such criteria is the anisotropic Hosford hypothesis. 12 The latter requires three parameters that need to be determined using data from the uniaxial tensile test (Young's modulus and 0.2% proof stress) and from the pure torsion test (modulus of rigidity). In comparison, the isotropic yield criteria require only one parameter obtained from the uniaxial tensile test. The experimentally derived parameters for the Hosford criterion depend on the temperature and on the deformation history of the material. For X2CrNi18-10 steel work hardened in the drawing tensile direction and under combined loading, the experimental yield points, occurred at much higher stresses than predicted by the von Mises, Tresca and isotropic Hosford yield criteria this being especially so for higher ratios between applied shear stress and tensile stress. On the other hand, the anisotropic Hosford criterion predicted experimental yielding for the work-hardened material quite well. In order to determine the principal stresses at the elastic–plastic transition under different ratios of tensile to shear stress any quantity can be used. In a uniaxial tensile test, this quantity becomes the applied direct tensile stress. In a multiaxial load case situation, this quantity can be the plastic work dissipated, the shear stress or even the strain energy. Krause et al. 12 experimentally defined the elastic–plastic transition in the tension torsion tests as being the 0.2% proof stress obtained from a plot of the equivalent von Mises stress against the equivalent von Mises strain under each respective combined loading.
Mattiasson and Sigvant 13 developed and compared a number of other anisotropic yield criteria. They highlight the fact that these criteria require more material parameters than isotropic ones. For example in the criterion they developed, six material parameters from the uniaxial tensile test are required namely the yield stresses in the 0°, 45° and 90° directions and the three anisotropy R-values or Lankford parameters. In addition, a bulge test would need to be carried out to determine the plastic hardening curve for large values of effective plastic strain.
Geiger et al. 14 describe an experimental setup that was developed to determine the anisotropic sheet metal characteristic material data including temperature effects. In their paper, Geiger et al. describe a statistical method that they used to determine the onset of yield during their uniaxial and biaxial experiments. For each load value, the von Mises strain equivalent is plotted against the punch displacement in the small punch test. The curve is obviously linear for small values of load until gradually, as plasticity spreads through the test specimen, it becomes highly nonlinear. Starting with a small number of experimental points, all in the elastic region, Geiger et al. approximated these using a linear function. They evaluated the regression coefficient r2 for the best line fit with the experimental data. Then, they included more points, approximated once again the distribution using a linear function and calculated the value of r2. For the first two points, while the material behaviour was still elastic the value of r2 was unity. With increasing load and considering more experimental points, the value of r2 at first slightly went down but then rose again as the linear fit correlation improved because of the larger amount of fitting data. As loading continued, the value of r2 increased until it reached a maximum. When more points in the plastic region were considered the value of r2 then decreased at a fast rate. The authors report that they obtained a maximum value for r2 for all the specimens that they investigated. They used these maximum values as the points at which to calculate the yield stress.
Anisotropic yield criteria are generally used in applications and simulations involving industrial sheet metal forming. For design purposes such as in the design of pressure vessels, the codes of standards, for example, EN13445 15 and ASME VIII, 16 require the stress analyst to consider material as being free from residual stresses. These standards give the materials and their different grades that can be utilised in pressure vessel design and manufacture. This means that for pressure vessel design the required yield stress, ultimate tensile stress and material constitutive law that would be required would be those obtained from a uniaxial tensile test at the anticipated temperatures.
This paper highlights the difficulties involved in determining the yield stress for a two-dimensional stress field obtained by subjecting a specimen to combined bending and torsion. The uniaxial tensile test was used to determine the uniaxial yield stress or 0.2% proof stress. Experimental analyses indicated that for higher ratios of torsional shear stresses to bending stresses the experimental points did not fit the von Mises and Tresca's isotropic yield criteria. This fact prompted the authors to examine annealing/normalising the specimens and check on whether this resulted in a better correlation with the latter yield criteria especially at higher ratios of torsional shear stresses to bending stresses. The reason for the heat treatment was to achieve isotropic material properties which are fundamental for the von Mises and Tresca's yield criteria. It was not possible to obtain the anisotropic Hosford parameters to be able to correlate yielding with the Hosford's anisotropic criteria 12 – 14 since the available specimen did not permit machining other specimen in the required six different directions.
Determining the yield stress and Young's modulus through the uniaxial tensile test for the as purchased specimens
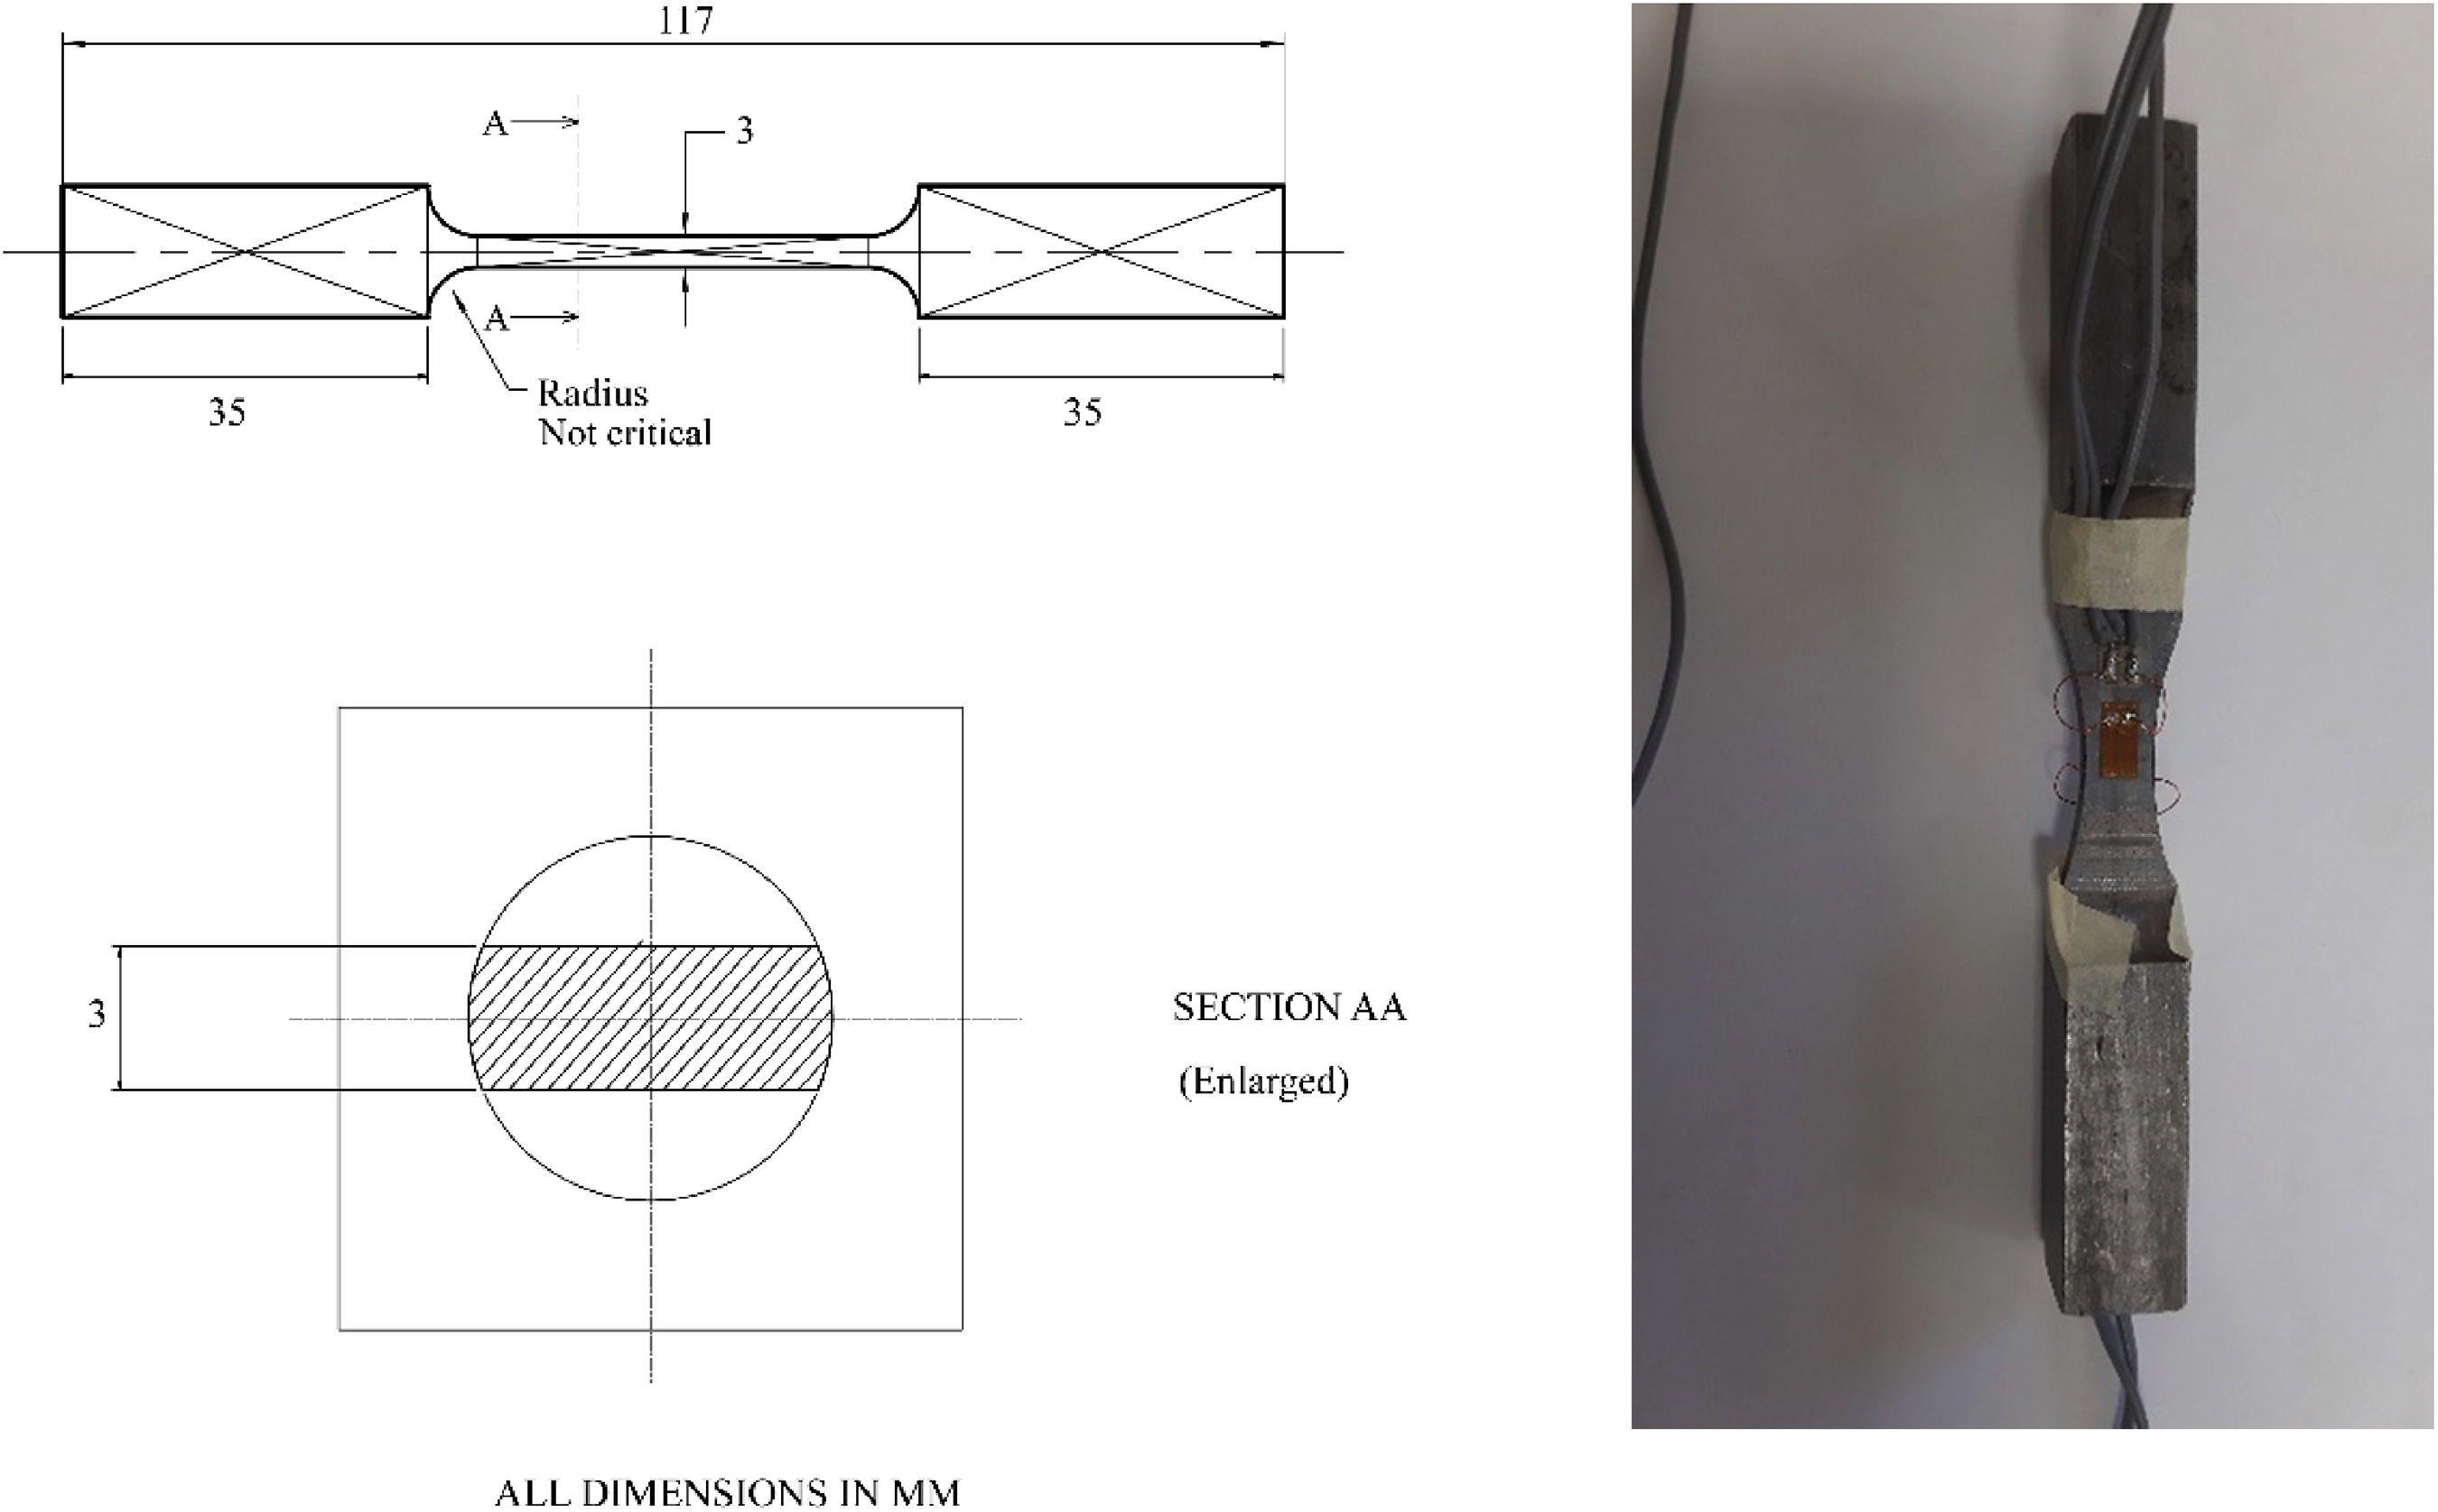
Figure 1 shows the specimen procured from a third party that is used in the combined bending and torsion experiment. The test section has a reduced diameter of 7.62 mm. 1
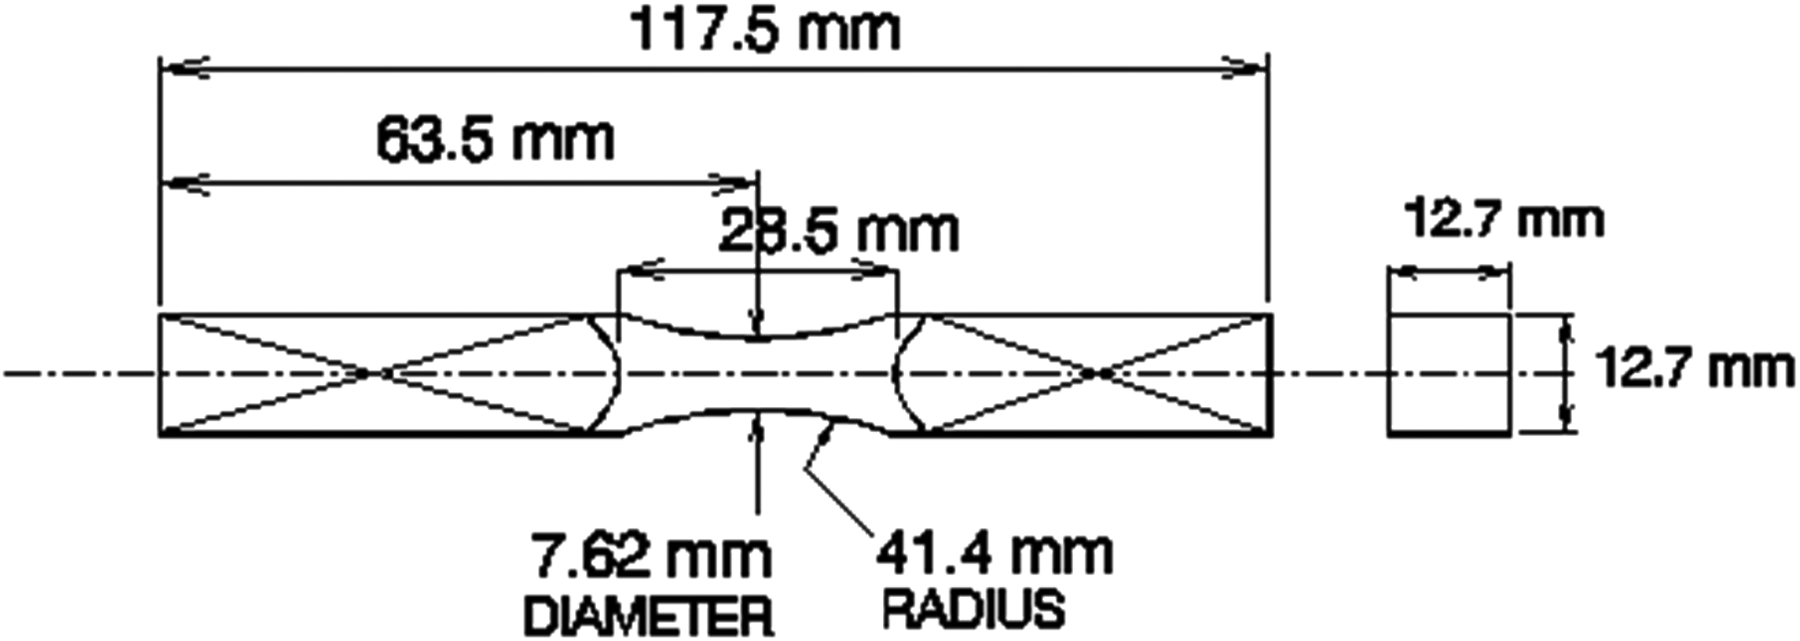
Specimen for the combined bending and torsion experiment.
The uniaxial yield stress of the material of the specimens was determined following ASTM E8. 17 The dimensions of the machined tensile test specimen are shown in Figure 2. Three specimens were tested at a tensile testing machine crosshead speed of 0.54mm/min. This testing speed was based on the reduced section length of 36 mm to correspond to the rate of 0.015 mm/mm/min crosshead speed as per ASTM E8. A clip gauge extensometer was used for the initial part of the test in order to obtain an accurate value for strain and then removed at a strain of 2.5%. Figure 3 shows the specimens before testing, while Figure 4 shows one of the specimens after the test.
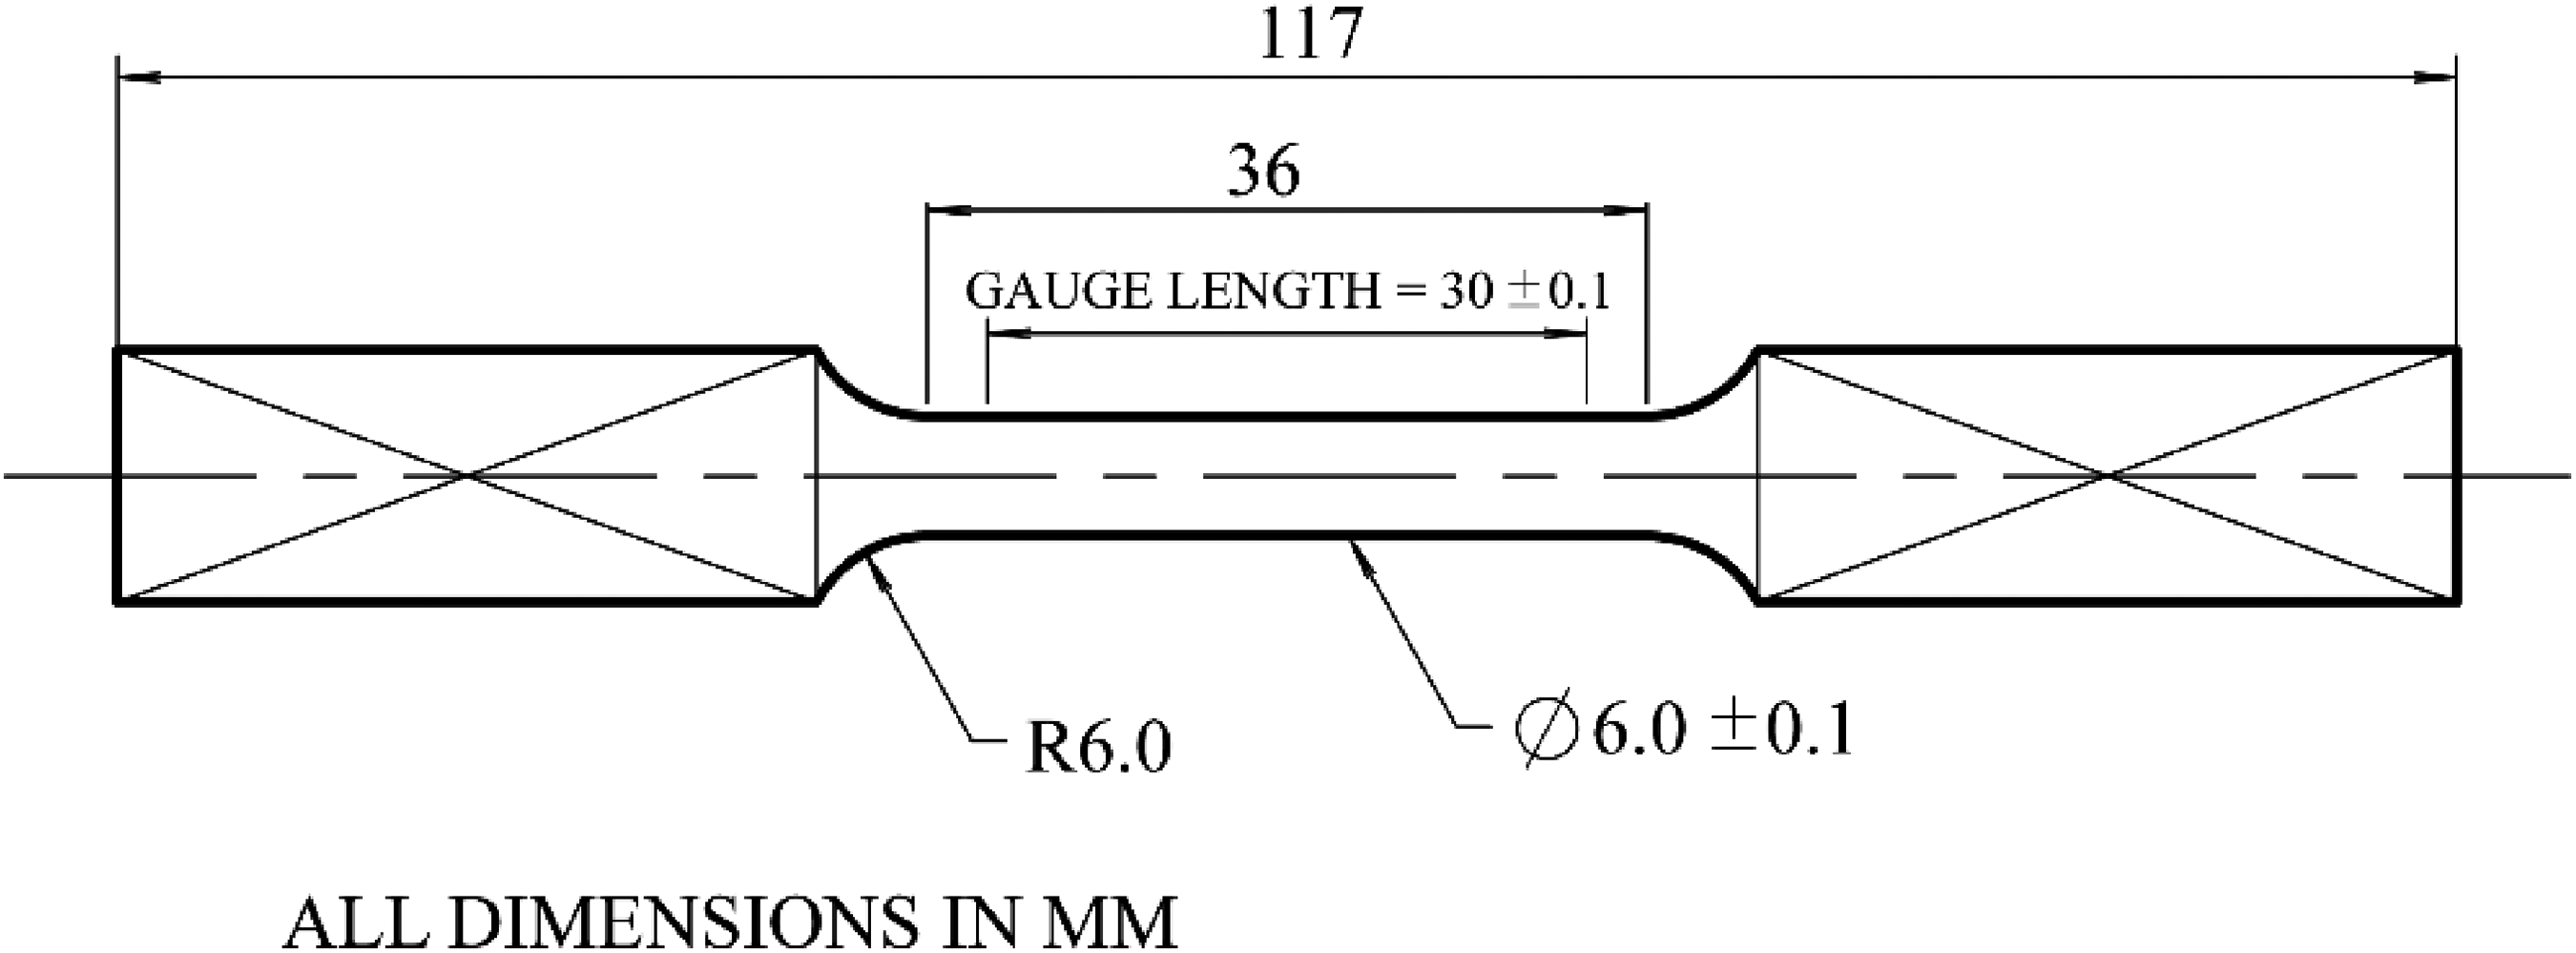
Dimensions of tensile test specimen.
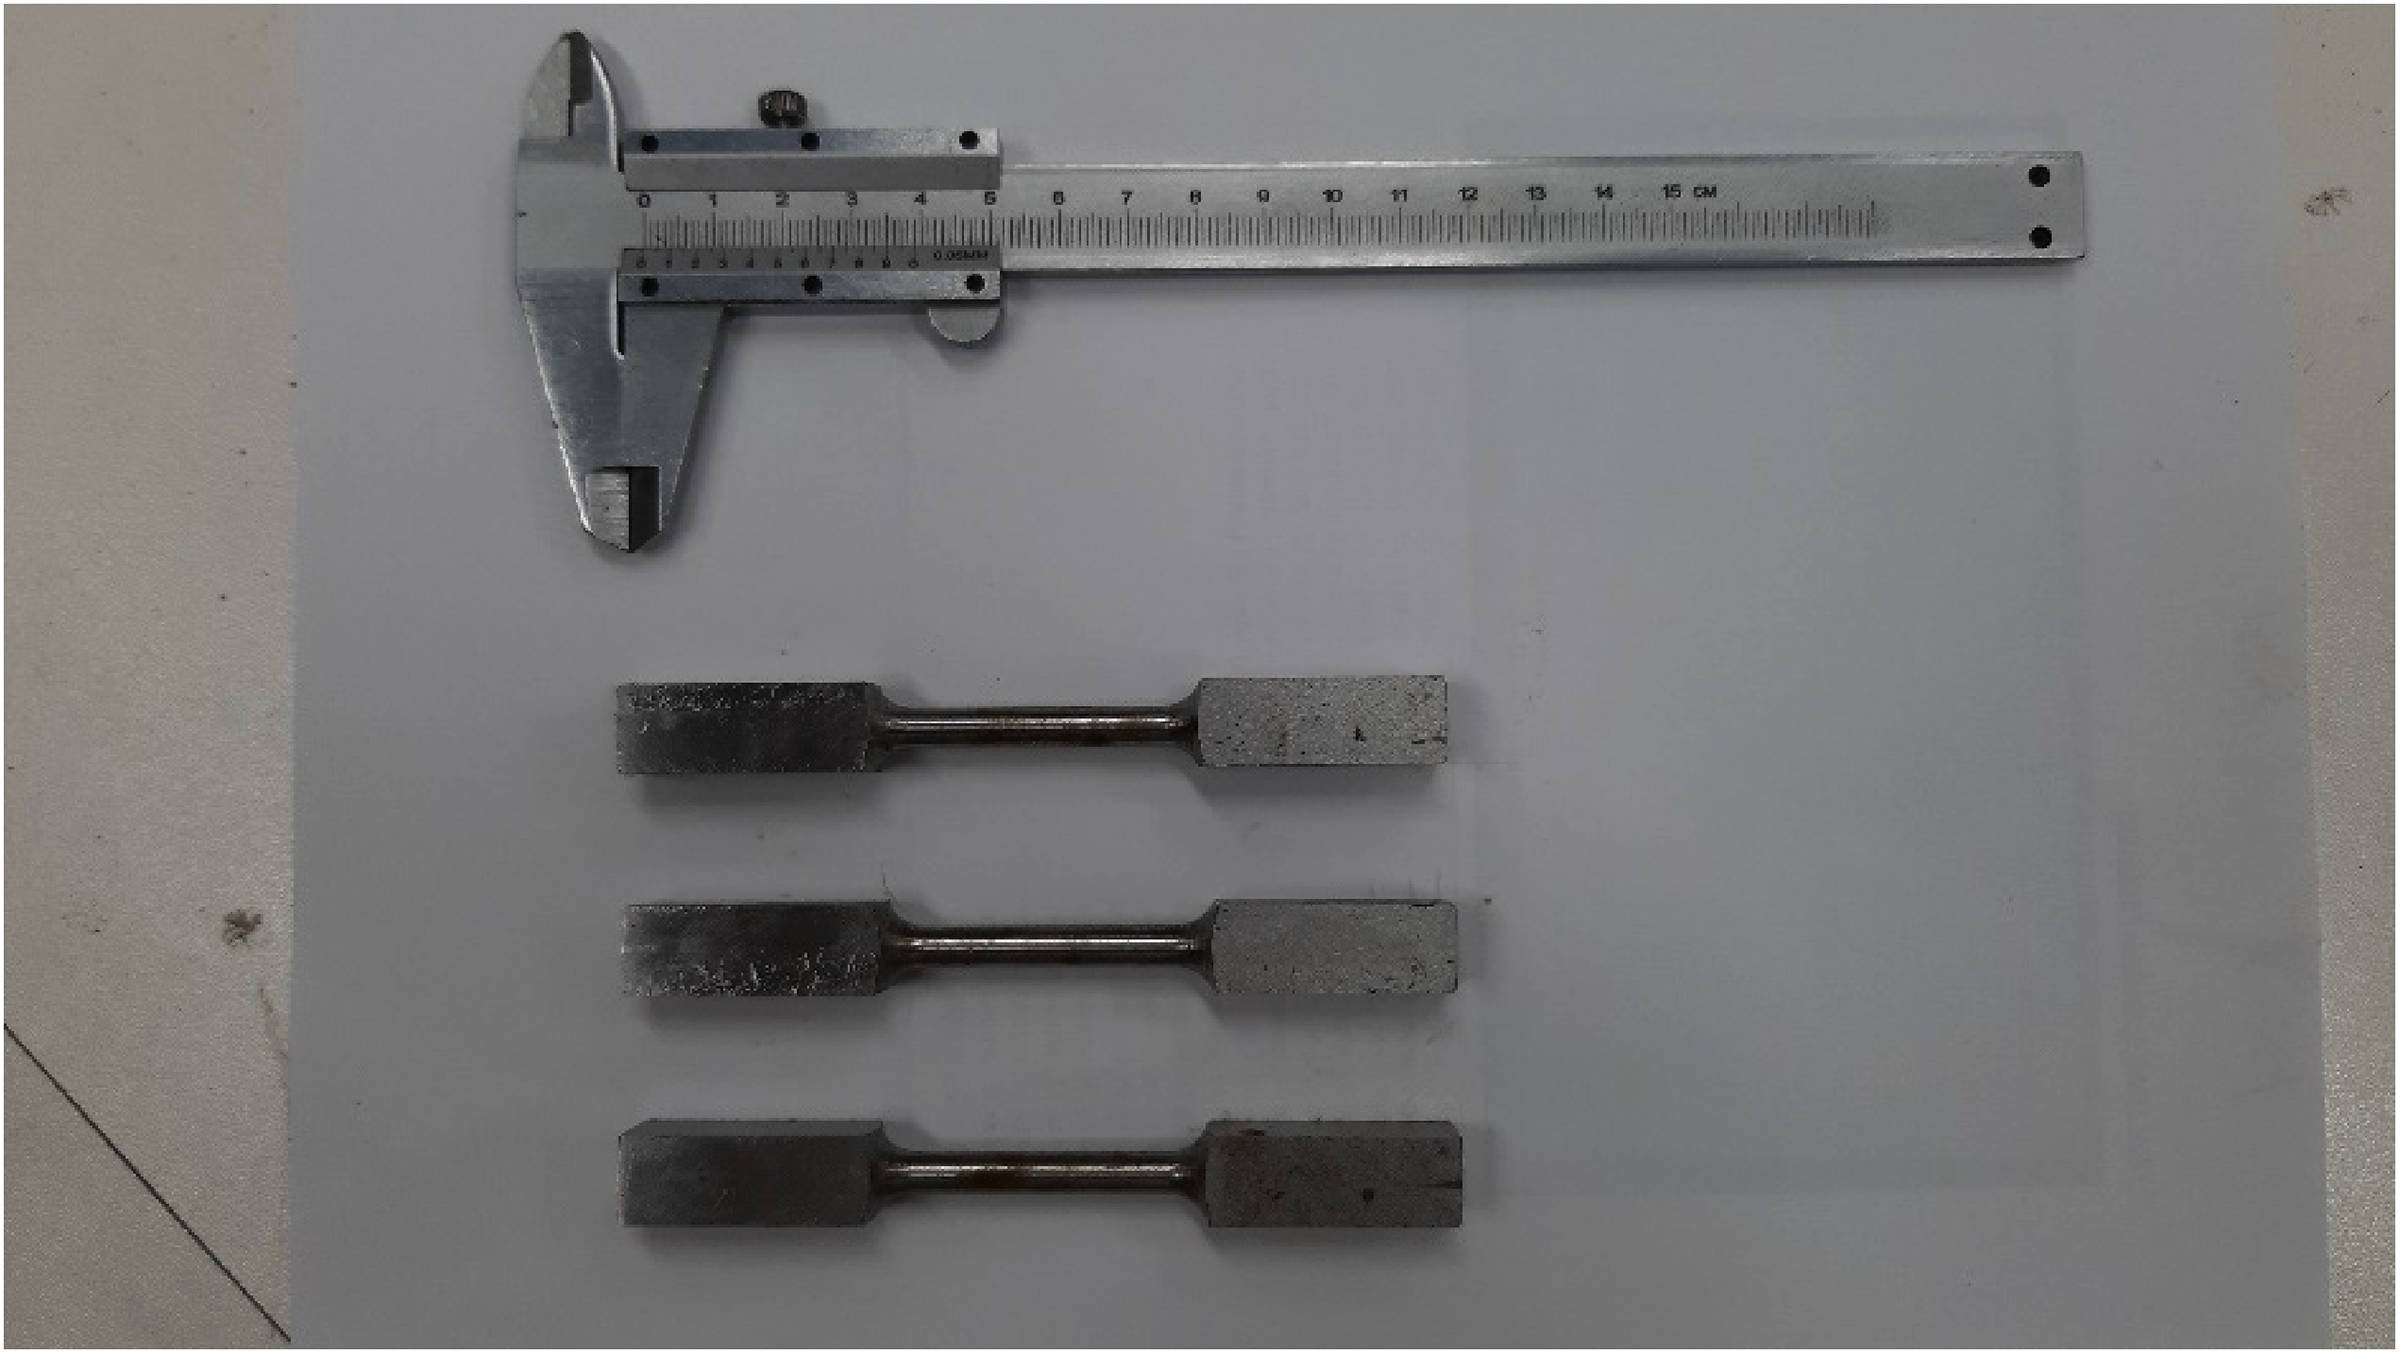
The 3 specimens before being tested in the tensile testing machine.
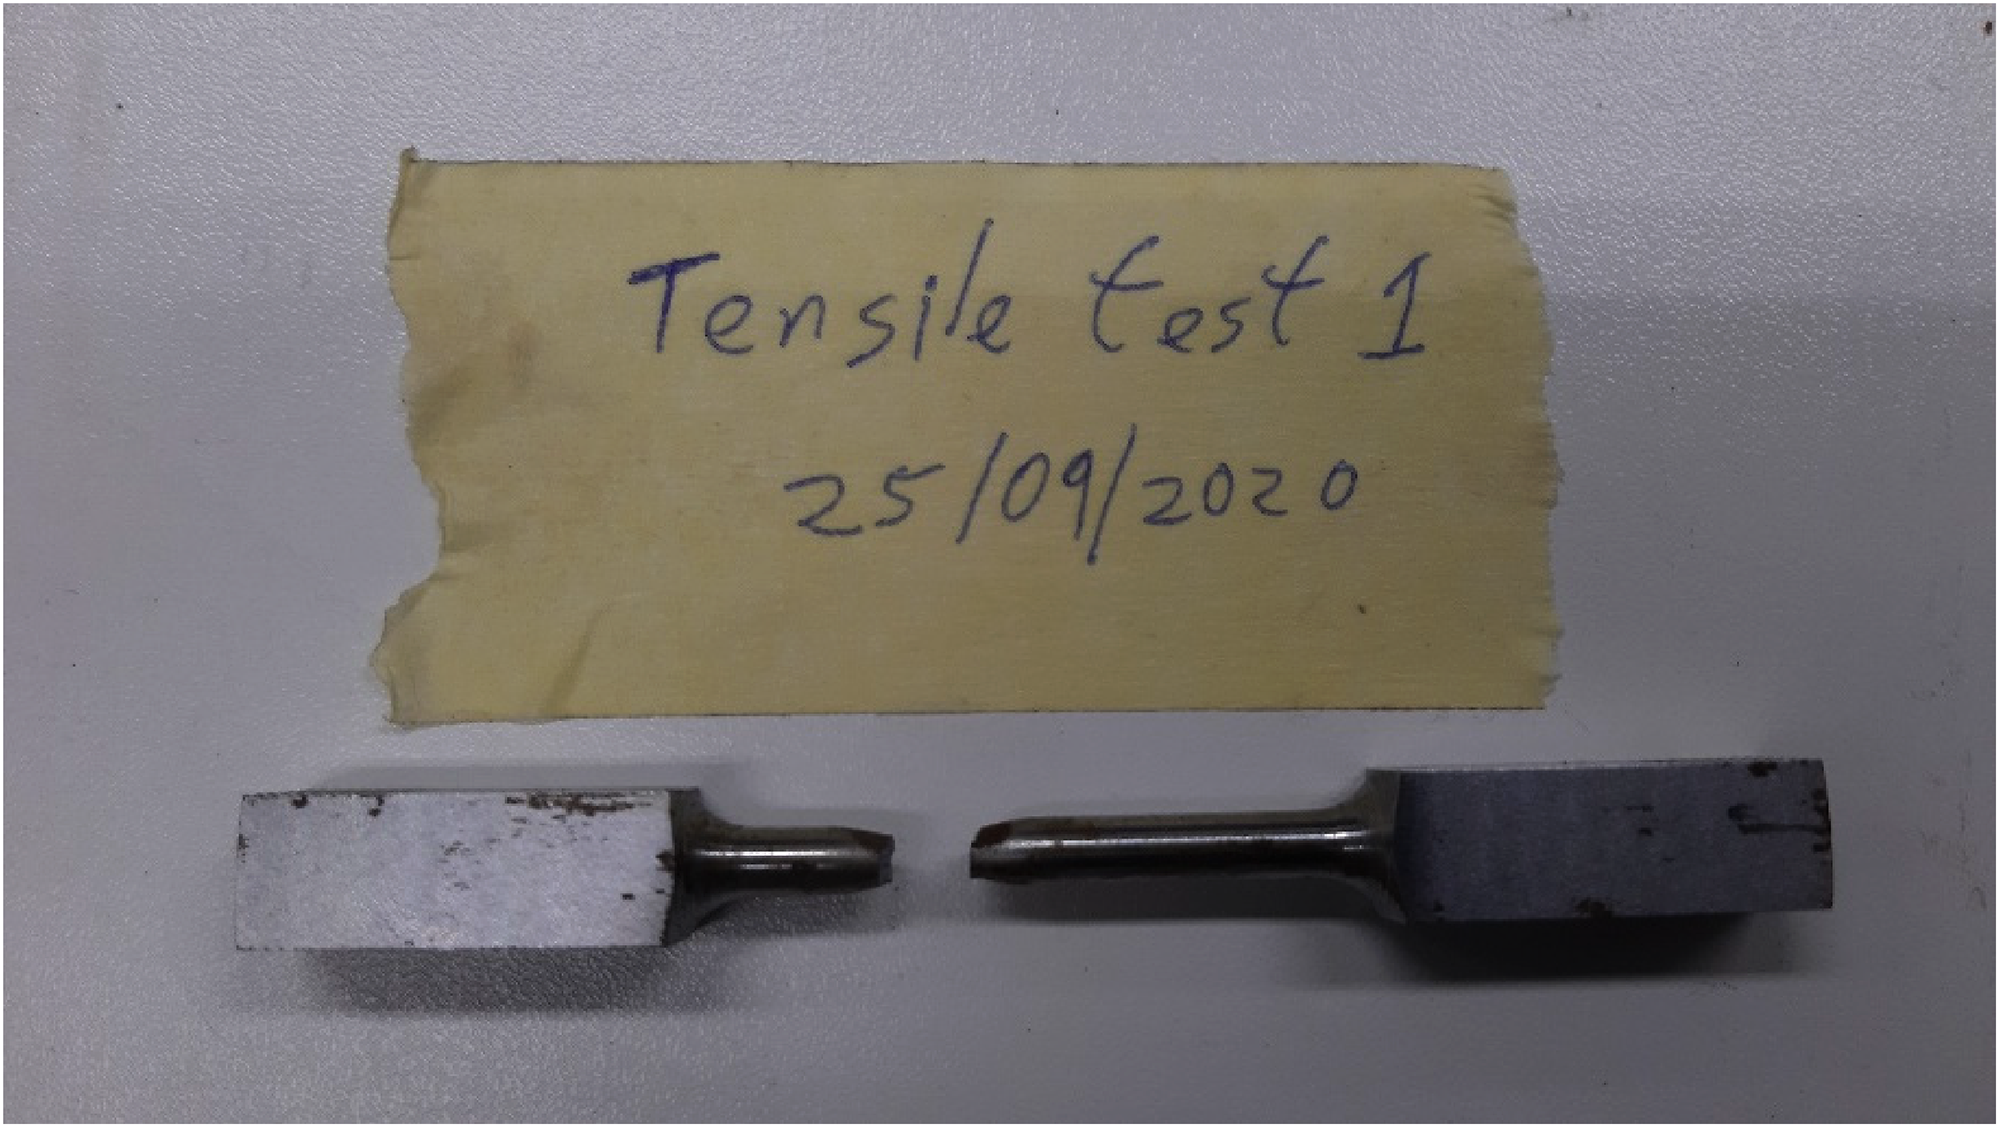
One of the specimens after the tensile test.
Figure 5 shows the engineering stress–strain curve for the as-received specimens and as obtained from the tensile test. The 0.2% and 1% proof stress were used to determine the yield stress. A comparison between the two yield stress definitions could then be made. The test gave a 0.2% proof stress value of 596.55MPa and a 1% proof stress of 608.69MPa. The values differ only by 2%. The 0.2% proof stress was used as the material yield stress in this paper. It must be noted that the resulting yield stress has a value of more than twice that of structural A36 steel and its ultimate tensile strength is about one and a half times that of structural steel. It must be said that the resulting yield stress is quite high and is almost equal to the material's ultimate tensile strength. This could indicate that the material stock was extensively cold-worked through metal drawing before being machined. The tensile test also revealed a ductility of approximately 5.9% strain.
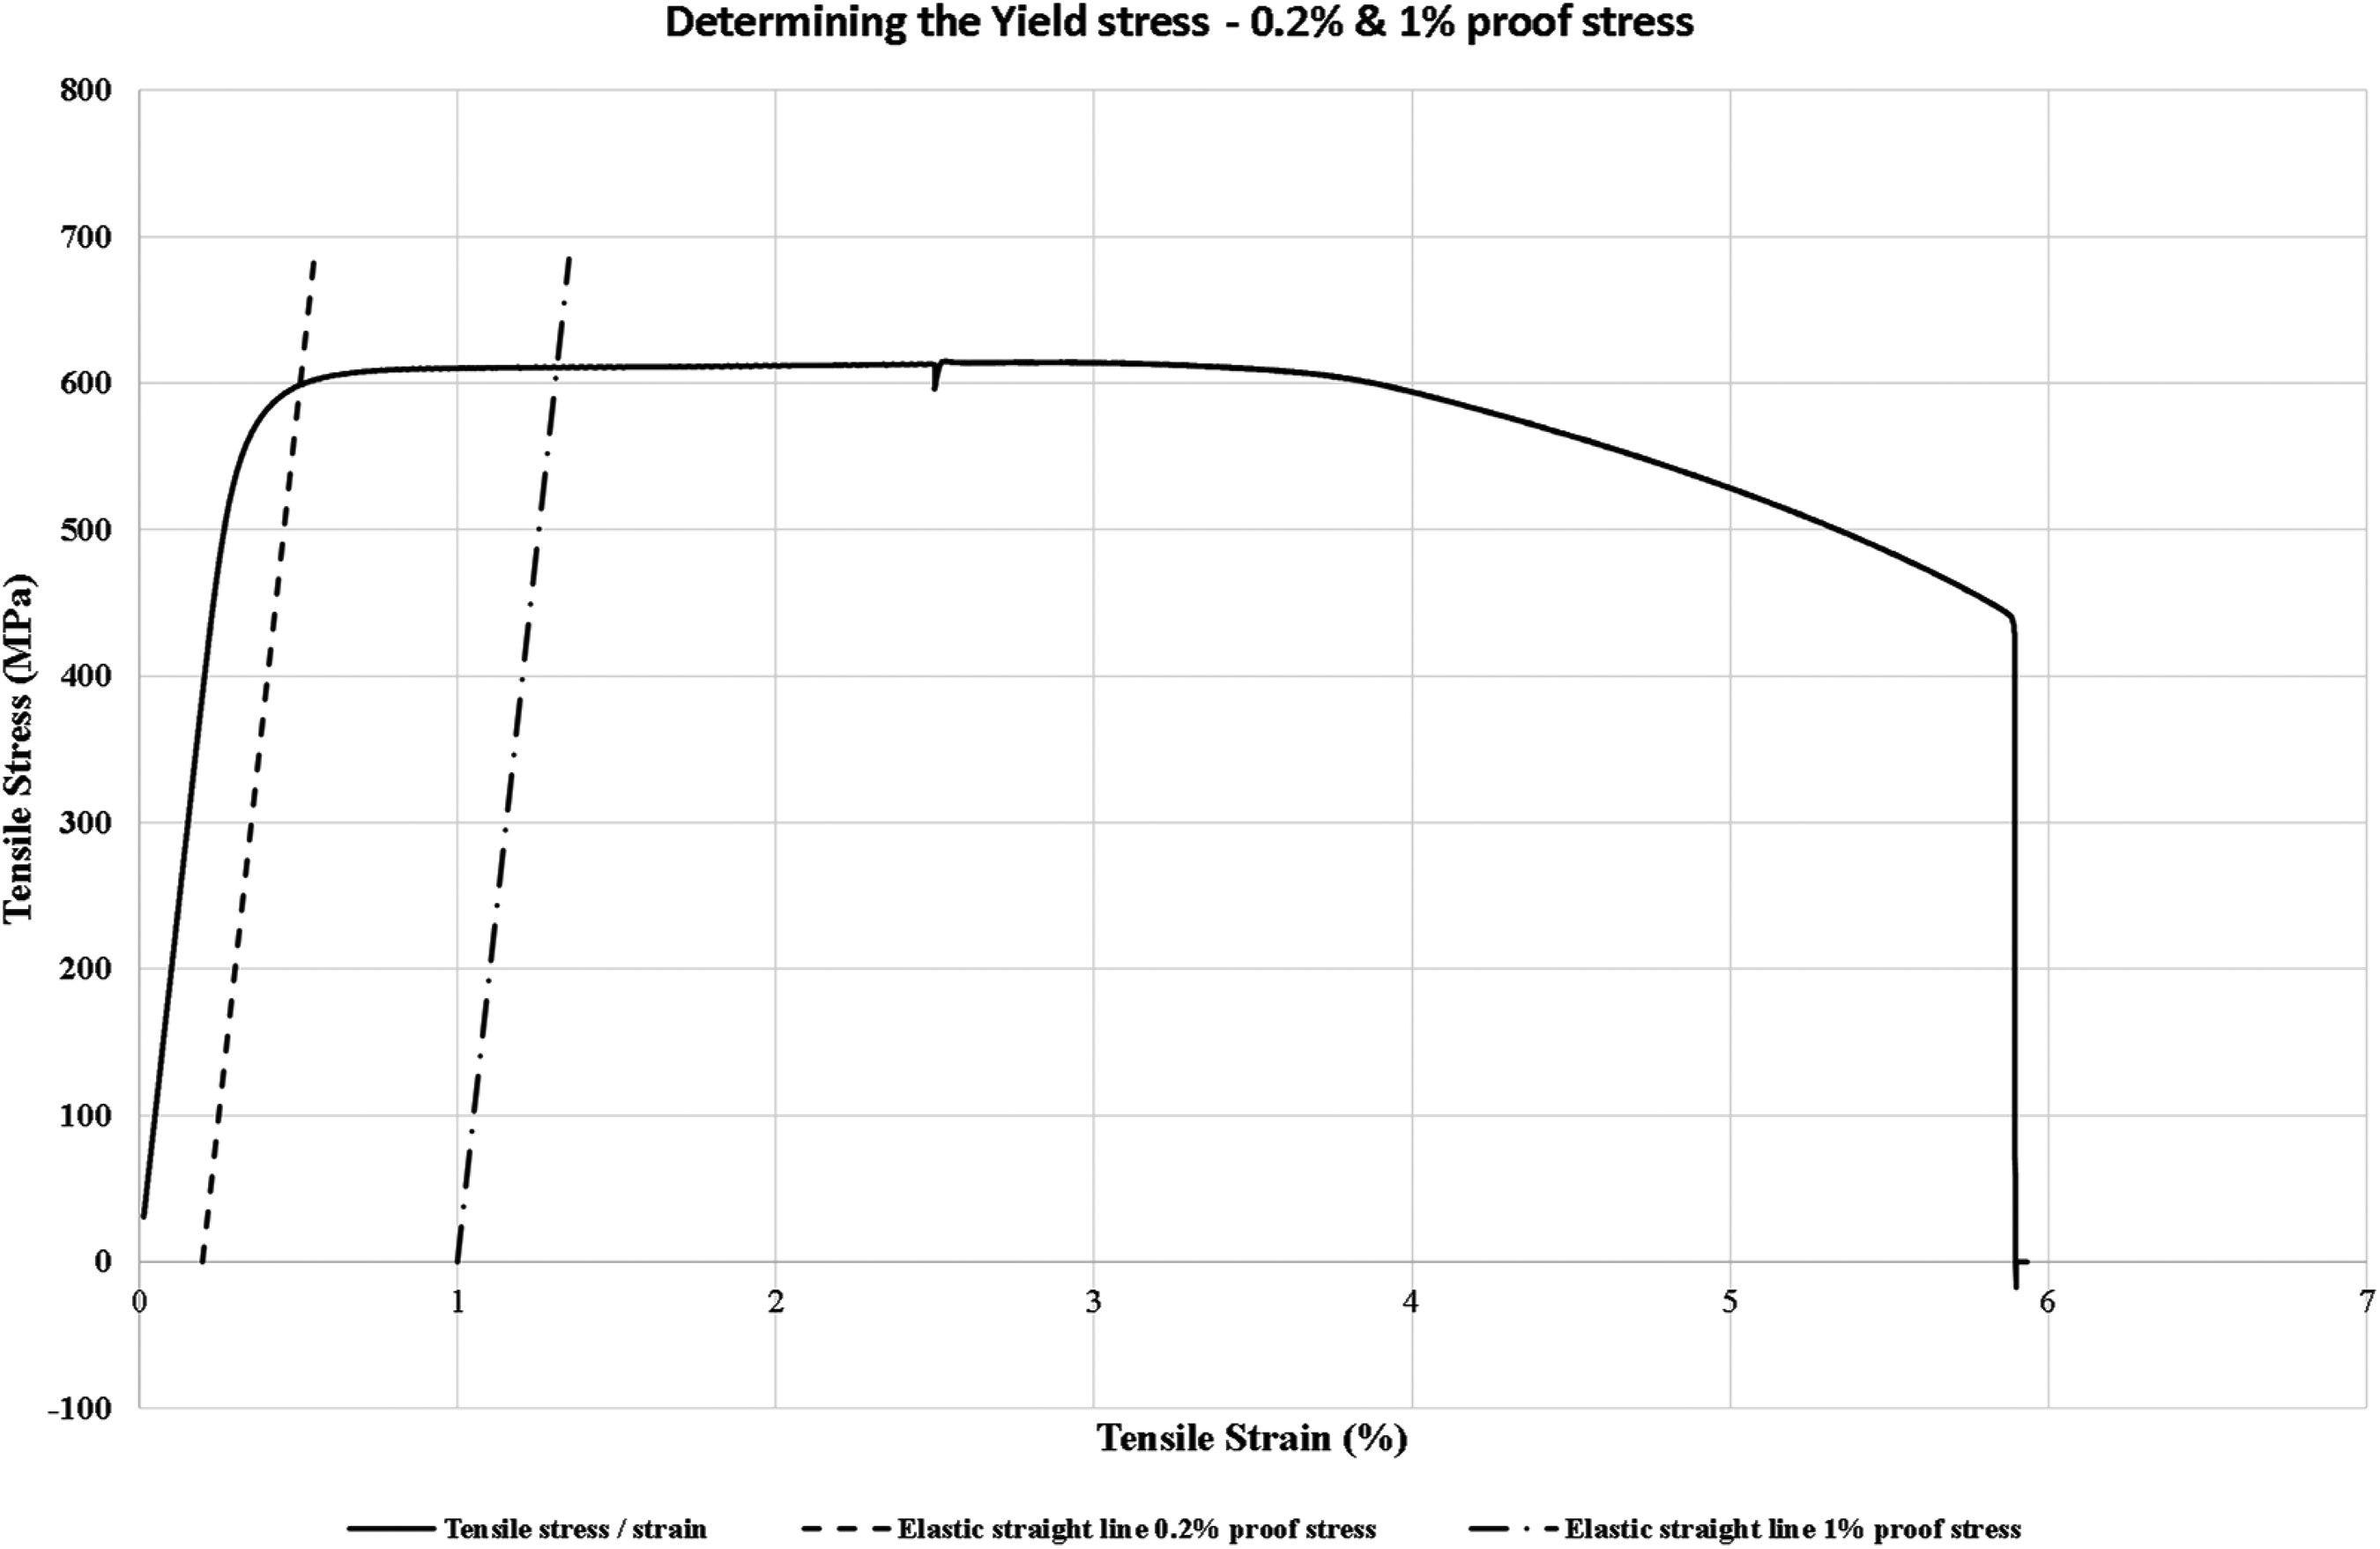
The engineering stress–strain curve for the material of the as-purchased specimens.
The Young's modulus of the specimen was also found through uniaxial tensile testing at a crosshead speed of 0.3mm/min. For higher accuracy, the strain was recorded by using a strain gauge fixed to the flat part of a specimen machined in a slightly different way. 17 Figure 6 shows the specimen used for this purpose. The resulting Young's modulus value was 194GPa which is typical for steel material.
Specimen for determining the Young's modulus of the material of the specimens.
Predicting the yield surface for a two-dimensional stress system – The combined bending and torsion experiment
In the combined bending and torsion experiment, a two-dimensional (2D) stress field is created at the specimen test section. The specimen is subjected to different ratios of bending and torsion and the 2D yield locus at the circular test section can be determined experimentally. The specimen is loaded using dead weights in cantilever mode through a loading arm which can be set at different angles with respect to the longitudinal axis of the specimen. The relative angle between the specimen and the loading arm defines the ratio between the bending and torsional loads. In the experiment, corresponding values of load and deflection are recorded for seven different bending and torque ratios including pure bending and pure torsion. The vertical deflection is measured at the loaded end of the loading arm using a dial test indicator.
In the original experimental procedure, yielding is determined to be the point at which the load–deflection curve deviates from linearity. 1 This first method considers drawing a tangent line to the elastic part of the load–deflection curve, with yield being detected when the curve deviates from the elastic line indicating material nonlinearity. The deflections permitted by the apparatus are considered to be small. The method is very similar to that described by Naghdi et al., 3 Philips 4 and Hahner et al. 8
The second method to determine the 2D yield point considered in this paper uses unloading for each load increment and checking for residual deflections of the loading arm. Residual deflections on unloading indicate the onset of plasticity at the specimen's test section.
Figure 7 shows the load–deflection curve for the relative loading arm and specimen angle of 0°. The corresponding load/unload values used to detect any permanent deformation indicating material yielding are also shown in the latter figure.
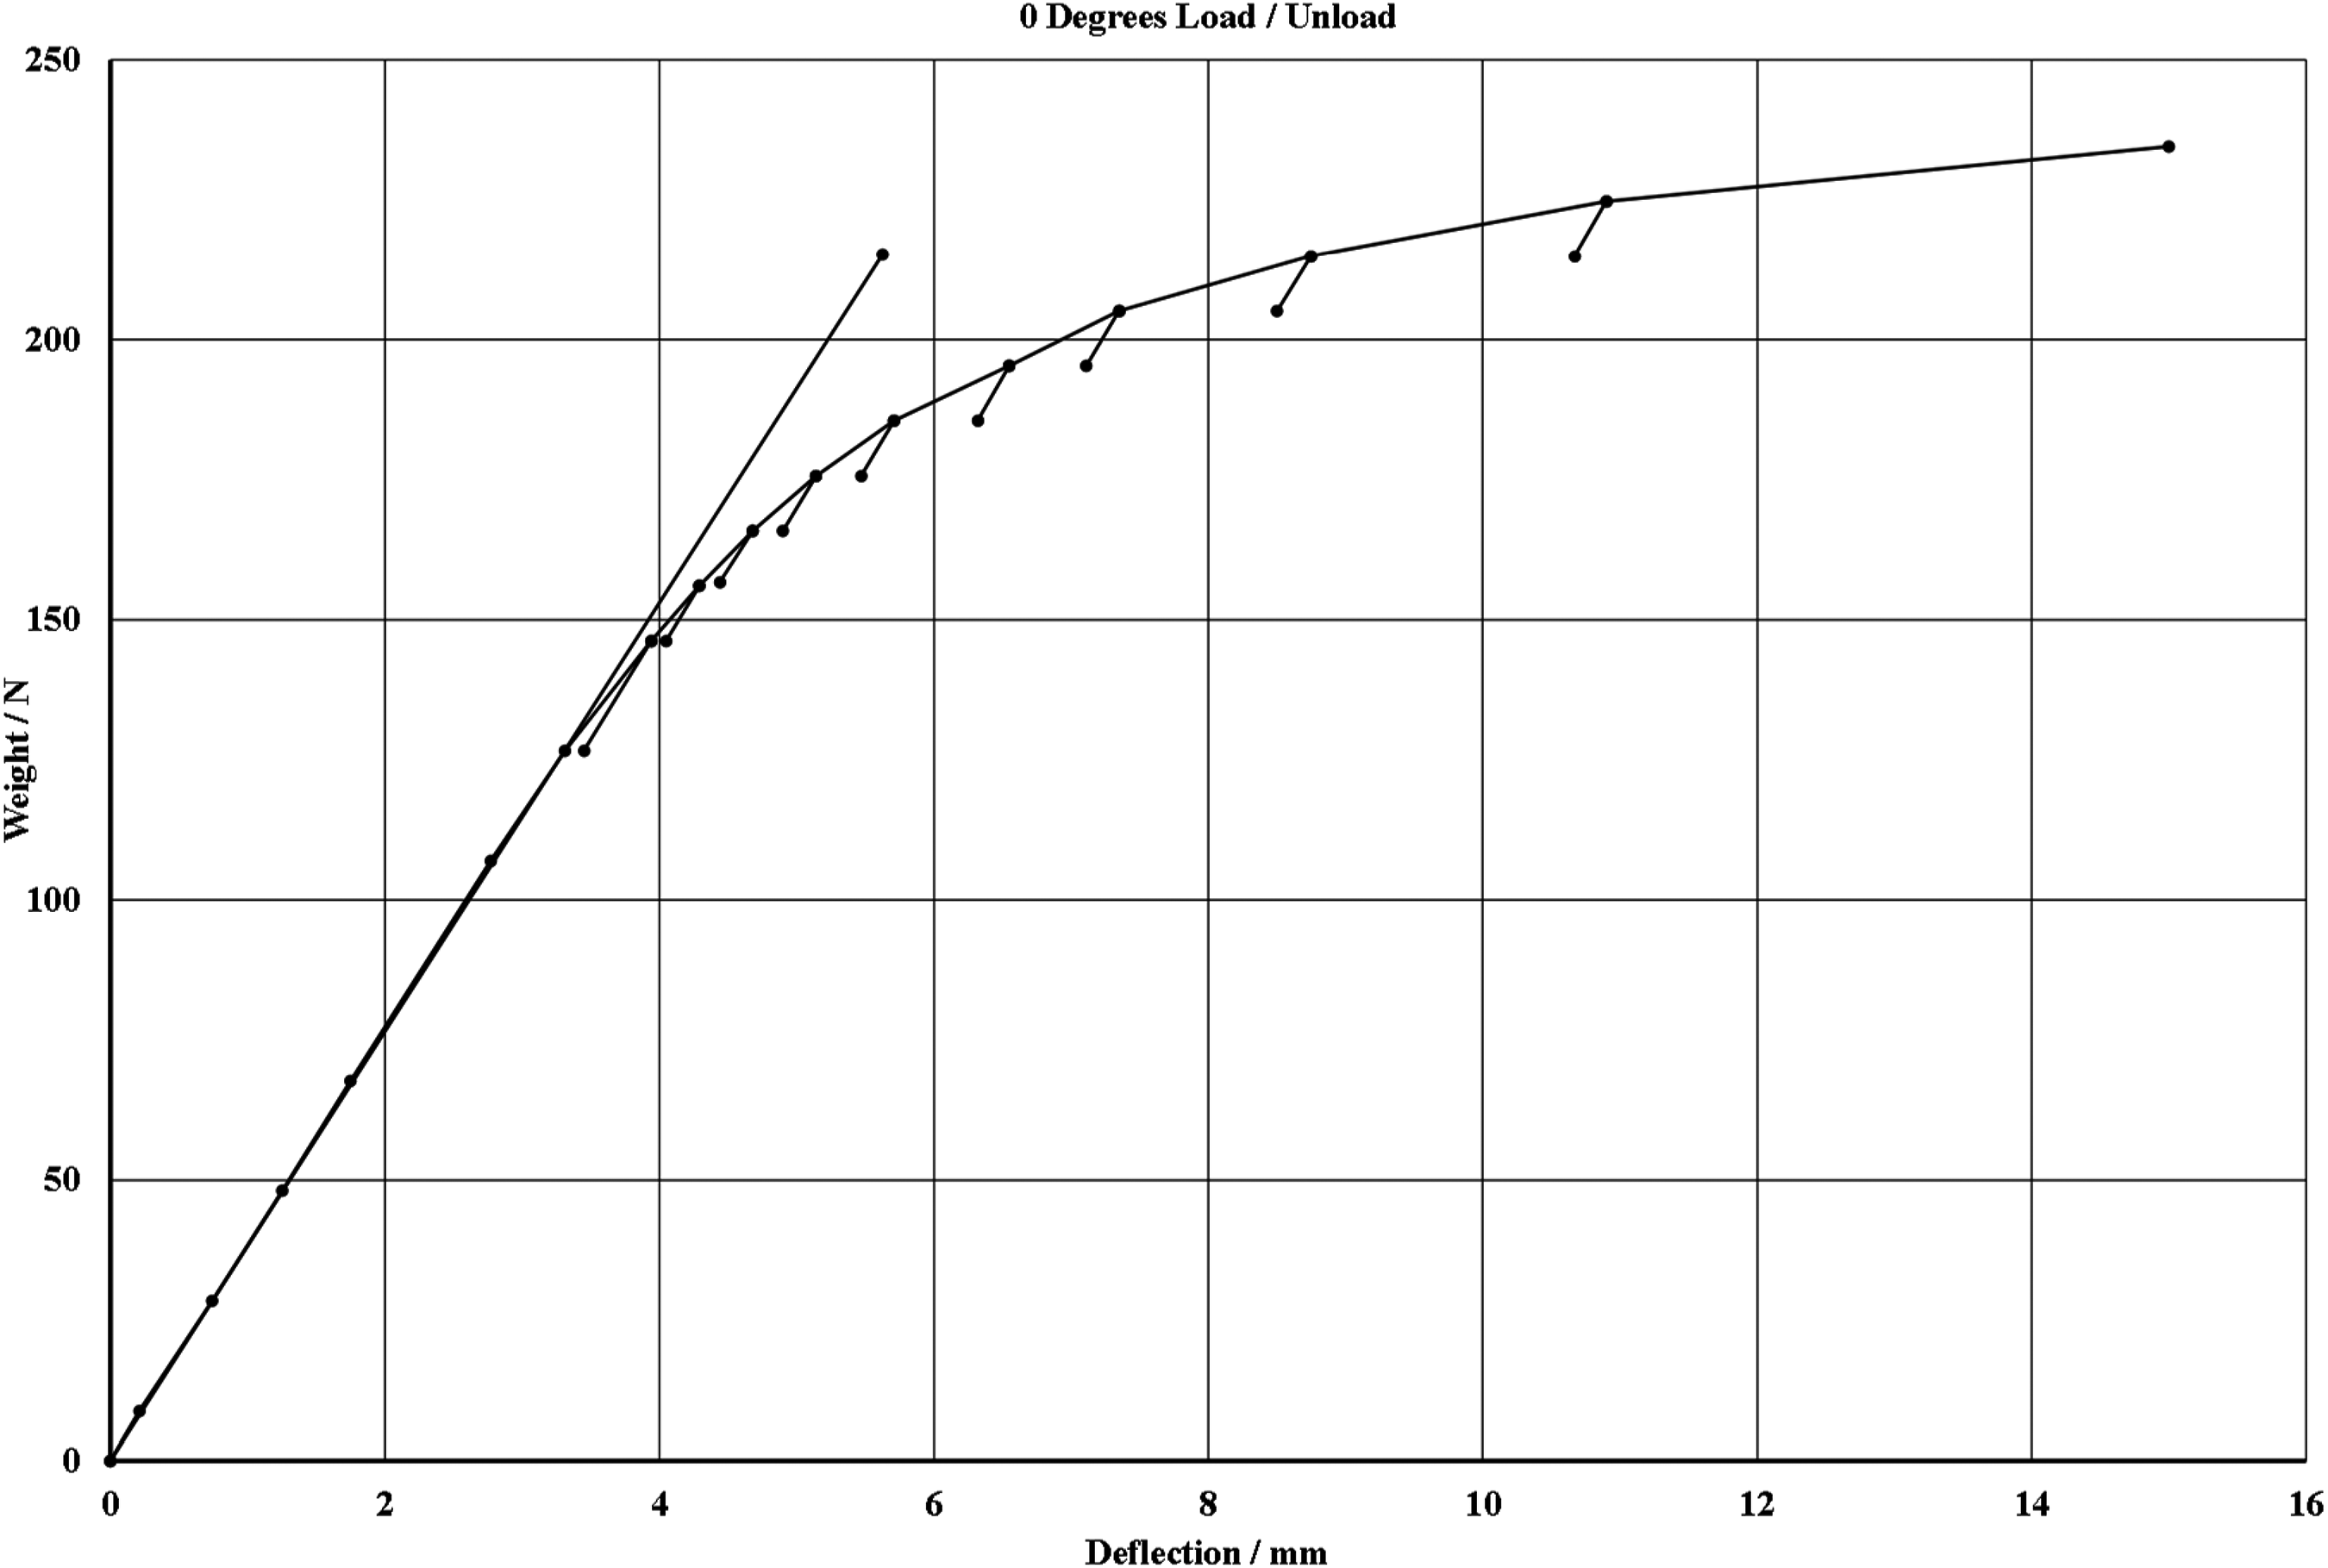
Load vs. Deflection graph for 0° angle (pure bending). Curve deviated from linearity at a load of 128.76N.
The third method used to determine the 2D yield point is based on Geiger's work 14 and calculates the r2 values for a straight line fit for an increasing number of experimentally derived corresponding load deflection values. The r2 value is the coefficient of determination and is a measure of the amount of error in the straight line fit. The r2 value has a value of unity for the first two points but then starts to change as more experimental points are added. Plasticity is detected when the value of r2 peaks and then starts dropping in value. Figure 8 gives the r2 – Deflection curves for the relative loading arm and specimen angle of 0°.
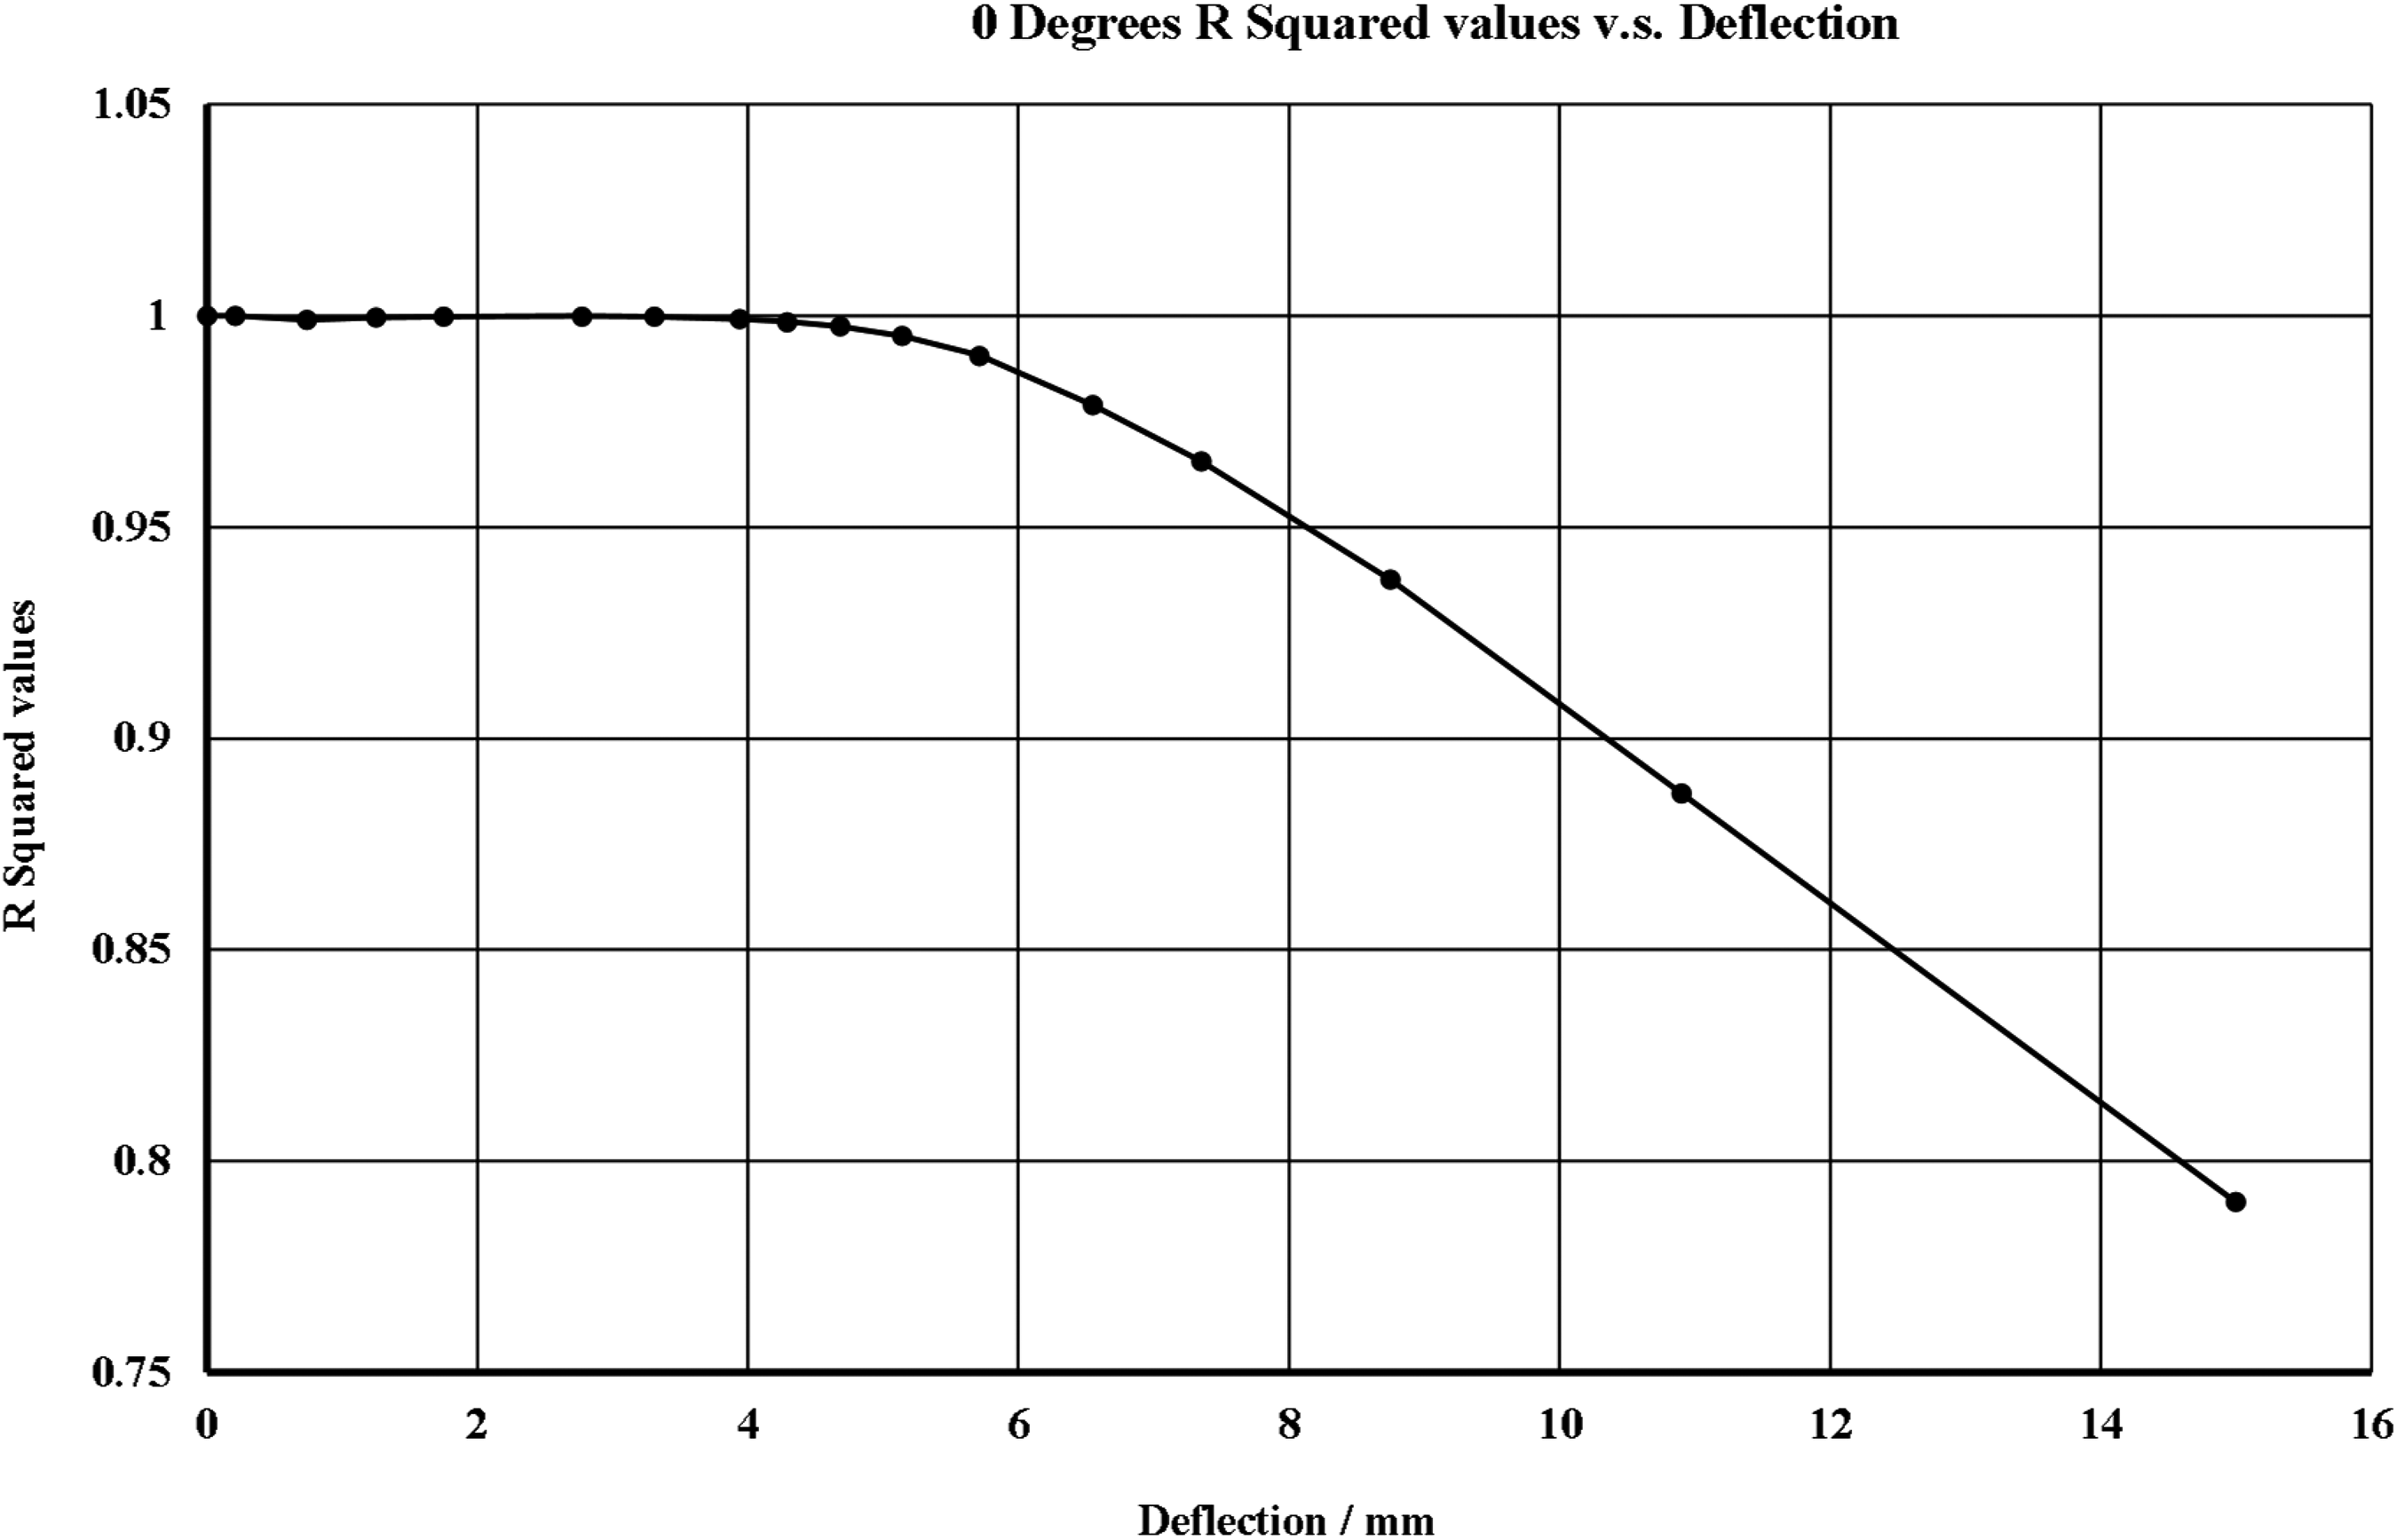
R squared vs. Deflection graph for 0° angle (pure bending). Yield detected at a load of 128.75N.
The fourth method utilised in this paper was based on Janca's energy method. 9 This method was considered but then rejected as not being an appropriate method for the combined bending and torsion experiment considered in this paper. As the load was increased, the ratio of the area under the load–deflection curve and the complementary area above the curve was calculated using the trapezium rule. Initially, during the elastic response part, the ratio is equal to unity but on the onset of plasticity its value increases above one. Compared with the other three methods discussed above, this energy-based method was returning low values for the yield locus. This was attributed to the fact that the method is highly dependent on load increments. Smaller load increments may result in a gradual increase from unity in the area ratios resulting in a better prediction for yield in the 2D plane. The larger load increments were causing the area ratios to rise above one before the onset of non-linearity in the load–deflection curves. Figure 9 shows the variation of the area ratio with increasing loading arm tip deflection for the relative loading arm and specimen angle of 0°. Table 1 shows the loads at which plasticity was detected using the different methods for the as-received specimens.
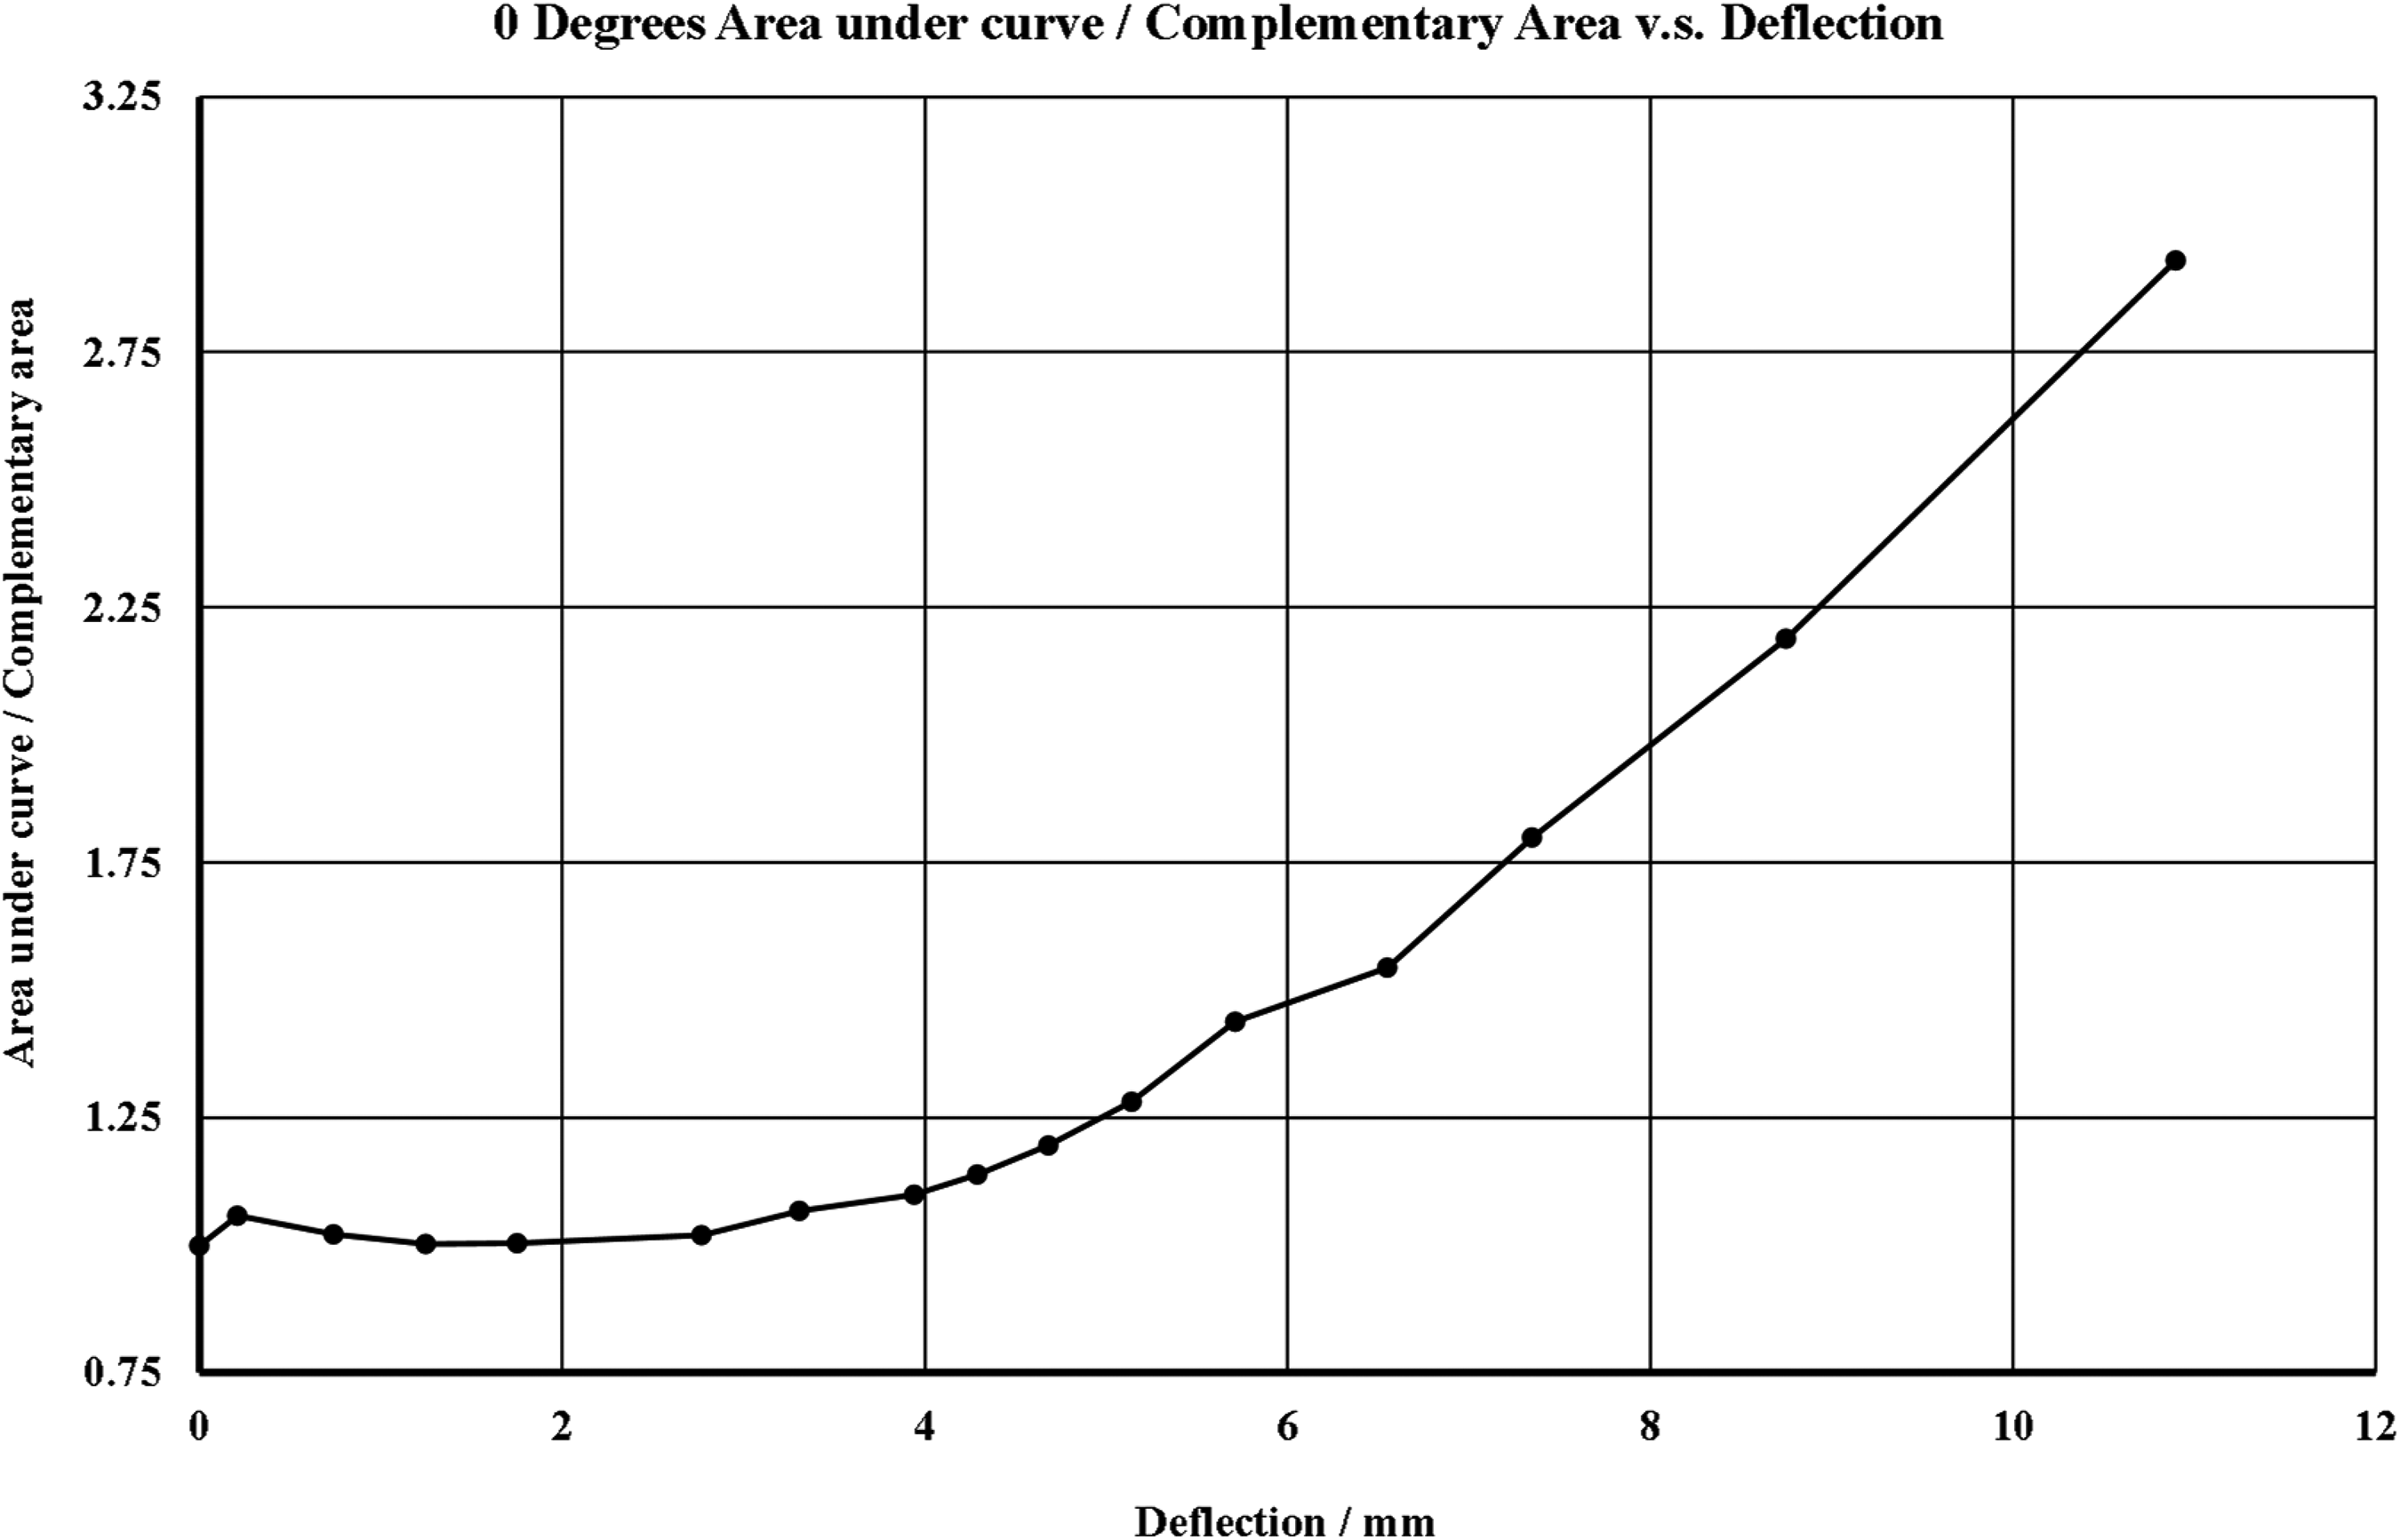
Area under the curve method for 0° angle (pure bending). Yield detected at a load of 69.74N.
Loads at which plasticity was detected using the different methods for the as-purchased specimens.
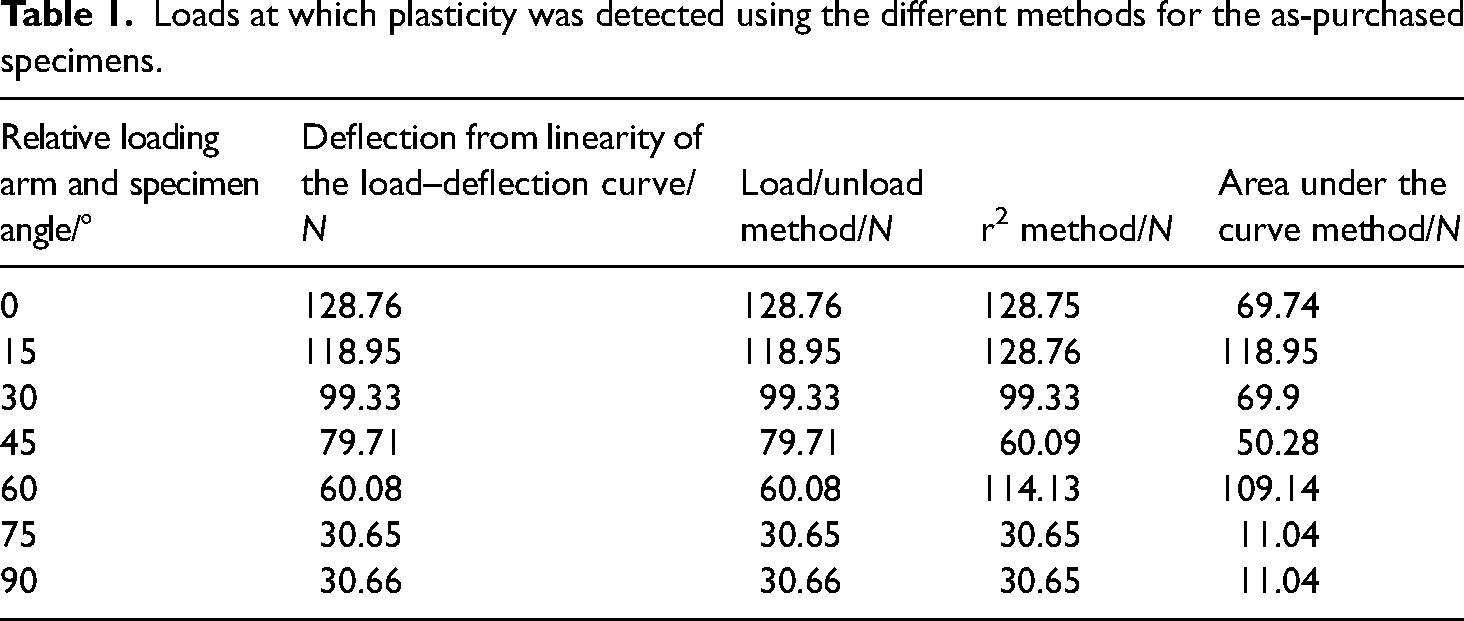
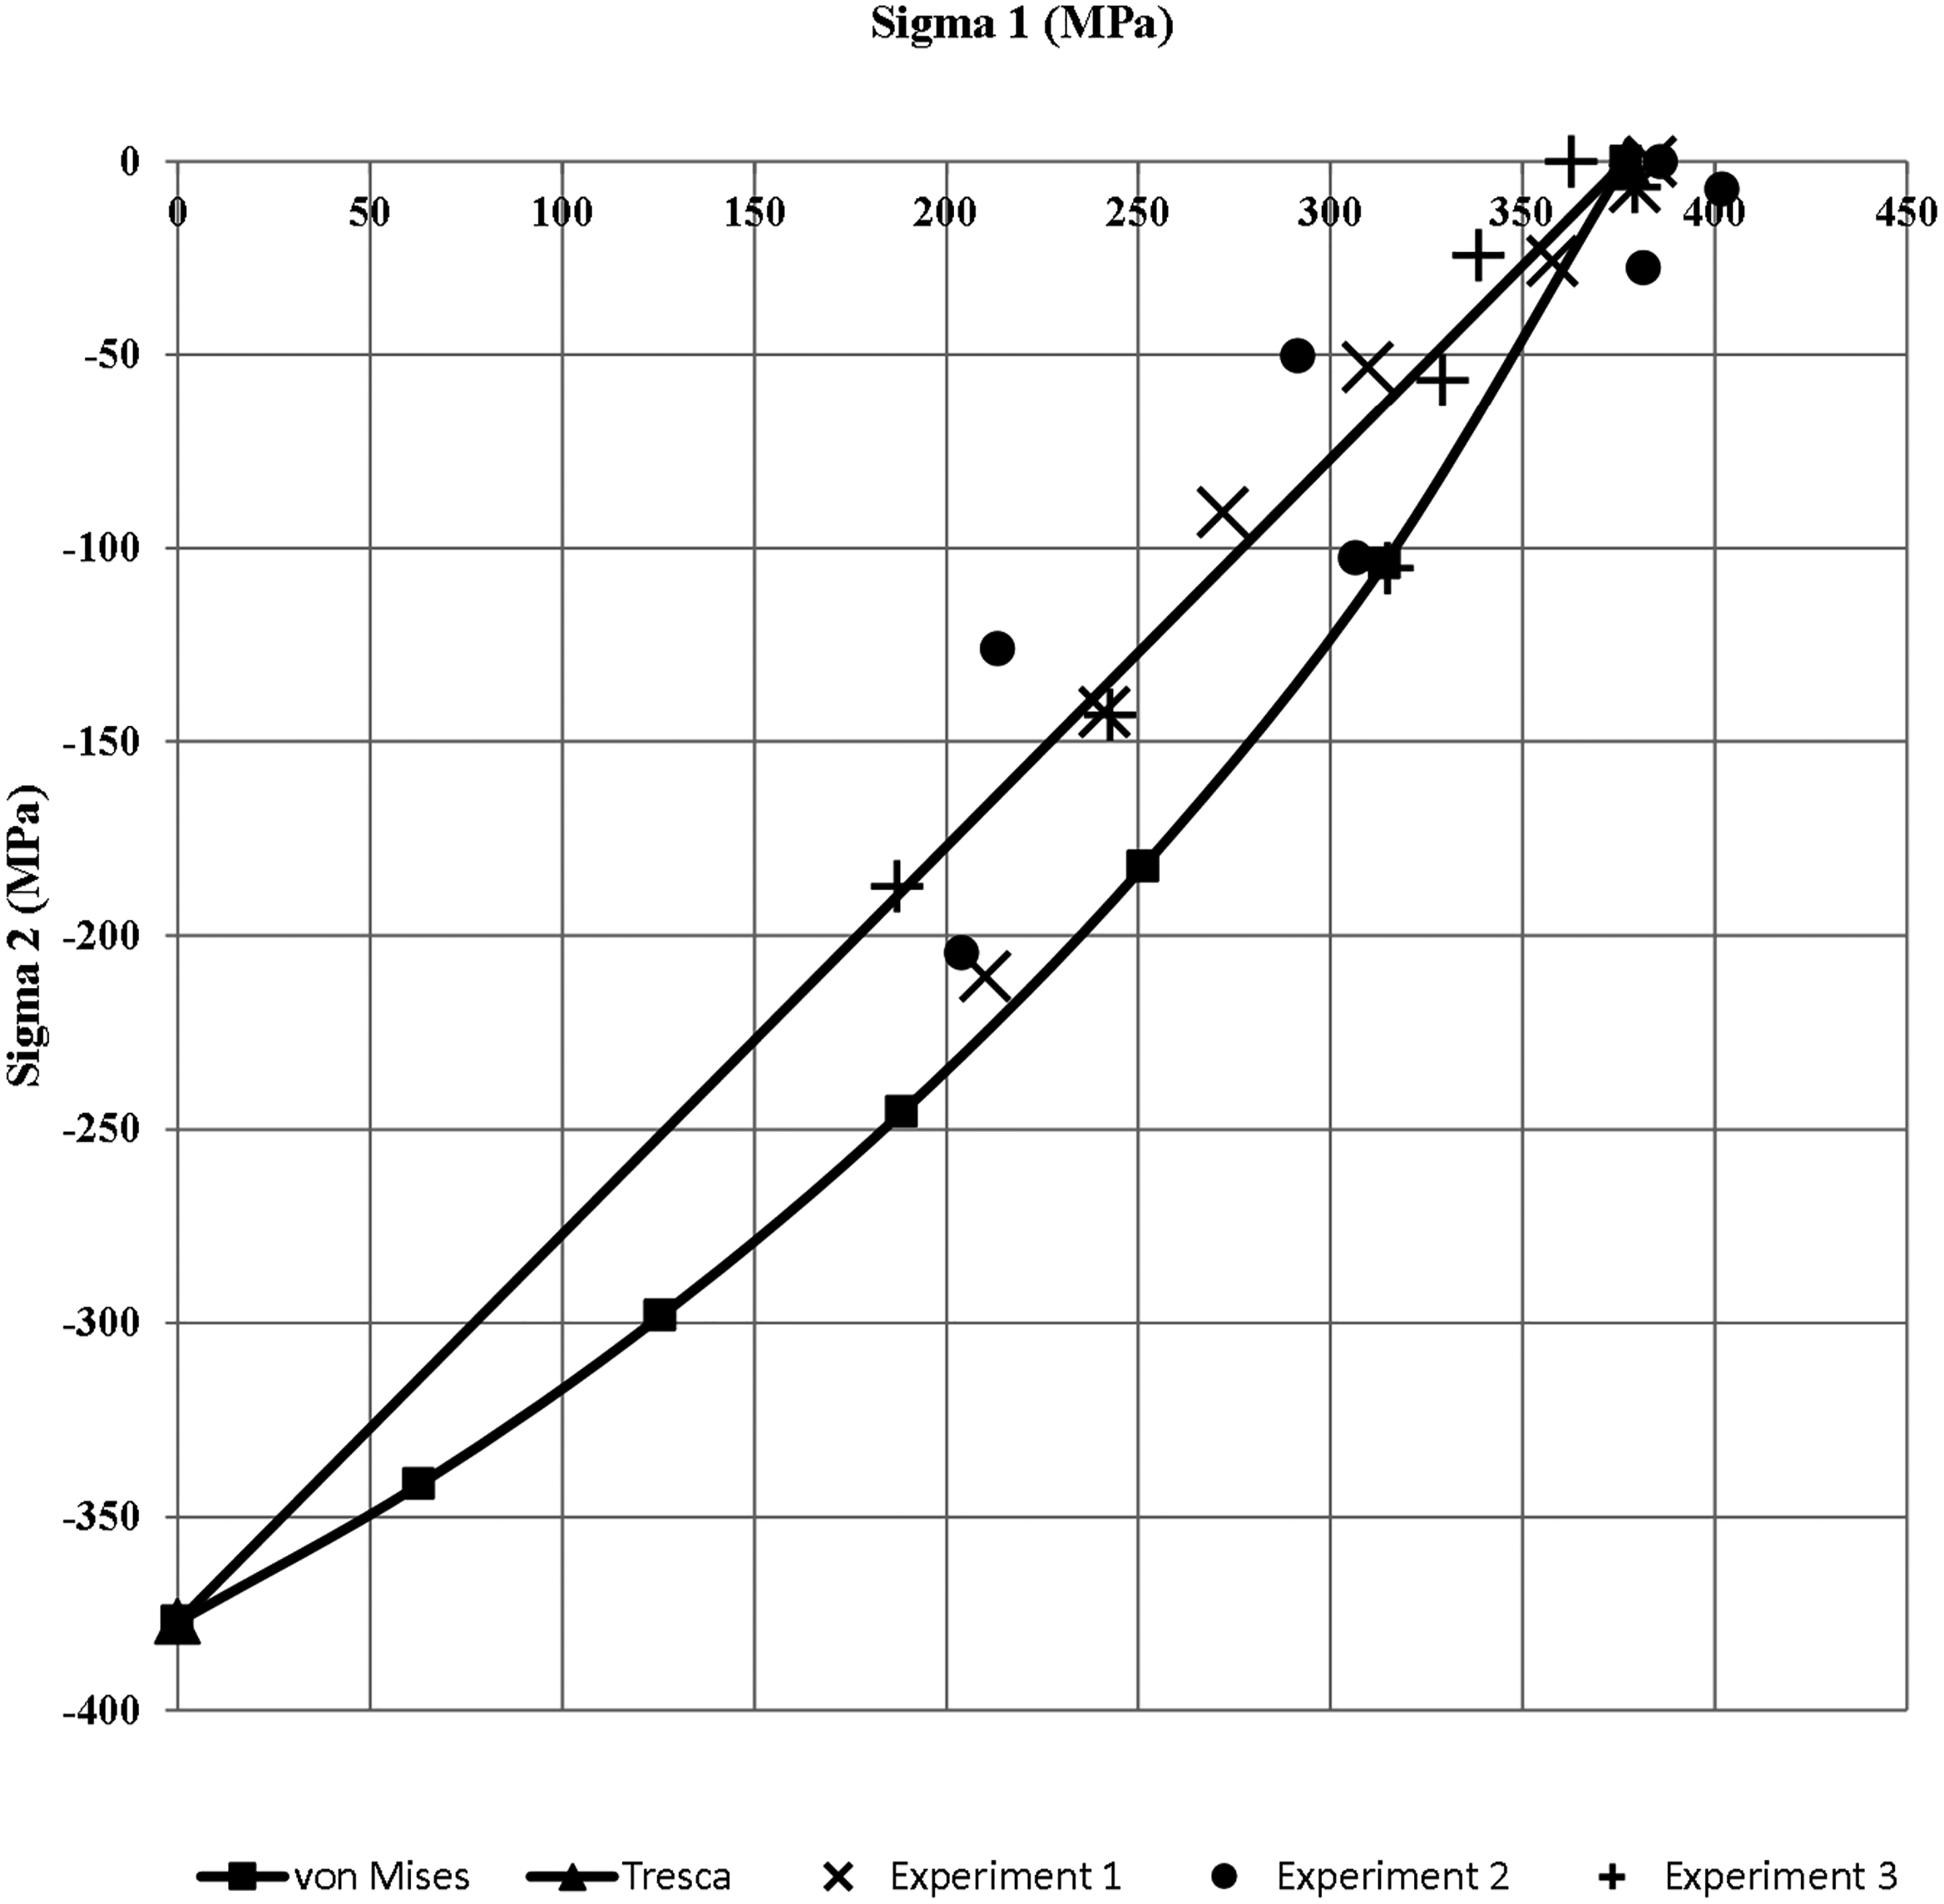
Figure 10 shows the two principal stresses at yield for each loading arm angle superimposed on a plot of the von Mises and Tresca yield loci based on the uniaxial yield stress (0.2% proof stress of 596.55 MPa).
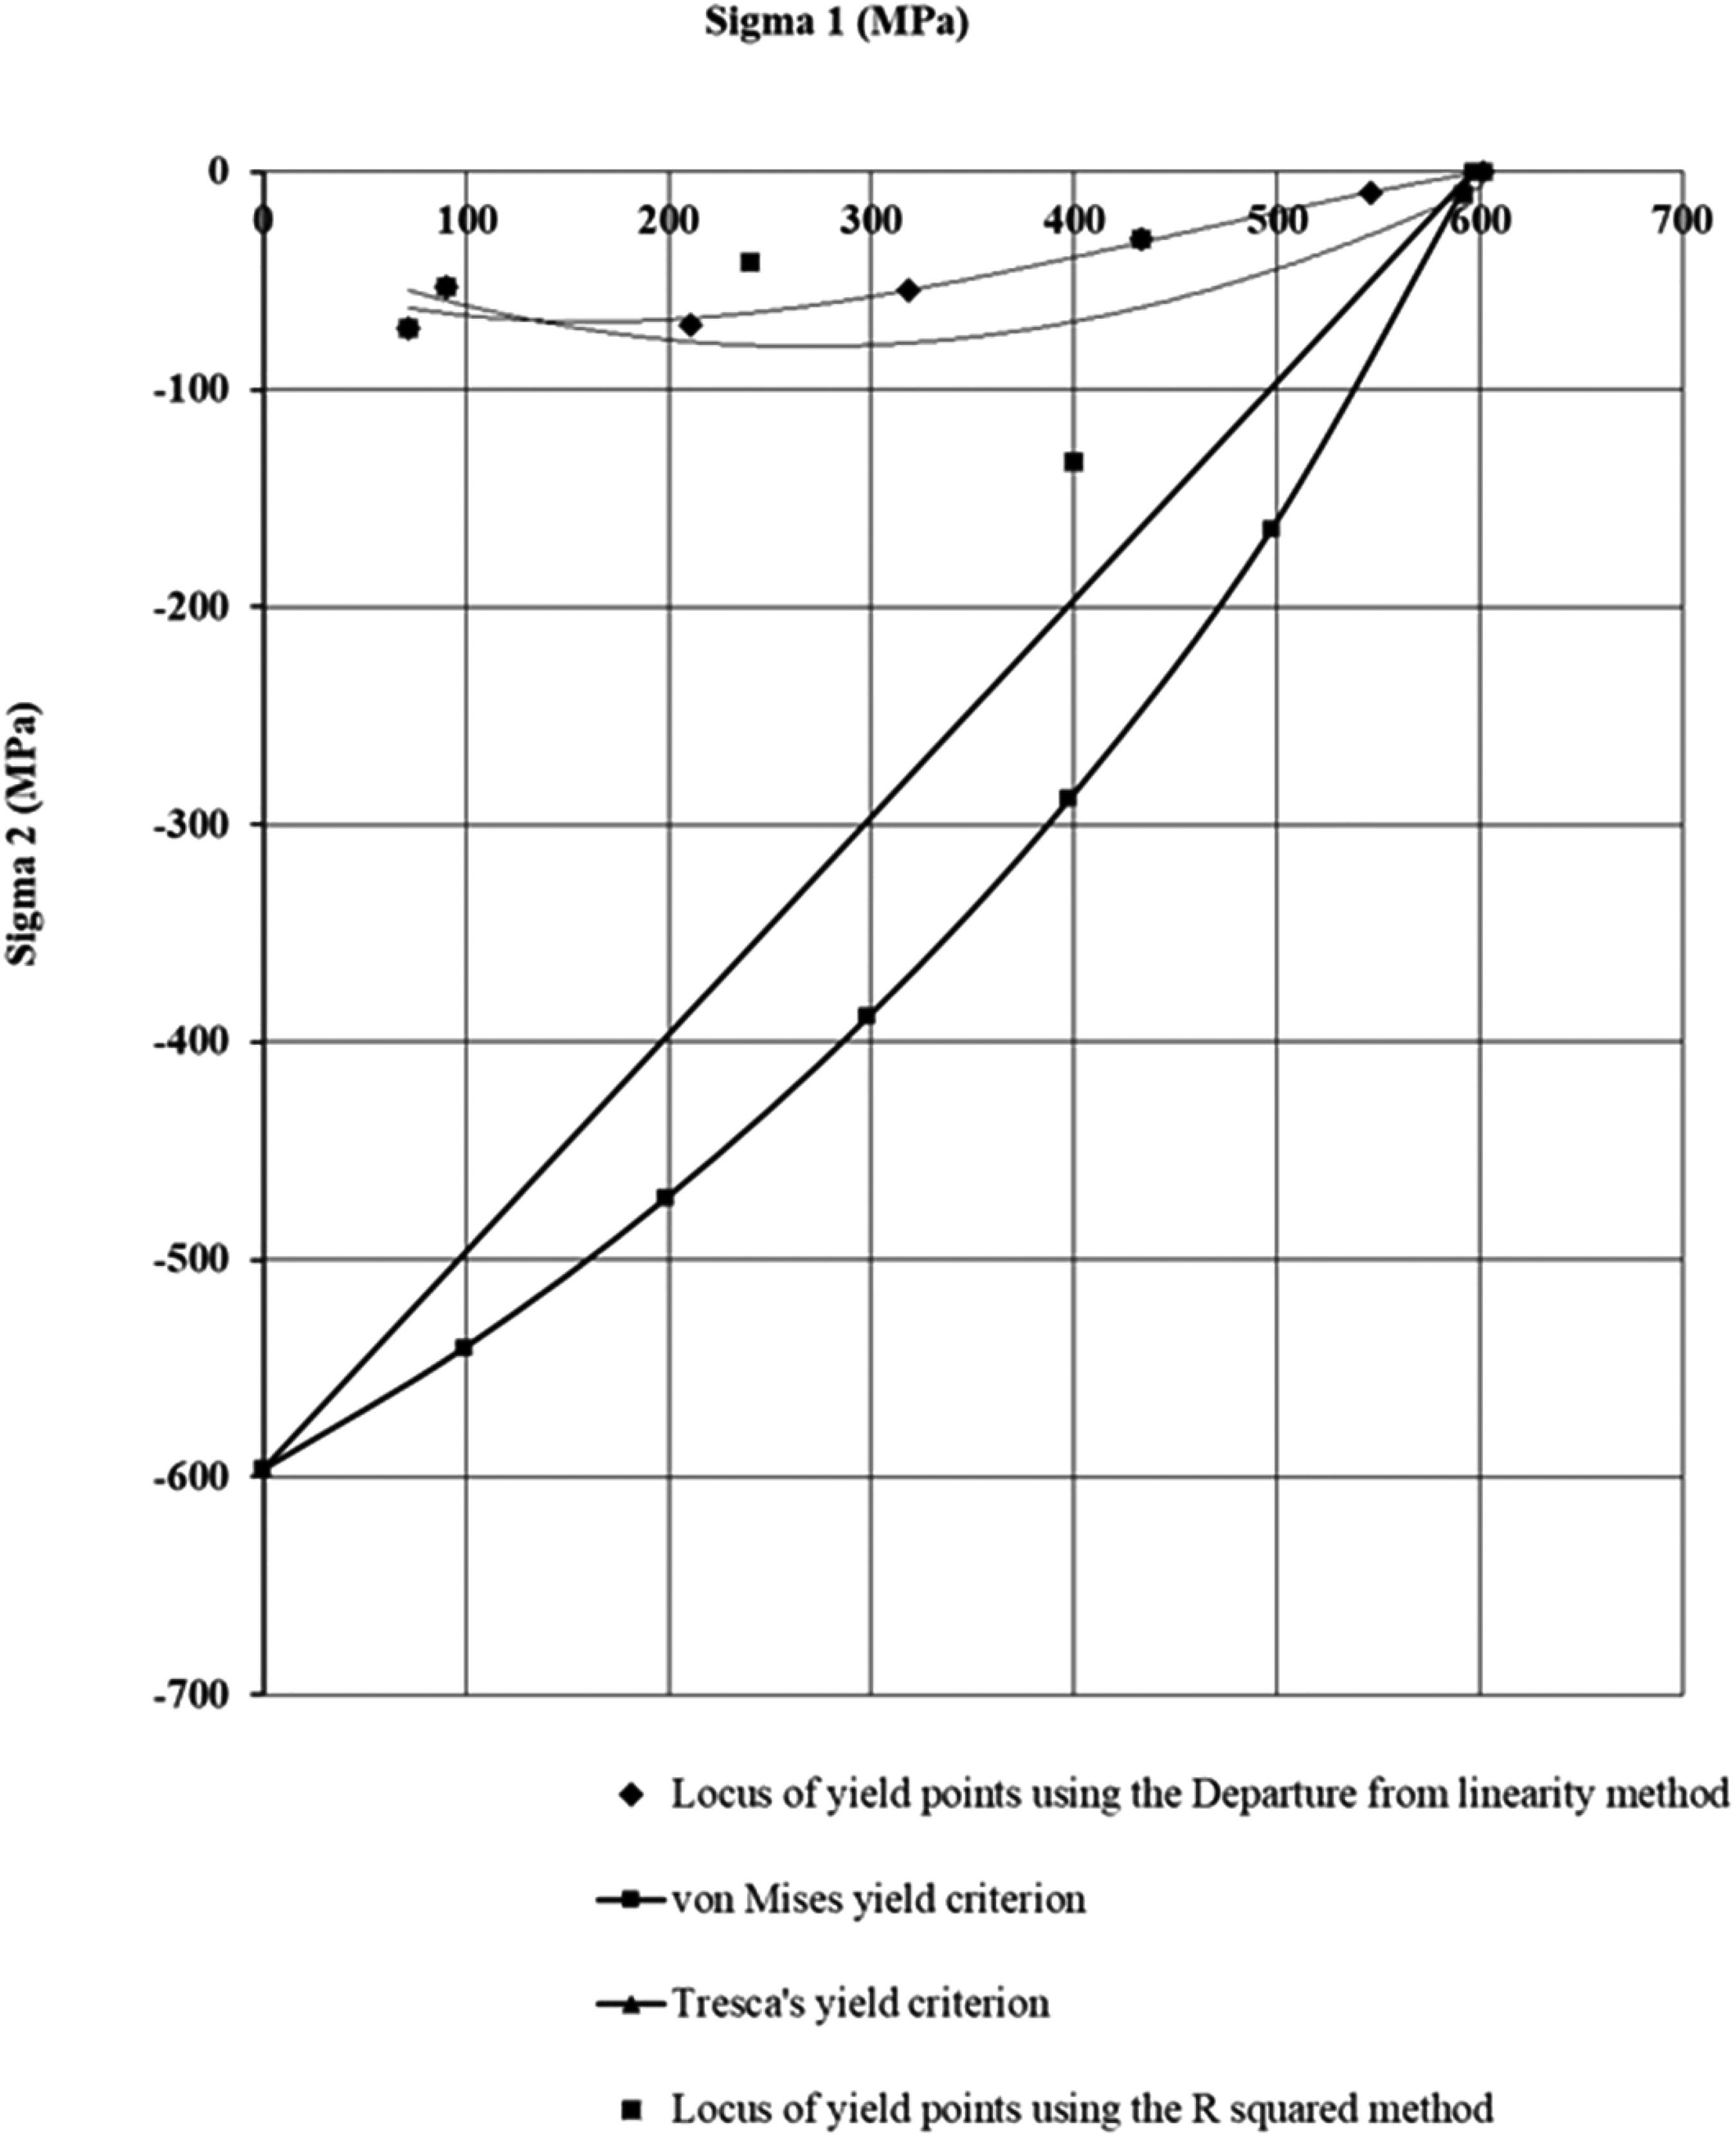
Experimental yield points superimposed on the von Mises and Tresca yield loci for the as-purchased specimen.
The required Mechanics of Materials equations to calculate the two principal stresses at yield are obtained from Muscat and Mollicone 1 in which the authors also give a detailed description of the apparatus used for the combined bending and torsion experiment. The two principal stresses at yield are shown determined using methods 1, 2 and 3 described previously. These three methods used to determine the yield point of the material resulted in similar yield loci. Actually, the deviation from linearity method and the load/unload method gave the same principal values at first yield so that only the locus of yield points using the former method is shown together with the one using the r2 method. The area under the curve method was not deemed to be suitable for identifying the yield point and so is not shown in Figure 10.
The bilinear regression fit to the elastic part of the curve method, the two-tangent method, the offset methods and the Luder line method referred to in the literature review were not considered to be suitable for the work in this paper. The aim of this paper was to determine the onset of plasticity and not to define a material yield point in a uniaxial test. The two-tangent method can be highly subjective, especially when drawing the tangent to the plastic part of the curve since the gradient in this region was found to be constantly varying for these specimen. This varying slope would also affect the bilinear regression fit method. Offset methods were not deemed to be appropriate since the loading arm deflection rather than a measure of strain was being used for the abscissa of the Load–Deflection graphs. The use of Luder lines was likewise not considered to be a viable option to detect plasticity in the experiment described in this paper since the specimen is enclosed in the apparatus and hence not visible.
Figure 10 shows that the correlation between the three methods was quite good but not so when compared with the von Mises and Tresca's loci that were based on the 0.2% proof stress determined in the longitudinal axis direction of the specimen. A lack of correlation occurred for an increasing torsional load indicating a possible anisotropy in the material properties. Since three methods were used to predict the onset of material yielding it was concluded that the lack of correlation between the experimental loci and the von Mises and Tresca's loci was not due to the methods themselves or to the uncertainty involved with each method. This prompted the authors to examine the possibility of the specimen having anisotropic properties due to fabrication processes. The authors’ suspicion was that the specimen might have been excessively cold worked so that it acquired anisotropic material properties. From the information given by the supplier, the specimen material was low carbon steel grade 070M20. The stock was double cold drawn to the square cross section. The steel billet was first cold drawn to a round stock and then drawn a second time to the desired square shape. This process is prone to impart anisotropic material properties in the specimen. When contacted the supplier recommended that the specimens are normalised before testing in the combined bending and torsion apparatus. This again reinforced the fact that the specimen material properties were anisotropic.
Determining the yield stress and Young's modulus for the heat-treated (normalised) tensile test specimens
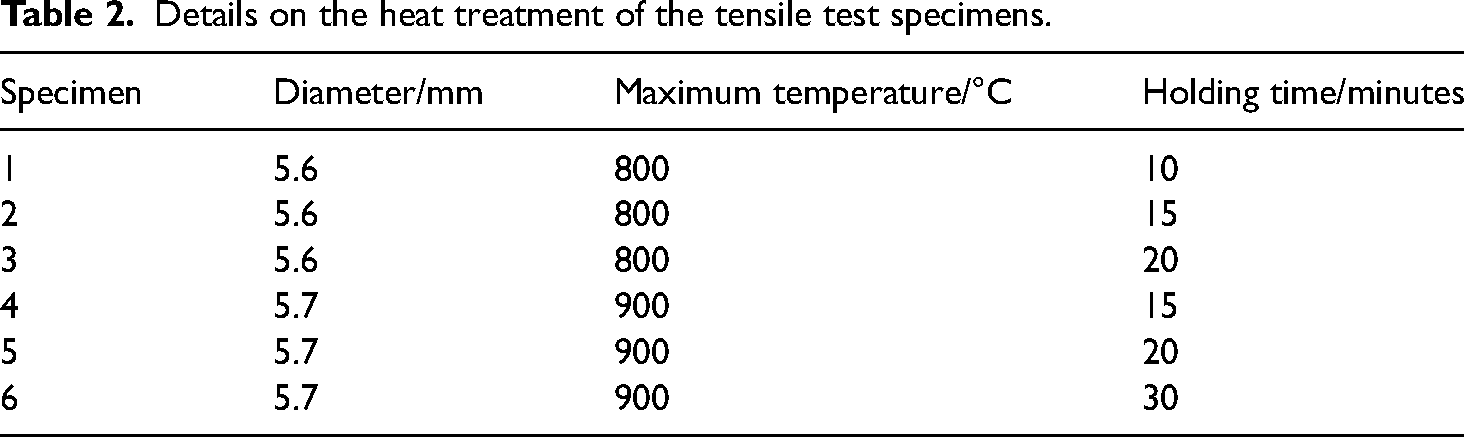
The authors heat-treated six tensile test specimens machined out of the as-purchased combined bending and torsion specimen. The machined tensile test specimens had the same dimensions as shown in Figure 2 but had a slightly smaller diameter at the gauge length section. These diameters are shown in Table 2. The specimens were heated in a furnace up to the maximum temperature shown in Table 2, kept in the furnace for the respective holding time and then left to cool in air. Prior to placing them in the furnace the specimen were sprayed with graphite to avoid decarburisation. Different maximum temperatures and holding times were considered to check the effect that these parameters have on the value of the resulting yield stress. The heat treatment was also performed in order to give the material isotropic properties. Unfortunately, the authors could not check whether isotropic properties were achieved through a tensile test because the material was only available in the combined bending and torsion specimen format as shown in Figure 1. This did not permit machining tensile test specimens in the three orthogonal directions.
Details on the heat treatment of the tensile test specimens.
The heat-treated specimens were tested at a tensile testing machine crosshead speed of 0.54mm/min same as for the original material. Figure 11 shows the six heat-treated specimen, and Figure 12 shows ‘specimen 1’ after being tested to failure. All the failure modes for the six specimens were ductile and similar to that shown in Figure 12.
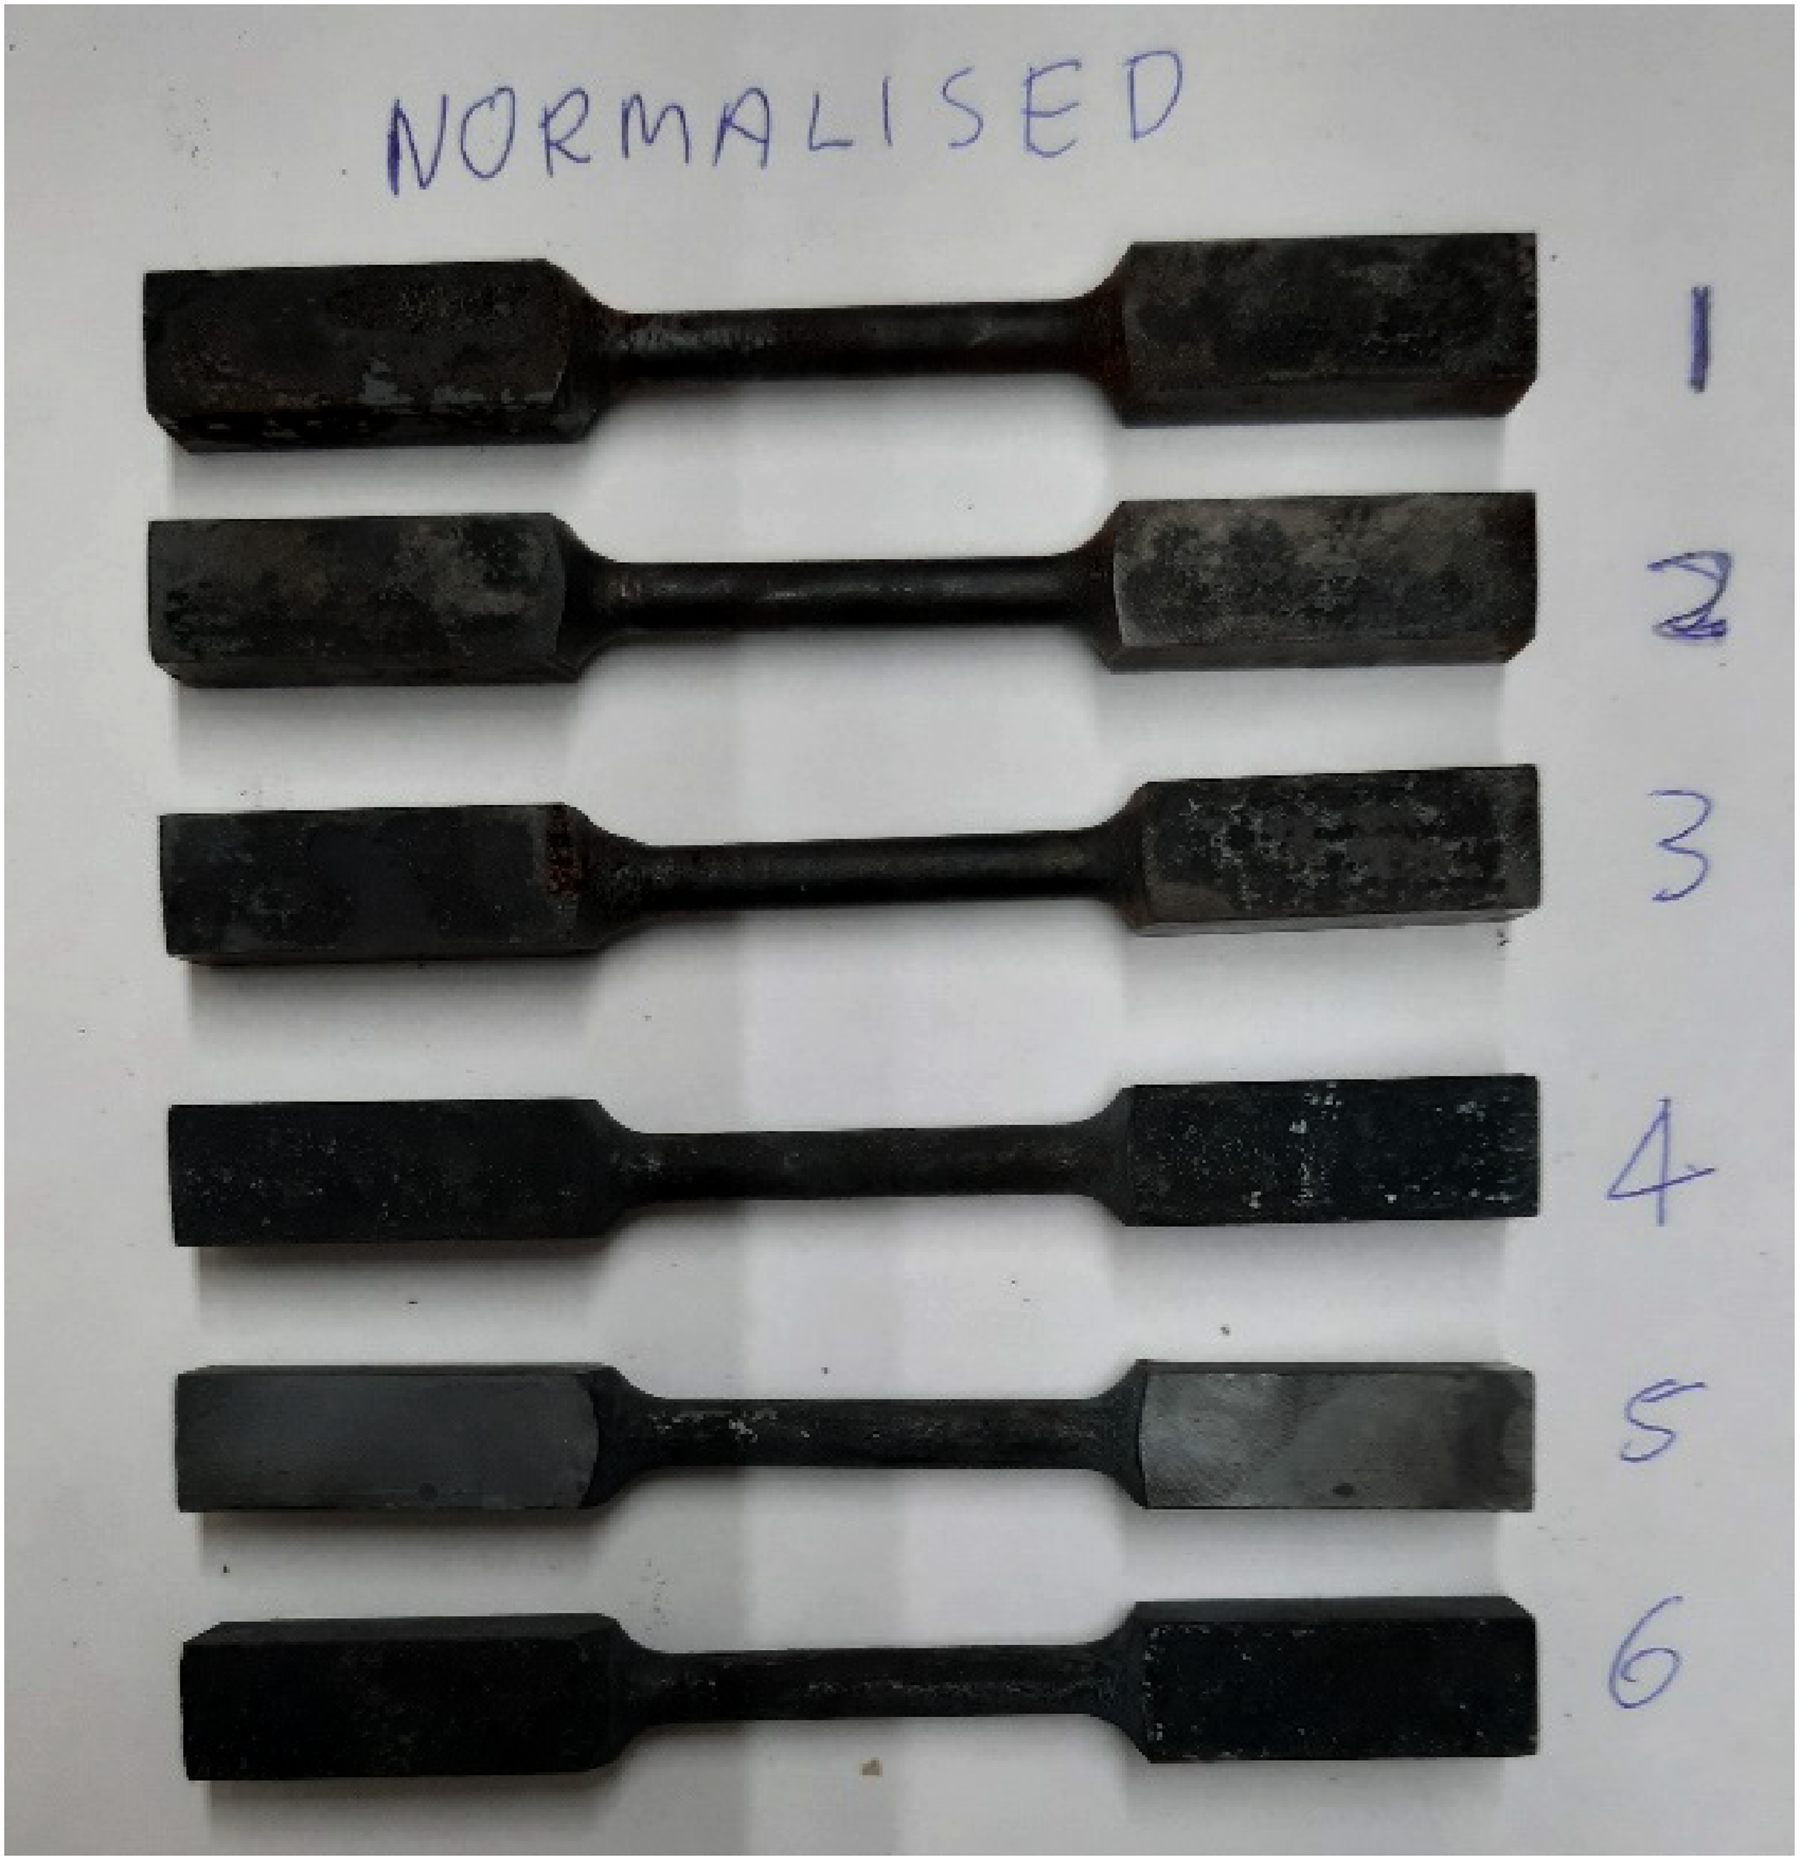
The six specimens before being tested in the tensile testing machine.
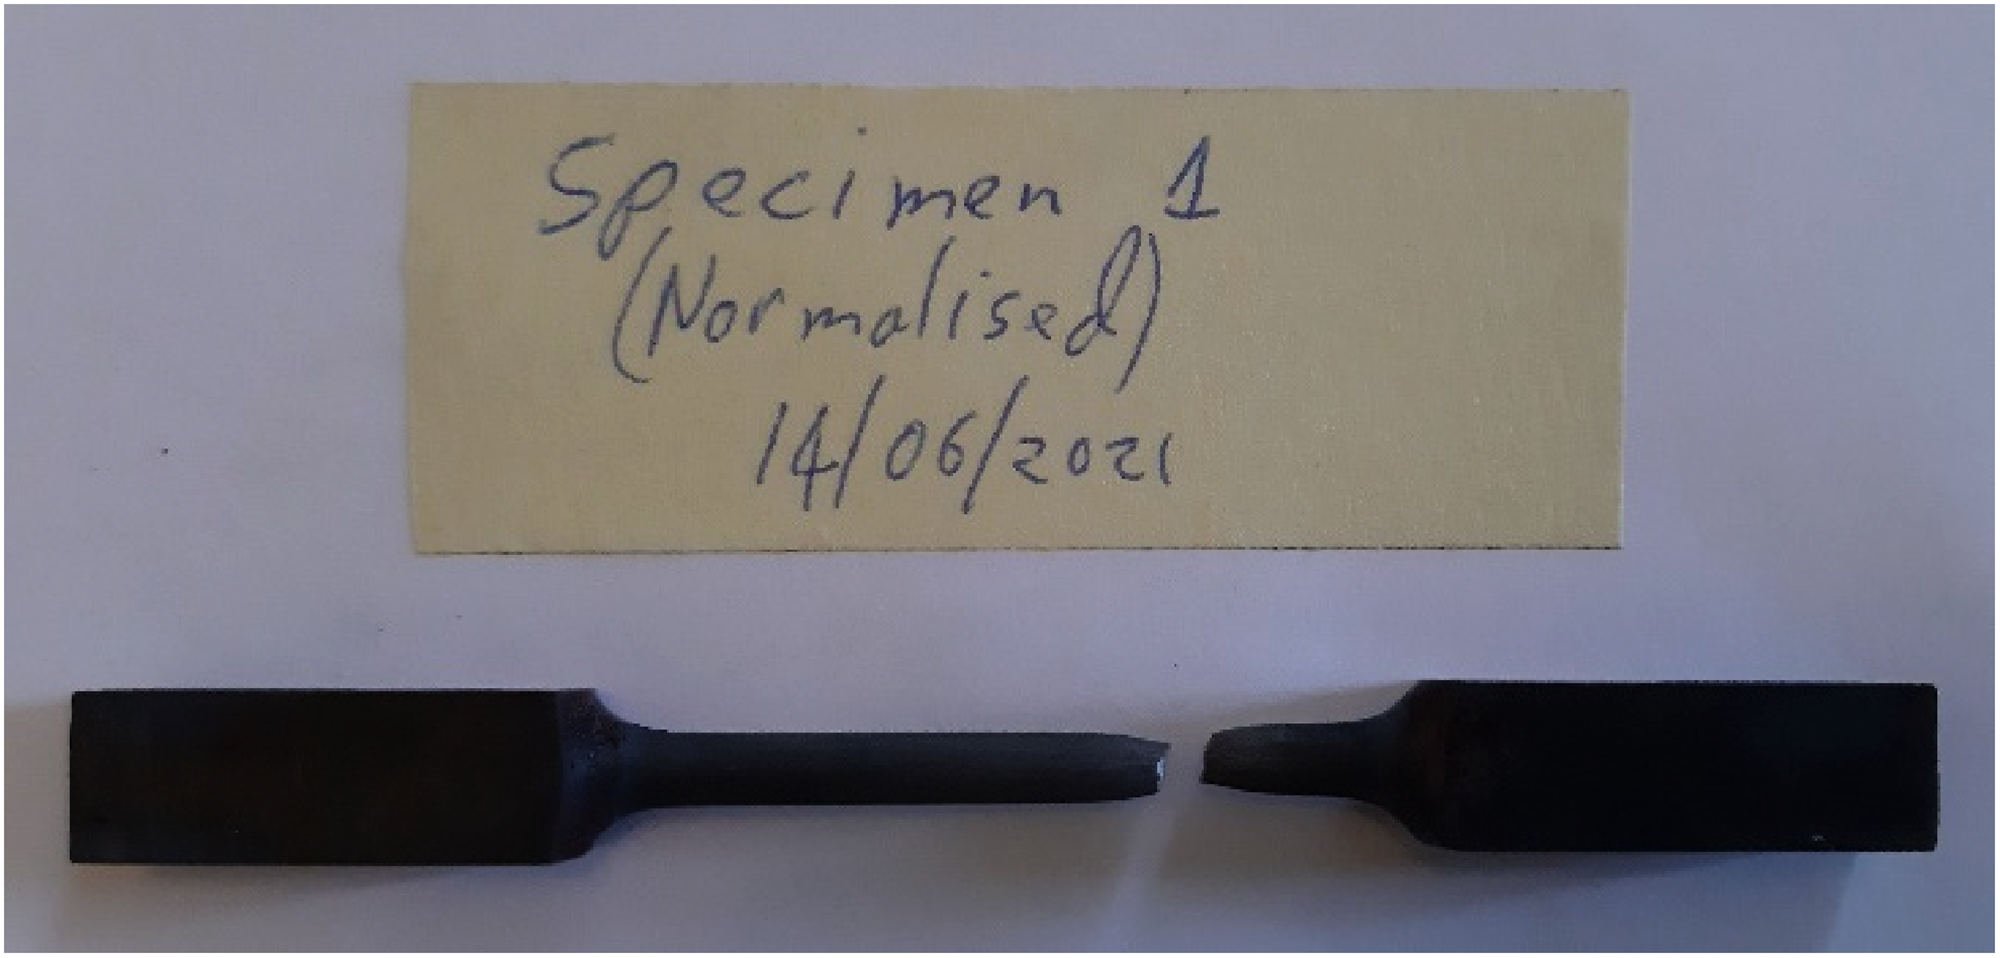
One of the specimens after the tensile test.
Figures 13 and 14 show the engineering stress–strain curve for heat-treated ‘specimens 3 and 6’ and as obtained from the tensile test. Similar curves were obtained for the remaining four specimens. The 0.2% proof stress was used to determine the yield stress and is shown in Table 3 together with each respective value for Young's modulus and heat treatment.
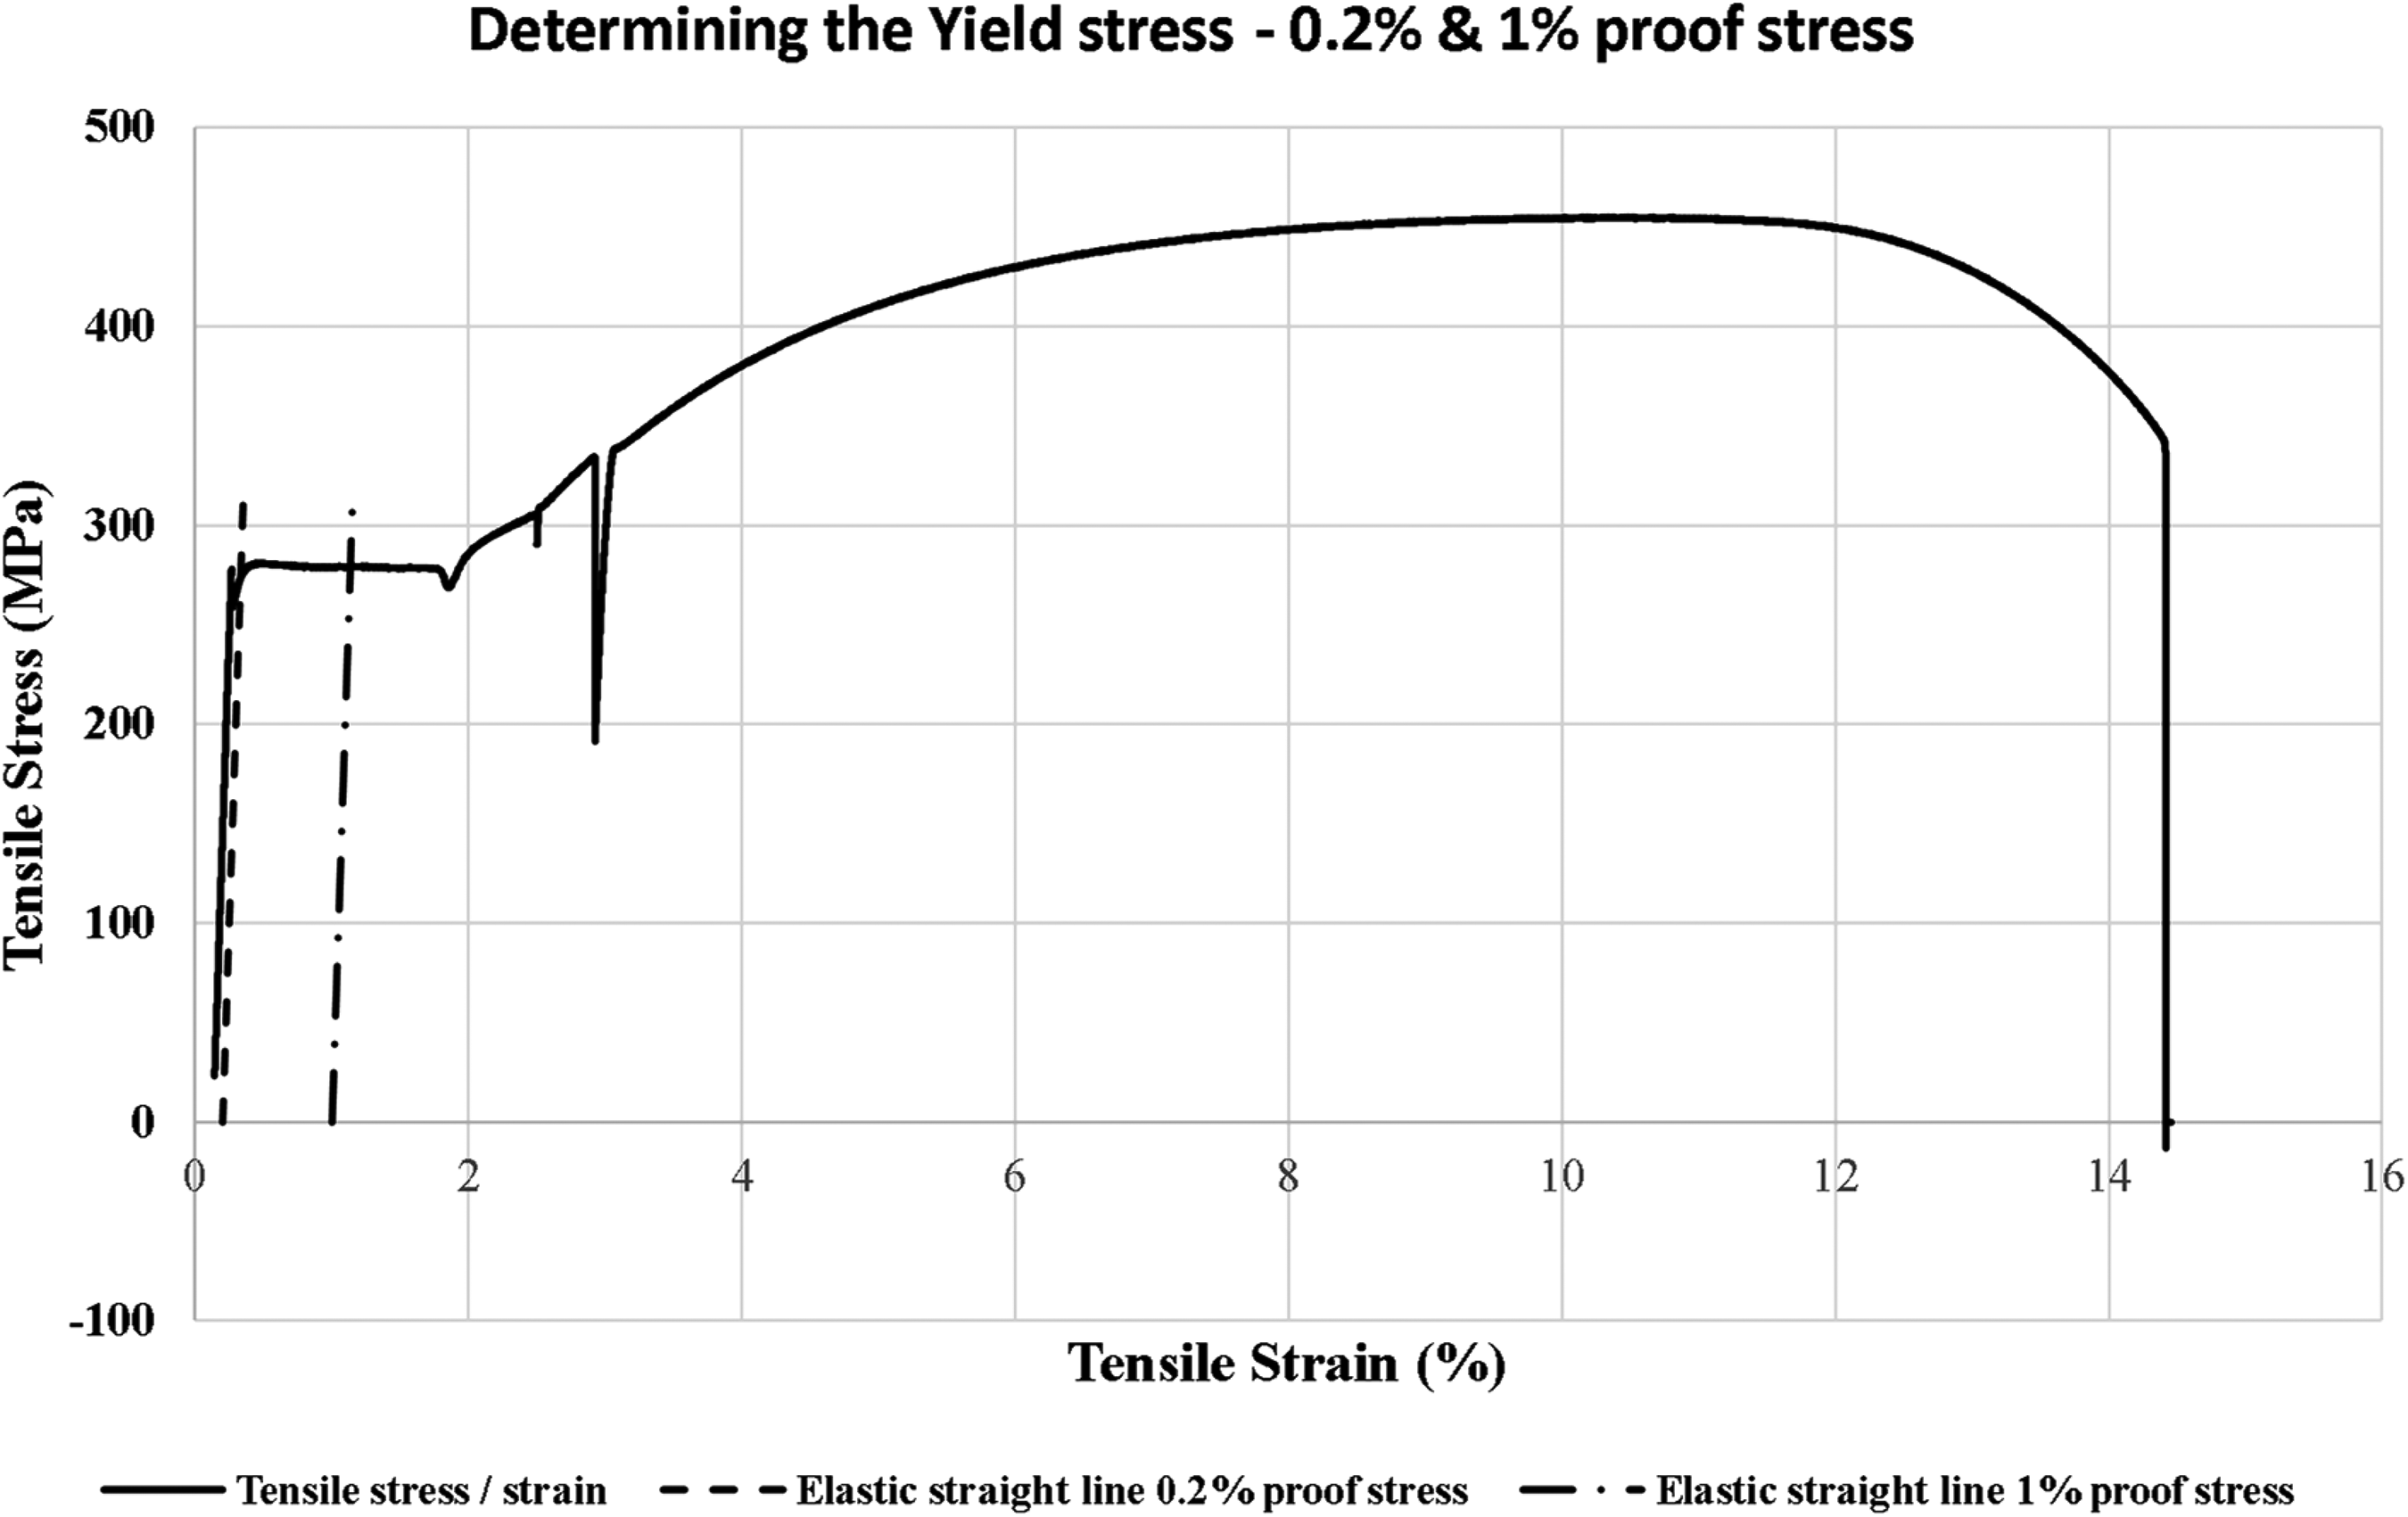
The engineering stress–strain curve for the material of specimen 3 (heat treated).
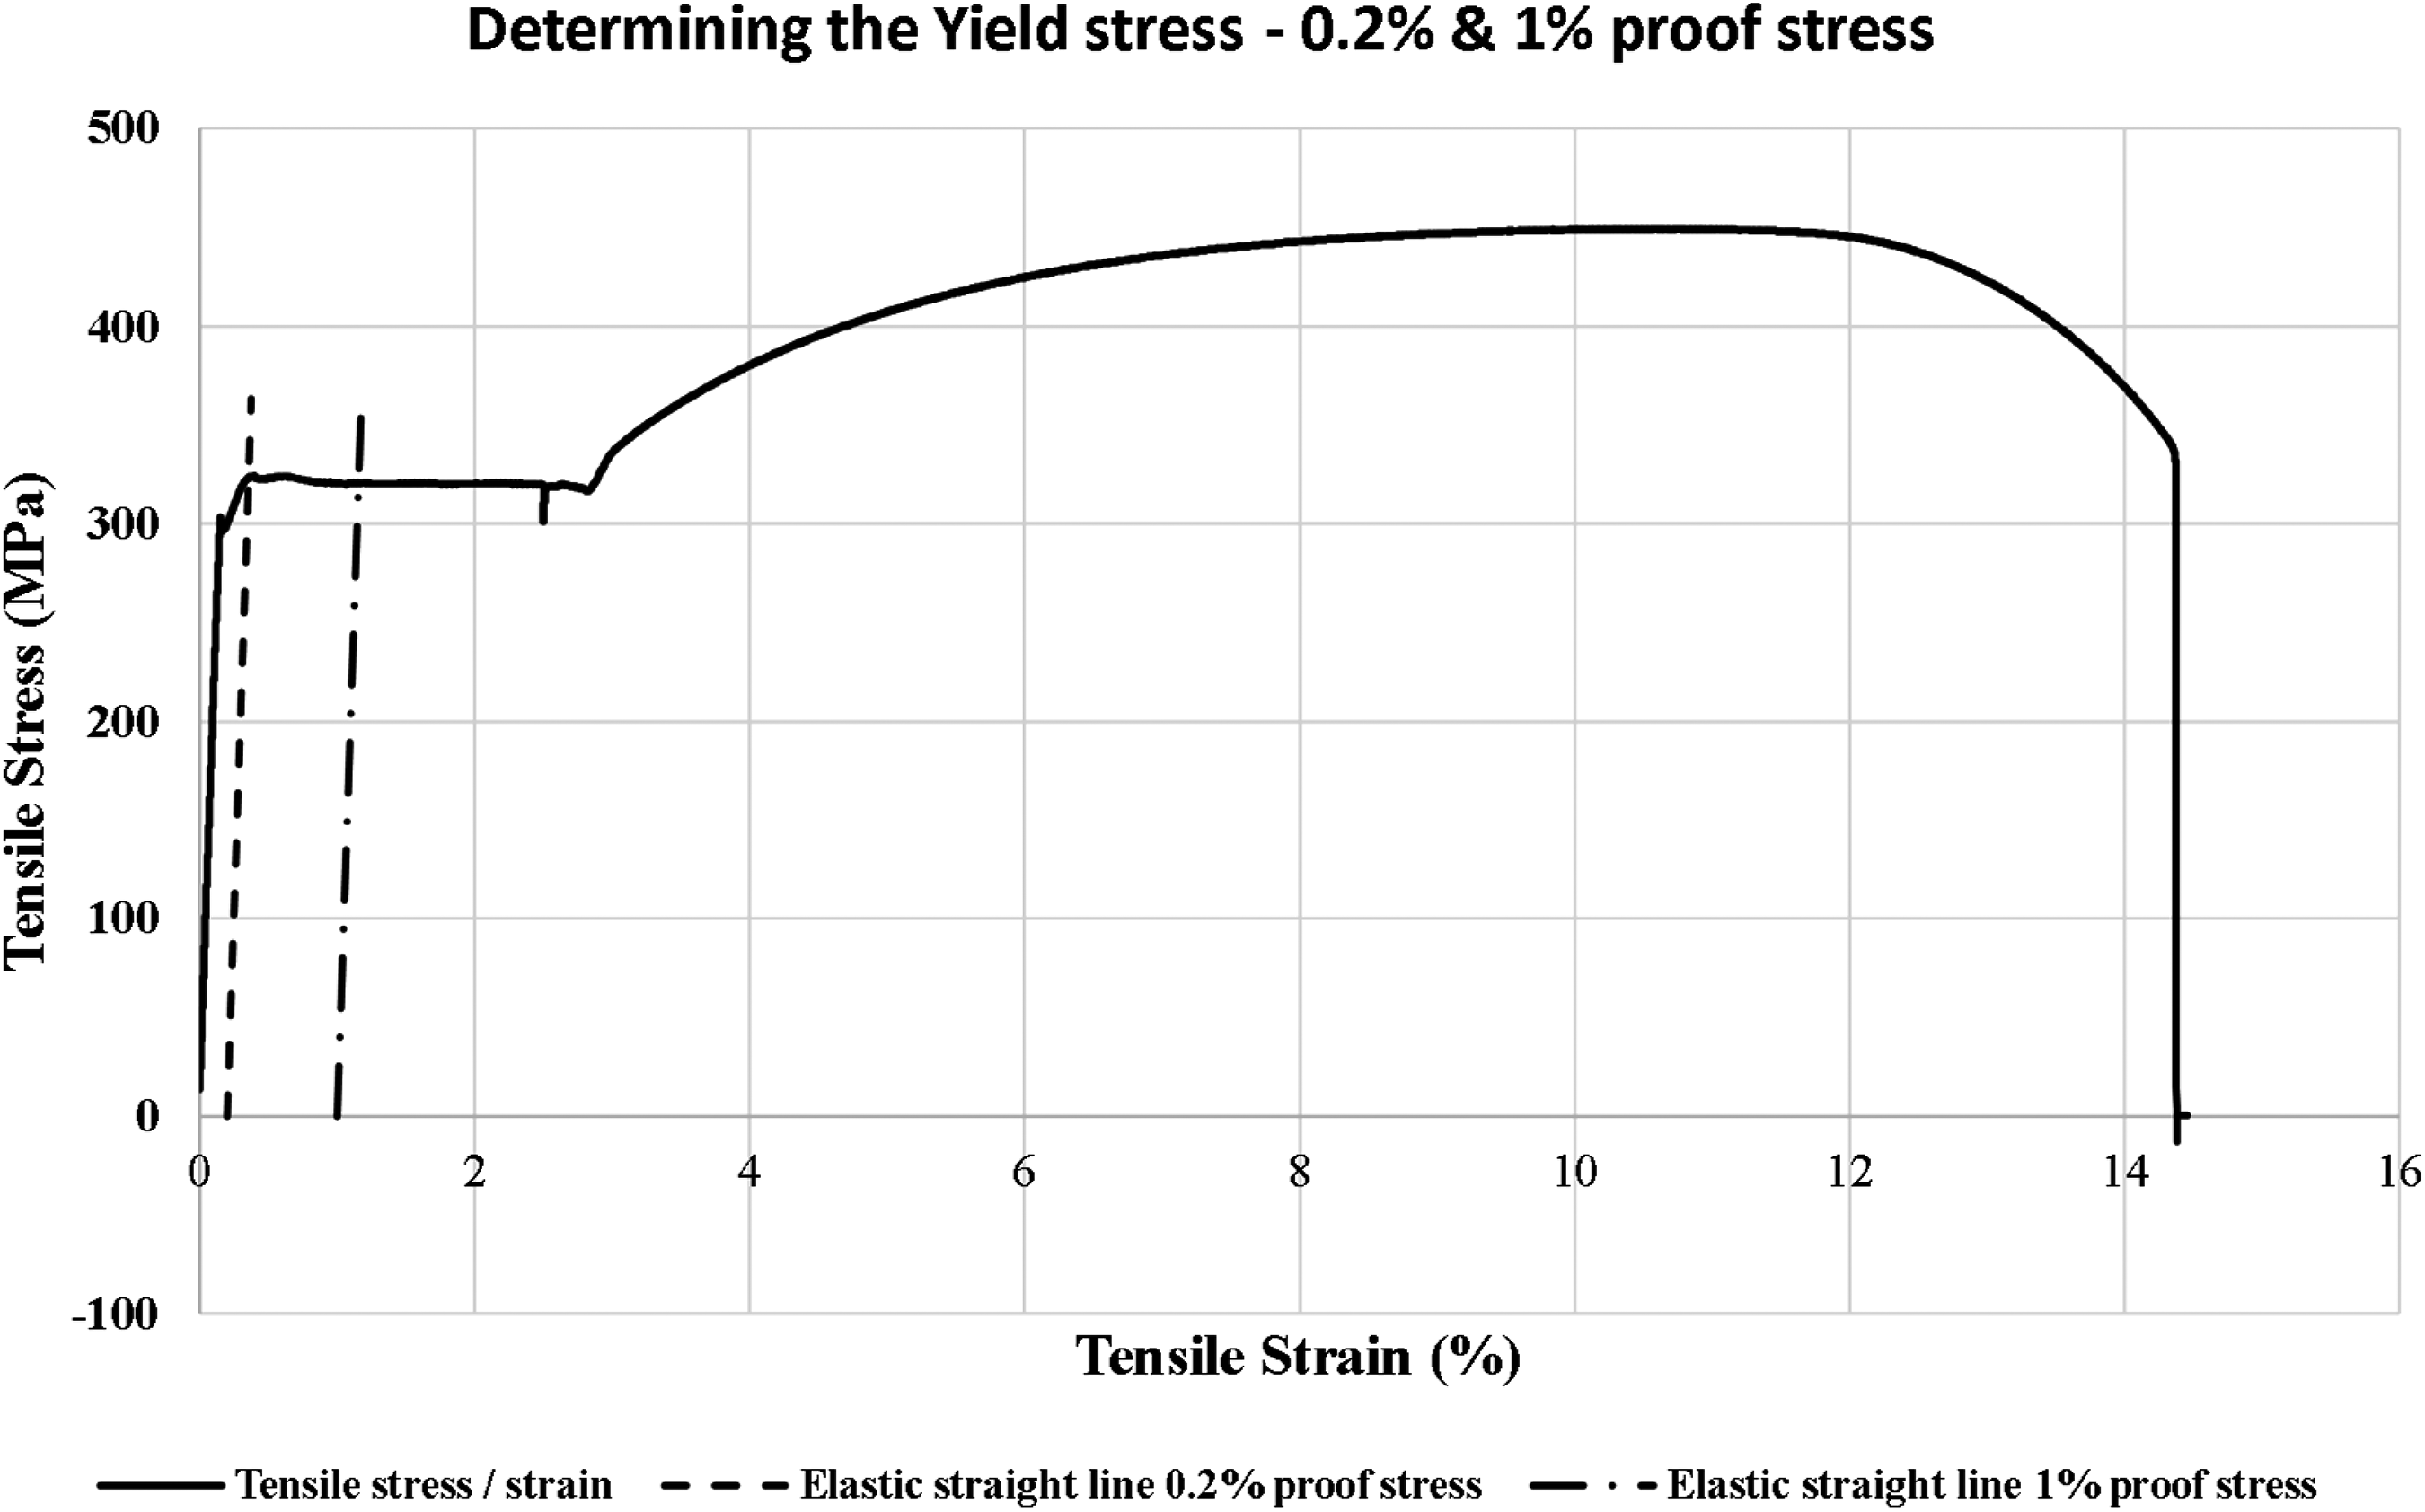
The engineering stress–strain curve for the material of specimen 6 (heat treated).
Values of 0.2% proof stress and Young's modulus for different heat treatments.
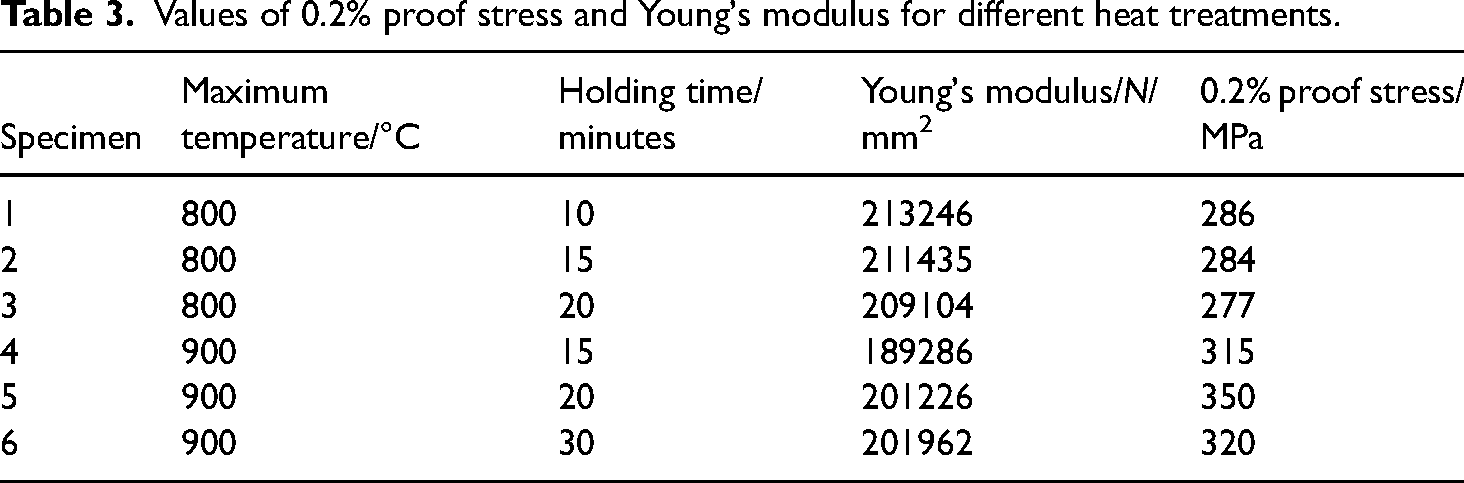
It can be observed that the 0.2% proof stress and the 1% proof stress gave the same values indicating an elastic perfectly plastic behaviour for strains smaller than 2% and 2.8% for ‘specimens 3 and 6’, respectively. It must be noted that the yield stress of the heat-treated specimen (ranging from 284MPa to 350MPa) is now much less than that of the as-purchased specimen (596.55MPa) and is in the range of the yield stress for structural steel. This proves that the original as-purchased specimens were indeed heavily cold worked. Heat treatment at a temperature of 900°C resulted in higher yield stress (approximately 15% higher than the value obtained with 800°C).
The tensile test also revealed an increase in ductility from 5.5% of the cold-worked specimens to approximately 14.4% (Figures 13 and 14) and this is due to the heat treatment. Another observation is that the heat treatment did not have a huge effect on the value of Young's modulus. The average Young's modulus value for the six heat treated specimen is 204GPa, while Young's modulus for the as-purchased specimen is 194GPa. The difference is approximately 5%.
Predicting the yield surface for a two-dimensional stress system using the normalised specimen and the combined bending and torsion apparatus
Given the similarity of results obtained with the deviation from linearity of the load/deflection curve method, with the load–unload method and with the r2 method for the as-purchased specimens, it was decided to use only the deviation from linearity method to detect yield under combined bending and torsion for the normalised specimens. Three sets of specimens (21 specimens in total) were normalised by heating them up to 900°C, holding them at this temperature for 30 min and then cooling them at room temperature. This heat treatment cycle was arbitrarily chosen without going into the merit of finding an explanation for the influence of the treating temperature on the resulting mechanical properties. The only objective of the heat treatment was to induce as much isotropic properties as possible in the test specimen. The yield stress (0.2% proof stress) for the same heat treatment programme for a tensile test specimen was determined previously to be 320N/mm2. The heat treatment for the specimens used in the bending and torsion experiment was done in one batch which was different from the tensile specimens’ batch.
Figure 15 gives the Load–Deflection curve for the relative loading arm and specimen angle of 0° for one of the sets of normalised specimens. Table 4 shows the loads at which plasticity was detected using the deviation from linearity method. Figure 16 shows, for the three sets of specimens, the two principal stresses at yield for each loading arm angle superimposed on a plot of the von Mises and Tresca yield loci based on the uniaxial yield stress (0.2% proof stress of 320 MPa derived from the uniaxial test for the same heat treatment).
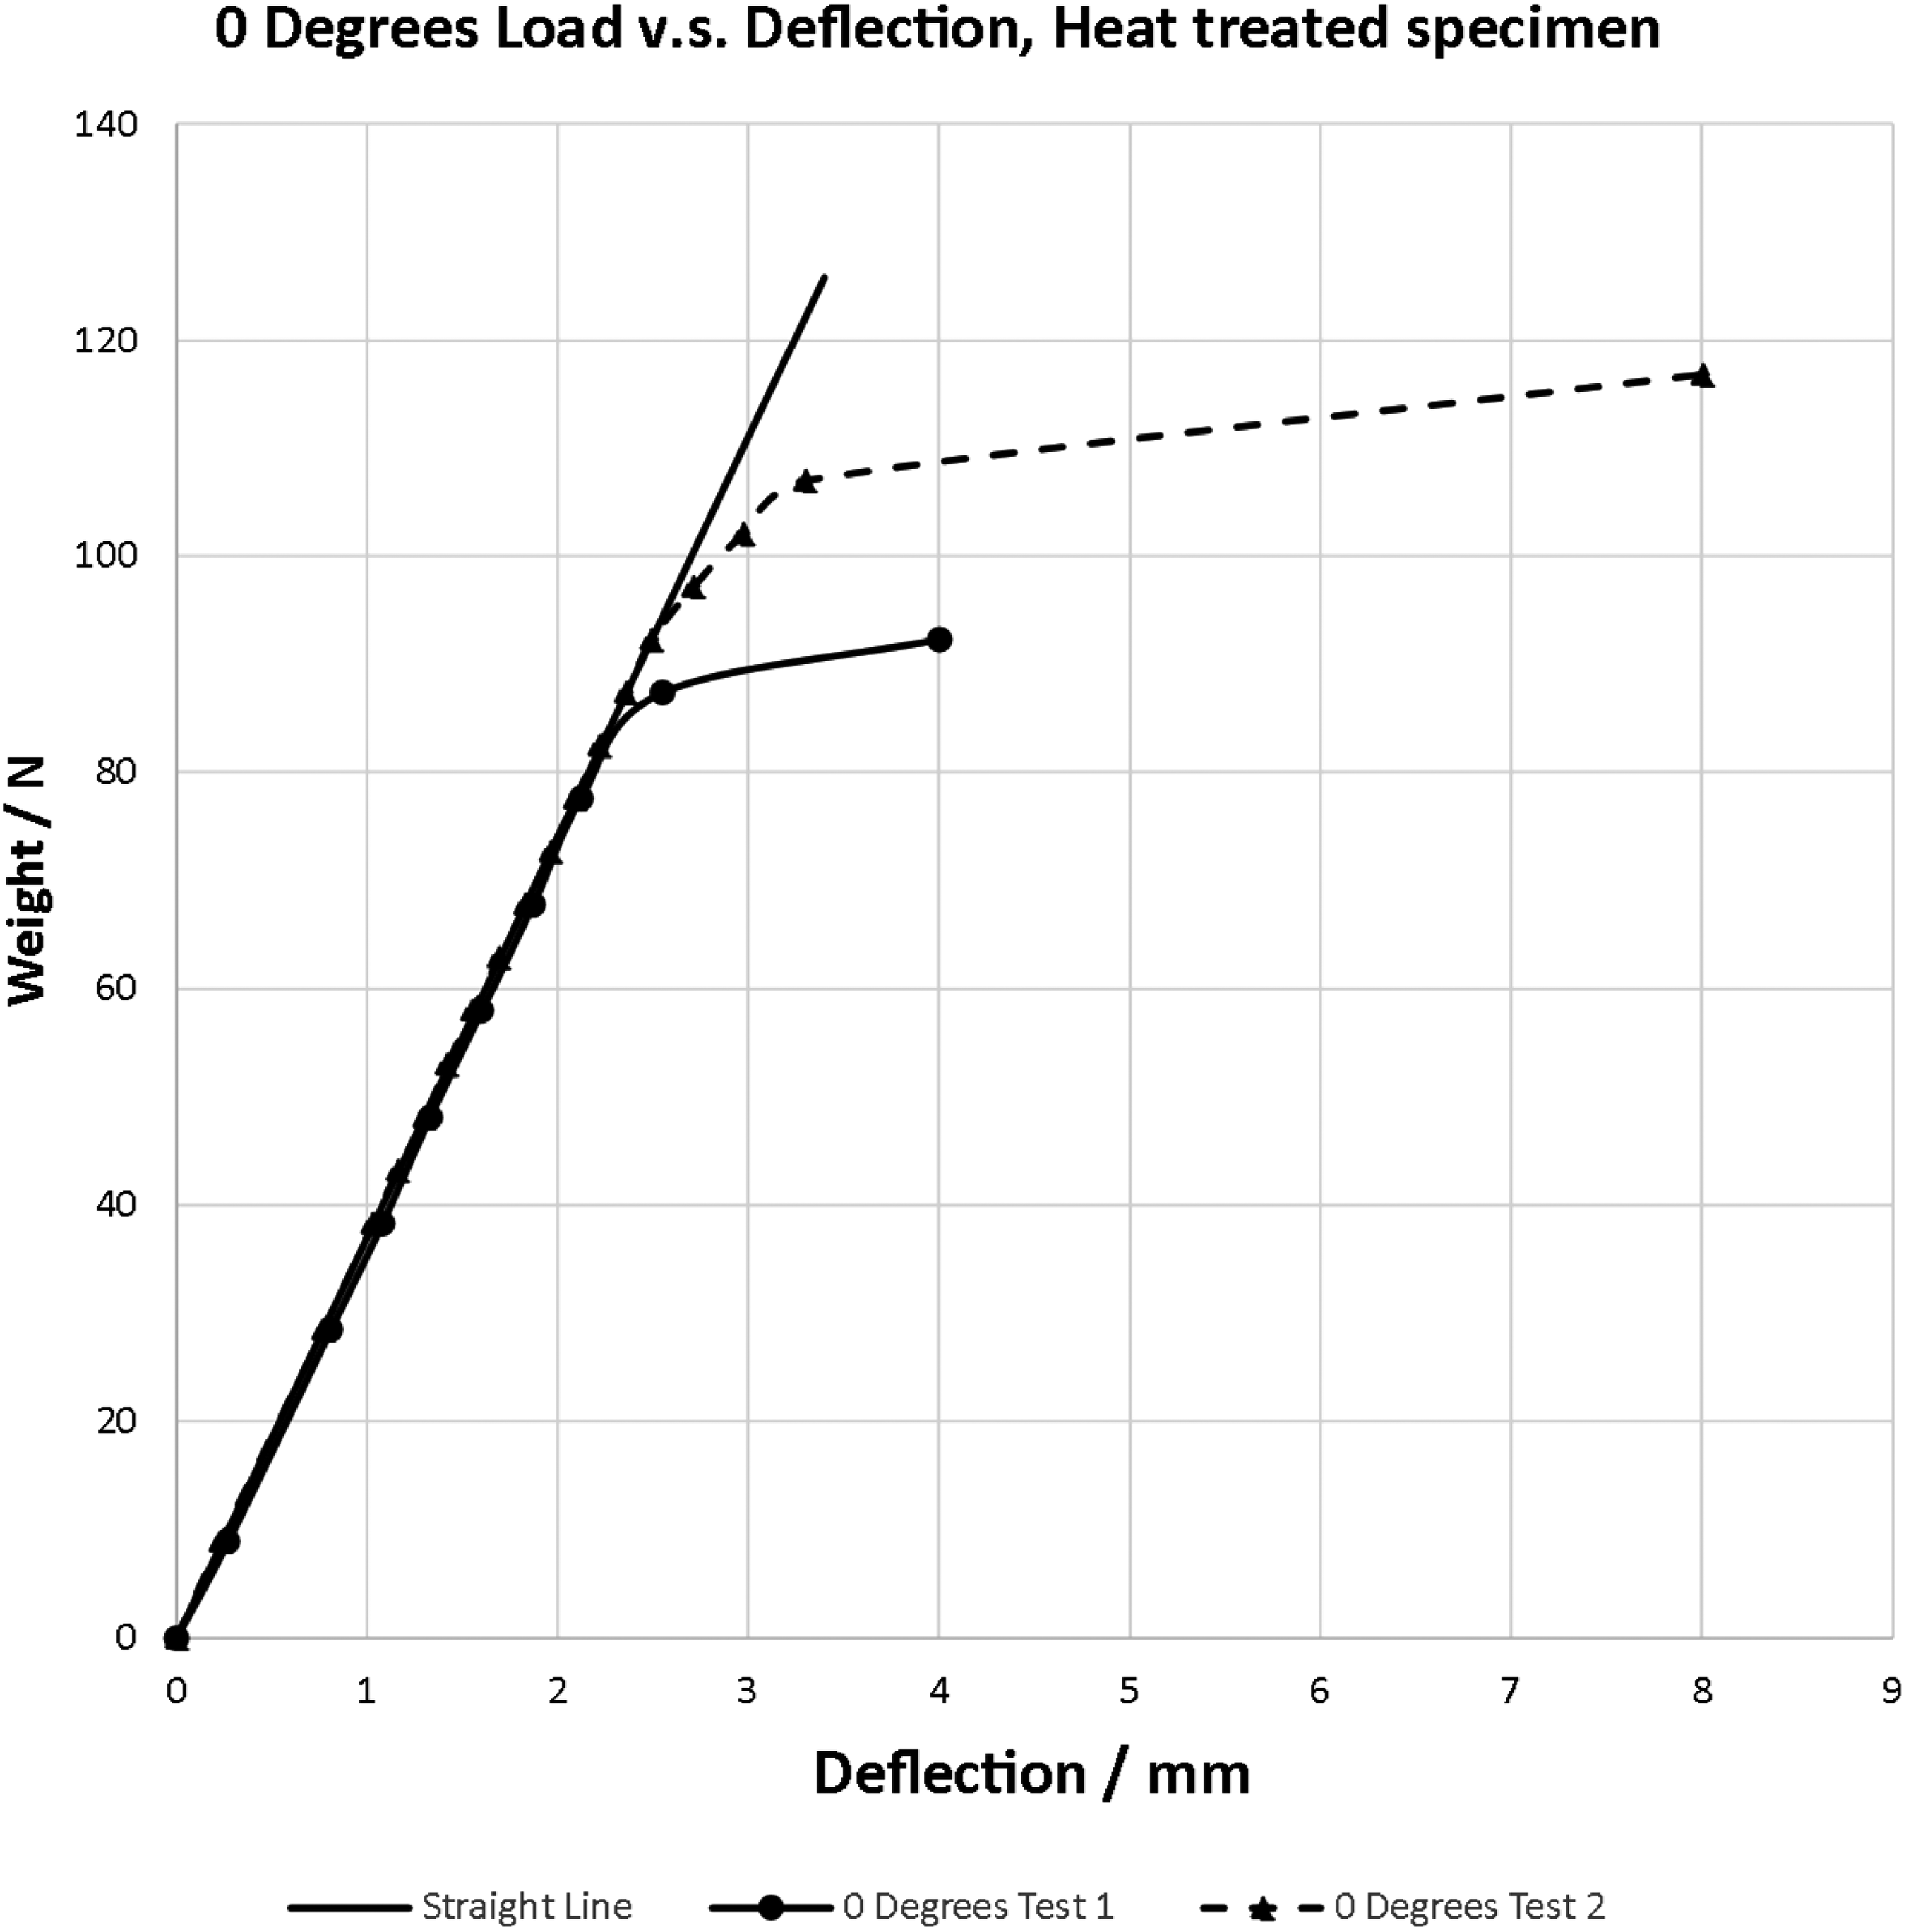
Load vs. Deflection graph for 0° angle (pure bending). Two specimens were tested. Curve deviated from linearity at loads of 82N and 92N, respectively.
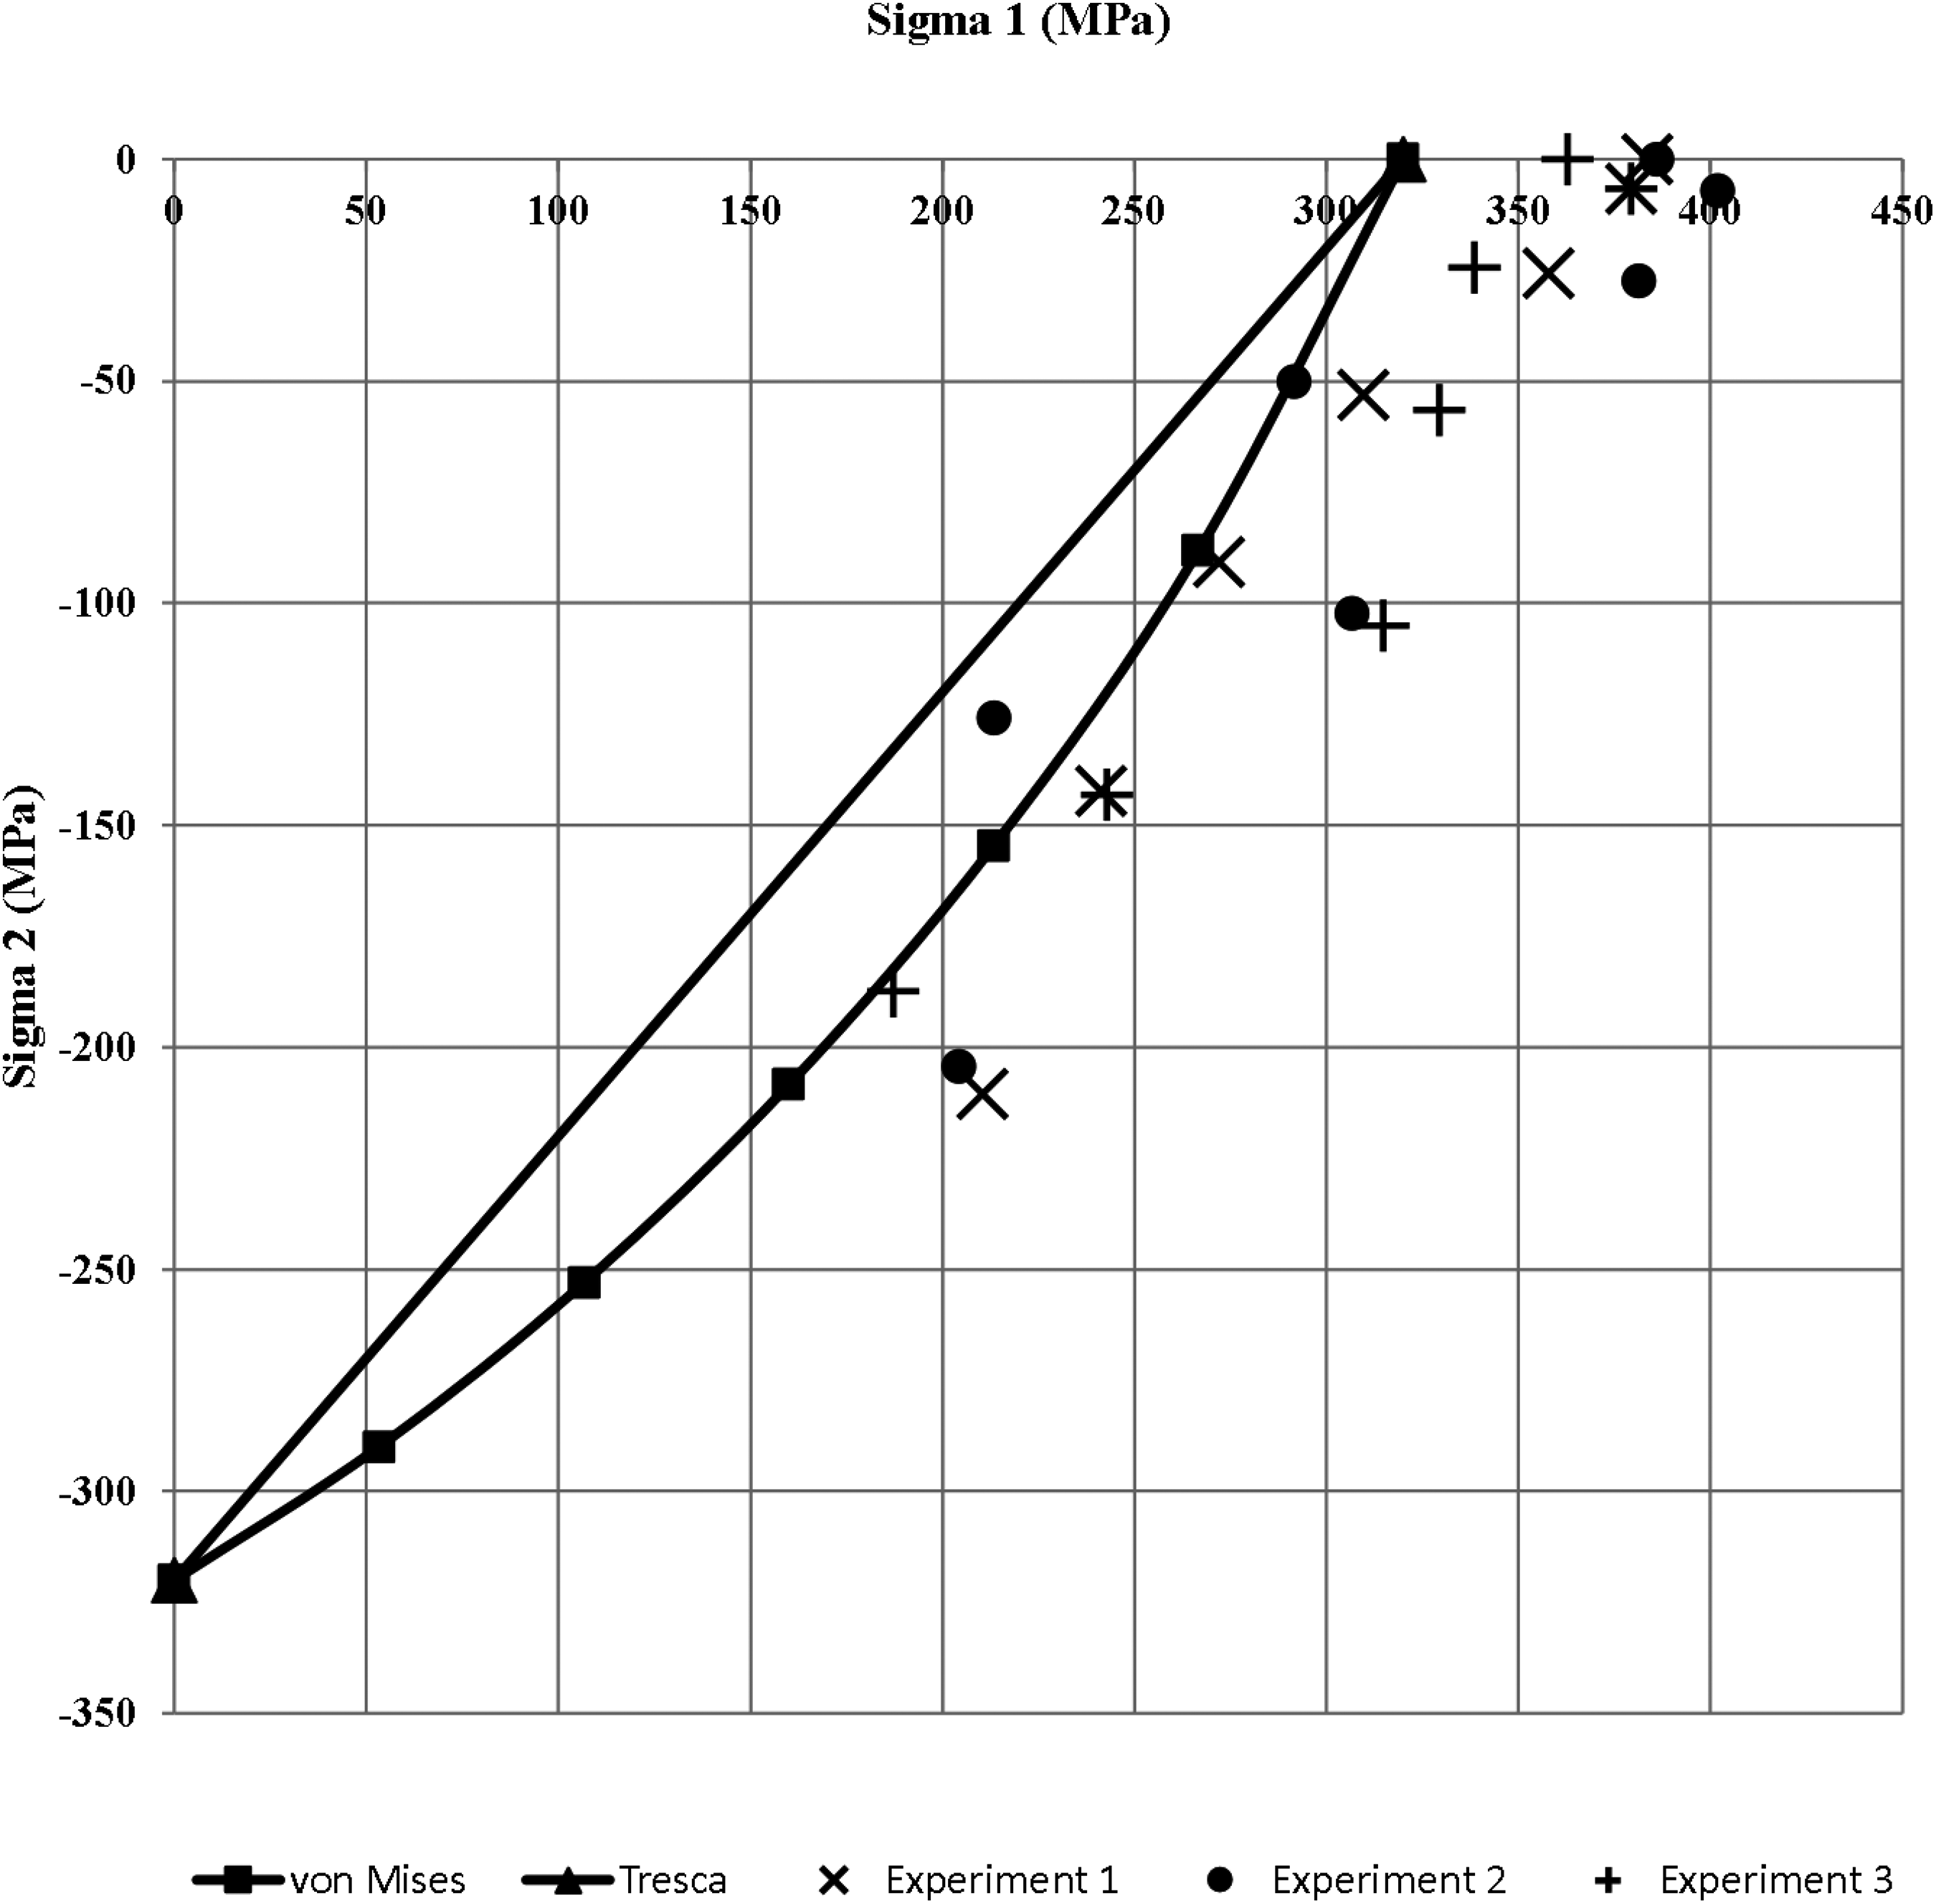
Experimental yield points superimposed on the von Mises and Tresca yield loci for the normalised specimens. The yield loci are based on a 0.2% proof stress of 320N/mm2.
Loads at which plasticity was detected using the deviation from linearity method for the normalised specimens.
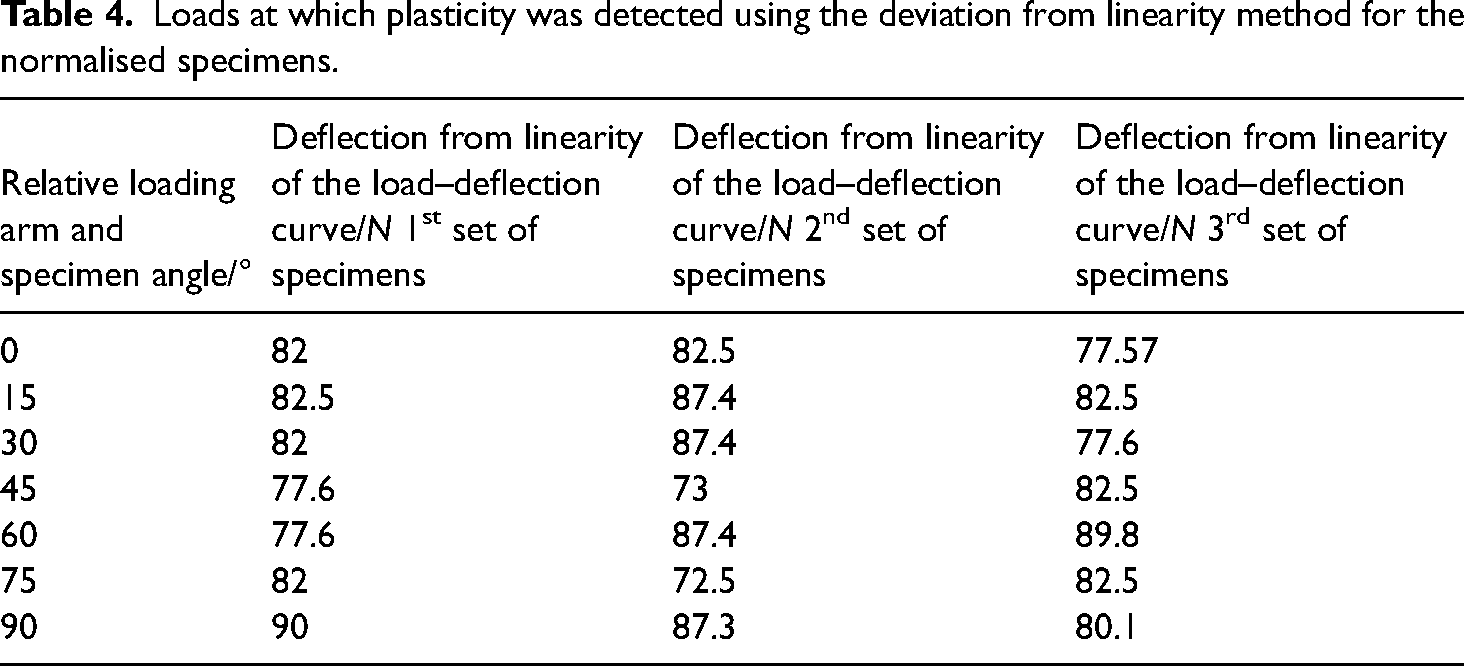
Figure 16 shows a good correlation between the experimental yield points for the two-dimensional stress system at the testing cross section and the von Mises and Tresca's loci that were based on the 0.2% proof stress determined in the longitudinal axis direction of the specimen. This good correlation for the heat-treated specimens confirmed the authors’ hypothesis that cold drawing imparts anisotropic properties in the as-received specimens. Something to note is that most points fall outside the yield loci. A reason for this may be that heat treating the tensile test specimen and the combined bending and torsion specimens in different batches resulted in slightly different yield stresses.
A good estimate for the uniaxial yield stress for the combined bending and torsion specimens can be taken as the value of the principal stress σ1 for the case of pure bending, that is when the specimen is loaded at an angle of 0°. At this angle, the maximum bending stress at the test specimen was calculated to be 383.4N/mm2, 385.8N/mm2 and 362.7N/mm2 when the yield was detected for the three sets of specimens. Compared to the transverse shear stress (arising out of bending and not torsion) which is in the range of 2N/mm2, the bending stress is the most dominant so it can be assumed that non-linearity in the load–deflection plot was due to the bending stress reaching the value of yield stress of the material. Since bending stresses are essentially uniaxial stresses the average of the three bending stresses at yield can be taken as an estimate of the yield stress in uniaxial tension of the material of that heat treatment batch. The average value is, therefore, calculated to be 377N/mm2. Figure 17 shows the experimental combined loading yield points superimposed on the von Mises and Tresca yield loci for the normalised specimens. The yield loci in this case are based on yield stress of 377N/mm2.
Experimental yield points superimposed on the von Mises and Tresca yield loci for the normalised specimens. The yield loci are based on a yield stress of 377N/mm2.
Figure 17 shows a better correlation between the experimental yield points for the two-dimensional stress system at the testing cross section and the von Mises and Tresca's loci that were based on a yield stress of 377N/mm2 determined in the longitudinal axis direction of the specimen in bending mode. This good correlation for the heat-treated specimens again confirmed the authors’ hypothesis that cold drawing imparts anisotropic properties in the as-received specimens. Most points now lie within the yield loci. This indicates the requirement of using material safety factors at the design stage to make up for the variation in material properties for the as-fabricated components.
Logistical set-up
Some notes on the logistical set-up adopted here can be useful for educators planning to implement this laboratory set-up. The student lab activity described in this paper was carried out with three groups of students. Each group consisted of 14 students. Students within such groups loaded one combined bending and torsion specimen each. They were actually divided into small groups of two with the rest of the 12 students watching while their colleagues read out the deflection readings for the corresponding loads. The former were plotting the load–deflection graph as the loading continued beyond the first yield. After the lab session, each individual student wrote a lab report paying special attention to the principal stress plot superimposed on the von Mises’ and Tresca's yield criteria. These students had been previously exposed to experimental results determined using the as-purchased specimens and were disillusioned with the very poor correlation between the experimental yield points and theoretically predicted ones for the biaxial stress field. When students compared the experimental results determined using the heat-treated specimen with those predicted by the yield criteria they all gave encouraging feedback on their satisfaction with the correlation between theoretical and experimental results. The experiment also gave first-hand experience to students on issues of residual stresses induced by cold working, on the effect of stress relieving through heat treatment to obtain isotropic properties and the recognition that steel properties are highly dependent on the loading history for some of their mechanical properties.
Conclusions
The lack of a good correlation between the von Mises and Tresca's yield loci based on the uniaxial yield stress in an undergraduate experiment was addressed. Two hypotheses for the lack of a good correlation were considered. The first hypothesis was the uncertainty involved in the method that the students were using to predict the onset of material yielding. The second hypothesis was that the specimens being used for the experiment had anisotropic properties. Different methods of detecting yield were tested with similar results obtained, while the lack of correlation remained. Tensile test specimens were heat treated at different levels of temperatures and holding times. Heat treatment resulted in a lower yield stress nearer to the value of that typical for structural steel. This confirmed that the specimens were cold worked in the axial direction. Three sets of specimens for the combined bending and torsion experiment were also heat treated. The experimental yield points for the resulting two-dimensional stress field were determined. When superimposed on the von Mises and Tresca's yield loci based on the new yield stress, correlation was very good and as expected. The second hypothesis is hence confirmed.
These plots also showed the need for a factor of safety to be applied to the uniaxial yield stress to address variations in material properties due to the processes involved to produce the final product. The method to detect yield as described by the manufacturer of the apparatus (plotting the load–deflection curve and noting departure from linearity) was found to be the most robust and straightforward to be used by students. The von Mises and Tresca's yield criteria are only valid for isotropic material properties. Heat treatment was, therefore, found to be necessary for the specimens in order to impart isotropic properties to the material.
The work leading to this paper highly improved the student experience during and after the experiment and, therefore, led to a better understanding of the two most common yield criteria for ductile materials and the importance of using a factor of safety for material parameters.
This paper hence provides important insight into practical considerations for a successful student experience with the combined bending and torsion experiment. The authors believe that this laboratory session should be included in undergraduate mechanics of materials study-units within the context of a mechanical engineering degree, in order to reinforce the concepts of elastic theories of failure and their importance for mechanical design. In order to ensure a positive student experience, the following are the main guidelines for educators wishing to implement this work:
The main procedure of the experiment
1
is appropriate and in line with literature on this topic; it can hence be kept as part of the laboratory documentation. Literature/historical perspectives, described in the literature review section above, are important and students should be made aware of them. It is imperative that specimens have isotropic properties: this should be ensured by educators and/or technical staff setting up the laboratory by:
Having conversations and obtaining as much information as possible from the supplier, given the practical difficulty in testing the specimen in multiple directions. Performing appropriate heat treatments on the specimens prior to their use. Running preparatory tests, that is, without students, prior to the study-unit commencement, in order to verify the measures taken.
The above should not be taken as a ‘behind the scenes’ approach with students; to the contrary, students should be made aware of the experimental pitfall, results with all scenarios and measures taken. Depending on time resources, students could be made to test anisotropic samples prior to the isotropic ones.
Footnotes
Acknowledgements
The authors express their sincere gratitude to Mr Kevin Farrugia, Prof. Joseph Buhagiar, Ing Mary Grace Micallef and Mr Jesmond Pace for their support in the experiments.
Declaration of conflicting interests
The author(s) declared no potential conflicts of interest with respect to the research, authorship, and/or publication of this article.
Funding
The author(s) received no financial support for the research, authorship, and/or publication of this article.