
Abstract
We describe and evaluate the use of a remote laboratory with approximately 250 third-year students in the ‘Controls and Instrumentation Engineering 3’ course in the School of Engineering at the University of Edinburgh. The remote laboratory was created using the first iteration of a new open-source infrastructure. A key component of the implementation is a secure video and data relay that permits experiments to be hosted on restricted networks and accessed from a wide range of browsers, so as to minimise the technical support burden on course staff. A heterogeneous set of twelve spinning disks driven by DC motors were provided to students via an online catalogue permitting instant and exclusive access to an individual experiment for up to 90 min a session. The student experience was evaluated via a survey, which comprised both qualitative and quantitative questions. Survey participation was optional and included some in-depth questions targeting the students’ experience from a UX perspective. The link between quantitative and qualitative results allows us to draw useful conclusions about the experiences of the students participating in the survey. Our main findings are that the overall experience was positive for the survey respondents, and that they perceive a distinction between having control over the equipment and control over the task. Our work indicates there is a need to better understand the implications of students making this distinction, and the effect it will have on future designs of remote laboratory tasks, user interfaces, and evaluations.
Introduction
The prospects for low-cost, open-source remote laboratory experiments have recently been enhanced by the wide availability of low-cost single-board computers capable of streaming video (such as Raspberry Pis), and low-cost electronic prototyping ecosystems with strong communities (such as Arduino microcontrollers). These devices have already fostered modest adoption of electronic hardware exercises in a number of educational settings.1–4
While these low-cost experiments have unequivocally lowered the barrier to using remote laboratories in more educational institutions, it is clear that additional factors must be limiting progress towards mainstream adoption, such as (1) even relatively low-cost physical equipment requires time, space and money to develop (or procure) and then host, so sharing experiments is required to maximise the value of the investment; (2) to connect experiments to users, at scale, with acceptable trade-offs between convenience, security, performance and reliability is a non-trivial task so some providers may have chosen to limit their networks to co-operative users within trusted groups to side-step some of the more difficult challenges, thus introducing a human gatekeeper into the scaling process; (3) personnel associated with the development may have been grant-funded or on other temporary posts such as fixed-term roles, internships, studentships, visiting positions, and no longer available to expand or extend either the experimental provision or the management software; (4) the architecture and implementation methods may have been chosen to allow timely delivery of a defined feature set, and present difficulties to subsequent extension and modification efforts; (5) educators who are not naturally enthusiastic about remote laboratories may remain to be convinced of their value, requiring those in the educational community who are already enthusiastic to further develop research into how student skills and cognitive developments are affected by remote (rather than proximal) interaction with physical equipment.
Together these reasons suggest that there remains a significant opportunity to investigate new means of providing remote laboratories that address barriers to adoption, long-term sustainability, and to address discussions about inclusivity, accessibility and decolonialisation of curricula (via permitting customisation to suit local needs). To a certain extent, in an ever more digital world, it can even be argued that first-hand experience of remote equipment is a directly relevant skill for graduates. Thus, the value of remote laboratories goes beyond mere replacement of proximal labs and can instead be framed as a complementary approach with its own beneficial characteristics which cannot be obtained in proximal labs (and which the community is still exploring the extent of).
We use the term “complementary” to highlight the different characteristics inherent in digital education interventions, both those already realised and others as yet to come, that go beyond merely supplementing existing face-to-face education with an online delivery mechanism. For example, the opportunity for wide-spread asynchronous interactions with automated and artificially intelligent education systems creates the opportunity for post-humanistic communities of practice, 5 which follow from new types of interactions with 6 or without 7 the involvement of artefacts, new types of automated assessment, 8 and new methods of evaluating and discovering future capabilities. 9 A fuller discussion of this next stage in the development of remote laboratories is outside the scope of this Paper.
This Paper introduces the first usage in assessed coursework of the first stage of a new remote lab software infrastructure that is ultimately intended to address many of the challenges identified above. A set of twelve spinning disk experiments were used to provide assessed remote-laboratory coursework to a cohort of 250 mechanical and electrical engineering students on a controls and instrumentation course (worth 80% of the course mark, with the course worth 10 of 120 credits for the year). We include an evaluation of the student experience via quantitative and qualitative analysis of survey data from participants. We explore the factors that affect student usability ratings of the remote laboratory system. In particular, we are interested in how the user interface (UI) design can impact student perceptions of autonomy and belief in predictable control over their practical work. We also present results on student perception of theory-measurement disparity in this remote laboratory and perceptions of the skills disparity between remote and proximal (hands-on) laboratory experiences. Since we were using a pseudonymous data collection protocol, it was out of the scope of this study to explore any potential differences in experience between the mechanical and electrical cohorts, although we note that the intended learning outcomes were the same for all students.
The Paper is structured as followed. Section Two describes the remote laboratory infrastructure, experiment design and student task; Section Three describes the evaluation methodology. Section Four presents both quantitative and qualitative results. We discuss what we learn from the survey data, its context, and limitations in Section Five.
Remote laboratory infrastructure
Remote laboratories require the connection of experiments and students, and the management of those connections. The infrastructure used to manage the connections can determine key aspects of the overall experience for both staff and students, and affect the long-term growth and sustainability of the laboratory. Over the last two decades, there has been a progression from projects being funded to explore what can be done with remote laboratories, to the creation of remote laboratories which are intended to run in a self-sustaining manner beyond the project funding date, and this is described in more detail in the following section, Section 2.1. The degree of success in sustaining long term operation of a remote laboratory is in our view tightly linked to the degree of automation in the system. Creating long-term sustainable approaches that are adopted into mainstream use remains a goal for workers in the field.
It is usually straightforward to set up a single remote experiment, for a single user. However, as the number of users and the number of experiments increase, the benefit of automation becomes apparent. The staff resource required to operate at an institutional scale (hundreds of experiments, thousands of users) is likely to be unaffordable without a significant degree of automation. The system-to-administrator ratio is a rough indicator of the efficiency achieved through automation and can range from 2:1 for bespoke, less-automated services, through to 2500:1 for internet-scale systems with high degrees of automation. 10 Note that many modern services comprise smaller components, each counting as a system that an administrator must manage. Many existing remote laboratories are likely to be categorised as bespoke systems with a low system-to-administrator ratio at present (in other words, available staff time is a strong constraint on how many experiments and users can be supported). Automation in remote laboratories offers benefits in a number of ways. For example, automating checks of the quality of results from experiments. If staff are alerted to problems as they occur, and do not need to dedicate time to manually checking the equipment, they can spend it more productively elsewhere (e.g. developing new experiments). Another example is the quality of the user experience, which is adversely affected if there are accidental or malicious interruptions to sessions. While a number of early laboratories are understood to have “made-do” with shared credentials and an honour-based booking system, automated access controls are strongly preferred because it stops well-intentioned users from inadvertently joining another's session, and reduces the opportunity for malicious interventions. There is a potential tension between introducing automation and permitting extensibility, which remains to be resolved.
Selected history of remote laboratories
Remote laboratories may not yet be mainstream education activities, but great progress is being made in this direction. The evolution of the field from exploration to sustained delivery can be visualised as shown in Figure 1, where the approximate start and end dates of several major remote laboratory projects have been plotted, based on reports on their work.11–17 Not all remote laboratories have been included, for the sake of brevity. However, with the set chosen, there are already enough data points to see a clear pattern emerging. In the earlier years, funding was typically for research projects, while from 2010 onwards the field had matured enough that there were projects funded primarily for the realisation of laboratories for sustained usage beyond the lifetime of the initial funding. Some laboratories (not included) have not been able to sustain running beyond their funded periods. Those that do continue, are usually limited to maintaining what they have. It would be preferable to see self-sustaining growth of remote laboratories so as to achieve mainstream usage. What characteristics might such system(s) have?
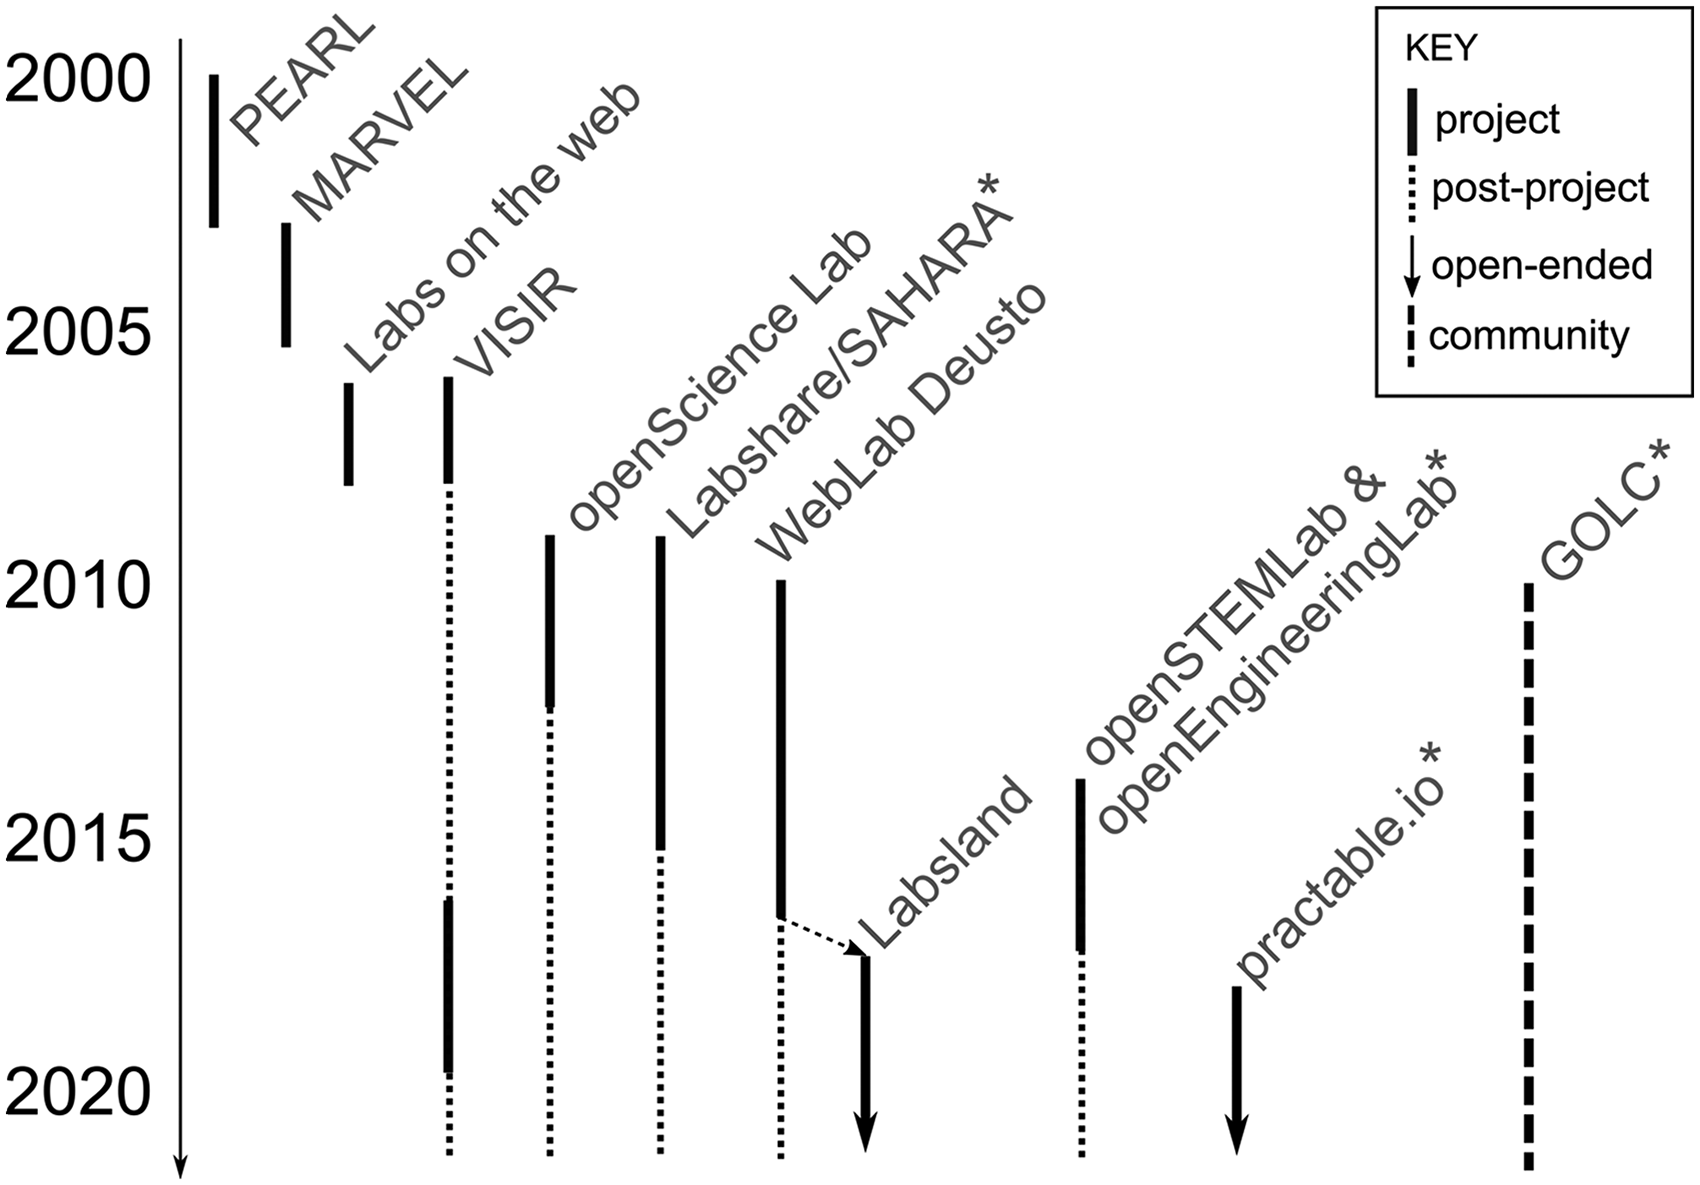
Approximate timelines for a selected set of remote laboratory initiatives. Asterisk denotes activities currently or previously associated with the Author(s) in some way.
A mixture of closed and open-source projects have emerged to date. A benefit of the closed-source approach is that capabilities developed remain unique to the organisation, at the cost of increasing the difficulty of collaborating or federating with other entities. Open-source projects are attractive from a community development point of view. A known difficulty in open-source projects is achieving sustainability, both in terms of development effort, community participation and longevity of project benefits. A strong community is often a key step in reaching sustainability. We have already identified in the previous section that automation is a key factor in determining the success of a remote lab in practice, so these two requirements (automation, sustainability) can lead us to infer that a successful infrastructure will likely combine elements such as:
(S1) sufficient performance and reliability that users are happy to adopt the system for their institution; (S2) features and tools adequate to support the delivery of educationally useful activities, by staff who do not necessarily have specialist digital skills; (S3) sufficient automation and systems integration to permit sustainable operation within the limits of support staff resource available at institutions; (S4) a total-cost-of-ownership profile that is a good fit to on-going operating budgets such as annual laboratory maintenance funding (rather than requiring significant one-off capital funding) (S5) adequate opportunity to extend the system to meet emerging needs; (S6) the opportunity to federate with others to access a greater diversity of experiments, increase through-put for time-sensitive activities, and increase reliability by sharing risk across multiple sites; (S7) the opportunity for institutions to create proprietary content to establish unique competitive positions (but encourage openness e.g. through eventual publication of designs and software, perhaps with an embargo period). (S8) an ecosystem of academic and commercial service providers, to meet the operational needs of users who do not wish to run their own servers; (S9) an infrastructure with a decentralised architecture and copy-left open-source licensing to avoid the business risks to users of vendor lock-in, and fragmentation risks to the community; (S10) interoperability with other remote laboratory systems, virtual learning environments, and third-party tools such as assessment systems.
Proponents of remote laboratories have long anticipated the development of federated systems. For example, the Global Online Labs Consortium and its various Special Interest Groups. Amongst active workers in this area now are the commercial entity LabsLand, which is building a federated community using the open-source software developed by the WebLand Deusto academic activity. Another is the open-source practable.io system from the University of Edinburgh, which we used for the work in this Paper,
18
which is being designed from the ground-up for federation.
Given the number of ways in which the elements listed above could be achieved, we expect it is likely that a similar situation will eventually arise as we have in the more mature world of virtual learning environments: multiple complementary and distinct approaches and suppliers, ranging from turn-key commercial services to customisable services that are self-deployed, each suiting their own audiences and interoperable so far as possible with third-party extensions. We now turn to the specifics of the system we used for the work in this Paper.
Practable.io infrastructure
In this section we concentrate on a description of the requirements and implementation of the video and data relay system, and the interim booking system. The specifics of future developments such as advance booking, experiment management, federation, de-centralisation, and integrations with virtual learning environments and identity servers are not discussed because they are the subject of ongoing work.
Our main requirement is for a system that would be easy to adopt by other academics in due course, who may not have the permission or make custom network arrangements, have funding for expensive streaming computers, or have support staff available to help students get set up with custom software. We also require the relay system not to have strong opinions about the choice of audio, video or data stream formats, or how the streams are arranged, combined, and booked. These translated into some specific technical requirements for the video and data relay system, which also address aspects of the system level requirements, as follows:
(R1) work behind restricted firewalls with multiple levels of network address translation, and that only permit outgoing connections to port 443/tcp (S2,S4) (R2) support switching relay servers mid-experiment so that spot-priced (i.e. cheaper) server instances can be used (S4) (R3) support authenticated access to secure sessions against unwanted interruptions (S1,S3) (R5) work with any browser a student is likely to use by default, without requiring any installations of plug-ins or extensions (S3) (R6) require only a headless (i.e. command-line) operating system to run, so that low-cost single-board computers can be used as the streaming devices (S1,S4) (R7) be able to cope with the relay-server changing mid-experiment (this translates into a requirement to be able to change the destination of the stream, without re-connecting to any USB cameras or microphones, because USB reconnections can be unreliable on some systems) (S1,S4)
A combined data and control flow diagram for the video, data and control connection between an experiment and a user is shown in Figure 2. We are using Raspberry Pi 4 (4GB) single board computers using a linux-based operating system, which uses systemd for managing system tasks. The single-board computers are configured either manually or via ansible. When located behind a firewall, a custom shellrelay system is used to connect securely to the experiments and install/update the configuration, scripts and applications.
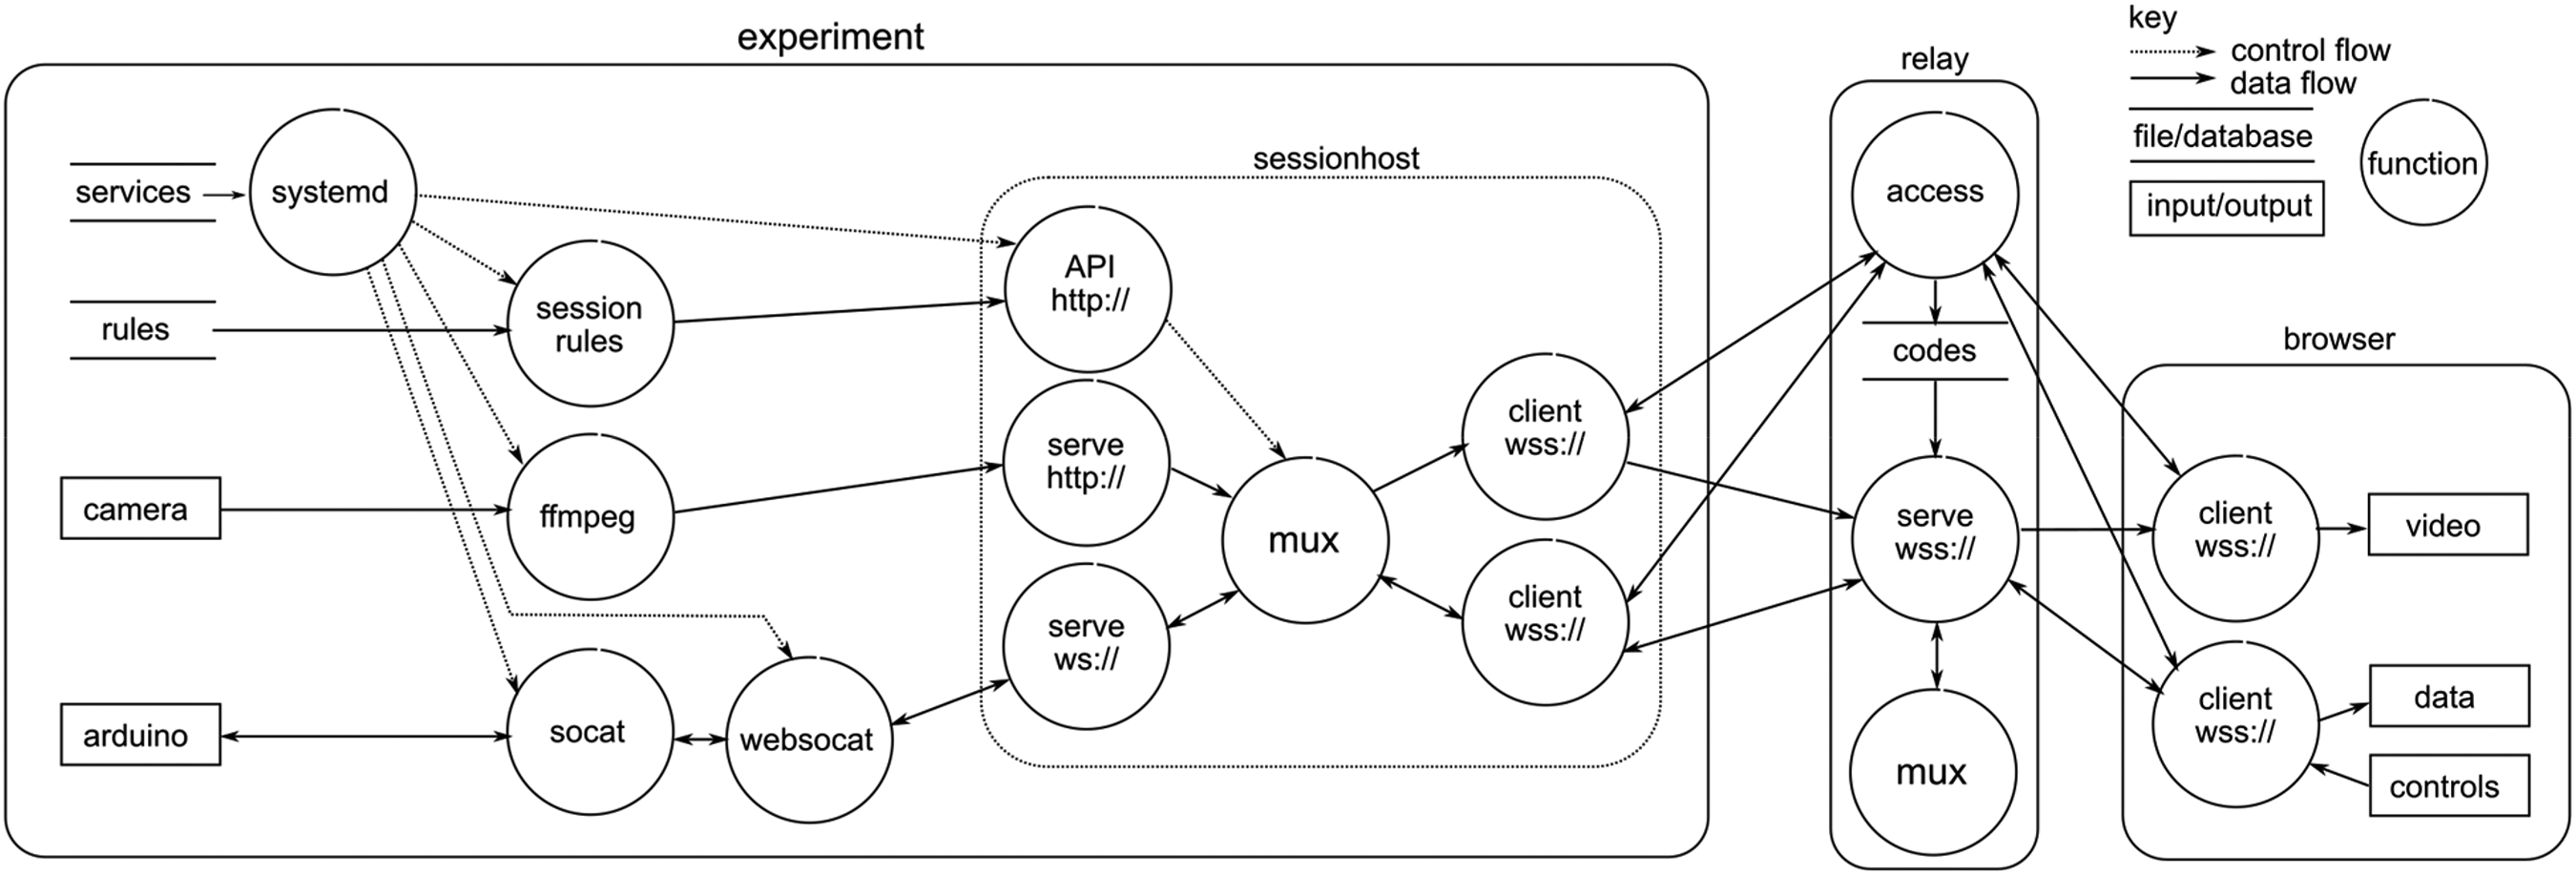
A Combined data and control flow diagram of a user connecting to an experiment via a relay, to obtain video, data and send control (credential flows are not shown for clarity).
Once configured, on booting the sessionhost application is started by the operating system. Then the sessionrules script is run to configure the sessionhost via its HTTP API. This is preferable to using configuration files because of the flexibility it provides in large scale deployments. 19 Using the API, the video relay connections can be changed to new routings or new relays, as often as every second if desired. In a stress test of the experimental side of the system, the video was directed to a new video relay location every second for 24 h, with no appreciable deterioration in the latency of the video feed transmitted from the experiment. This is quicker switching than required for spot-priced servers, which typically receive warning of a few minutes that the relay instance needs to be shut-down. The mechanism for hot-switching is not shown in Figure 2 for the sake of clarity.
Next, systemd starts a service which uses ffmpeg to stream video in MPEG-TS format to the http:// endpoint of sessionhost The sessionhost is intended to handle frame-based streaming formats. It relies on the burst nature of streaming data at each frame to ensure data for each frame is flushed through the buffer and does not require any understanding or introspection of the video data itself. Audio streams can be sent by running an ffmpeg instance which connects to a USB microphone. MPEG-TS streams permit audio and video to be multiplexed simply by interleaving the audio and video packets. We disabled the audio for our initial usage of the system because the experiments were in a public space. Contact microphones are an attractive future possibility for capturing the sounds of the experiments but suppressing ambient conversations.
Data and control messages are passed between the Arduino microcontroller and sessionhost via scripts which run websocat and socat in a manner similar to the connection that the Arduino online-IDE uses for programming. These are routed by a separate sessionrelay endpoint so that there is no need for the user interface to introspect the video stream to extract data and control packets.
Connections to the relay are secured by JWT tokens. For the experiments, their connections are valid until their next scheduled physical or virtual maintenance period (perhaps a few months or a year). For users of the spinning disk experiments, the tokens last from 5–90 min depending on the length of session they chose. Longer sessions are possible, but not required by this course. Whether by an experiment or a user, their token is submitted to the relay access point via an HTTP PUT request The access application assigns a routing on a relay server instance. Any subsequent tokens submitted for the same experiment are assigned to the same relay server. This layer of indirection is included to permit spare capacity management, and transparently accommodate failure of the serve-and-mux services. The authentication to the serve-and-mux task is via a one-time code which is valid once within a 30 s window. The connection is terminated at the end of the access period specified in the original authentication token. This approach allows the booking system to pass a time-limited JWT token to the user interface, which then uses that token to connect, and reconnect as required if the network transport is interrupted e.g. by poor mobile signal, but only for the duration of the booking. This avoids reverting to the booking system for new authentication when a connection drops unexpectedly, which would have made retaining experimental state difficult. The code which permits access to the serve-and-mux task is passed in the response to the PUT request, and even if this is intercepted and decrypted the consequence is limited to a single-time limited connection. The relay also knows about read and write permissions, which are specified in the JWT tokens submitted to the relay access point. The booking system only gives users read access to the video and audio stream, while experiments get read and write access to both. When a group of users is using the same experiment, their read-only access prevents a malicious user from injecting unwanted video or audio frames into the stream. On the other hand, users are allowed to send control commands, and potentially conduct intra-group messaging if the experiment and user interface support it, although it is likely to be preferable for human-to-human messaging to be conducted in the standard messaging tools supported by the educational institution.
Spinning disk experiment
We wished to build a set of a spinning disk experiments that could replace a pre-existing proximal laboratory exercise. The pre-existing laboratory was developed around the Quanser Qube spinning disk experiment, and the associated coursework had been evolved from the original Quanser workbooks by the course team. Custom spinning disks of different weights had previously been manufactured in-house, and used in the in-person laboratory for a number of years, to provide different inertia systems against which students could explore and apply the principles of simple first and second order systems and their control.
For the remote version of the experiment, twelve separate “kits” were manufactured in-house. They included a DMN37BA brushed DC motor (12V), a 500CPR optical encoder, custom built weighted disks (ranging from 43–110 grams), as well as laser cut wooden stands and boxes to house the physical and electronic hardware. An off-the-shelf webcam was used for some views (see Figure 3) as well as the Raspberry Pi camera for an alternative, top-down view on the experiment. Each experiment had only one camera, although multiple camera views are possible with the system. Figure 3(a) shows the user interface students used to control and analyse the remote hardware. Figure 3(b) provides an annotated view giving the name of each component as it is referred to throughout this paper.
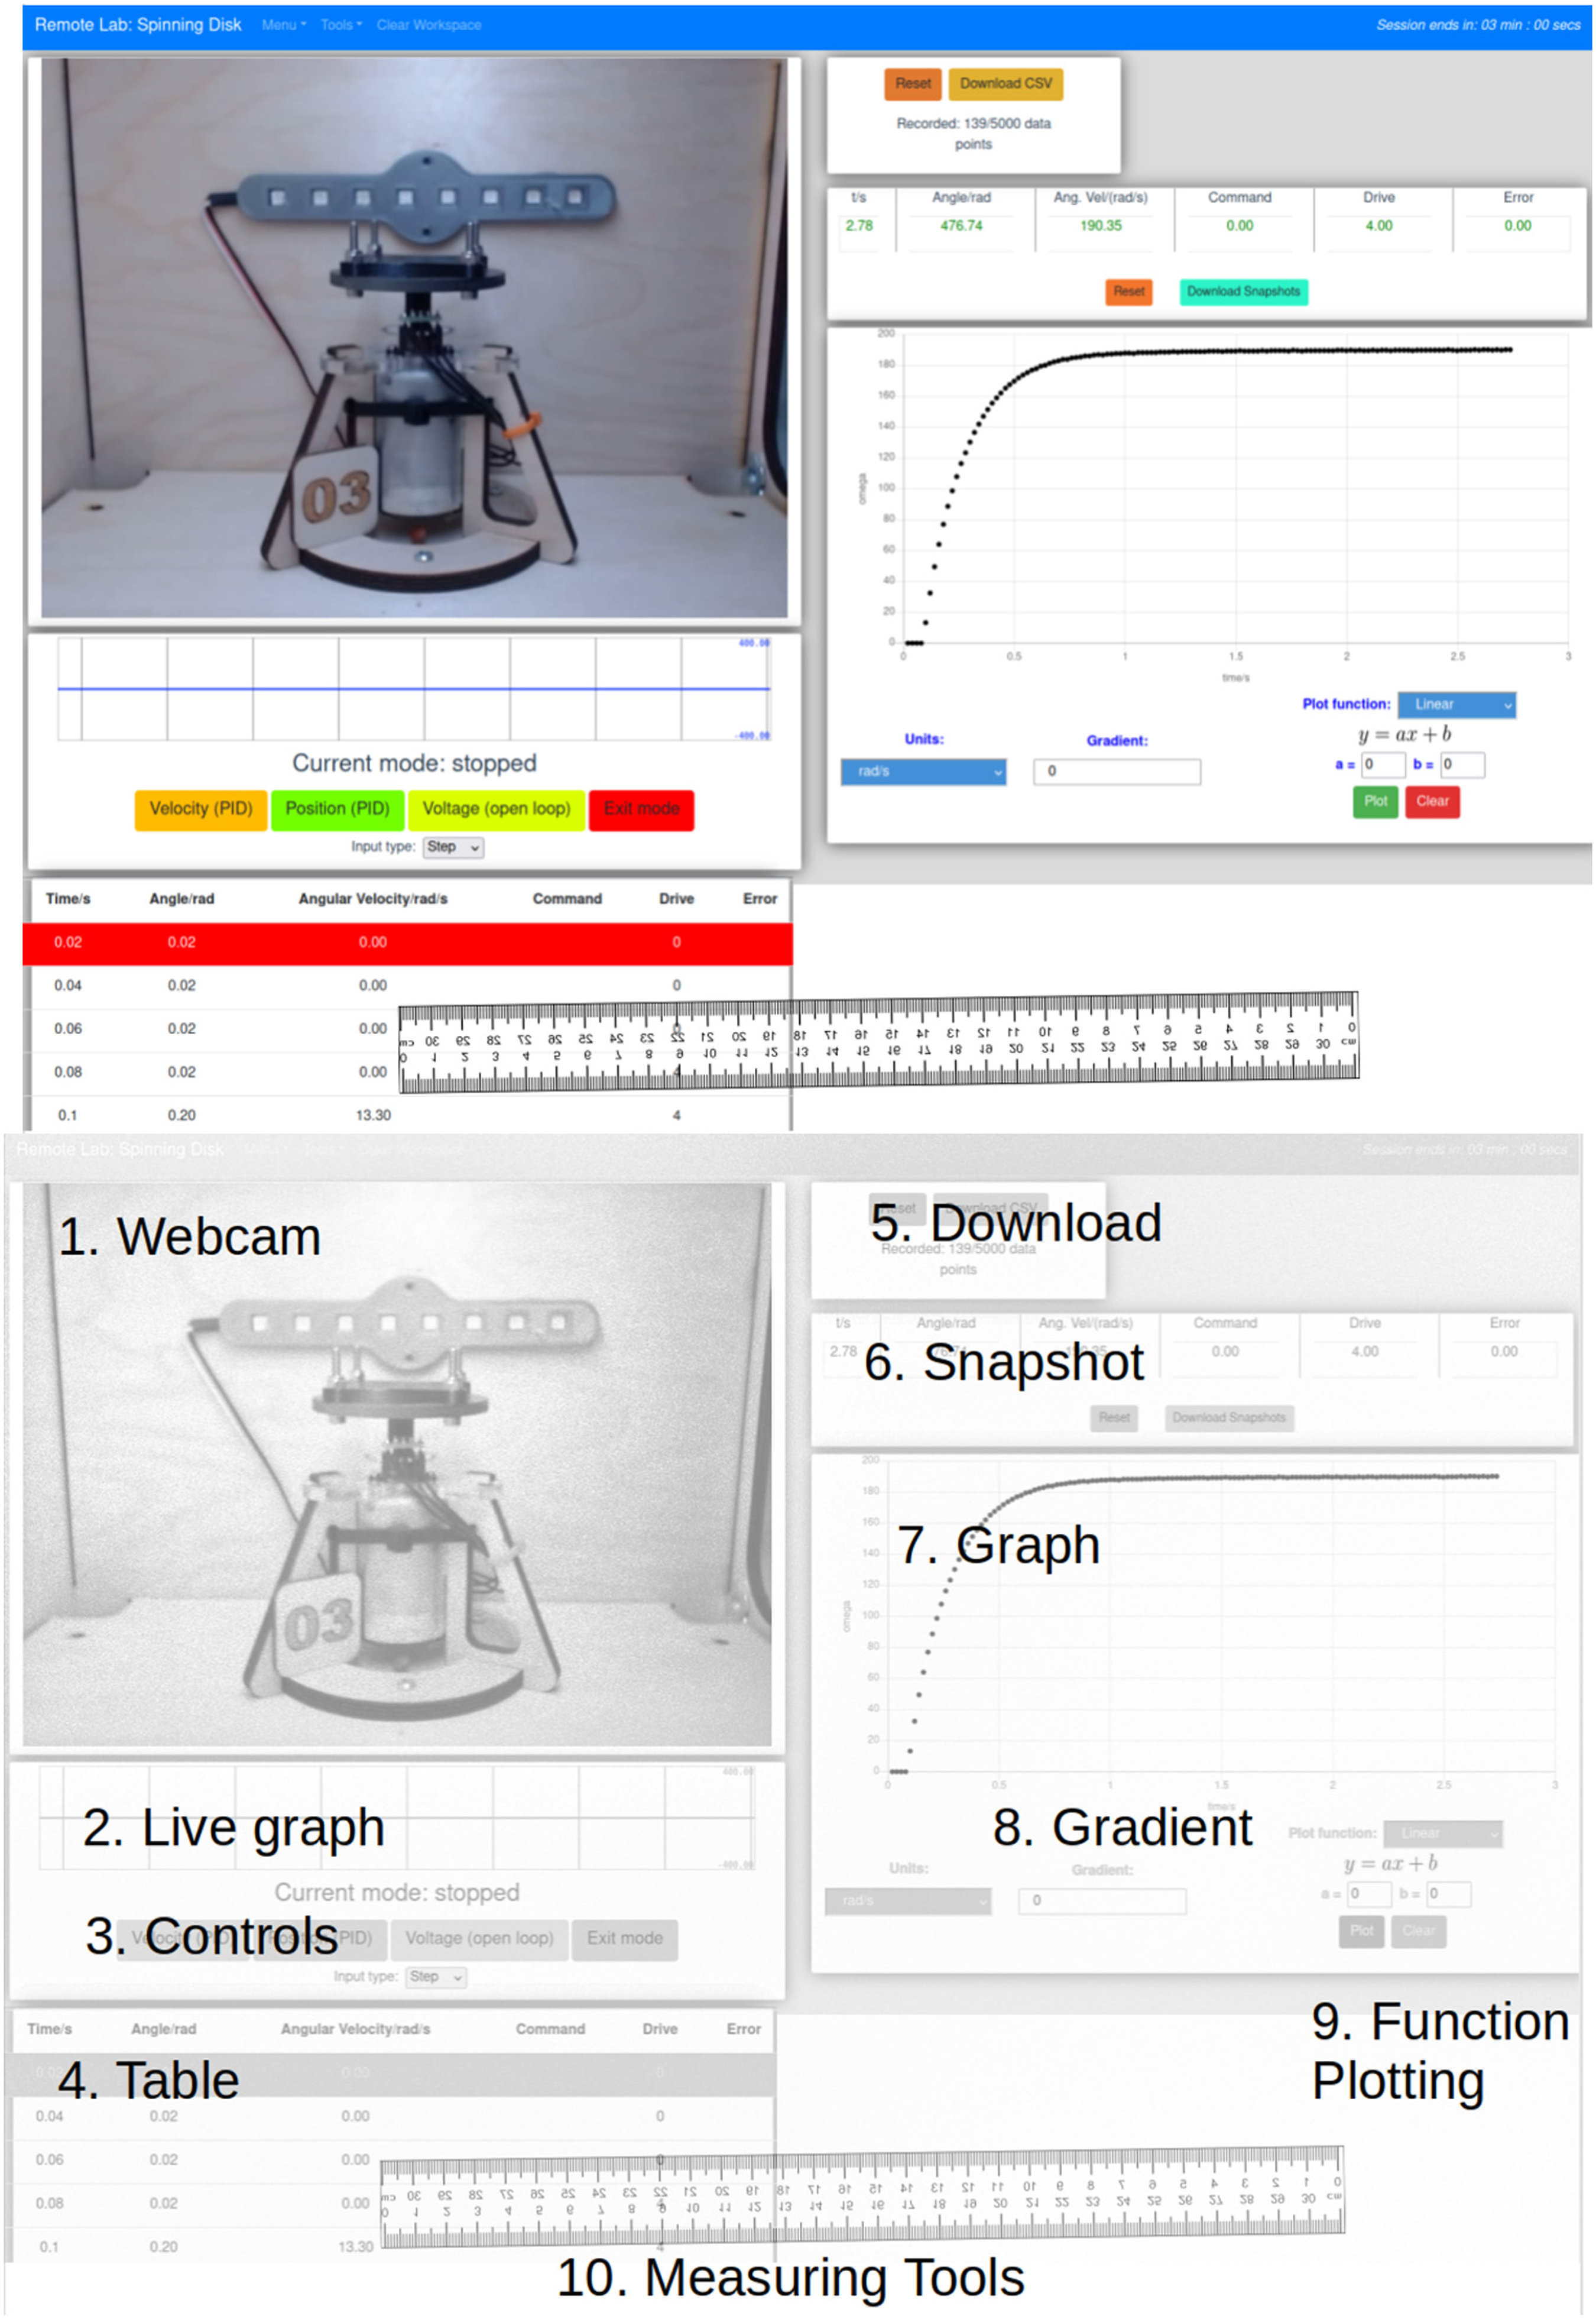
a) The user interface of the controls engineering remote laboratory, b) with annotated components.
The hardware design files, firmware and software for the experiment, as well as the core system, are already available as open-source software at https://github.com/practable, primarily under the GNU Affero General Public License, and no permission is required to adopt the system.
The lab was performed individually, with students producing individual lab reports. The lab was done by choosing the hardware mode, setting parameters (voltage, PID parameters), and then collecting and analysing angular speed or displacement data from the hardware, so as to characterise the system and calculate appropriate coefficients for tasks such as position and velocity control of the disk. This analysis could be performed with tools available in the UI, although the raw datasets could also be downloaded for analysis offline if preferred.
Students followed a series of predefined workbook tasks that asked them to measure DC motor characteristics and then utilise these measured values to compare the theoretical response of a PID controller and plant to step and ramp inputs.
Task 1: Students were asked to confirm whether the motor obeyed the linear relationship ω = KV. They used the motor in open-loop mode to apply a voltage to the motor. The angular velocity could be identified using the ‘Snapshot' or ‘Graph' tools, displaying the raw data in the ‘Table’ or by downloading and analysing in external software.
Task 2: Involved students using the DC motor in open-loop mode to apply a step voltage. They collected motor angular speed data and either used the UI tools or downloaded data for external use in order to identify the gain and time constant of this plant (DC motor + disk) for 2 different weighted disks.
Task 3: Students tuned a PID controller to apply a step position to the DC motor within set constraints.
These tasks could all be achieved using the data streaming from the hardware – angular position, angular velocity, time, motor voltage and PID error signal. They had several modes of visualising the data: UI Table, Snapshot, Live graph (plots continuous data stream) and Graph (plots recorded data) tools as well as the ability to download data for analysis externally. Additional tools, such as the ruler overlay (Measuring tools), gradient and function plotting tools could help them explore features of the motor response whilst not being necessary to complete the tasks.
Methodology
Student perceptions were collected via a voluntary, online survey accessed after the practical work was completed. The survey comprised the ‘User Experience Questionnaire’ (UEQ) 20 as well as custom survey questions. 21 Likert style questions have been analysed in a quantitative manner to identify statistical significance as well as correlations between ratings. Open text responses have been used to identify potential updates to the remote laboratory system as well as to perform a coded content analysis to highlight any trends in the feedback received.
The UEQ provides a quantitative measure of usability and is used to evaluate the overall user experience as it relates to its six measured attributes (see Figure 4). The custom survey provides a broader context for the usability results, helps isolate factors that may contribute to the UEQ attributes, as well as evaluating individual components of the remote lab user interface.
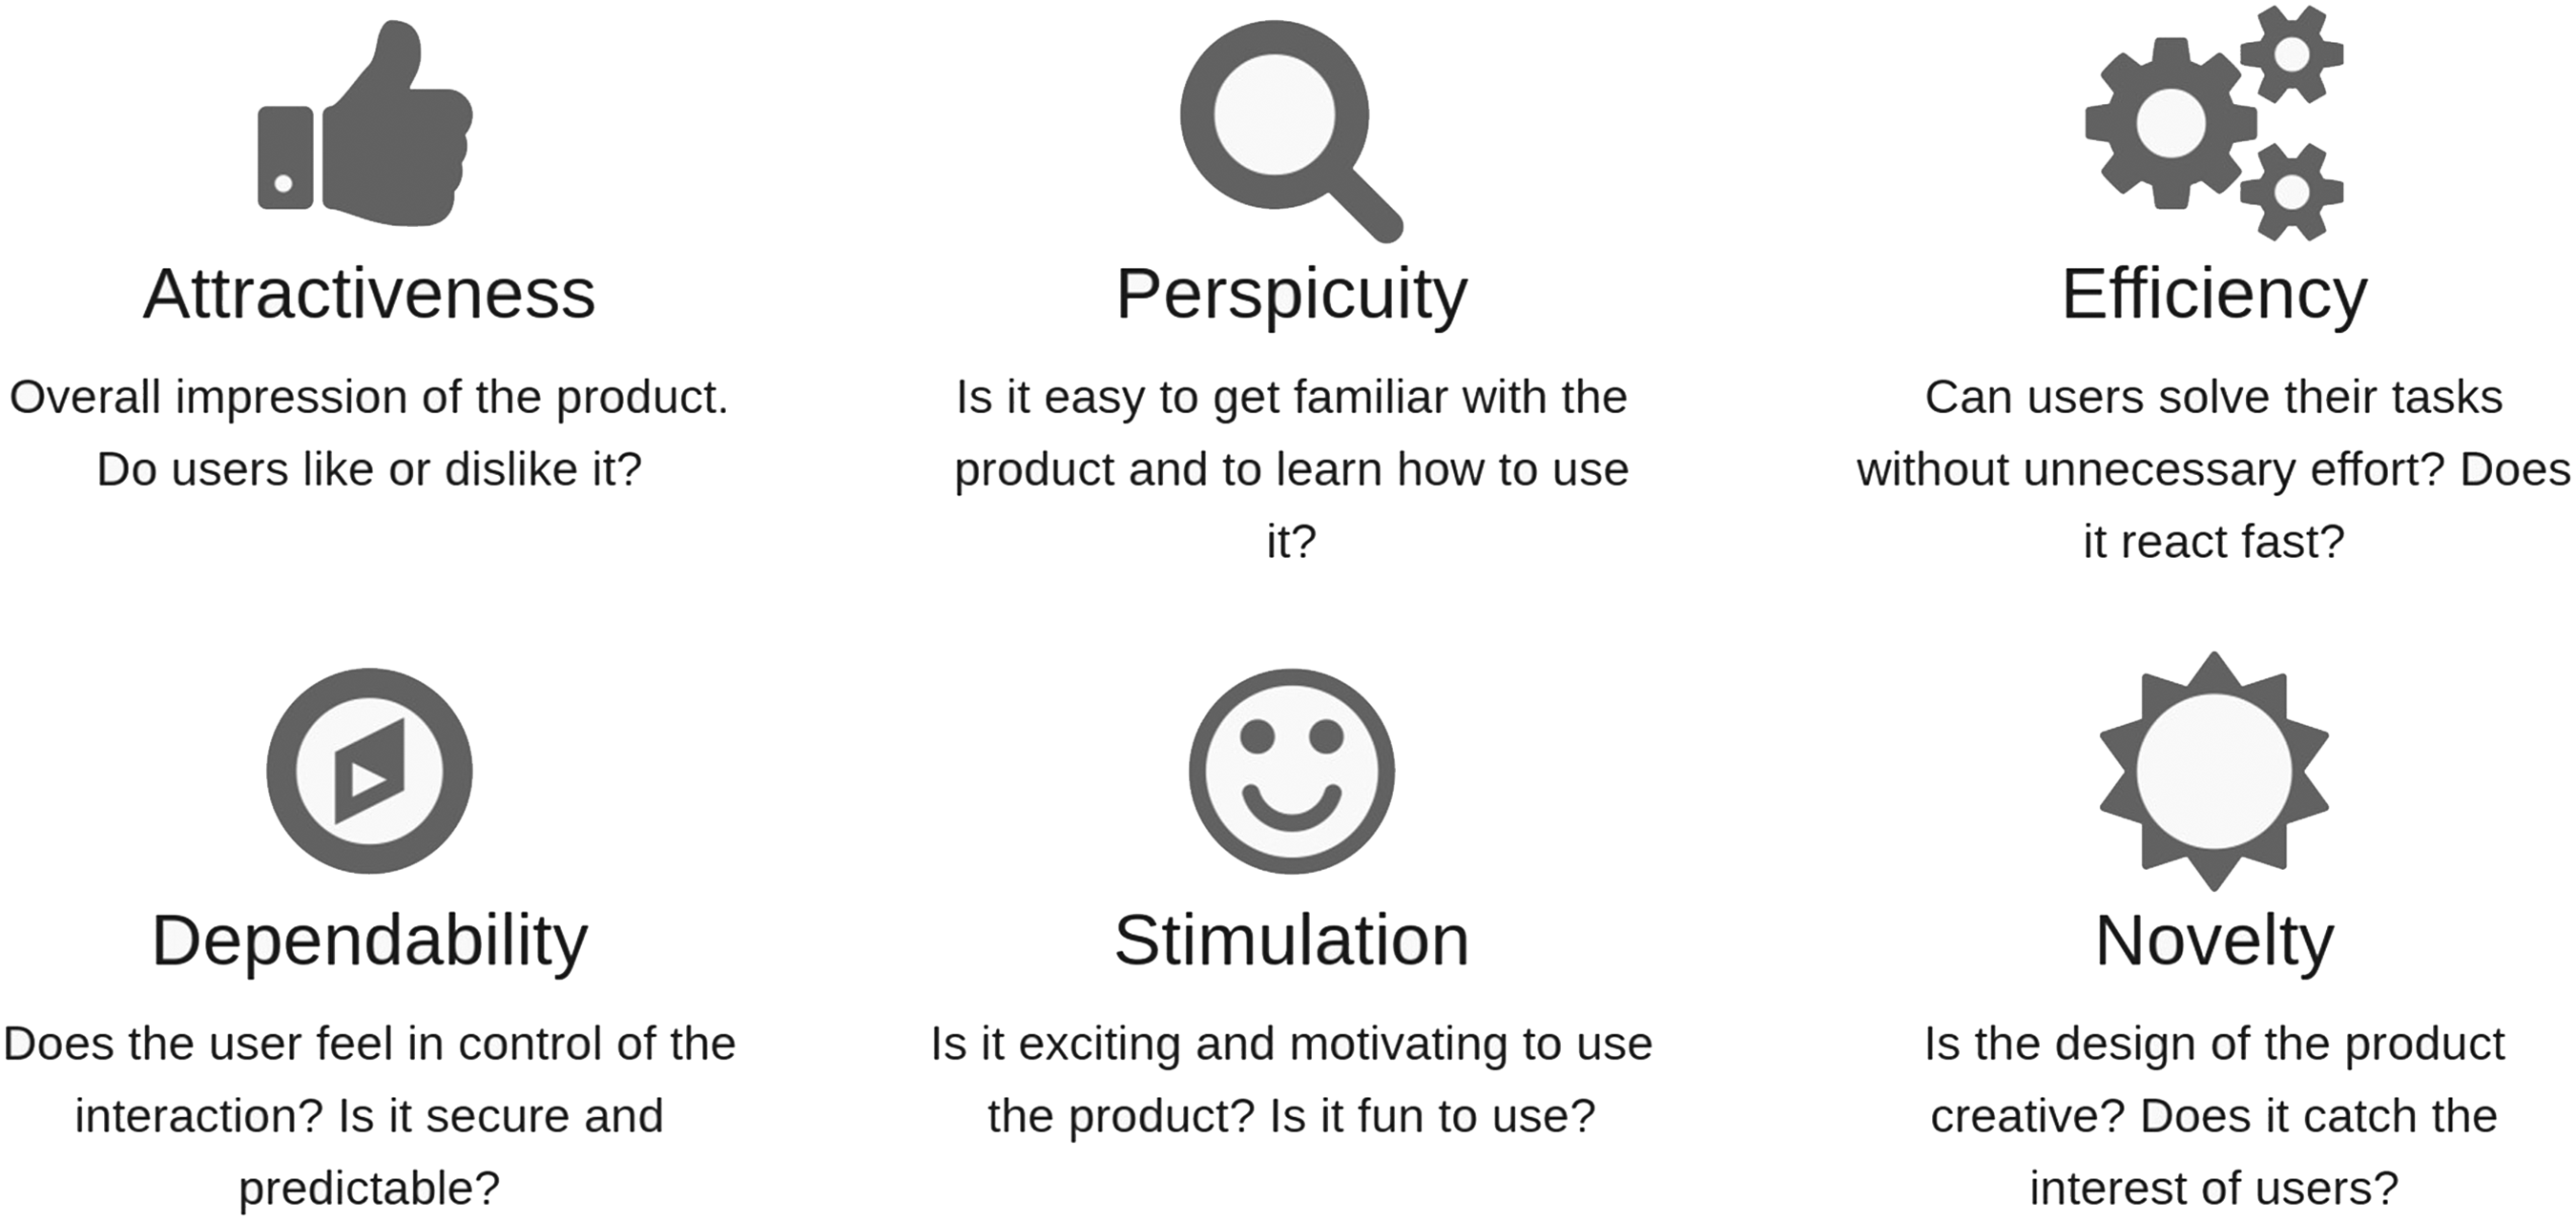
Usability attributes measured by the User Experience Questionnaire (UEQ). Reproduced from https://www.ueq-online.org/.
To test whether responses are significantly different from ‘Neutral’ (0), the 1-sample Wilcoxon signed-rank test is used. Correlations are calculated using the Kendall tau rank correlation coefficient. Statistical significance is set at the 5% level for tests (unless stated otherwise) and common effect size bands are used: 22 ≥0.50 strong; ≥0.3 medium; ≥0.10 weak. Effect size is calculated from the Z statistic divided by the square root of number of samples.
Of the approximately 250 students enrolled on the `Controls and Instrumentation Engineering 3' course, only N = 24 complete surveys were received. Three respondents were determined to have provided inconsistent responses; therefore, the following analysis is performed on N = 21 student surveys. With only a ≈10% response rate the data is likely affected by selection bias - students who have had particularly extreme experiences are perhaps more likely to respond.
Results
User experience and usability
Scores for each UEQ attribute can range from −3 to + 3; however, scores outside the range −2 to + 2 are unlikely according to the authors of the UEQ. Mean scores on each of the UEQ attributes between −0.8 < x̄ < 0.8 represent neutral responses.
Mean ratings for each UEQ attribute were as follows: attractiveness = 1.13, perspicuity = 1.51, efficiency = 1.08, dependability = 0.76 (1.06 with outliers removed), stimulation = 0.88 and novelty = 1.17. Students have rated the remote lab and UI positively across all attributes, with the exception of a neutral score for dependability.
Although the UEQ attempts to measure usability across six independent attributes, we found, in particular, a strong correlation (τ = 0.55) between attractiveness and dependability. This hints at the potential importance of ‘predictable control’ over the remote lab system and will be explored further when discussing how UI components were rated in terms of making students ‘believe they were in control of their experiment’ (section 5.3).
Emotional response
Students were asked to report their emotional state after completing the practical work. By refactoring all the emotional options into a binary choice of ‘positive' or ‘negative' a Chi-squared test was used to test whether the distribution was significantly different from that expected through random selection. In this case it was found that there was a significantly positive response (χ2 = 7.16, df = 1, p < 0.01).
UI ratings
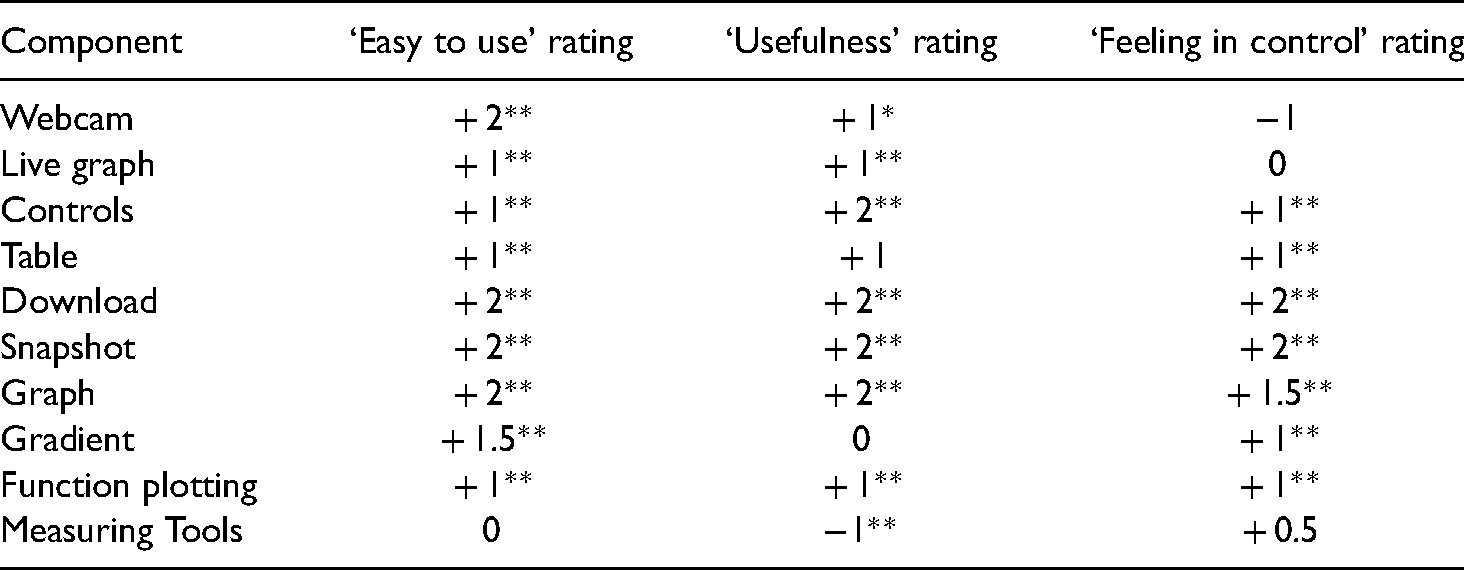
Table 1 provides an overview of how user interface components were rated by students in terms of 1) ease of use, 2) usefulness in completing the practical tasks and 3) how much the component made them feel in control of their experiment. All components were rated on a 5-point scale from −2 to + 2. As may be expected from the high score for perspicuity, the median rating of ‘ease of use’ for all components was positive, with the exception of the ‘Measuring tools’. Considering the user interface was designed to accomplish the intended practical tasks it is not surprising that most components have been rated positively in terms of ‘usefulness’. ‘Feeling in control’ will be discussed further in the section 5.3.
Ratings of the user interface components in terms of how easy to use they were, their usefulness for completing tasks, and how in control of the experiment they made the user feel. Rating is the median response between + 2 and −2. Effect sizes of test of difference from 0 rating is shown: **large effect size, *medium effect size, otherwise a result is non-significant or a weak effect size.
Likert statements
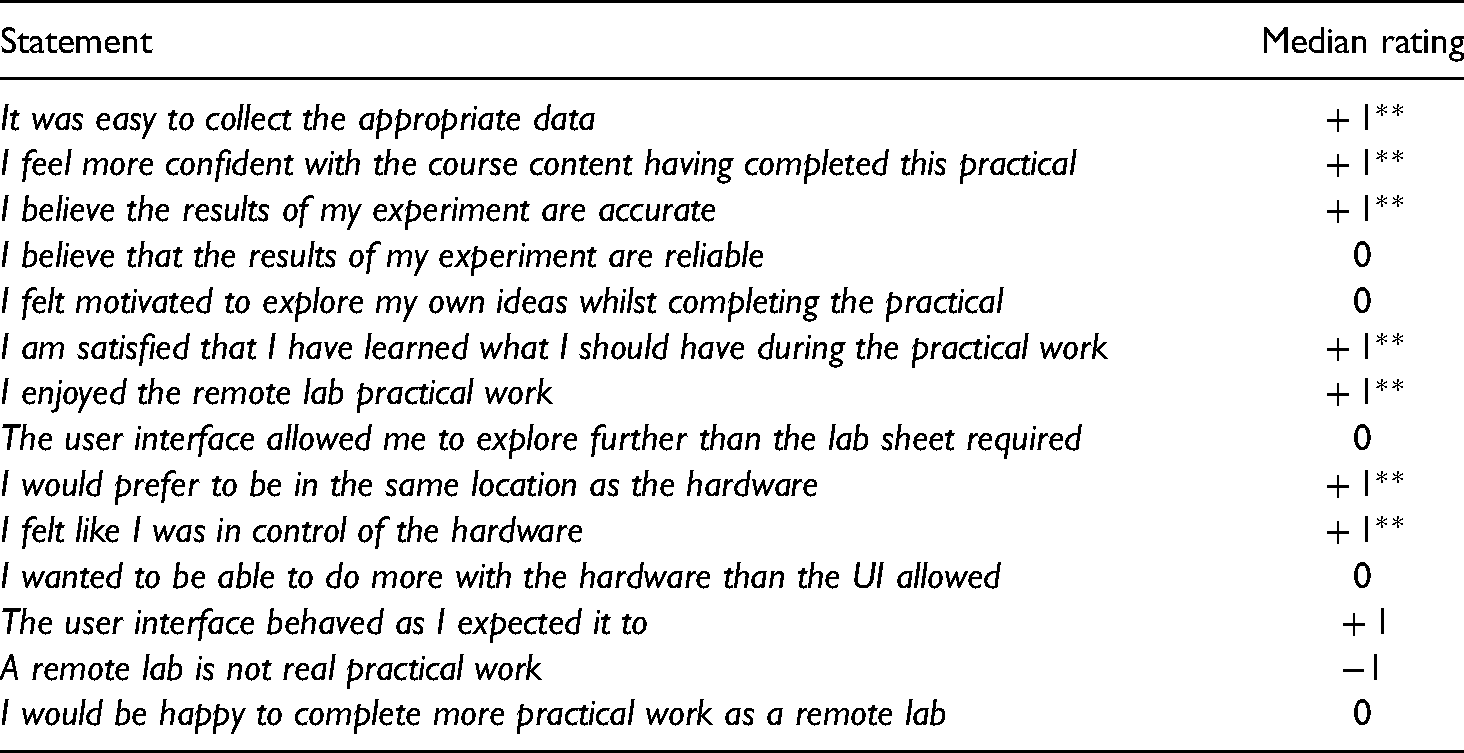
Students were asked to rate their agreement with several statements regarding their overall experience of the practical work. Table 2 presents select results relevant to the discussion in this paper.
Select statements from the student survey. Rating was between Strongly agree ( + 2) and Strongly disagree (-2). Effect sizes of test of difference from 0 rating is shown: **large effect size, otherwise a result is non-significant or a weak effect size.
Perceived theory-measurement disparity in remote labs
It was clear in the development and deployment of the remote laboratory that there was going to be a disparity between the ideal theory of control systems that students were learning, and the reality of the low-cost, DC motor control system that they were being asked to use. This was because of significant bearing friction and a large dead-band. This was anticipated and therefore students were asked, if they found that theory and reality didn’t align, what they believed the cause of this difference to be. We can see from Figure 5 that there are a range of beliefs expressed regarding the conflict between theory and reality during the practical work. The most selected option was ‘the theory is limited’, although approximately half (52%) of all responses involved the lab not being sufficient in some regard. The two ‘Other’ responses were: ‘There are losses in the practical system that are not present in the theoretical calculations’ and ‘I'm unsure as to whether the theory is insufficient or the lab had problems.’
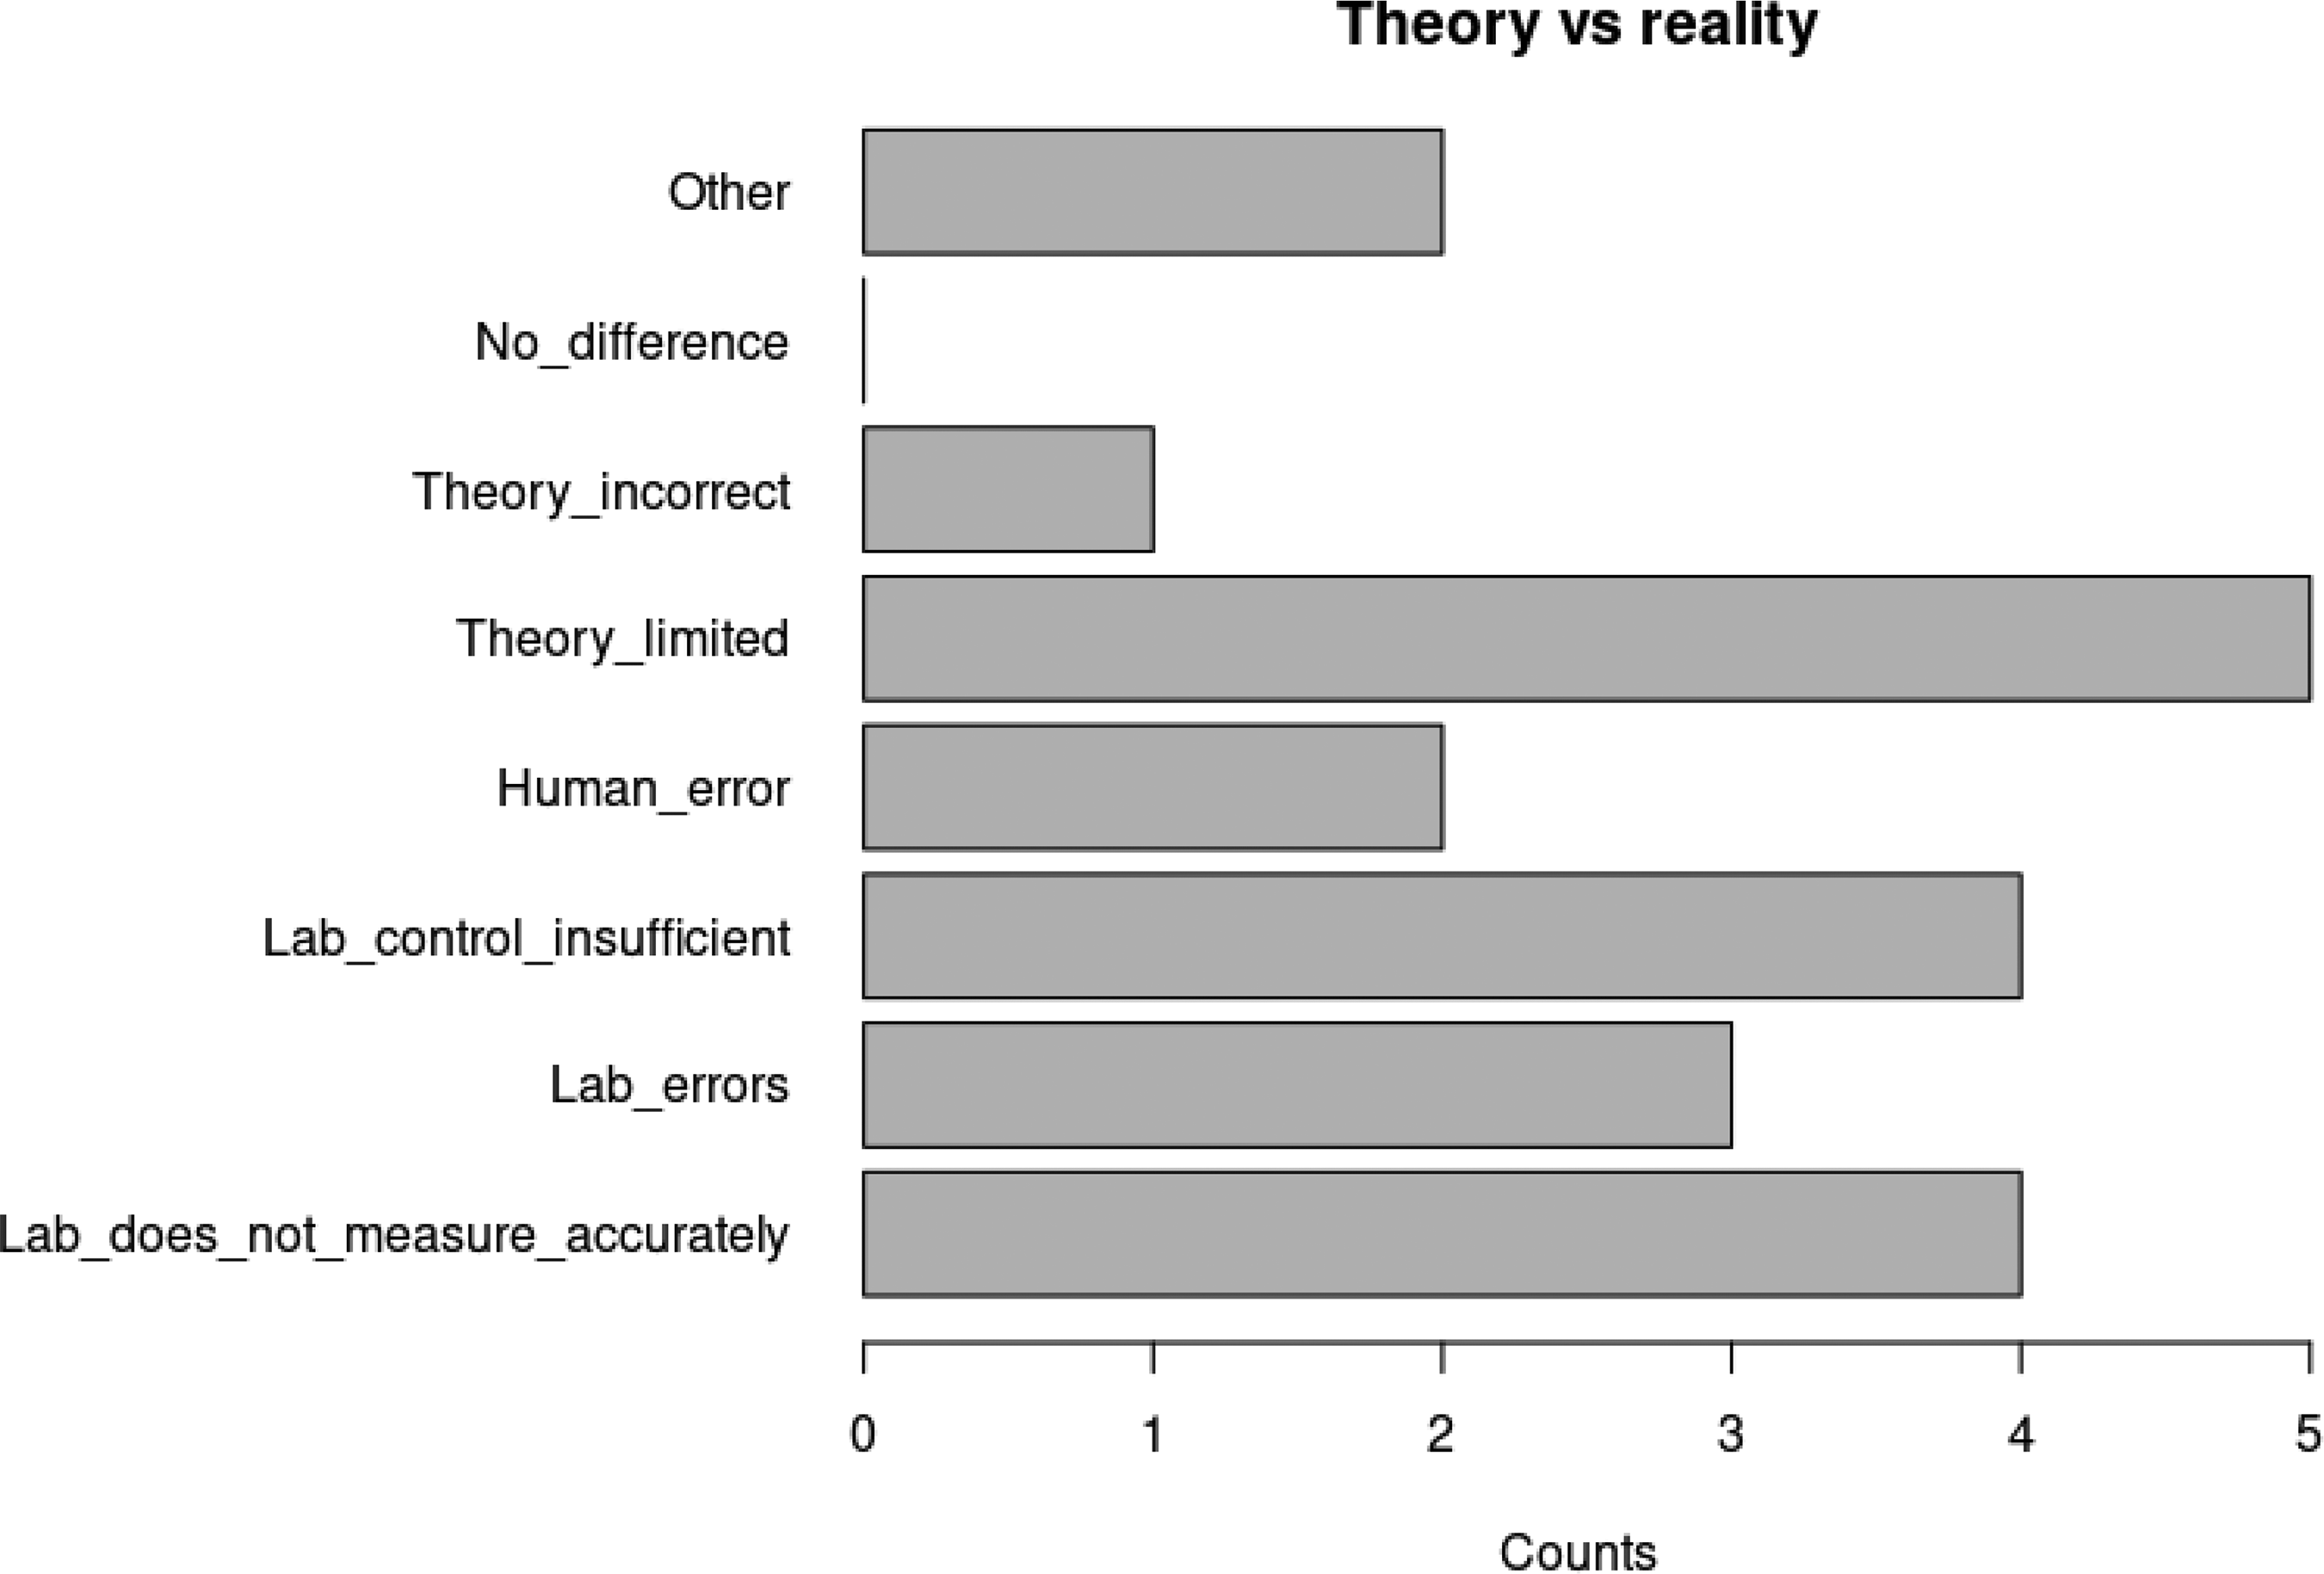
Distribution of student beliefs in why theory and practical measurements differed.
Interestingly, no correlation appears to exist between a user's overall usability score (UEQ attribute average) and their belief in the reason for differences between theory and reality. Similarly, no clear correlation exists between the dependability attribute and student belief in the reasons for the difference. Additionally, there was no correlation between the number of mentions of technical issues (see Section 4.4) in the qualitative responses and the belief in the reasons for the difference.
Skills perceptions
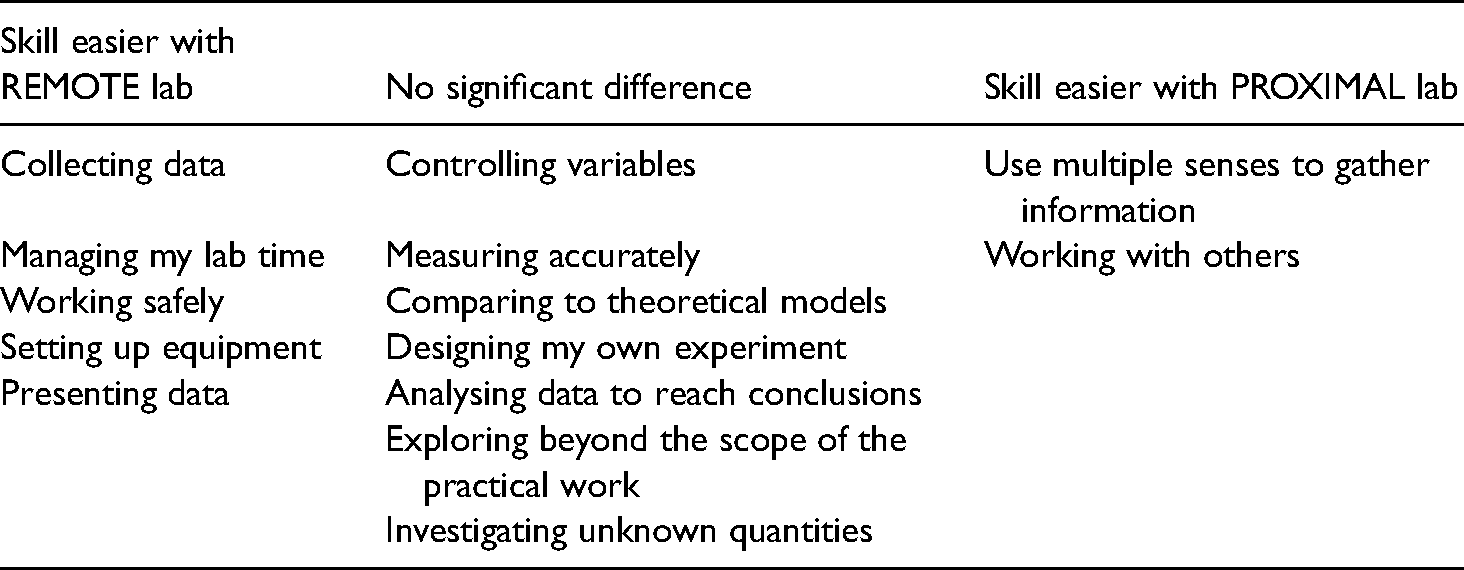
Students were asked to rate on a scale from ‘Much easier with remote lab’ ( + 2) to ‘Much easier with a proximal lab’ (-2) the skills-based tasks presented in Table 3 (based upon Feisel and Rosa). 23 We can see from Table 3 that there is a perception amongst respondents to the survey that one or other lab mode can more easily allow the demonstration of certain skills. However, it is also important to note that there is a core of fundamental lab skills that survey respondents believe are just as easily accomplished with a remote lab as a proximal, in-lab experience.
Student perceptions of whether skills-based tasks are easier to accomplish with a remote or proximal lab experience.
Content analysis
In order to explore whether any themes arise in the open feedback from students a content analysis was performed. First, student responses were coded as either positive, mixed or negative based upon their response to the ‘emotions felt after completing the practical work’ survey question. Then, each basic unit (normally the full response to a question but potentially individual statements if separate points were being made) was coded, if appropriate, as a
We can see from Table 4 that users considered to have had negative experiences were more likely to provide comments than students with positive experiences. All students with a negative response gave at least one reason for their response within the feedback. The nature of the survey was heavily skewed towards identifying problems with the UI and remote laboratory, so this distribution is not unexpected. We can also see that technical issues were the most mentioned in negative respondents, suggesting that technical issues may be the most impactful on student experience. This is backed up by the negative correlation between the number of counts of technical issues mentioned and the attractiveness UEQ attribute (τ = −0.4).
Average count of issues mentioned in the open text response questions. Issues are grouped into technical, design and teaching for respondents rated as having positive, mixed or negative experiences.
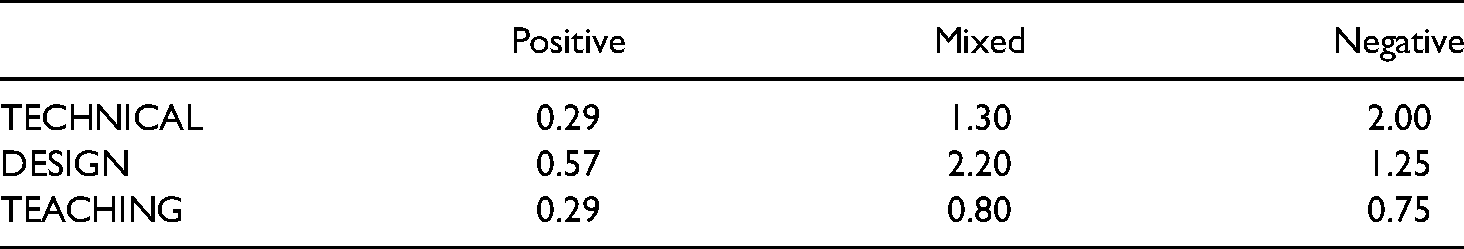
There was also a strong negative correlation between mentions of teaching issues and the novelty rating (τ = −0.51), reminding us that the remote lab system cannot be evaluated outside of the teaching context.
Discussion
Improvements
One of the purposes of seeking student feedback is to improve the remote laboratory experience. To that end, open response questions within the student survey were used to make upgrades to the remote lab user interface. A number of comments relating to the layout of components and relative positions of buttons has led to the development of a user-controlled, reconfigurable UI. Students can now independently control the position of each component, scroll each half of the screen independently and choose from pre-set ratios for sizes of the left and right split of the screen. This may contribute to student autonomy and perceptions of control and will be explored in future studies.
Although a separate instructions page was available for student use, comments regarding misunderstandings as to how to use components have led to the development of a Toolbar for each component that includes a pop-up help dialog box and options tools for additional control over UI components.
UEQ and data collection
There are questions to be asked surrounding the appropriateness of the UEQ as a tool for measuring learning experiences. Usability surveys are best used to evaluate interactive tools when they are being used to get a user to an end goal as efficiently as possible. We could argue that for many practical experiences the goal is to get to a better understanding of the theory as efficiently as possible, but as we begin to explore how remote laboratories can be used for skills development it may be that we are providing inauthentic experiences by making interactions too easy or efficient (e.g. automatic data collection vs. direct measurement).
As noted by Burridge et al. 24 computer mediated remote labs are well placed for passive observation of students whilst they perform practical work. The collection of appropriate interaction data could be used to help build learner models, help in assessing students’ practical skills and to further develop the causal connections between student perceptions of their remote practical experience and their interactions with the user interface. This passive data collection will also help explore how the design of user interface elements contribute to user beliefs in the control they exert over their experiment and their feelings of immersion or autonomy. Typing in text or clicking buttons may provide easy but inauthentic means of controlling remote hardware and it would be interesting to explore how varying the means of controlling the hardware and data collection/analysis affects user perceptions.
Feeling in control/autonomy
Perceived lack of autonomy is a recognised issue within remote lab research 25 and was therefore a key concern in this study. Although we have highlighted that, from a usability perspective, dependability (or predictable control) is rated lower by respondents to our survey than other usability attributes we have not yet reached a solid foundation upon which beliefs in dependability are based and suggest that it is likely to have many contributing factors. When a user considers the feeling of predictable control they have over the remote lab system they could be considering: the booking system, the user interface, the hardware, or comparing the overall remote experience to the more common proximal one. Identifying what constitutes the dependability rating is beyond the capacity of this survey; however, hints to how remote lab design could impact user beliefs are presented below.
This survey finds that dependability does not correlate with agreement with the statement ‘I felt like I was in control of the hardware’ (the statement itself did receive a significant positive response). This potentially suggests that hardware control was not the key factor in students believing they were in control of their remote lab experiment. Similarly, dependability does not correlate with increasing mentions of technical issues (which includes hardware issues) within the qualitative feedback.
However, dependability was correlated with agreement with the statement ‘The user interface behaved as I expected it to’, suggesting the possibility of a stronger connection between user perceptions of predictable control over their experiment and the interactions they had with the user interface.
Table 1 reveals that most components were positively rated when students considered whether that component made them feel in control of their experiment. However, some core components such as the ‘webcam’ and ‘live graph’ tool were not similarly rated - with the webcam in fact having the opposite effect. Issues surrounding the ‘backgrounding’ of the webcam have been identified in the literature. 26
It is interesting to compare components that effectively perform the same function but have different modes of interaction via the UI. The ‘Table’ is a component that automatically stores each data set received from the hardware and displays it on the UI. The ‘Snapshot’ instead displays the same data but only for the values at the instant a user clicks a button. The user has no additional control over what data is collected, how data is measured or how it is displayed, simply control over when and how many pieces of data to collect. This interaction provides a significant difference in ratings of ‘feeling in control of my experiment’ between the two components (V = 4.5, p < 0.05, effect size = 0.447).
A similar comparison can be done between the ‘Live graph’ and ‘Graph’ components. Both are automatically displayed - the ‘Live graph’ continuously; the ‘Graph’ only when data is actively recorded and yet students reported a significant difference in ratings of ‘feeling in control of my experiment’ (V = 94, p < 0.05, effect size = 0.616). The ‘Graph’ component allows users to hover over data points to show values as well as click data points to move to the corresponding data in the ‘Table’ component. These relatively simple differences may be contributing to significant differences in student perceptions of the control they have over their experiment.
Evidence suggests that remote laboratory design can directly affect the control that students feel when interfacing with remote hardware and that this control appears to be framed around the interaction with the user interface rather than belief in control over the hardware. Therefore, an exploration of control of task in contrast to control of hardware could be an interesting future study.
Skills and perceived theory-measurement disparity
Although a number of studies have found that conceptual learning gains using remote labs are as good, if not better, than traditional, proximal labs,25,27–29 scientific inquiry skills are the least assessed aspect of lab work. 30 Lowe et. al. 25 identify practical skills as a possible focus of future labs.
Aside from the practical issues identified in Section 2, it could also be argued that remote laboratories have not yet made it into the mainstream of practical work, in part, due to belief that they limit the development or application of specific engineering skills during practical experiences. Student perceptions (Table 3) support the view that remote and practical laboratories have different applications. However, remote laboratories have traditionally been designed to meet the needs of specific practical tasks, often to confirm theory that students are learning in lectures. Thus, remote laboratory interfaces tend to present only the necessary tools for achieving the predefined aims of the laboratory worksheet. This was the case in this study, with the majority of tools being rated as useful for the tasks at hand (Table 1). However, if we are to further explore how student autonomy and skill development can be enhanced, a more open and exploratory user interface may be necessary. This may include the use of a bank of UI tools that must be selected from by students. It may also require a mixed-format lab that provides the opportunity for experimental design and hardware choice that a simulated environment can provide before moving students to a remote environment providing students with the rich data that real hardware can offer.
Additionally, by providing students with additional means to investigate the remote hardware – pre-recorded video, datasets, 3D models, simulated environments for “constructing” hardware – we may be able to better understand the source of perceived theory-measurement disparity in remote laboratories and encourage a design of remote systems that better support authentic practical experiences.
Conclusion
If we hope to encourage the adoption of remote laboratories into mainstream educational practice, it is important that stakeholders in practical lab work perceive the inherent value in remote systems and consider the remote laboratory a valid learning tool that is capable of achieving the skills-based and conceptual learning intentions set in the engineering lab. To this end, a study of the perceptions of students (and staff) is necessary for understanding how remote laboratories can be designed to meet these needs. Remote laboratories are not simply a reduced version of a proximal laboratory, but a different approach with alternative strengths and weaknesses, offering new opportunities not possible with traditional approaches (many of which are not yet fully identified or explored).
Although still in early development, the practable.io infrastructure, UI and remote laboratory hardware have provided 250 students on the ‘Controls and Instrumentation Engineering 3’ course with an effective practical experience, with results suggesting that students were satisfied with the remote practical work. This paper highlights and supports the call 31 for further educational research into the impact of remote laboratory design on student experience. Within the context of this remote laboratory and the respondents to the survey, we have identified that perceptions of ‘predictable control’ over experiments may be driven to a greater extent by a student's interaction with the user interface (control of task) rather than a belief in their control over the hardware. We also show that different modes of UI interaction with the same hardware and data can impact student perceptions of control.
Footnotes
Acknowledgements
We are grateful to the course organiser Dr Aristides Kiprakis for developing the new teaching materials and working with us to validate the experimental hardware and user interface; Andrew Brown designed the mechanical hardware and built the experiments together with Calum Melrose. Additional essential support was provided from Technical, Buildings, IT, and Professional Services staff. The work was funded by the School of Engineering.
Declaration of conflicting interests
The author(s) declared no potential conflicts of interest with respect to the research, authorship, and/or publication of this article.
Funding
The author(s) received no financial support for the research, authorship and/or publication of this article.
Research data
Data collected as part of this research has been made publicly available on Edinburgh DataShare
16
at ![]() .
.