
Abstract
This article traces the development and expansion of early computer systems for analyzing views at three state-owned agencies in the United States and Great Britain: the US Forest Service, the Central Electricity Generating Board of England and Wales, and the Greater London Authority. Following the technology over four decades, from 1968 to 2012, the article traces assumptions incorporated into initial programs and propagated through to the present. These programs were designed to address questions about visual environments and proximities by numerical calculations alone, without the need for field observations. Each historical episode provides unique insights into the role of abstraction and calculation in the production of landscapes and the built environment, and shows how computer-generated view data became an important currency in planning control, not primarily for aesthetic but for financial and political reasons.
Introduction
Between 2009 and 2013, a 95-story high-rise was constructed in the London Borough of Southwark, interfering with two protected views of St Paul’s Cathedral. Overlooking the advice of its own advisor on the historic environment, English Heritage, the UK government approved plans to build the 1016-foot-tall London Bridge Tower, ‘The Shard,’ in 2003. Enraged by the proposal, English Heritage hired experts to create visualizations and computer-generated diagrams illustrating that the proposal clearly violated the protected view corridors – the harmful effects of which were described by English Heritage’s Chief Executive, Simon Thurley, as driving ‘a spike through the heart of historic London’ (Watson, 2017). Yet, despite the controversy, planning permission was approved, and in July 2012 the Shard was formally inaugurated by the then Prime Minister of the State of Qatar, Hamad Bin Jassem Bin Jabor Al Thani, and Prince Andrew, Duke of York.
This article discusses how computer-generated view data became an important currency in planning and managing visual environments. With focus on developments between 1968 and 2012, the article traces the origins and early years of computer programs designed to simulate human visual perception by replacing the observing subject with a semi-automated procedure. By the mid-1970s, in the US and Great Britain, it had become widely accepted that the abstract graphs and geometric figures produced could tell planners something about how local communities would perceive an environment after a proposed change. The generated images were typically not of the altered environment per se but descriptions of change, in form of charts and abstract diagrams that made rational and economical rather than intuitive sense. Still widely used in urban planning, simulations of this type – commonly called visibility-, viewpoint-, viewshed-, isovist-, or zone of visual influence (ZVI) analysis – are rooted in the idea that any person located at a set of geographic coordinates would perceive the environment in the same way. This is sustained by the idea that vision is stable and shared, and that visual experiences are largely determined by physical form and objects, including buildings, trees and hills, that can be mapped, measured and compared using numerical coordinates (Appleyard, 1976; Batty, 2001; Benedikt, 1979; Hillier, 1996; Lynch, 1960, 1976). But, echoing Amann and Knorr Cetina (1988: 134), can we really consider seeing as ‘a primitive (in the sense of unconstructed), “truth-transporting” activity?’ Facilitating a form of scientific seeing (Daston and Galison, 2007; Lynch, 1985), computerized view analysis systems are deliberately designed to overcome problems of visuality, here understood as an unpredictable personal process largely determined by individual circumstances, experiences and preferences. 1
Across the world, computer programs for analyzing views have become increasingly popular in urban planning and decision making since the 1970s. Estimates of how much a development would visually change an existing environment are often the make or break for development applications. The methods are also used in real estate and behavioral economics to help determine how a view of, for example, greenery, water or the open sky would affect wellbeing, property values, and rental income. The enumeration and mathematization of views and visual phenomena in the built environment often have strong ties to financial and economic concerns. Environmental assessments, of which view analysis is one kind, are meant to forecast that the benefits of a development do not come at an unacceptable cost. But what constitutes a cost, and for whom is it a cost? The computerized view analysis process is only descriptive; it does not release the planner or decision-maker from the difficult task of evaluating the produced results. Despite the often-praised accuracy of this type of assessment, there remains the question of determining the significance of the produced data.
Originally carried out by manual map analysis and hand-drawn perspectives, visual impact analysis today entails a computerized process typically undertaken with the help of digital mapping software, such as GIS (e.g. Figure 1). First introduced to urban planning during the late 1960s, the public and private enablers of computerized view analysis shared a common goal, to answer questions including: Where is a development is visible from? How much of the development is visible? How much of the surrounding area is affected by it, and to what degree? The systems were, in other words, designed to address questions about visual environments and proximities by numerical calculations alone, without the need for field observations. 2 While this is the case with many geospatial technologies, such as GPS, photogrammetry, and computer vision applications, this article is motivated by the observation that architects and planners, developers, policy makers, and planning authorities often consider this type of computer-generated diagrams to be empirically true. It seems to have become widely accepted that results produced with the semi-automated computational procedures can tell planners and authorities something about how individuals or community groups would perceive an environment from a given position, despite the removal of individuals (other than the analyst) from the assessment process.
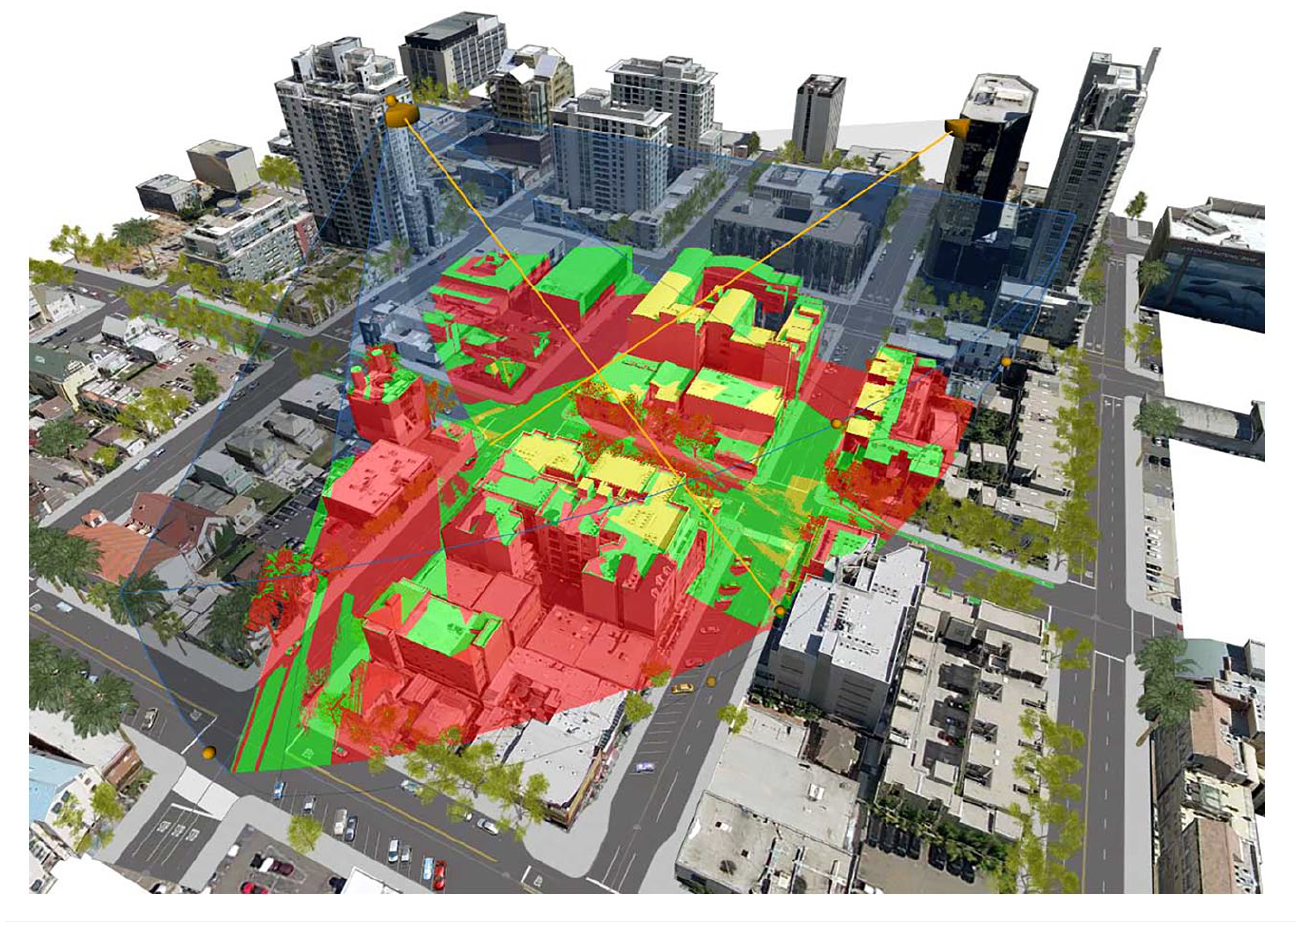
Screenshot from the CityEngine 2017 view analysis software by Esri. Copyright © Esri, reproduced according to permissions outlined in Section 107 of the US Copyright Act.
In this article I examine how computer programs for analyzing views came to partially substitute skilled seeing among professionals responsible for planning and managing forests and built environments in the US and Great Britain. I present a history of the process by which computers were adopted by planners and managers as tools for solving problems, exemplifying that process in three case studies. My argument is that, while this type of computer program is often treated not only as a tool or a toy (Turkle, 1982) but also as an extension of the professional vision of trained planners, it was invented to solve practical problems that often had little to do with how anything looked out in the field.
Building on prior work in science and technology studies (STS) on the importance of embodiment to visualization (e.g. Alač, 2011; Ihde, 2009; Myers, 2008; Radder, 2006), I will show that analyzing views with computers not only involves learning the ‘professional vision’ (Goodwin, 1994) of planners but also socially organized procedures of evidence fixation (Amann and Knorr Cetina, 1988: 134). These procedures, through which the produced diagrams gain credibility among those participating in planning deliberations, serve to sustain the assumption that there is a direct association between individual perceiving planners on the ground and the abstract outputs from the computer program.
As Turkle (1982: 174) puts it, ‘what people do with computers weaves itself into the way they see the world’. The history here is not, though, one of sudden ruptures caused by technological innovation. It is more like accounts such as those of Agar (2003, 2006), in which computerization has been attempted in settings where there already existed material and theoretical computational practices and technologies. At each of the three institutions I examine, the geometric understanding of views and the calculations for lines of sight had been practiced manually for a long time before digital computers were introduced to the profession.
I analyze three case studies pertaining to natural resource management, power production, and city planning, in the US Forest Service, the Central Electricity Generating Board of England and Wales, and the Greater London Authority. Each case provides different insights into the role of science and calculation in the production of landscapes and the built environment, and shows how computer-generated view data became an important currency in planning visual environments.
Computerized view analysis at the US Forest Service, 1968–1979
During the 1960s, researchers at the US Forest Service began using digital computers to help manage both the vast national forest resources and the activities of employed staff. By the mid-1980s, all local offices were tied into a comprehensive information management network, which included more than 900 computers and 18,000 terminals distributed over 45 states, the Virgin Islands, and Puerto Rico. The background to the agency’s adoption of computers was the increased demand for timber during the post-World War II housing boom. The escalating need for building materials led to more widespread use of commodity-oriented harvesting techniques such as clearcutting, which began to significantly change the appearance of forested areas. As the landscape began to change, the public took notice and concern about spoliation increased. In response, the Multiple-Use Sustained-Yield Act of 1960 reinforced demands for ‘multiple use’ of the national forests, and required the Forest Service to consider wildlife, conservation and recreation as part of their management. 3 This was no easy task, because only a handful of forest managers were responsible for millions of acres of the national forest. According to a researcher at the Pacific Southwest Forest and Range Experiment Station, it would take a person walking at a pace of 4 miles per hour more than one year to visit every acre in a stretch of land of one million acres (Elsner, 1979: 88). Therefore, it was simply not an option to carry out observations on foot at the frequency required by the new legislation.
This was one of the reasons that mainframe computers were first applied to problems of management and planning, including visual resource management. The need for visual assessment was further reinforced by the National Environmental Policy Act (NEPA), a United States environmental law that was officially enacted in 1970. NEPA required all agencies of the federal government to identify and develop procedures to ensure that environmental amenities and values were given appropriate consideration in decision making along with economic and technical considerations. This and subsequent legislation (including the Federal Land Policy Act of 1976 and the National Forest Management Act of 1976) gave impetus to the invention of processes to describe and assess visual resources, and established a need for a comprehensive program of visual resource management that continues in the present (Bacon, 1979; Camp, 1983). The computerized view analysis systems developed at the Forest Service during the 1960s and 1970s were thus a few of many such systems in the United States at the time. Similar programs were developed by, for example, the Atomic Energy Commission, the Soil Conservation Service of the USDA, and the federal Highways Administration of the Department of Agriculture.
The requirement imposed by NEPA that resource management include aesthetic considerations increased emphasis on scenery in the inventory, analysis and management of the national forests. It created the need for forest managers to carry out visual assessments to assess the compatibility of a proposed project with the surrounding landscape. One kind of visibility problem that faced forest managers was delineating the boundaries of landscape views, an issue that was becoming increasingly important at the US Forest Service due to the growing public concern about the visual consequences of timber cutting and other traces on the landscape left by industry. To determine the area visible from an observer station, a forester would traditionally go out in the field, make observations and mark the boundary of the encountered view on a map, covering 360 degrees around the observer location. Alternatively, a draftsperson would draw section profiles through the terrain based on elevation heights read off contour maps. These section profiles were laid out radially around the observation point and boundaries of ‘seen areas’ could be defined by connecting points on the different section profiles. To obtain sufficient data to construct the boundary of a view would often require hundreds of terrain profiles to be drawn, which took a long time to complete and was therefore costly. In addition, the Forest Service managed a total area of 188 million acres of land. Responsible for managing this vast resource were nearly 21,000 members of staff (Ross and Evans, 1984: 85–105). To reduce the hours of field work needed for visual assessments would thus lead to a significant economic saving. It was, in other words, to produce an economically feasible procedure for delineating view areas that researchers at the US Forest Service decided to apply a computer approach.
The first computer application developed by two pioneers at the Forest Service, economist Elliot Amidon and quantitative planner Gary Elsner, written in FORTRAN, was a subprogram called VIEWIT. It was an application for studying ‘seen’ areas from a selected viewpoint. The chosen approach drew on one previously developed in the military to analyze lines of sight and low-altitude flight paths (Amidon and Elsner, 1968: 1; Gallagher, 1972: 3–16). The application was designed to read a grid of elevation values and the coordinates of an observer position, and to calculate grid cells in view from that point within a given radius. 4 From the observer point, lines of sight were calculated to all other elevations of grid intersections to determine which ones were in view (see Figure 2). 5 VIEWIT could also be used to calculate the frequency of visibility of selected points from along roads or air routes by assigning a number to each map grid cell indicating how many times the location would appear in view for someone traveling along a route. In a research notice from 1968, the inventors of VIEWIT reported that to compute the area visible from an observer’s position, taking into consideration the area within a 1.5 mile radius (approximately 4500 acres), ‘required only 1 second on a UNIVAC 1108 computer’ (Amidon and Elsner, 1968: 1). Thanks to the computer, they asserted, it was no longer necessary to draw overlays manually and to conduct extensive field surveys, which was a significant development principally for financial reasons.
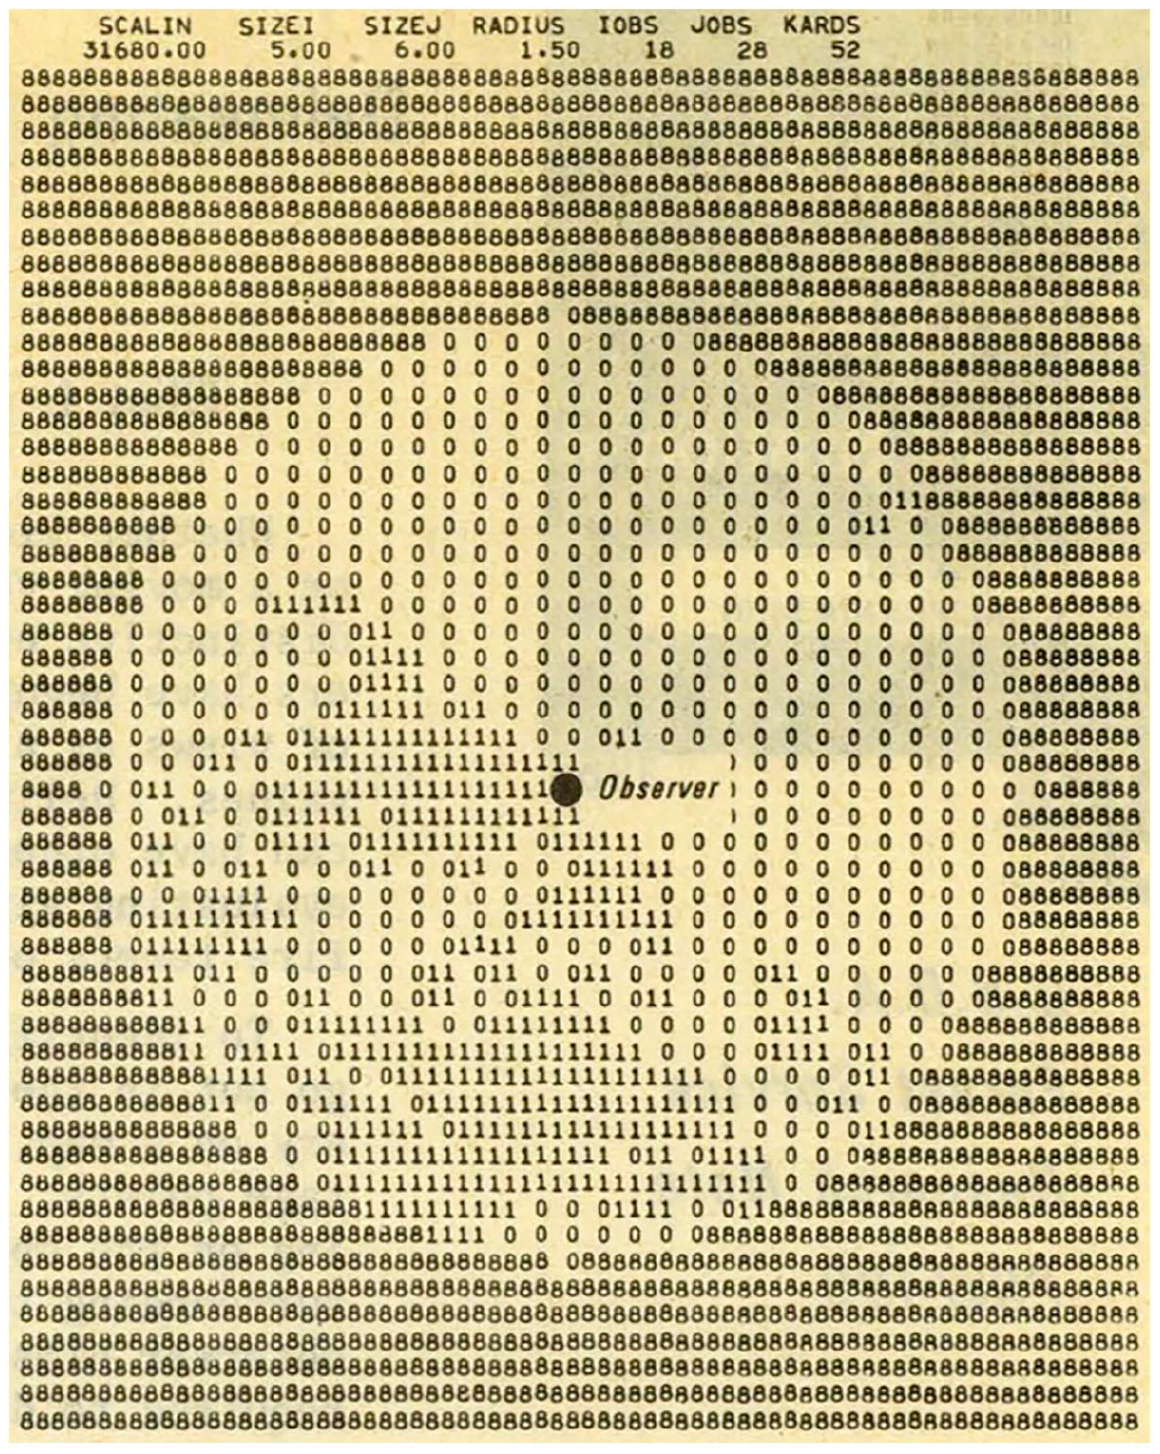
Map diagram produced with the VIEWIT computer program showing area visible within a specified radius from the observer. Amidon and Elsner (1968: 2). U.S.D.A Forest Service, reproduced according to permissions outlined in Section 107 of the US Copyright Act.
Developing VIEWIT, Amidon and Elsner reviewed available research on visibility and the algorithms used for calculating line of sight and delineating view areas. The precedents for modeling human view cones and visual landscape as mathematically defined geometry came from the military (Amidon and Elsner, 1968: 1). One key precedent was the research carried out at the Scripps Institution of Oceanography Visibility Laboratory in San Diego only a few years earlier, by a unit dedicated to developing programs that would allow the use of high-speed digital computers for performing visibility calculations (Barkdoll, 1967). The research at Scripps was in turn rooted in the findings of North American psychologist Richard Blackwell. The intensive research carried out by Blackwell and others in the US during World War II generated new methods and new devices, in short, a new science of optics that would come to have many ‘peacetime applications’ (US National Research Defense Council [NDRC], 1946: vii). The experiments conducted during and after World War II at the Louis Comfort Tiffany Foundation (a vision research laboratory designed for military applications) in Oyster Bay, NY, and subsequently at the Vision Research Laboratory at the University of Michigan (Blackwell, 1946, 1952) enabled the simplification and collation of an enormous body of experimental facts. Without that simplification, the co-founder of the Visibility Laboratory at the Massachusetts Institute of Technology, Duntley et al. (1964) wrote in an article published in Applied Optics, ‘visibility calculations would scarcely be practicable as an engineering procedure’ (p. 550).
To verify the findings generated in controlled laboratory settings, Blackwell later checked the data by direct observations in the Roscommon area of Northern Michigan. Using circular targets with controllable contrast, the team examined view distances of up to 30 miles, by night and day, using both plain eyesight and binoculars. The results of these so-called ‘Roscommon Tests’ – numerical descriptions with three decimal places – indicated that the results of the Tiffany experiments could also apply to field observations, with ±25% deviance (Blackwell, 1947). This finding gave the assumptions established in the Tiffany experiments increased credibility, and the data became widely used in military visibility research both in the US and the Great Britain. 6 Blackwell and the NDRC Camouflage Section (Section 16.3) had thus succeeded in reducing visibility, a key aspect of camouflage, to an engineering procedure, which officials in the Camouflage Section considered to have bearing on ‘visibility problems of all kinds’ (NDRC, 1946: ix). In 1952, the Visibility Laboratory moved from MIT to the Scripps Institute in San Diego, and during the next decade, the first computer programs for delineating view areas were developed. One of the first was a program called PODVI (Probability of Detection Volumes Phase 1). It was the subroutines and functions of this program that the researchers at the Forest Service used a decade later to develop their own computer visibility application, VIEWIT, a program that was eventually developed into more advanced applications of view simulation.
During the 1970s, forest engineer Devon Nickerson and researchers at the Forest Service Division of Timer Management in Portland, Oregon, developed three related view analysis programs, SIGHTLINE, PERSPECTIVEPLOT, and SCOPE. These were designed to assist forest managers in predicting the visual consequences of timber harvest in the Pacific Northwest region, to ‘substitute an analytical tool for an educated guess’ (Nickerson, 1979: 14). The applications required as input digital contours of terrain, a defined viewing point, and the boundary coordinates of the area where trees were to be felled. Supplied with this information, PERSPECTIVEPLOT could produce a perspective drawing of how an area might look after the trees were cut. The perspectives would depict before and after views of a timber felling, or a view of a partially cut area in ‘true perspective from a viewpoint’ (Nickerson, 1979: 14). This could be done, Nickerson reported, at modest computer operating costs: A complete study of a cutting would often take only a few hours to complete. Additionally, several of the time-consuming phases of the work required no human attention. Once the program started to run, the manager could ‘turn to other duties for the 45 minutes required for plot completion’ (Nickerson, 1979: 16).
The outputs from such studies were used by forest managers to plan activities and as a basis for decisions. By the early 1980s, the programs were available to all regions of the Forest Service and could be accessed by some 200 interactive terminals linked to a single mainframe computer hosted at the USDA Fort Collins Computer Center in Colorado (Lever, 1983: 79). Examples of applications included timber harvesting, mining, scenic tramway routes, bridge proposals, transportation system alternatives, ski runs, roads, recreation developments, and fuel breaks (see Figure 3). The programs were additionally used to determine terrain slope and aspect information for land use planning.
7
Applicable to a range of forestry problems, VIEWIT inventor Gary Elsner envisioned a future in which the capacity of the computer to perceive vast land areas and keep a detailed, real-time overview thereof, would far surpass that of a person (Elsner, 1979). In a fictional dialog between a future planner and their ‘friendly computer’, authored by Elsner, the planner asks: ‘What’s the status of the landscape this morning?’ The terminal responds: Generally things are in pretty good shape. The blowdown we’ve been predicting for the last several days has occurred [and] is about 30 acres. I detected it this morning about 12:35 a.m. from satellite reconnaissance. The visual impact of the blowdown does not seem to be too significant. I’ve calculated the visibility and it’s not visible from any major road or any section of the trail system in the forest or any developed recreation area, or any areas planned for development in the next 10 years. Here’s a draft of the paperwork for competitive bid on the salvage sale. (Elsner, 1979: 90)
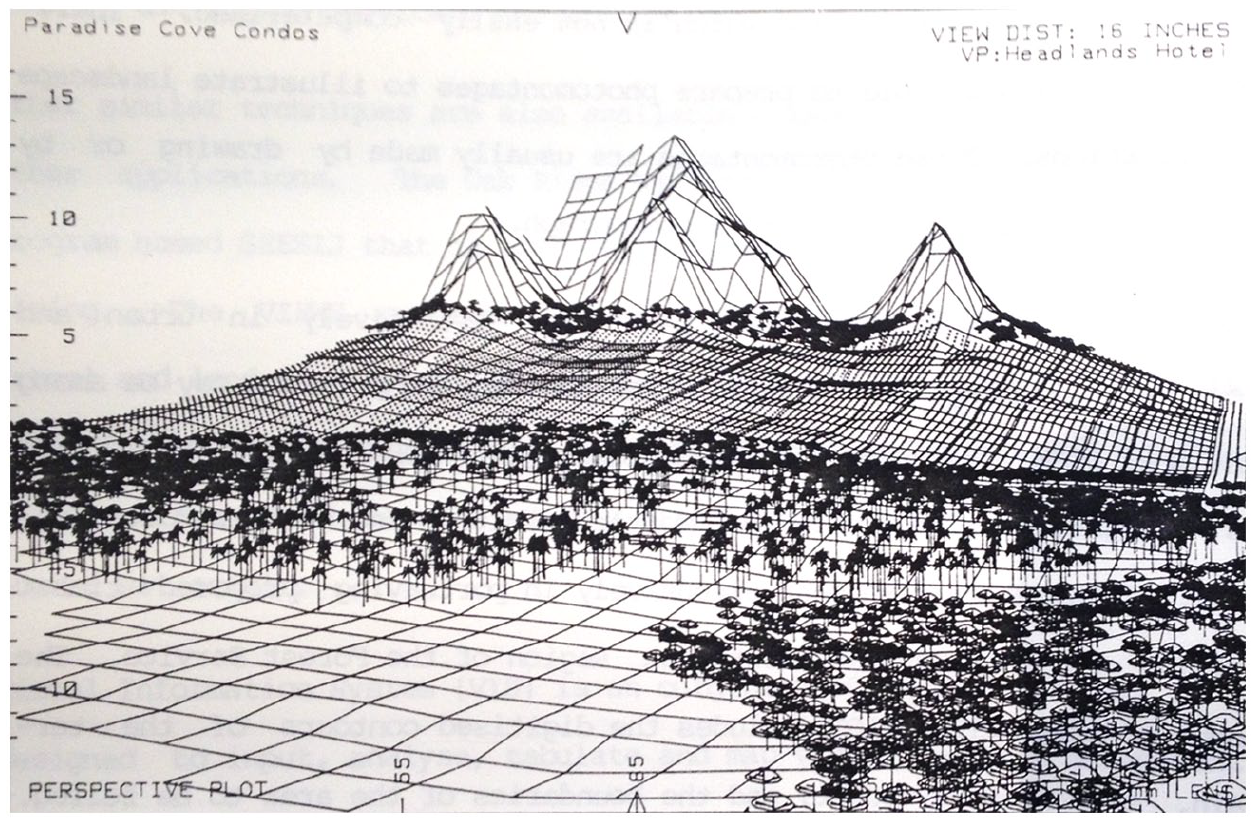
View simulation of a condo in Paradise Cove, Hawaii, produced with the PERSPECTIVEPLOT computer program. Ross and Evans (1984: 100). U.S.D.A Forest Service, reproduced according to permissions outlined in Section 107 of the US Copyright Act.
The computer further reports that because there was no apparent action to the landscape after 1 a.m. that morning – an indication that the system is on the lookout around the clock – it began scanning the incoming electronic mail. In the inbox, it found a formal request to extend a nearby highway through the forest, for which it immediately produced analyses for the planner to use in their position paper on the outlined route option. The computer reports: ‘I carried out a preliminary visual analysis of this proposal and found it will visually impact 23,000 acres of our highest scenic quality land with high frequencies of viewing, 15,000 acres of medium scenic quality land, and 17,000 acres of low scenic quality land.’ Without looking at the results, the planner instructs the computer to summarize the visual and economic results in graphic and tabular form, and to ‘[h]ave this ready for viewing on the Supervisor’s CRT by 10 a.m.’ The planner also asks the computer to start a draft Environmental Impact Statement (EIS) and to insert the summary results in the appropriate sections (Elsner, 1979: 91). While this dialog depicts an intimate relationship between planners and computers that is still to be fully realized, the scenario illustrates what these programs eventually became: systems for preparing documentation that help satisfy requests for Environmental Impact Statements as imposed by the NEPA (42 USC 4321) and the National Historic Preservation Act (NHPA) (16 USC 470).
Computerized view analysis at the Forest Service was in part a solution to the problem of staff shortage. This development was essential, according to Elsner, because at the largest public land management agencies in the US at that time, each administrative unit was managed by only one or two people. At the Forest Service this meant that these individuals had the responsibility for analyzing about a million acres of land, whereas at the Bureau of Land Management the responsibility often spanned several million acres for one or two people. In sum, the computer was configured to do observational work at the Forest Service because doing so led to more efficient management. In visual assessment, this was not primarily because machines were considered more accurate or reliable, but because the process of analyzing landscape views with a computer was fast, considered sufficiently reliable, and above all less expensive than engaging human observers.
Power station siting at the Central Electricity Generating Board of England and Wales, 1957–1975
While the US Forest Service began using computers to manage the national forest resource more effectively, major industrial developers in Great Britain faced problems of a different kind, ones that were often rooted in a growing public resistance to the ongoing industrialization of the countryside. In response, the government passed new legislation. Section 37 of the Electricity Act of 1957, entitled Preservation of Amenity, introduced a requirement for assessing environmental impacts, and served to place visual aspects of landscape at center stage in land use debates. Leaders of industrial agencies, including the Central Electricity Generating Board (CEGB) of England and Wales, the National Coal Board, and the South of Scotland Electricity Board, now found themselves in a dilemma. Despite the rising standard of living – evident in, for instance, the explosive increase in domestic electric appliances – the continuing industrial expansion in the countryside needed to meet the growing demand for power caused public discontent. The Chairman of the CEGB, Christopher Hinton, expressed frustration at this, arguing that ‘it is no use simply to object to the growth of industrialization when it is known that the future of our country depends on it’ (Hinton and Holford, 1960: 7). At the same time, he admitted that it is no use to argue that properly sited pylons and transmission lines stride grandly across the countryside. To the average man they are (consciously or subconsciously) the tentacles of industrialization creeping out into a countryside which he would prefer to keep free from industrialization. (Hinton and Holford, 1960: 7)
Hinton, along with other developers, argued that a new approach to planning was needed to resolve these disputes. While a preservationist could think of nothing better than what is already there, Hinton explained, effective design could offer ‘an alternative amenity’ (Hinton and Holford, 1960: 25) better aligned with Great Britain’s modern needs. He believed that the key to turning this vision into reality was the presence of professionals who could effectively negotiate public and industry interests.
As a result, the CEGB began hiring architects and landscape architects to consult on new projects. One was Ronald Hebblethwaite, a landscape architect who came to manage a small team of landscape practitioners dedicated to assessing measurable visual impacts caused by power stations. 8 During the 1960s, the team developed a series of methods for visual analysis in power station siting, some of which were eventually reworked for the computer. Because it would sometimes take several years to complete detailed landscape quality maps – maps indicating areas of different environmental and cultural value – Hebblethwaite proposed that one should limit qualitative studies to the area in which the power station made a discernible visual impact. In 1969, he assigned a name to this idea, calling the area affected a ‘zone of visual influence’ or ‘ZVI’. 9 Most likely, Hebblethwaite borrowed the term from landscape architect Sylvia Crowe, who had used the wording in her 1958 book The Landscape of Power.
Traditional methods for modeling visual impacts of power stations, many of which were pioneered by Crowe, involved extensive fieldwork and cartographic and photographic surveys. To create a picture of a power station in its surrounding landscape, one would use the information recorded in the field to construct photomontages of significant viewpoints. At the CEGB and elsewhere, practitioners created such pictures by superimposing a silhouette drawing of a proposed development onto a site photograph. From beginning to end, this process was time-consuming and costly, and planning authorities would often question the accuracy of the produced pictures. Similarly, to work out by hand how large an area would be dominated by a power station ‘rising abruptly out of the surrounding landscape’ (Murray, 1967: 20) was a laborious process. Following a similar process to that used at the US Forest Service during the same period, a draftsperson would draw sections through the landscape based on elevation heights read off contour maps. 10 The sections were then laid out on a map radially around the power station being analyzed. To define the zone within which a 2000MW power station would be visible, one would extend these sections to a distance of five miles from the station (two miles for a smaller building, such as a factory). A section would be drawn at five-degree intervals within three miles of the power station, and every two and a half degrees from three to five miles distance. By drawing a line of sight across each section, the draftsperson could identify parts of the terrain in or out of sight. These lines of sight were either drawn from the top of a power station ‘looking out,’ or from the height of an observer ‘looking in’ toward the station from a distance. To cover a 360-degree field around a power station required constructing hundreds of sections, which was time-consuming and expensive; to carry out a study of a circular area with a six-mile radius would take three to four days of work. Moreover, the new 2000MW power stations built after 1960 were far larger than conventional stations. The facility at West Burton encompassed 335 acres and had cooling towers reaching 660 feet (201 meter) high (Shepheard, 1961). Visual impacts of different configurations and layouts of these mega structures needed to be assessed quickly and cost-effectively.
Recognizing that conventional drawing techniques were now inadequate, Hebblethwaite and the team at the CEGB set out to automate the method of establishing a power station’s visual area, or ZVI. To make that possible, and to eliminate the need for human observers in the field, they gave the hand-drawn ZVI plot an exact numerical description. One team member, Murray (1967), was convinced that if one could ‘systematically collect and analyze objective data,’ on what would be seen from where, by whom, and under what circumstances, and then ‘correlate it with subjective experience,’ (p. 1) one could greatly improve the planning process. The resulting method was invented not to aid in designing the power stations per se, but to increase the efficiency of project management, and arguably to strengthen the status of landscape architects in that process. The idea was that the program would assist planners in quickly and cost-effectively identifying how many acres of land of each landscape quality category would be affected by a power station development.
The first application, written in FORTRAN, presented a way to construct and visualize ZVIs with a computer. The computer program would, in effect, carry out line-of-sight calculations using two inputs: the height of an ‘an average man’ 11 and a numerical description of topography generated from contour maps. These elevation heights were configured as a matrix, a digital counterpart to the undulating terrain. As in VIEWIT, the computational procedure worked by comparing the height of an observer with the elevation heights stored at each location in the matrix along a line of sight. The calculations also considered the curvature of the earth and light refractions found to influence views over a certain distance. Hebblethwaite explained that, in the application, a line of sight from the observer location would read, for example, ‘000111000000111111000000000111,’ where 0 indicated a grid cell ‘in sight’ and 1 a cell in ‘visual shadow’. The results were printed out as schematic maps, and lines were drawn around groups of 0s and 1s to create defined zones. The edges of areas in visual shadow were then reexamined by photogrammetry to correct for buildings, woodlands, and hedgerows. Provided with sufficient topographic data, the computer application allowed for momentous time saving compared to drawing the sections by hand.
According to this setup, a terrain could be classified into clear categories that excluded all nuanced interpretations of the perceived environment. Because expedience, accuracy, and repeatability were considered the most important criteria, it is easy to understand why Hebblethwaite and other practitioners hired by industrial developers found a computer approach to be effective. The produced drawings were abstract figures that appeared exact, scientific and mathematical, that is, rational rather than readily legible by plain eyesight. 12 The method was used in several of CEGB’s power station projects during the 1960s and 1970s. It was used to select sites, to position buildings and their configurations, and to assess how screening features would affect visibility. One of the first projects in which the technology was used was the West Burton power station, UK’s first 2000MW station to be approved for construction. Hebblethwaite collaborated with landscape architect Derek Lovejoy on the landscaping of the station. Based on their visual analyses, the project architects (The Architects Design Group) separated the cooling towers into two groups at either end of the facility (Clarke, 2013: 8). This was done in order to prevent the power station from forming a bulky mass blocking views of the landscape. The architects also used color to visually emphasize particular structures, helping to distinguish particular component parts as seen from mid or long-range viewpoints. In 1969, the West Burton Power Station won a Civic Trust Award – an award given for buildings and schemes that were considered architecturally outstanding and made positive differences to their local community. The award judgment described the power station as ‘an immense engineering work of great style which, far from detracting from the visual scene, acts as a magnet to the eye … from several miles away’ in Northam (2009: 18). However, not everyone agreed that the station was well integrated into its surroundings. Architectural critic Rayner Banham wrote in 1970 that ‘it seems almost as if Sir Christopher Hinton and his advisers, aghast at the literal enormity of what they were about to commit [with the new 2000MW station], tried to find ways of making the supposed offence less noticeable’ (Banham, 1970: 152). Describing a small Victorian railway building in the foreground of the power station, he lamented that because of the colossal size of the structure the railway station ‘hardly registers as part of the picture’ (Banham, 1970: 152). Another station project which employed Hebblethwaite’s application was the Didcot A power station in Oxfordshire (Figure 4 and 5). Designed by architect Frederick Gibberd, its 650 feet (198 meter) tall chimney was surrounded by six cooling towers 375 feet (114 meter) high. Upon completion, Didcot A also won a Civic Trust Award for how well it blended with its surrounding landscape.
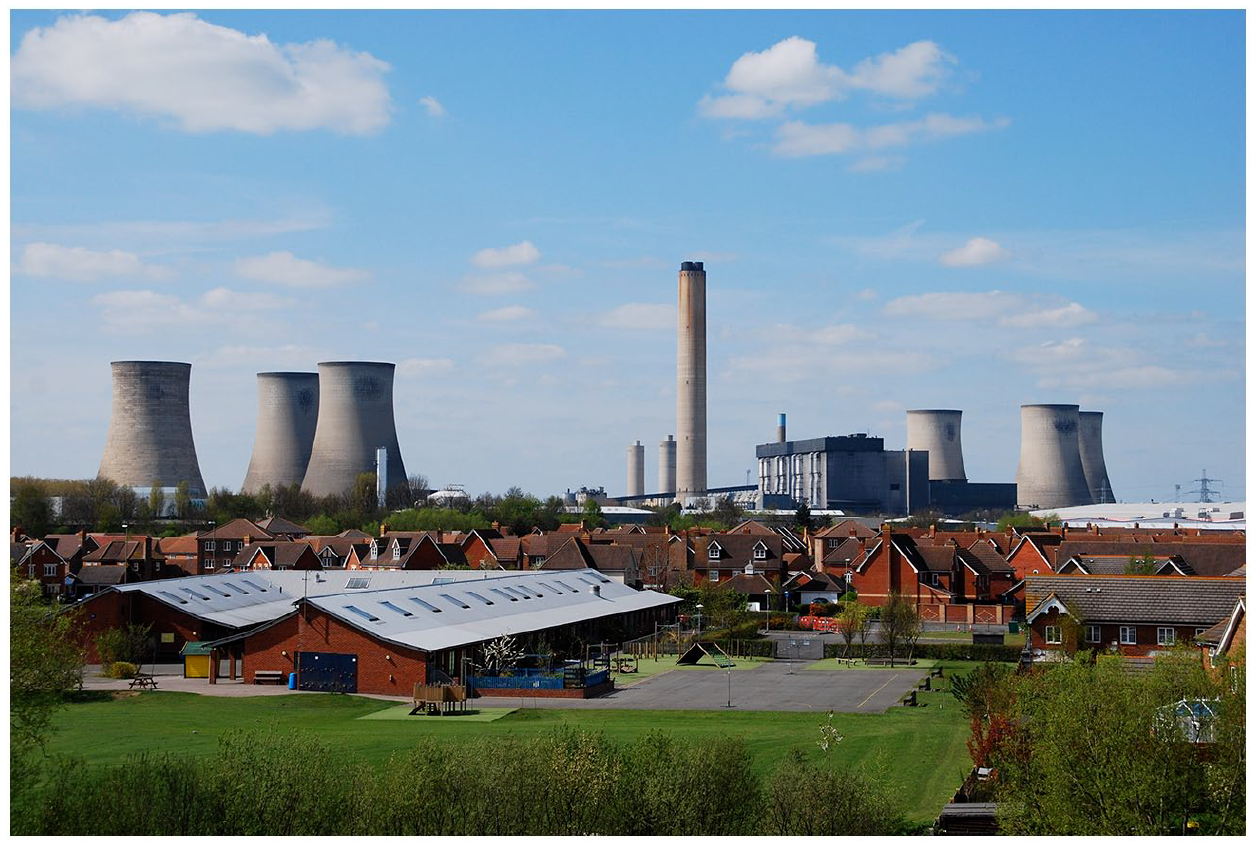
Didcot power station in Oxfordshire, England, in 2009. Photo by Mark Chatterley. CC BY 2.0. https://creativecommons.org/licenses/by/2.0/.
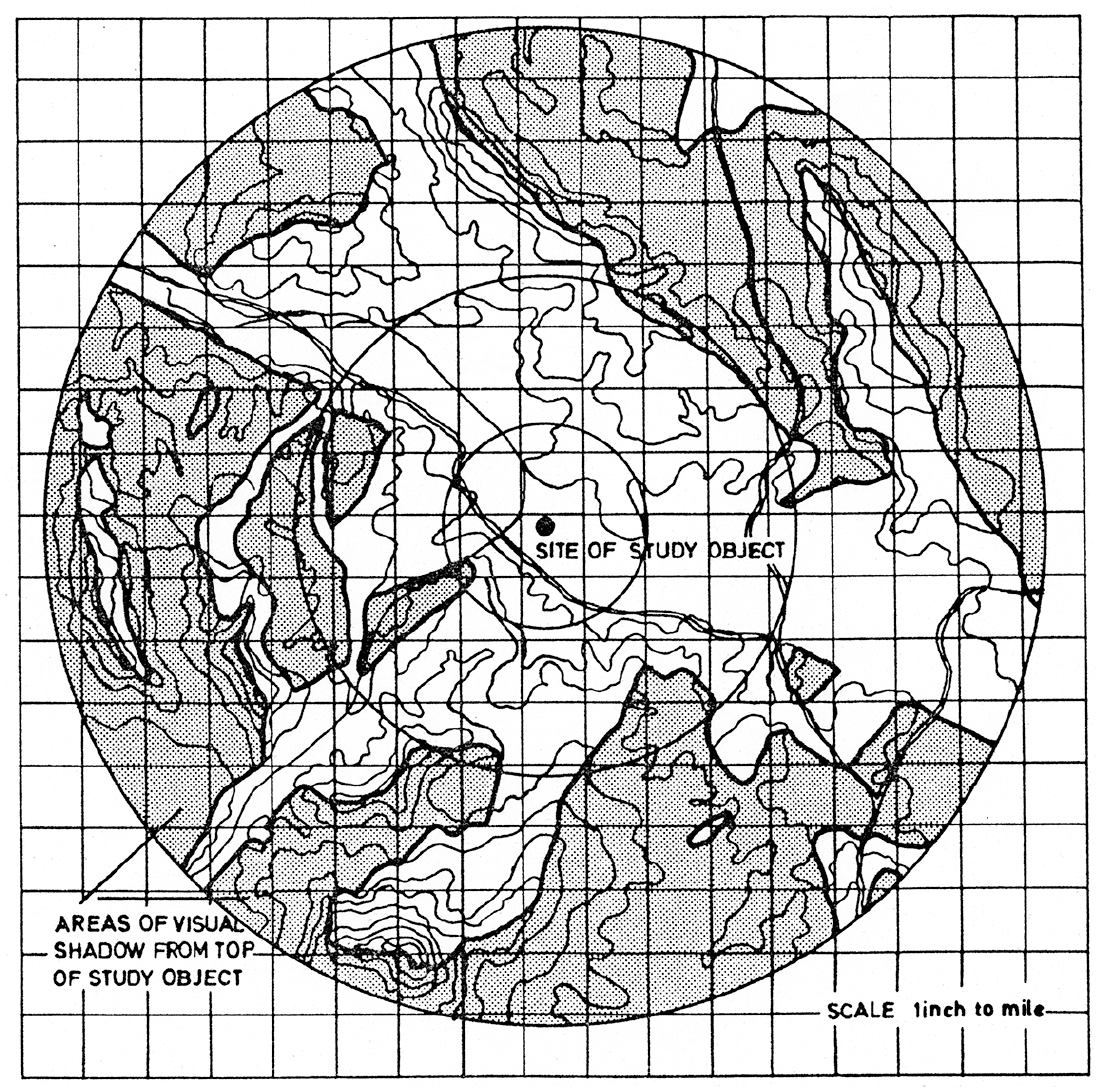
Output from Ronald Hebblethwaite’s computerized view analysis program at the CEGB. Hebblethwaite, ‘The determination of Zones of Visual influence by computer and photogrammetry’, 1975. AR THO B/8. Marian Thompson Collection, The Museum of English Rural Life / Landscape Institute, Reading, UK.
Finally, in 1975, Hebblethwaite published his computerized view analysis method in the CEGB internal bulletin. 13 Convinced of its effectiveness, he asserted that from the automated procedure, insights could be gained on an average person’s visual experiences without the need for extensive surveys and field observations. Word spread and many industrial leaders believed, as a result of early demonstrations such as West Burton and Didcot A, that computerized view analysis would enable more efficient planning, particularly in relation to public inquiries and Environmental Impact Assessments. 14 As a result of this optimism, computer applications for analyzing views gained a favorable reputation across Great Britain’s industrial sector, which led to a dissemination of the technology. 15 Before long, this type of computer program became an indispensable part in completing an EIA. In Scotland in the early 1970s, it was used to assess oil developments in the North Sea. Toward the end of the decade, the South of Scotland Electricity Board used it to assess intrusions caused by electricity towers and power lines (Carlsson, 2019). British Gas and the National Coal Board also adopted the technology. The National Coal Board, for example, began using computer applications in 1974 in siting new coal mines and to analyze the visual reach of mineral deposit sites. 16 In short, the technology became popular in environmental planning not primarily because it produced new knowledge about visual landscape change but because it proved useful in communicating clear evidence in relation to the then ill-defined concept of visual amenity.
The next and final case study will demonstrate how the numerical and mathematical description of views was also adopted in the planning of towns and cities. While the CEGB and the National Coal Board were statutory corporations, and the US Forest Service a federal agency, computer programs for analyzing views were also put to use in the context of commercial real estate. The modeling and planning of how cities look concerns aesthetics but also complex relations between built and cultural heritage, urban growth forecasting, property development finance and city branding.
London’s protected vistas, 1999–2012
For the first 250 years of its life, from 1711 through to 1963, St Paul’s Cathedral dominated London’s skyline as the city’s tallest building. During the decades that followed, the city’s skyline quickly grew taller, a change that was decried especially by heritage agencies. The trend of tall buildings and the associated battle between economic and heritage values continues to the present. During 2019, a record 60 tall buildings – buildings of 20 stories or more in height – were added to London’s skyline (New London Architecture, 2020: 11). In April 2020, 525 additional tall buildings were in the pipeline for construction, 66% of which are planned within the city’s so called ‘Opportunity Areas’, 17 which are defined zones where buildings are allowed to be distinctly taller than the surrounding environment. To help decide what the city should look like, planners and decision-makers require, what they hold to be, accurate visual representations of how each new building will change the skyline, images and maps that since the early 2000s are to be produced with computer software.
While it was often desired to blend timber cuttings with the landscape, and to screen views of power stations as much as possible, computerized view analysis procedures are also frequently used in city planning to assess the impact of new developments, and to protect views of landmarks and other features. In London, 26 views of St Paul’s Cathedral, the Monument, the Tower of London, other landmarks and certain river prospects, are currently protected by such planning controls. 18 In Edinburgh, nearly 170 views in the city are covered by supplementary planning guidance known as The Skyline Report (2008). In 1989, the Vancouver city council passed the View Protection Guidelines to protect 20 views threatened by tall buildings. In New York City, a number of Special Scenic View Districts are established to preserve, protect and prevent obstruction of scenic views as seen from public parks, esplanades or other public places. In Seattle’s downtown, buildings must be set back from the street to enhance views of the mountains and water. Both London and San Francisco have a number of protected views, which carry a legal requirement to preserve the view of a specific place or historic building from another location. Within such a view, new developments are often rejected if found to obstruct the sightline between the defined view location and a defined target. The rules and regulations vary but in most of the listed cities, views are defined precisely and geometrically, from a defined assessment point to the strategically important landmark or feature that is the focus of each view. To determine obstructions of a view with the (in view policies) required degree of accuracy generally demands a geometric assessment procedure. The assessment often also encompasses the area behind a feature, thus regulating how the background environment should appear to a viewer. The areas surrounding St Paul’s Cathedral in London gives ample material to demonstrate how such view management in the built environment can play out, and how computerized view analysis technology eventually became a central feature in British planning control.
The area north of St Paul’s was left in ruins after the World War II Blitz of 1940 and 1941. The cathedral miraculously survived the bombings, rendering it a symbol of national strength and resilience (Fussell, 1975). As reconstruction work began, the government was adamant about protecting the cathedral as a monument that would remain highly visible. Attempts to manage views of St Paul’s had already begun in the nineteenth century when the London Building Acts of 1888 and 1894 imposed a general maximum height regulation. To ensure that the city’s landmarks, specifically St Paul’s, were not overshadowed or obscured, the policies ruled that no building could exceed the height of a fireman’s ladder. When these acts were replaced four decades later, the London Buildings Act 1930 allowed significantly taller developments. In response, the City of London Corporation introduced a policy known as the St Paul’s Heights intended to protect important views of the cathedral. These heights were defined by architect Godfrey Allen (an adviser to St Paul’s on the structure and setting of the cathedral) who mapped out eight views of the cathedral from various vantage points in the city. After World War II, when most buildings in the precinct were destroyed, these views of the cathedral remained important instruments in efforts to reconstruct the area.
In 1956, having completed the scheme that became the area today called Paternoster Square, town planner William Holford – later the chief architectural advisor to the CEGB – cautioned against the influx of tall buildings. That same year, the City of London Corporation abandoned the height restrictions imposed by the St Paul’s Heights, deciding that each case would be considered on its own merits. As a result, a number of tall buildings were constructed. In 1963, the 387 feet (118 meter) tall Millbank Tower became the first high-rise to overtake St Paul’s Cathedral. The following year, the 581 feet (177 meter) tall Post Office Tower and the Telecom Tower (currently known as the BT Tower) became additional features on the skyline. These developments started a surge of tall building development in London that has largely continued since, fluctuating with the ebbs and flows following changes of government. In 1980, the 600 feet (183 meter) tall National Westminster Tower (commonly known as the NatWest Tower), was completed, followed in 1991 by the 771 feet (235 meter) tall One Canada Square tower.
Following 18 years of Conservative government, the 1997 General Election brought the New Labor government into power. Stricter policies for visual assessment in city planning were developed as Prime Minister Tony Blair put cities at the core of his agenda. In 1999, the Department of the Environment published an addendum to the strategic guidance for London planning that focused on views and view corridors, the Regional Planning Guidance 3 (RPG3A). It set out ten view corridors focused on St Paul’s Cathedral and the Palace of Westminster, each of which defined an area where tall buildings could not to be built.
In 2003, at the request of English Heritage, a public inquiry was launched to examine the impact of The London Bridge Tower, The Shard. It met for fourteen days, discussing how the proposal would, for better or worse, change the visual image of London. The inquiry was triggered because the proposed location of the tower was inside the ‘the Background Consultation Area’ 19 of two designated views of St Paul’s, one from Parliament Hill and the other from Kenwood in north London. A relevant planning document (Department of the Environment, 1991) ruled against ‘unsuitable’ development that would ‘reduce’ St Paul’s visibility or setting. Finally, after synthesizing the pros and cons presented at the public inquiry, and after making visits to different parts of the affected area, the appointed planning inspector John Gray concluded that the planning permission should be granted subject to certain conditions. He agreed with the developer’s overarching argument that St Paul’s Cathedral and London Bridge Tower constituted two symbolic structures that could co-exist in the urban landscape: ‘one, a revered symbol of our nation, to many people a spiritual one, the other a symbol of regeneration and renewal’ (Gray, 2003: 19). These words suggest that the decision was to some extent driven by economic and entrepreneurial interests. 20
The granted planning permission was the result of a number of changes in government and policy. In 2000, the Greater London Authority was established, a regional body led by London’s Mayor, Ken Livingstone, a proponent of tall buildings. One of its main tasks was to produce a development strategy for the region, what in 2004 was published as The London Plan. This was a plan for the city looking 20 years ahead and constituted the statutory spatial development strategy for the Greater London area. In 2005, two years after the public inquiry closed but before the construction of the London Bridge Tower began, the Greater London Authority issued the draft of, what they hoped would be, a decisive supplementary planning guidance on views and visual assessment, superseding the RPG3A: the London View Management Framework (LVMF). 21
Drawing on the controversy of the London Bridge Tower and other tall building developments in London, the policy introduced a new terminology for dealing with protected views. 22 One goal of the policy was arguably to make it easier to approve constructions of tall buildings in the background of protected views. One key change in policies between the RPG3A (Government Office for London, 1998) and the LVMF was a narrowing of view corridors especially in the city’s eastern cluster of tall buildings. Others have identified that this narrowing of several of the protected view corridors in the 2007 version of the LVMF was due to lobbying successes by prominent developers (Kufner, 2009; Markham, 2008). The LVMF reduced the width of some viewing corridors from 300 to 140 meter, a change that significantly reduced the constraints on tall building development. In addition, the policy’s authors stipulated that each planning application would be assessed based on its visual quality, not on the geometric boundary imposed by the regulations.
In 2008, Boris Johnson (then Mayor of London) issued a revised LVMF, which identified a number of views that he argued ‘help to define London at a strategic level’ (2012: 3). 23 These designated views, which are still enforced at the time of writing, include six London panoramas, three Linear Views, twelve River Prospects, and five Townscape Views. The policy stipulates that any development within the foreground or middle ground of a view ‘should not harm’ and should, where possible, ‘contribute positively to the existing composition’ (Mayor of London, 2012: 33). 24 Complementing these normative descriptions, each designated view is expressed graphically as a triangular structure with subdivisions. In this structure, defining points for each view are expressed in the format of Ordnance Survey northings, eastings, and as heights above the ordnance datum – a format that makes the views easy to assess with a computer program (Figure 6). 25
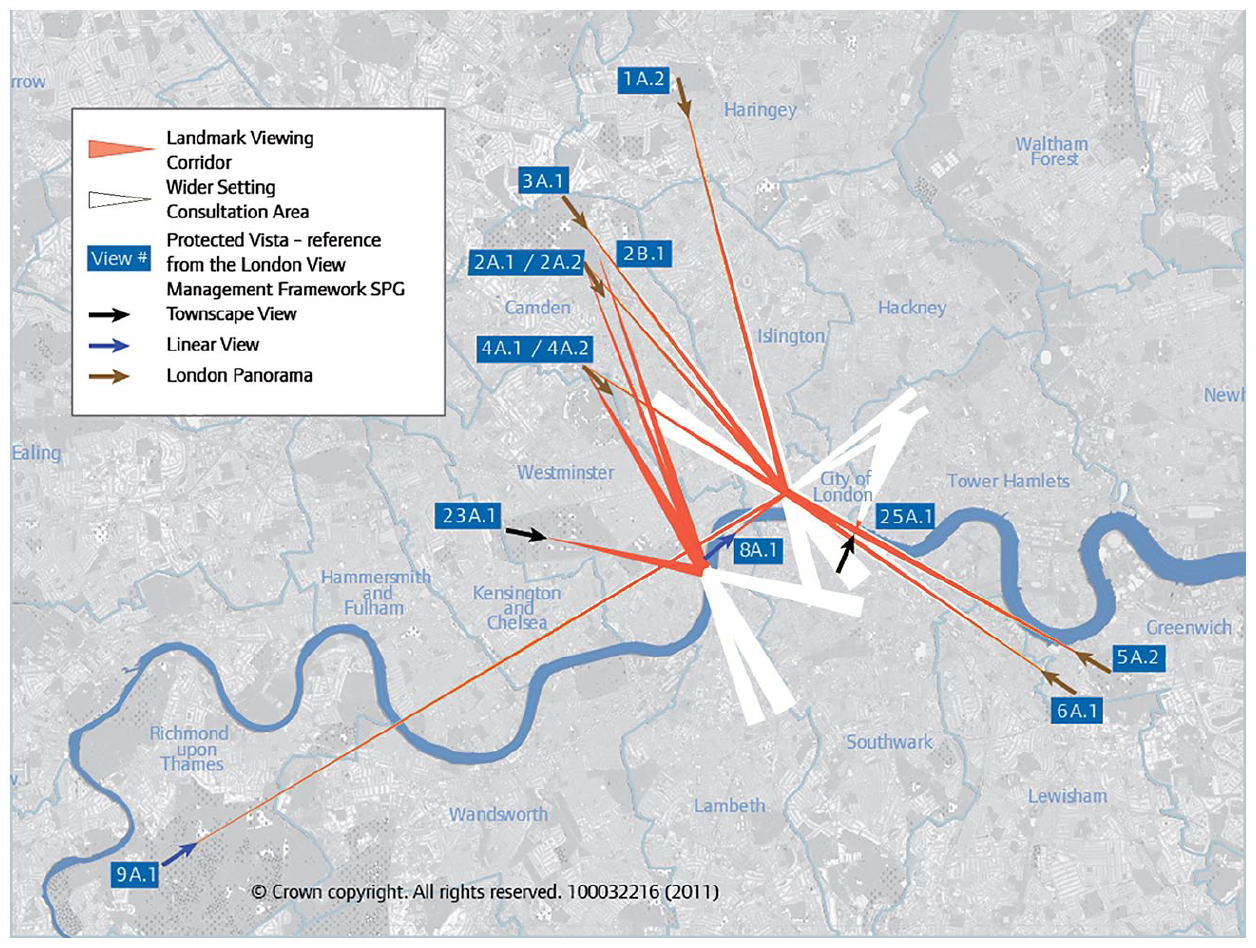
Map of protected vistas in London. Crown Copyright. Contains public sector information licensed under the Open Government Licence v3.0.
The LVMF stipulates that the primary tools for protecting and enhancing designated and protected views be those of geometric modeling and visual impact analysis, and sets out in detail how such assessments are to be undertaken. The policy states that any planning application subject to the LVMF should include at least one Accurate Visual Representation (AVR) of the proposal in question. To be sufficiently reliable to planning assessors, such visualizations are to be prepared following a ‘well-defined and verifiable procedure,’ ideally a ‘computer-based’ one (Mayor of London, 2012: 243). The procedure is scripted in detail 26 and is meant to ensure that a proposed project is pictured as ‘accurately as possible’ (Mayor of London, 2012: 243). Produced images are then submitted to planning authorities to show how a proposed development project would appear to individuals on the ground. The procedure for creating AVRs is void of input from field observations, and thus, as several researchers have pointed out, do not sufficiently represent human visual perception (Nicolaou, 2004; Tavenor, 2007). Moreover, others have argued that there is potential for the producers of AVRs to tweak the input so as to downplay the negative visual effects of a proposal (Bosselmann, 1998; Carmona et al., 2010; Day, 2002). Part of an official program of view management, which is often imposed as part of Great Britain’s EIA regulations, the LVMF policy promotes the use of computerized view analysis technology in British official control. It purportedly ensures that different planning applications are judged fairly against the same criteria, and is ultimately designed to serve decision-makers.
Personal vision, calculable visibility
The computer programs analyzed in this article were invented to save money, to speed up project delivery, to reduce planning controversy. It was often the explicit objective to eliminate the need for direct human observation in view assessment. These systems were deliberately designed, and technically configured, to aid certain agendas. Put more simply, in all three case studies, computerized view analysis programs were designed to address practical problems that the professionals were facing, problems that often had more to do with economics of practice than visual or aesthetic qualities of the physical environment. Many inventors claimed that the mathematical basis of the computer programs made them efficient, replicable, cheap, and helped to remove subjective bias from the systems. In addition, this technical setup allowed planners and developers to make certain kinds of arguments, for example that large controversial projects would have an acceptable visual effect on its surroundings. In other words, with computerized view analysis technology, difficult problems of visuality, perception, and land development were reconfigured as conditions of calculable visibility that would be expressed and measured with numbers alone. Interpretation and evaluation, and the ebbs and flows of an observer’s attention, are entirely removed from the calculations. The computer calculations do not generate any information about how an environment may appear to individuals, what features or figures catch their eye, and how they may feel about it. This is the paradox that this article is intended to highlight: that computerized view analysis systems say little about how a person perceives the world. The systems offer clear and unambiguous accounts of visibility, but not of visuality. 27 The technology gained popularity not primarily because it reliably describes how humans see the world, but because it communicates clearly and conclusively in a manner that is very difficult to achieve through direct participation of a large number of individuals.
The chronological arc of this article’s case studies ends at the moment when computerized view analysis systems were endorsed in official planning control, primarily though the infrastructure of Environmental Impact Assessment. However, the technology’s growing popularity since provides an equally useful opportunity for examining how the technology, for better or worse, continue to affect practices of physical and cultural worldbuilding in Great Britain, the United States, and elsewhere. Computerized view analysis systems have become common in fields that include (beyond urban planning, forestry, and the military) real estate, archeology, geography, geographic information science and computer vision. 28 In machine learning and computer vision research, the terms ‘isovist’, ‘viewshed’, and ‘zone of visual influence’ have recently entered the discourse among researchers and software developers who are largely unaware of where the terms came from and how they were originally used. 29 Several of these view analysis techniques were originally military methods for communicating terrain intelligence. To see a terrain through line of sight calculations, like seeing a city though computerized view assessments, is a professional skill that is taught and practiced within defined factions in society. The information and knowledge thus generated does not translate easily to visual experience generally, to how communities and individuals perceive the world (to visuality). Automated classification of visual environments is often treated as a method of physical science, largely equivalent to empirical measuring. But there is nothing definite or certain about it, and therefore this type of assessment ought to be understood as a mathematical method applied to reduce a complex and highly variable social problem into something computable. It is a way of defining, perhaps even colonizing, open visual space for the benefit of particular points of view.
Conclusions
In his recent study of twentieth century city planning, art historian Williams (2019: 5) argues that one problem with looking at cities is that we don’t often know how to do it. It may sound trivial but deciding how to look is far from straightforward when considering that there is no one or general point of view from which to perceive it. The computer view, as the three case studies have demonstrated, is far from neutral.
This article has described the development of computerized view analysis technology, and discussed ways in which it has been deployed to plan and control the appearance, functionality, and symbolism of physical environments. The account joins previous studies of technological aids for decision making in emphasizing the processes through which numerical descriptions of social phenomena gain credibility (Deringer, 2018; Porter, 1995). Using three case studies, I have shown ways in which numerical descriptions of visual environments were invented, interpreted, utilized, and manipulated to make assertions, provide evidence for arguments, and guide development projects. More specifically, I suggest that digital computers assisted such work after 1960. In each case study, the need for quick and exact methods for analyzing views emerged with new planning legislation which required that aesthetic and scenic values be considered in major planning projects. Yet, the inventors of this technology focused on solving practical problems of staff shortage and efficient project delivery more than they did on understanding the perceptions community groups affected by a new development. This highlights the pivotal role of institutions in the construction and shaping of computerized simulation systems for design and urban planning, and the strategic choices made by the employees at the US Forest Service, the Central Electricity Generating Board, and the Greater London Authority. Yet the desire to analyze views on a computer, and to communicate the results in abstract charts and quantities, was not only a corollary of the interests of influential developers and government agencies, it was also more expansive. Physically, it helped in transforming cities and other environments, to get power stations built, to cut down forests, and to erect iconic landmarks. In consequence, it also permeated other realms, from the everyday experience of residents, visitors and workers on the ground, to spaces of surveillance, business, finance, and politics. The professional vision of planners, authorities, and decision makers, which computerized view analysis technology helps to sustain, has immense and tangible consequences for individuals that often have limited knowledge of the deliberate attempts to commodify and enumerate their visual worlds.
Footnotes
Acknowledgements
The author would like to acknowledge the thoughtful comments and helpful guidance of the editor and reviewers of this article.
Funding
The author received no financial support for the research, authorship, and/or publication of this article.