
Abstract
This study investigates the relationship between the lexical typicality of song lyrics and song popularity in the UK Official Singles Chart from 1999 to 2013. Drawing on natural language processing (NLP) techniques, we develop a multidimensional measure of lyrics’ typicality that captures lexical repetition, complexity, thematic content, and emotional tone, addressing methodological limitations in previous research that relied heavily on static word dictionaries. By analysing 1,457 songs that reached the top five chart positions, we demonstrate that lyrics’ typicality significantly predicts the duration a song remains in the top five but does not affect the peak chart position or the trajectory of popularity (skewness and kurtosis). Our findings suggest that while typical lyrics may contribute to a song’s longevity within a given canon, they do not necessarily guarantee chart-topping success. This research contributes a replicable, dictionary-free methodology for assessing lyrics’ typicality and offers insights into the nuanced role of lyrics in shaping musical preferences.
Although the advent of streaming platforms and their impact on music-listening patterns have contributed to a renewed interest in research devoted to the structuration of musical preferences, their study is not a recent endeavour. Indeed, many researchers have sought to understand why some people have a preference for certain music pieces, but also why some songs are more popular than others (e.g., Finnäs, 1989; Gao, 2021; Rentfrow & Gosling, 2003). In addition to studying variables that are specific to artists and their audiences (e.g., Anglada-Tort et al., 2019; Decrop & Derbaix, 2014), this field of research has focused on the attributes of musical works, whether they are music-related determinants (musical genres, sound-related attributes, psychological attributes, etc., e.g., Hass, 2016; Rentfrow et al., 2011) or lyrics-related determinants (complexity, themes, repetitiveness, impact on emotions, etc., e.g., Barradas & Sakka, 2022; Nunes et al., 2014). One of these lyrics-related determinants is the lexical typicality of the lyrics of a song in relation to a specific canon. In other words, to what extent the lyrics of a song are similar to those used by other songs in a given corpus, for example, songs from a given musical genre or songs that have appeared in a given chart in a given period. This can be done along various dimensions, such as the choice and complexity of words, the themes they explore, and the emotions they convey. To the best of our knowledge, lyrics’ typicality has been addressed in only very few studies, namely Berger and Packard (2018) and North et al. (2020). Nevertheless, though North et al. (2020) propose a useful measure of lyrics’ typicality, it is derived from an overall model agglomerating it with a measure of music typicality that does not allow statistical determination of the variability explained by lyrics’ typicality alone. Indeed, since music typicality could influence lyrics’ typicality, these two measures may be dependent. As for Berger and Packard (2018), they only look into one dimension of lyrics’ typicality, by analysing how typical the themes of the lyrics are compared with other songs in the same musical genre. Hence, the aim of this research is to contribute to the literature on the structuration of musical preferences by being the first to offer an integrative approach to the study of the effect of lyrics’ lexical typicality on song popularity. This integrative approach includes and extends the dimensions of lexical lyrics’ typicality covered by Berger and Packard (2018) and North et al. (2020), taking into consideration the typicality of lexical repetition, lexical complexity, topics, and emotions within song lyrics. In addition to testing the correlation between lyrics’ typicality and popularity, and thus offering more than a mere assessment of the robustness of North et al.’s (2020) findings, we also extend their measures of popularity to test whether lyrics’ typicality correlates with the speed at which a song reaches its highest rank and how fast it gains and loses ranks in a chart. By measuring the lexical typicality of the lyrics of all the songs that have appeared in the top five spots of the UK Official Singles Chart Top 100 between 1999 and 2013 (the same sample used by North et al., 2020) as regards to that same canon of most popular songs at that time, we show that the more typical the lyrics of a song are, the longer the song remains in the top five spots of the chart. We also show that this is only true for this specific measure of popularity, as typicality has no significant effect on the highest spot the song will reach in the chart. Lyrics’ typicality also does not affect the speed at which the song will reach its highest rank or its trajectory within the chart, that is, how fast the song gains and loses popularity.
Our primary contribution, however, is methodological. Specifically, the typicality metrics proposed in existing research on this topic are inherently limited in capturing the lexical complexity of song lyrics due to their methodological choices. Notably, North et al. (2020) rely primarily on word dictionaries, a significant limitation given the dynamic evolution of language over time. As languages evolve quickly, new words are regularly created or their use might change, which is something that dictionary-based techniques do not integrate. Not only do they struggle with metaphor and sarcasm, but they also fail to account for slang or the voluntary deformation of words by artists, and thus are not able to reflect the fact that lyrics are often a reflection of the zeitgeist of their time, a photograph of the linguistic usage of a particular era, social group, or geographical area. Besides, these dictionaries are non-accessible resources, which therefore limits the replicability of the studies in which they are employed. As for Berger and Packard (2018), even though they used natural language processing (hereafter NLP) techniques, they took another path to explore the typicality of songs by reducing the lexical richness of lyrics to the identification of their main themes. Besides, they also ended up using static dictionaries (such as LIWC) to control for certain text-related variables. This research thus proposes a new method to bypass the use of dictionaries to measure the typicality of song lyrics at the word level by using recent NLP techniques. These techniques allow us to characterize lexical typicality in a multidimensional manner, including dynamic metrics such as thematic typicality and emotional typicality, that can adapt to the constant evolution of languages over time and do so without having to overlook the lexical complexity of song lyrics. To increase the reproducibility of our research, we provide the code and the dataset through a free public repository. 1
The rest of this article will first review the existing articles on the typicality of song lyrics within the literature on the structuration of musical preferences. It will then present the NLP literature on which our choice of metrics was based. The methodology section will detail the characteristics of the sample of songs we chose, as well as our NLP metrics in more detail and our choice of popularity measures. Finally, we will present and interpret our results and discuss the theoretical and methodological implications of our findings. This article will conclude by assessing its limitations and the avenues they open for future research.
Literature review
Typicality, lyrics, and song popularity
To understand the concept of typicality, one must first understand the concept of canon. In the field of arts, and more specifically in musicology, a canon is a standard repertoire, [. . .] a loosely codified organism, broadly accepted, with some degree of flexibility on small exchanges or new members [that does however] exhibit recalcitrant behavior on wholesale changes, for these reflect major shifts in the aesthetic viewpoint that tend to evolve over a period of time (Citron, 1990, p. 102).
Canons can be shaped by organizations or artists who are sufficiently influential within an artistic movement or field to impose the domination of certain aesthetic preferences (Farnsworth, 1969; Kopiez et al., 2009; Mueller, 1951), but also by the fact that the more a piece is played, the greater the likelihood that it will be played again (Gilmore, 1993). Thus, canons are constantly torn between tradition and novelty. On the one hand, certain factors can contribute to their homogenization over time. For example, the classical music canon tended to homogenize as royal patronage for artists declined (Weber, 1984). Conversely, it has tended to become more heterogeneous as new university music programmes have emerged and as the performance capabilities of orchestras have improved (Dowd et al., 2002). Research in historiometry applied to empirical aesthetics has shown that there is a curvilinear relationship between the originality of a melody with regard to the canon and its popularity in both classical and popular music (Hass, 2016; Simonton, 1980, 1994, 1998). This relationship was confirmed by experimental studies, which showed that extremely typical and atypical melodies were preferred to moderately typical ones (Martindale & Moore, 1989; North et al., 2017, 2019).
However, the relative importance of lyrics in the formation of musical preferences has largely been ignored, let alone their typicality. Although composers are known to contribute more to the success of an opera than their librettists, even though they both share the credit (Simonton, 2000), it still seems crucial to take lyrics into consideration to predict the popularity of a piece of music and especially that of songs, since they are an assemblage of words and music (Encyclopædia Britannica, n.d.) and are by far the most popular musical style today (Billboard, 2022; Official Charts Company, 2022). Furthermore, given that song lyrics are vectors of nostalgia, cultural, ethnic and self-identity construction, and even feelings of connectedness (Batcho et al., 2008; Kennedy & Gadpaille, 2017), their role in the formation of musical preferences can hardly be ignored. Besides, understanding the effects of lyrics’ lexical typicality on song popularity could inform recommendation algorithms and marketing strategies, ultimately helping industry stakeholders anticipate musical trends.
Most research on lyrics-related determinants of song popularity has focused on how listener characteristics shape lyrical preferences, showing that personality traits can predict preferences for certain lyrical cues or features (Qiu et al., 2019; Rentfrow & Gosling, 2003). By contrast, studies examining how the intrinsic characteristics of lyrics themselves affect song popularity remain scant. A representative example of such research is the work of Nunes et al. (2014), which showed that songs with lyrics containing repetitions were more likely to reach the top of the charts. The typicality of lyrics is another one of those determinants. However, to the best of our knowledge, only two studies have looked into its impact on song popularity and were conducted by North et al. (2020) and Berger and Packard (2018). The latter have shown that the more the themes explored by the lyrics of a song deviate from those typically addressed by songs of the same musical genre, the more popular that song will tend to become. In addition, this effect is moderated by the relative importance that song lyrics may have within different genres. North et al. (2020) measured the typicality of the lyrics of songs within – and in comparison to – a corpus of the 1,414 songs that reached the top five spots of British charts between 1999 and 2013, which constitutes a canon of popular music during that specific period. They showed that the less typical the lyrics of a song are within it, the higher it reaches in the rankings, while the more typical the lyrics are, the longer the song stays in the top five spots of the charts. These two articles show that typicality can be analysed in relation to a canon formed within a given musical genre, or to a canon defined by an objective criterion, such as record sales. They also show that typicality can be analysed at different lexical scales, by choosing the word as a unit or the theme to which these words refer.
However, while these articles make important contributions to the field, both have methodological limitations. Indeed, Berger and Packard (2018) have reduced the lexical richness of the lyrics to the themes they explore and thus do not actually look into lyrics’ typicality as a whole, but only into one of its sub-dimensions, namely thematic typicality. As for the work of North et al. (2020), although it proposes a word-level measure of the typicality of song lyrics and presents it as being correlated with different measures of popularity, it stems from a larger model that makes it dependent on a measure of music typicality, which renders its statistical interpretation problematic. Furthermore, this research relies mainly on the use of text analysis software based on a 10,000-word dictionary. These word dictionaries are limitative because they cannot account for the use of certain specific words, which might be typical of a given musical genre, or of a social group, time period or geographical area, and that may be relevant to consider to better understand the popularity of a given song. This could be the case of certain slang words (e.g., homies) or regional variants of a given word (e.g., y’all), but also of brand names, not to mention words invented by musical artists, such as ‘mullet’, coined by the Beastie Boys, or ‘yolo’, created by Drake A. Side (2019). Methods stemming from NLP might, in this case, be more suited since they allow the analysis of the typicality of lyrics in relation to a given canon at the word level, without being limited by the content of dictionaries.
NLP and lyrics’ typicality
The notion of typicality was first introduced in psychological and linguistic research to account for the internal structure of perceptual and semantic categories. Rosch (1973) moved away from previous studies that treated categories as composed of undifferentiated equivalent instances and demonstrated that some category members were better examples than others. For example, ‘carrot’ was deemed more typical of the category ‘vegetable’ than ‘pickle’. She defined the internal structure of categories as a ‘core meaning’ constituted of the most typical category examples, surrounded by the less typical members.
This graded structure led to a prototype view – also known as the family resemblance mode – first introduced by Wittgenstein (1953) before being refined by Rosch’s (1973, 1975) studies. In this view, a category can be described as a set of features or properties. Some properties are privileged properties, in the sense that they are necessary to grant membership. But they are not enough to define the boundaries of a category: a family description is therefore required. The family resemblance of a category member is calculated as the weighted sum of the properties it possesses, the weight of each property being determined by the number of category members that share it. In this model, prototypical members have all or most privileged properties, whereas atypical members of a category only share a few. In other words, classification is based on similarity to the central tendency; the prototypical member of the category is the one that best reflects the structure of the category as a whole (Rosch et al., 1976).
However, the prototype theory has been shown to have a few shortcomings; for example, it is easier to find the prototype features of a category than to identify sufficient ones, and such theory complicates the lexical and compositional meaning of concepts (Armstrong et al., 1983). Furthermore, whereas the family resemblance model treats properties as additive and independent features, studies have demonstrated that such properties tend to occur together in clusters (Malt & Smith, 1984; Rosch et al., 1976).
A contrasting view on modelling typicality is the exemplar view. In the exemplar theory, typicality is based on the summed similarity of an item to all exemplars of the target category. Indeed, the theory originates from the hypothesis that people categorize items by comparing them to examples stored in memory (Nosofsky et al., 2011). This way of defining typicality has been shown as less ‘efficient’ than the prototype view but is more flexible since it can better account for atypical examples (Nosofsky et al., 2011; Richard-Bollans et al., 2020). The adoption of both theories has been suggested as an alternative: multiple prototypes may be used to represent a category, and multiple examples may be averaged to form a prototype (Nosofsky et al., 2011). Furthermore, depending on the task at hand, one theory may be more appropriate than another. For example, Nosofsky et al. (2011) showed that whereas classification was linked to the prototypical view, recognition depended on the exemplar view.
But whereas both approaches to modelling typicality rely on computing a semantic distance to either a central prototype or multiple exemplars, few works discuss how to put such theories into practice. Connell and Ramscar (2001), inspired by the prototype theory, successfully simulated typicality effects with a co-occurrence model of language: latent semantic analysis (LSA). Without explicitly coding categories or semantic features, they were able to compute the typicality score for each item in their dataset with respect to the superordinate canonical category. The success of this measure in predicting typicality shows that typicality cannot be considered without accounting for the linguistic environment surrounding such concepts. More recently, in an attempt to develop a model for detecting typical comparable entity pairs from two sets of entities, Jain and Pantel (2009) leveraged the exemplar view to propose an integer linear programming formulation to detect typical entities. Finally, Richard-Bollans et al. (2020) introduced various models to automatically measure typicality and generate prototypes in the context of spatial language by using both similarity-based methods. We build upon previous work and define typicality as the distance to a prototypical instance. To generate such a prototype, we leverage NLP techniques to extract multidimensional features from the lyrics. For each of them, we define the corpus average as the ‘most typical’ member of the category.
Method
To evaluate the validity and effectiveness of our method for generating a typicality score, we chose to compare our results with those of previous works also dealing with the link between the typicality of song lyrics and their popularity. As mentioned earlier, these works are scarce, and we chose North et al.’s (2020) article because it provided enough information for us to recreate its corpus of songs, as well as several of its popularity measures, and thus have a clear basis for comparison and for extending this work.
Sample
As North et al.’s (2020) article did not disclose the exhaustive list of songs within their corpus, we recreated it by selecting all the songs that fit the criteria they mentioned, namely, all those that reached one of the top five spots in the UK Official Singles Chart Top 100 between January 1999 and December 2013. We used the Official Charts Company’s website (www.officialcharts.com) to find the songs matching these criteria, as the organization is in charge of maintaining the official records of the British charts. The lyrics of those songs were collected using the PyLyrics-Extractor package, then processed by expanding contractions and deleting interjections and special characters. Songs with unavailable lyrics were excluded from the corpus. Our final corpus includes 1,457 songs, while that of North et al. (2020) consists of 1,414 songs. It shall be noted that although North et al. (2020) describe their sample as being constituted of pop music, the word ‘pop’ should not be understood here as referring to the ‘pop genre’ but to music that is, since it appears in the top British charts, inherently ‘popular’. These charts thus include songs that may belong to the pop genre (e.g., Domino by Jessie J, Stronger by Kelly Clarkson, etc.), but also songs that belong to other music genre, such as Elbow’s One Day Like This (indie rock), Calvin Harris’s We’ll Be Coming Back (EDM), or Public Enemy’s Harder Than You Think (hip-hop).
Popularity
Of the four popularity measures used by North et al. (2020), two were not replicable because they included data from a set of national and regional charts, of which the exact composition was not disclosed. However, we were able to collect data for their other two popularity measures, namely the maximum rank (max rank) reached by a song in the chart (from 1 to 5) and the number of weeks spent by a song in one of the top five positions of the chart (weeks in top 5). These measures have also been used in other articles studying music trends (e.g., Askin & Mauskapf, 2014, 2017; Interiano et al., 2018). We also added two measures of popularity related to the trajectory of songs in the rankings, namely skewness and kurtosis of the ranking scores (Lee & Lee, 2015, 2018). In addition to making an additional theoretical contribution to the typicality literature, these two measures are useful from a managerial perspective as they allow us to describe the speed at which a song gains or loses popularity. For example, a song with a high skewness score achieved rapid popularity and declined slowly, and a low kurtosis score signifies slow growth in popularity.
Variables
Once the songs and lyrics were collected, we proceeded to create popularity metrics and extract relevant lexical features. From the literature on popularity and typicality, we created features related to four dimensions to assess the typicality of our corpus: (1) lexical repetition, (2) complexity, (3) topics, and (4) emotions.
Lexical repetition
Repeated exposure to the same stimulus has been shown to improve processing fluency, a driver of popularity. As illustrated by the presence of a ‘chorus’ and ‘hook’ in most songs, repetition is linked to a more pleasant experience and leads to quicker and broader adoption of songs in the marketplace (Nunes et al., 2014). Following the example of Nunes et al. (2014), we create two variables to measure the lexical fluency of each song. First, we measure the number of times the chorus is repeated in each song (chorus repetition). Then we compute the Hirsch-Popescu point (h-point) (Popescu & Altmann, 2006) to assess the vocabulary richness of the text. We compute the frequency distribution of each word in a song and rank them in descending order. We then compare each word’s rank with its frequency distribution: The h-point of a text corresponds to where the frequency distribution and the word’s rank intersect. A smaller h-point, therefore, means more vocabulary richness, and a bigger h-point is an indication of a more repetitive text. For instance, if the h-point is 10, the 10th most frequently occurring word in songs appears exactly 10 times. Conversely, if the h-point is 100, the 100th most frequently occurring word appears 100 times. In the latter case, high-frequency word repetition is more pronounced than in the former, indicating a greater degree of lexical repetition within the song. Finally, for each of our two variables, we define the typicality score as the absolute value of the difference between each song’s score and the corpus mean score for that variable.
Complexity
Another determinant of lexical fluency relates to the complexity of the vocabulary. Oppenheimer (2006) demonstrated the negative impact of complexity on lexical fluency. To assess such an effect, we create two variables to measure the complexity of the lyrics of our dataset. First, we compute the linguistic diversity of a song as the ratio between the number of different words in a song and the total number of words in a song (variety). Second, we define the complexity of a song as the average number of characters per word, as it is computed by the Diction software (Hart et al., 2013) (complexity). We then measure the typicality scores as the absolute value of the difference between the song’s score and the mean score for the whole corpus.
Topics
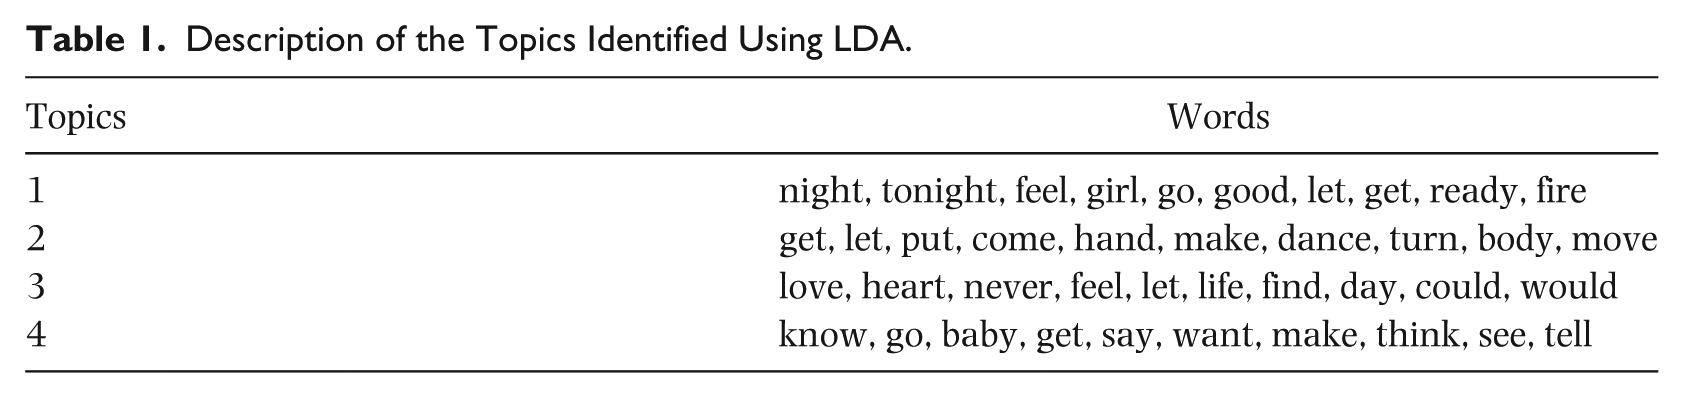
Berger and Packard (2018) showed that there was a relationship between a song’s lyrical topics’ typicality in regard to its own genre and its popularity. We focus on extracting the different topics covered in a song. We use latent Dirichlet allocation (LDA), a generative probabilistic model that allows a set of documents to be explained through thematic structures to extract the main themes of our corpus. More specifically, each document is seen as a mix of different topics, and each topic is a mix of words that frequently appear together. As such, each word has a probability of belonging to every topic; in that case, it is not surprising to see the most occurring words as probable in multiple topics occurring several times. Therefore, to understand the topics in an LDA approach, looking at all the words and their co-occurrences is essential. To provide a concrete example, the model looks at all the words across all documents and, based on their co-occurrences, tries to group them into topics. In our case, topic 1 is constituted of words such as ‘night’, ‘tonight’, ‘feel’, ‘girl’, and ‘let’, which means that these words tend to appear frequently together, while topic 3 is composed of ‘love’, ‘heart’, ‘never’, ‘feel’, and ‘let’. In that case, ‘let’ can be seen as a word occurring so many times that it is probable that it co-occurs with the other words twice. The interpretation of the meaning of each topic based on these co-occurrences remains different and subjective afterwards. To establish the best number of topics, we compare the perplexity score (Wallach et al., 2009) of different models with varying numbers of topics. The perplexity score is used to evaluate how well a model describes a set of documents by measuring its success in predicting new data. We also implement Green et al. (2014) stability analysis to confirm our chosen number. Green et al. (2014) proposed a term-centric stability analysis strategy to determine the appropriate number of topics given a corpus. They based their technique on the idea that a model with an appropriate number of topics is more robust to changes in the data. With these two approaches, we chose four as the number of topics. Table 1 shows the most important words associated with each topic.
Description of the Topics Identified Using LDA.
We then proceed to create two typicality metrics: the Kullback-Leibler divergence (KL divergence) – a statistical distance that measures how a probability distribution P is different from a second – and the distance between each song and the most recurrent topic in the whole corpus.
KL divergence: We first compute the topics’ distribution for each song. We then define the topic distribution for the whole corpus as the average of the topics for all songs. For each song, we are then able to compute the KL divergence between its own topics’ distribution and the corpus’ average. With this measure, we look for the extent to which the distribution of topics addressed in a song differs from the distribution of topics addressed on average in the corpus.
Distance to the main topic: With the LDA model, each document is assigned a probability of belonging to a certain topic. For each song, we identify the main topic with the highest probability of appearing in that given song. Therefore, we can define the main topic of the whole corpus of songs as the topic that is prominent in most songs. This topic represents the typical theme addressed. We can then define a distance for each song to this typical theme to measure the extent to which the song evolves around the most typical theme in the corpus. Since each topic is represented as a vector of the probability of words belonging to that topic, we can define the distance to the main topic of the corpus as the sum of the cosine similarity between each topic of a song and the main topic multiplied by the weight of each topic in the selected song.
Emotions
Several studies have shown a correlation between the emotions songs make listeners feel, in particular their ability to elicit arousal, and their likeability (North et al., 2017, 2018; North & Hargreaves, 1997). Although these studies do not distinguish the impact of lyrics from that of music on likeability, others have shown that a listener’s preference for song lyrics expressing certain emotions is related to their psychological profile (Rentfrow & Gosling, 2003), and that the lyrics of the songs that become popular over time tend to reflect the emotional evolution of the zeitgiest (DeWall et al., 2011). Therefore, it seems important to take emotions into consideration when looking into the link between lyrics’ typicality and popularity. To that end, we use the MoodyLyrics dataset (Çano & Morisio, 2017) for our experiments. This dataset was created by Çano and Morisio (2017) and annotated using a categorical version of Russell’s Valence-Arousal model (Russell, 1980) with four mood categories based upon two dimensions: happy/sad and angry/relaxed. To automatically tag songs on these two dimensions, we use a distilled version of the large language model BERT named DistilBert (Sanh et al., 2019) that is fine-tuned for the purpose of sentiment analysis. The DistilBert model is a general-purpose model which receives extra training on specific examples related to sentiment analysis. Since it is more difficult to predict arousal than valence, we train two DistilBert models for sentiment analysis, one for each axis, instead of a single multiclass model. To do so, we code each song in the dataset as two binary variables according to the two axes of the mood quadrant: valence and arousal. For example, the mood happy scores 1 in arousal and 1 in valence, whereas the mood relaxed scores 0 in arousal and 1 in valence. Once our models are trained, we use them on our own dataset to infer the two variables valence and arousal for each song. We then create two typicality variables computed as the absolute value between each song’s output probability for the target variable and the corpus mean probability for that same variable.
Typicality score
Using the methodology introduced above, we created eight variables representing different potential aspects of a song’s typicality. However, since we needed to obtain a total typicality score encompassing all these aspects (as analysed in North et al., 2020), we created the variable ‘Typicality score’ defined as the sum of all the typicality variables extracted from the lyrics according to the formula:
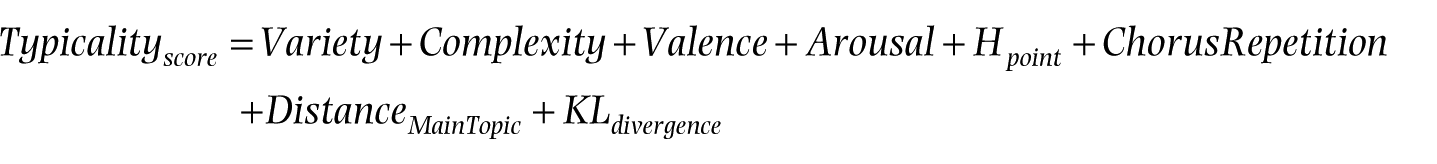
A lower typicality score indicates that a song is more typical of its canon, whereas a higher score suggests that the song has more unique lyrics (North et al., 2020).
Results
Our first goal was to replicate the results observed in North et al. (2020) in regard to lexical typicality of songs; we did not aim to optimize for the predictability of a song’s success with our variables because we were missing too many other predictors relative to the songs (tempo, BPM, key, artist popularity, etc.) for the model to be relevant. Our objective was, hence, to explain the effect of lexical typicality on song popularity. To account for correlation effects, we used general linear mixed models (GLMMs) to characterize the relationship between the typicality of the lyrics of a song and its popularity. GLMMs are an extension of generalized linear models for non-normally distributed and correlated responses. All the methodology and the results, including the data and the code to create and compute the variables, are available on our GitHub page (see Note 1). We fitted 36 separate models to assess whether the typicality of the lyrics of a song could predict its popularity. For each of the typicality variables we identified previously (variety, complexity, valence, arousal, h-point, chorus repetition, distance to the main topic, and KL divergence), we fitted four models, one for each of the popularity metrics defined in the Popularity subsection of the Method: max rank, week in top 5, skewness, and kurtosis. Each variable was analysed independently to interpret the associated coefficients, since they were potentially correlated. To demonstrate this, we performed a principal component analysis (PCA) and grouped all the variables under a single component. This single component was able to explain 90.8% of the variance associated with our variables, demonstrating their correlation. Each of the models included random effects for the artist and the label to account for the correlations between songs from the same artists and from the same labels, and their popularity. For instance, the differences in popularity among songs with varying levels of lyrics typicality may be attenuated by a loyal fan base, other popular song characteristics that are homogeneous within an artist’s repertoire (danceability, BPM, etc.), or the continued branding and communication efforts of their record label. We also include the p-values resulting from a double-sided p-test to validate the null hypothesis that the beta predictor’s coefficients associated with each variable can influence music popularity.
As shown in Table 2, we can see that the only statistically significant models are those predicting the number of weeks spent by a song in the top five and UK hit appearance. Indeed, the models that try to predict the week in top 5 popularity metric with the typicality score, the h-point, or the variety of lyrics as predictors are statistically significant (p = .035, p = .003, and p = .041, respectively).
Summary of GLMM Analysis Results Per Dependent Variable.
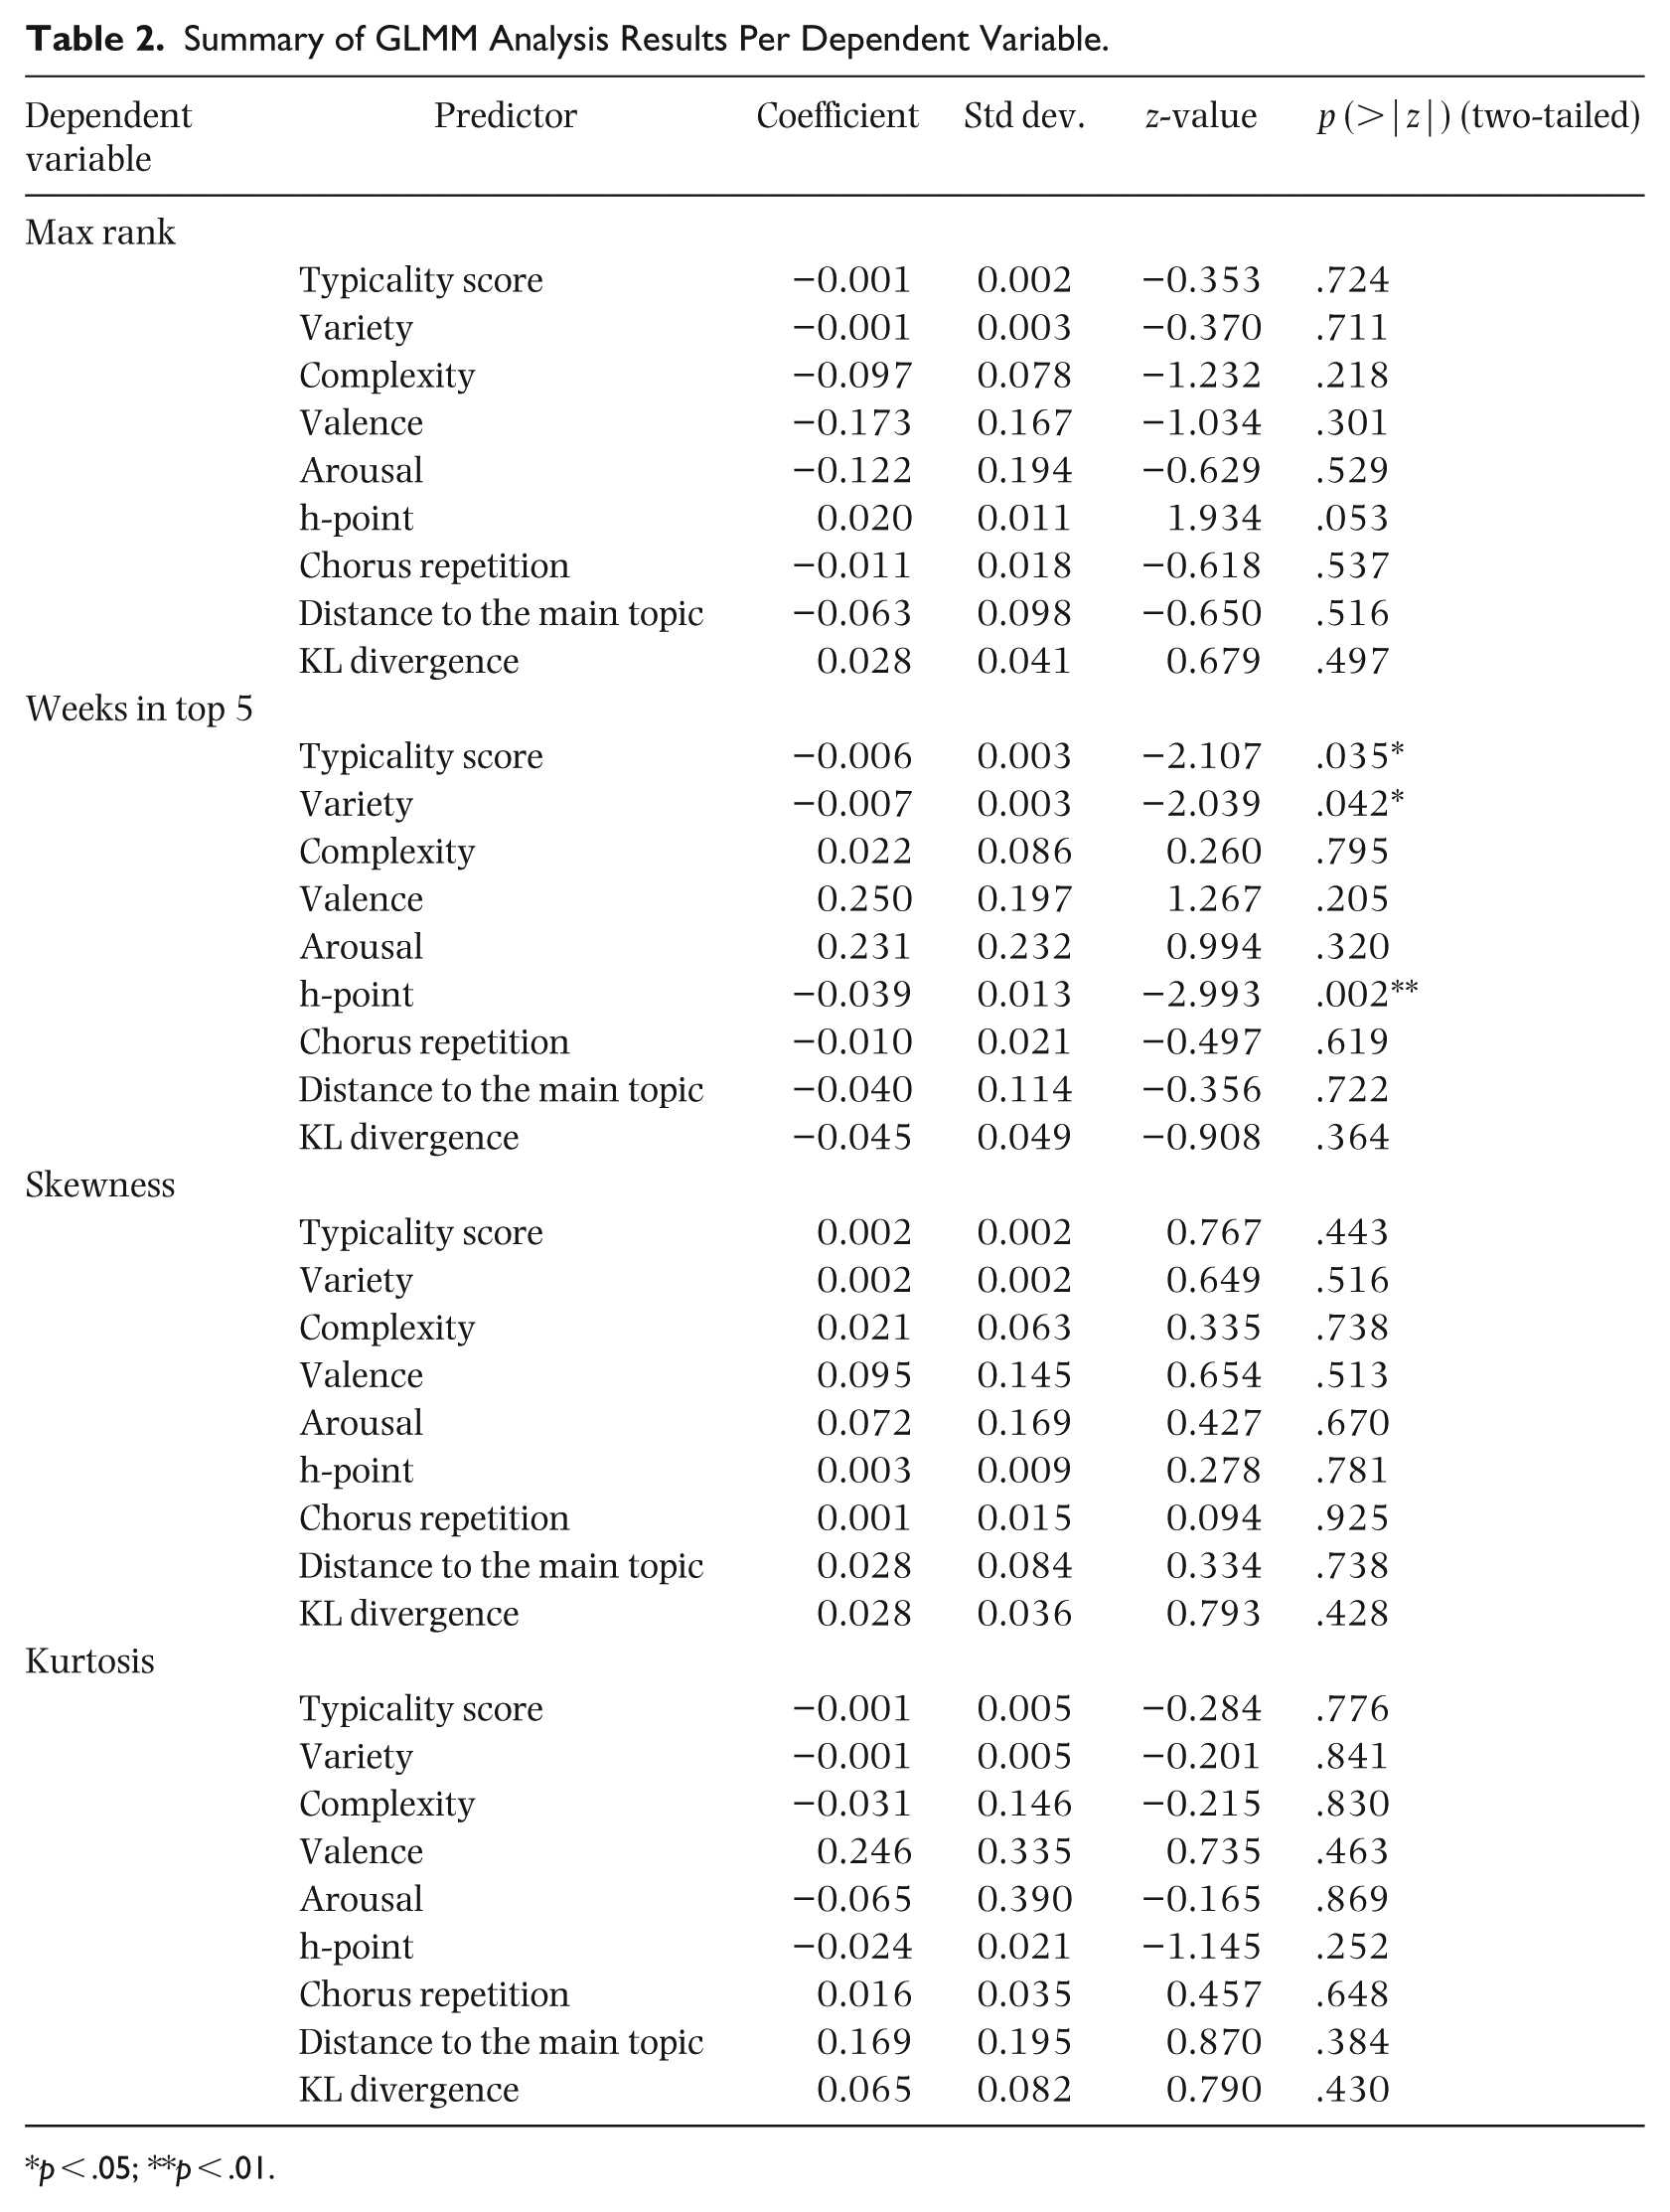
p < .05; **p < .01.
For these three models, the estimated predictor’s coefficient is negative, indicating an inverse relationship between typicality scores and popularity. In other words, songs that are more typical are also more popular since songs with higher scores are more atypical. As such, when we use the typicality score as a predictor, all other things being equal, for an additional week spent in the top five and UK hit appearance, it decreases by 1%, exp(−0.006). For the model using the h-point variable as a predictor, an additional week spent on the top 5 leads to a decrease of 1%, exp(−0.039), of the h-point typicality metric. And finally, for the model using the variety typicality score, an additional week on the top five also means a decrease of 1%, exp(−0.007), in variety.
We can see that even if significant, the relationship between the response variables and different predictors is weak. Furthermore, when it comes to peak chart position (max rank) and the trajectory of songs in the rankings (skewness, kurtosis), Table 2 shows that none of these fitted models are statistically significant. These findings suggest that lyrics’ typicality by itself might not be enough to predict the popularity of a song since previous work has demonstrated the importance of looking at different measurements of typicality, notably by looking at variables related to music typicality (North et al., 2020; Yu et al., 2023) or chords typicality. Yu et al. (2023) mention the importance of looking at different dimensions of ‘uniqueness’ or typicality to be able to capture non-redundant information about a song’s relationship with popularity.
Discussion
The first observation stemming from our results is that lyrics’ typicality has a limited influence on song popularity within the selected canon. Notably, the typicality of lyrics only affects for how long a song remains in the top five spots of that specific chart, which is only one measure of popularity out of four. Indeed, typicality does not have a significant impact on the other three measures that we identified: the maximum rank achieved by the song in the chart, as well as the skewness and kurtosis of its trajectory through the top five positions over time. Moreover, it is crucial to note that our corpus solely comprises songs that made it to the top five positions in the chart. In this case, although lyrics’ typicality impacts the number of weeks a song stays in the top five, it cannot help that song to reach one of these top spots in the first place.
Furthermore, although the observed effects are statistically significant, they do not hold practical significance due to the low coefficients in our linear regressions. As such, it would not be appropriate to draw specific recommendations from these results for artists and record labels hoping to break through the canon. Indeed, it would be exaggerated to claim that writing lyrics that have the same level of lexical diversity and repetitiveness as those of the canon could be an effective strategy. Additionally, this study does not aim to provide a silver bullet that would guarantee a song’s long-standing position within the top spots of the charts. Such an endeavour would be worthless, given the numerous factors that have been identified as influencing a song’s popularity (Finnäs, 1989). It is notably crucial to contextualize a song and its canon accurately, taking into account where and when it was released.
Nevertheless, these findings are valuable as they seem to support the validity of our methodology. Indeed, while we tested it on the same corpus of songs as North et al. (2020), our results mostly align with theirs. As in their study, we found a statistically significant impact of lyrics’ typicality on the time songs remain in the top five spots of the chart. We also showed that the more typical its lyrics are of the studied canon, the longer a song will stay in those top spots. However, contradicting North et al. (2020), we did not find any significant effect of lyrics’ typicality on the highest rank a song achieved within the chart. It is nonetheless noteworthy that their associated p-value (p = .035) is substantially greater than the one they found for the effect of lyrics’ typicality on the time spent by the song in the top five spots of the charts (p = .002).
The discrepancies observed in these findings could possibly be attributed to the consideration of repetitiveness in our typicality score. As our method does, the DICTION dictionaries employed by North et al. (2020) for assessing lyrics’ typicality consider complexity, themes, and emotions. However, out of the 36 dictionaries they used, none of them seem to account for the repetitiveness of lyrics, which North et al. (2020) omitted as it had already been addressed by Nunes et al. (2014). Nevertheless, we acknowledge that the repetitiveness of lyrics is an intrinsic characteristic of songwriting, that a song may vary in how typical it is of a particular canon in this regard, and thus we integrated this factor into our measurement of lyrics’ typicality. Furthermore, the h-point variable had a statistically significant impact on one of our popularity measures, while almost all of the other variables did not.
Overall, given the similarities between our study’s findings and those of North et al. (2020), we believe that our metrics and method will be a valuable addition for the scientific community. They seem to adequately measure the typicality of song lyrics with regard to a broader set of lyrics, based on four key attributes defined in a transparent manner (lexical repetition, complexity, topics, emotions). These metrics can also be used to assess the typicality of other types of texts for which they are relevant and then contribute to the creation of specific typicality scores. This technique is also more flexible when it comes to considering the evolution of languages over time. Moreover, these metrics can be fine-tuned by the scientific community without having to build new dictionaries in software such as LIWC or DICTION. This not only avoids labour-intensive processes but also limits the possibility of introducing bias. Finally, while these software programmes assign equal representativeness to all words belonging to the same dictionary, our method allows for a more nuanced assessment of the sentiments and themes that are present within texts.
Although testing the robustness of North et al.’s (2020) research is desirable from an epistemological perspective (Soler, 2012), our aim was also to make most of it replicable by providing researchers with accessible tools and data to do so. In doing so, we help address the issue of the replication crisis in psychological science (Wiggins & Christopherson, 2019), which in turn contributes to addressing a much broader crisis, namely the lack of confidence that practitioners have in this field of study (Pashler & Wagenmakers, 2012). Although we acknowledge the challenges that researchers may face, particularly in relation to data confidentiality, we have taken the opportunity to make replicable the majority of findings from a research article that we believe to be important to the field of music psychology. By providing access to these metrics, we are enabling the scientific community to replicate this research, thereby increasing the trustworthiness of its findings.
Limitations and future research
One of the main limitations of this study is its limited potential for generalization to other song canons. We solely examined a corpus of songs that appeared in the top five spots in the British charts between 1999 and 2013. This study thus investigates what has constituted a canon of popular music for the British public during this given period. In addition, this chart compiles songs from various musical genres, and Berger and Packard (2018) demonstrated that the impact of lyrics’ typicality varies from one music genre to another. According to their findings, we could hypothesize that within a rock music canon, songs that score higher in lyrics’ typicality would be less popular. Unfortunately, unlike Berger and Packard (2018), we did not have access to control variables such as radio airplay, artist popularity, and song release date, and it might impact the generalization of our results.
Furthermore, the canon we studied only spans from 1999 to 2013. Although streaming platforms existed in 2013, it is worth questioning the extent to which their recommendation agents are able to influence consumers’ preferences for typical lyrics, and how far they expose consumers to songs that are not typical of those they listen to the most. If these agents consider the similarity of lyrics to those of their users’ preferred songs when creating recommendations, it could reinforce their dislike of atypical songs.
Moreover, by choosing to focus on lexical lyrics’ typicality, albeit in an integrative manner, we have not included features of lyrics’ typicality that might be structural in nature, such as narrative arcs. We therefore invite researchers to develop natural language processing metrics that could detect the presence and articulation of storytelling components (e.g., conflict, plot, etc.) in order to investigate the effect of the typicality of the narrative structure of lyrics on song popularity.
Lastly, we must also raise the question of who decides what is included in a canon. Our study focused on a canon based on song popularity; however, our literature review revealed that this is not always the case. The creation of canons and their exposure often rely on the judgements of critics, music writers, record companies, and independent labels on what holds value, as well as the preferences of a dominant class with the resources to establish these canons as having greater cultural significance (Bourdieu, 1979; Farnsworth, 1969; Kopiez et al., 2009; Mueller, 1951). Further research could thus be conducted to analyse how lyrics’ typicality influences the popularity of songs that belong to canons that were not created solely on the basis of popularity.
Footnotes
Declaration of conflicting interests
The authors declared no potential conflicts of interest with respect to the research, authorship, and/or publication of this article.
Funding
The authors received no financial support for the research, authorship, and/or publication of this article.