
Abstract
The Music Self-Perception Inventory-Short (MUSPI-S) is a theoretically based instrument consisting of 28 items with subscales that assess music self-concept globally and in six specific areas. The present study sought to validate a German translation of the MUSPI-S using a sample of 444 secondary school students. In addition to participants’ scores from the German translation of the MUSPI-S, associated data included demographic background variables, self-reported school grades in various subjects, and interest in the school subject of music. Confirmatory factor analyses supported the hypothesized factor structure and measurement model for MUSPI-S scores. Latent factor correlations among MUSPI-S subscale scores and correlations of these scores with school grades and interest in the school subject of music aligned well with theoretical expectations and previous research. Findings also provided evidence for strict measurement invariance of scores in the German MUSPI-S across subgroups of gender, school year (i.e., grade level), and musical activity. MUSPI-S subscale factor-level means did not reliably differ among seventh-, eighth-, and ninth-grade students but favored females over males and musically active over non-active students on nearly all subscales. Overall, this evidence supports the use of the German translation of the MUSPI-S in assessing a wide range of important self-perceived musical abilities for research and practical assessment purposes.
Keywords
Self-concept is one of the most extensively researched constructs in psychology and education. Shavelson et al. (1976) defined self-concept as a person’s self-perceptions in a range of domains comprising “[. . .] the totality of the individual’s thoughts and feelings [. . .]” (Rosenberg, 1979, p. 7; see also Trautwein & Möller, 2016). Subsequent research based on the model proposed by Shavelson et al. (1976; see, e.g., Marsh, 2007; Marsh & Craven, 2006; Marsh & Scalas, 2010) supported the multidimensional and sometimes hierarchically structured nature of such self-perceptions. To incorporate music self-concept into the model proposed by Shavelson et al., Vispoel (1994, 2021, 2003) extended the self-concept hierarchy by adding artistic self-concept at the same level as academic and non-academic self-concepts and emphasized the importance of measuring self-concept separately within different areas of artistic activity, such as music, dance, drama, and the visual arts. In keeping with related contemporary research (e.g., Marsh, 2007; Marsh & Craven, 2006; Marsh & Scalas, 2010), Vispoel (1994, 2021, 2003) further subdivided overall music self-concept into domain-specific subcomponents that supported music self-concept’s multifaceted, hierarchical structure at that level. While doing so, he created the 84-item Music Self-Perception Inventory (MUSPI) as an instrument to measure multiple facets of music self-concept. A 28-item shortened form (MUSPI-S) described by Morin et al. (2016) has subsequently been developed and used in multiple studies (see, e.g., Goñi et al., 2020; Morin et al., 2017; Scalas et al., 2017). Because a German-language version of the MUSPI-S was unavailable prior to the present study, we sought to fill this gap by validating scores from a German translation with seventh- to ninth-grade students in academically selective secondary schools in Germany. We derived relevant descriptive statistics from our data, estimated subscale reliability, and evaluated model fit, as well as measurement and structural invariance across subgroups formed by gender, school year (i.e., grade level), and musical activity. We further examined latent factor correlations between scores on subscales of the German MUSPI-S and various external outcome measures, such as self-reported school grades in a number of subjects and interest in the school subject of music.
Music self-concept
Schnare et al. (2012) consider “musical self-concept” as incorporating an individual’s beliefs, self-schemata, and perceptions around their musical possibilities and abilities (see also Morin et al., 2016). Relatedly, Vispoel (2003; see also Vispoel, 1994, 2021) defines music self-concept as “self-perceptions of competence in music formed through experiences with the environment and interpretations of those experiences” (p. 153) and emphasizes “that such self-perceptions are influenced in part by evaluation from others, reinforcements, and causal beliefs about one’s performance and accomplishments in music” (p. 153). Within the studies cited earlier, Vispoel found that “global” music self-concept revolves predominantly around self-perceptions of skill in auditory cognition and instrumental performance rather than abilities in singing or dancing/moving to music (see also Morin et al., 2016, 2017).
Within the broad network of self-perceptions, music self-concept is a component of general artistic self-concept and encompasses various music-related abilities, such as playing an instrument, reading music, composing, listening, and singing, with some abilities showing stronger relationships with overall music self-concept than do others (Morin et al., 2016, 2017; Vispoel, 1994, 2021, 1995, 2003 ; Yeung et al., 2001). Existing German-language instruments for the assessment of music self-concept often treat it as a facet of the general academic self-concept (e.g., Fritzsche et al., 2011; Penthin et al., 2017). Spychiger (2017; Spychiger et al., 2009) has also noted that “musical self-concept” could encompass additional components such as engagement with music and social, emotional, and spiritual aspects of music experience. Spychiger (2017), when developing the Musical Self-Concept Inventory (MUSCI; see also Fiedler & Spychiger, 2017; Spychiger et al., 2009), viewed music self-concept as multidimensional but non-hierarchically structured (see, e.g., Harter, 2003; Mischel & Morf, 2003), although one conceptualization of music self-concept (multidimensional versus hierarchical) is not necessarily incompatible with the other (Vispoel, 1994, 2021, 2003; Morin et al., 2016).
The relevance of music self-concept to educational settings
The importance of music self-concept in educational settings has been demonstrated in numerous research studies showing that music self-concept is linked to motivation toward musical practice and engagement (e.g., Schmidt, 2005; Schnare et al., 2012; West, 2013), motivation and interest in music as a school subject (e.g., Fiedler & Hasselhorn, 2020; Fiedler & Spychiger, 2017), self-reported school grades in music (e.g., Morin et al., 2016, 2017; Vispoel, 1993, 1996), practical music competencies (e.g., Demorest et al., 2017; Lill et al., 2019, 2020), and overall self-esteem (Scalas et al., 2017; Vispoel, 2003). Studies have shown that females compared to males, on average, participate more intensely in musical activities, hold stronger motivational beliefs around music (e.g., Morin et al., 2016, 2017; Simpkins et al., 2010), and have correspondingly higher self-perceptions of music-related abilities (Morin et al., 2016, 2017; see also Austin & Vispoel, 2000; Vispoel & Forte, 2000; Vispoel & Rizzo, 2003). In contrast, no compelling empirical support has been found to date for age- or grade-related differences in the overall structure of music self-concept using current instruments across junior high school and college levels (e.g., Morin et al., 2016; Vispoel, 2003).
In line with the multidimensional and sometimes hierarchical nature of self-perceptions, associations between domain-specific subcomponents of music self-concept and global music self-concept are generally stronger than are associations of these subcomponents with one another (Morin et al., 2016, 2017; Vispoel, 2003). Researchers (Arens et al., 2022; Vispoel, 1994, 2021, 1996, 2003 ; Yeung et al., 2001) also have found that music self-concept is more strongly associated with self-perceptions that were conceptually connected (e.g., artistic self-concept) than with those that are conceptually distinct (e.g., physical self-concept). Similarly, correlations between self-concepts and outcomes related to the same domain (e.g., music self-concept and school grades in music) are typically stronger than those between self-concepts and outcomes across different domains (e.g., music self-concept and school grades in math or physical education; e.g., Arens et al., 2022; Arens & Preckel, 2018; Marsh et al., 2015; Morin et al., 2016, 2017; Vispoel, 1993, 1996). Nevertheless, self-perceptions of musical abilities are more strongly related to achievement in some outside areas (e.g., literacy) than in others (e.g., math, physical education; e.g., Morin et al., 2016, 2017; Vispoel, 1993, 1995, 1996). Such results make sense, given the importance of verbal skills in the context of teaching and learning music at elementary, secondary, and higher levels of education.
To sum up, facets of music self-concept, like other subdomain-specific self-concepts (see, e.g., Eccles & Wigfield, 2002; Marsh, 2007; Marsh & Craven, 2006; Wigfield & Eccles, 2000), can function as powerful predictors of multiple beneficial outcomes such as school grades, related achievements, and interest in music that impact motivational processes (e.g., Morin et al., 2016, 2017; Scalas et al., 2017; Schnare et al., 2012; Vispoel, 1993, 1996; West, 2013). When researching such relationships, self-reported school grades are often used as proxies for actual (recorded) school grades, and the strong correspondence between these measures in various subjects was reported in a recent longitudinal study by Sticca et al. (2017). As noted previously, high levels of self-concept typically develop from positive performance experiences and appropriate feedback from significant others (e.g., Arens et al., 2017; Marsh & Craven, 2006). Thus, students with high reported music self-concept scores tend to receive better school grades in music, with such self-perceptions and performance outcomes likely to have positive reciprocal effects over time when students maintain active participation in music (e.g., Marsh, 2007; Marsh & Craven, 2006; Marsh & O’Mara, 2008; Valentine et al., 2004).
Measuring music self-concept: the Music Self-Perception Inventory (MUSPI-S)
The MUSPI-S consists of 28 positively worded items to simplify its structure and efficiently focus on a variety of musical abilities. It has one subscale for the measurement of “Global Music Self-Concept” (Global MSC) and six domain-specific subscales: Instrument Playing; Reading Music; Composing; Listening; Singing; and Dancing/Moving to music. All subscales have four items whose scores can be collectively interpreted from either a multidimensional or a hierarchical perspective.
Research conducted by Morin et al. (2016) supported the MUSPI-S’s seven-factor structure (CFI ⩾ .95; RMSEA ⩽ .06) and demonstrated fully satisfactory levels of reliability (ω = .92 to .95) and high factor loadings (λ = .82 to .95) across calibration and cross-validation samples. In line with Vispoel (1994, 2021, 2003) and Vispoel and Forte (1994), Morin et al. (2016) found that the MUSPI-S subscale scores on Singing (Mr = .44) and Dancing/Moving (Mr = .37) were correlated more weakly with other MUSPI-S subscale scores than those other subscale scores were correlated with each other (Mr = .75). Furthermore, domain-specific MUSPI-S subscale scores, on average, were each more strongly correlated with Global MSC (Mr = .73) than with one another (Mr = .54), supporting Shavelson et al.’s (1976) model (Morin et al., 2016).
Researchers have investigated the convergent and discriminant validity of MUSPI (Vispoel, 1994, 2021, 2003) and MUSPI-S (Morin et al., 2016) subscale scores using an array of theoretically relevant external outcome measures. Morin et al. (2016) noted that correlations between MUSPI-S subscale scores and school grades were almost null or weak (r ⩽ .20) for school subjects not related to music (such as mathematics and physical education), whereas correlations were stronger (r ≥ .20) in relation to school grades in music and other areas, such as English, that are more closely related to learning music. Apart from the MUSPI-S subscale scores in Dancing/Moving, all MUSPI-S subscale scores were significantly and positively correlated with the number of years of music training students had undertaken and their past involvement in musical groups (Morin et al., 2016, 2017). Similarly, students’ self-concepts, self-perceived abilities, and interests in the same areas were more strongly correlated with one another than those in other areas, illustrating that within-domain correlations (e.g., Singing self-concept with self-perceived ability in singing) were systematically higher than across-domain correlations (e.g., Singing self-concept with self-perceived ability in Dancing/Moving to music; Morin et al., 2016, 2017; see also Arens & Preckel, 2018; Marsh et al., 2015). Finally, Morin et al. (2016) reported strict measurement invariance and invariance of factor variances and covariances for MUSPI-S scores across gender and different school years (i.e., grade levels) subgroups. In the invariance analyses for subgroups formed by gender, factor-level means for females were higher than those for males in Dancing/Moving, Instrument Playing, Reading, Singing, and Global MSC, but no such differences were found between seventh- and eighth-grade students.
The present study
For the present study, we created a German-language version of the MUSPI-S from Morin et al. (2016) and validated its subscale scores with a sample of secondary school students. Initially, we examined the psychometric properties of scores from the German MUSPI-S, expecting them to be in line with those reported by Morin et al. (2016) for the original MUSPI-S. We then evaluated the goodness of model fit for the factor structure of scores from the German MUSPI-S and systematically tested measurement and structural invariance of those scores across subgroups formed by gender and different school years (i.e., grade levels). In keeping with Morin et al. (2016), our expectation was that German MUSPI-S scores would be congruent across genders and different school years regarding measurement invariance and invariance of factor variances and covariances. Similarly, we expected to find reliable factor-level mean differences between gender subgroups, with females showing higher factor-level means than males for all MUSPI-S subscale scores except Composing and Listening, but no reliable factor-level mean differences in MUSPI-S subscale scores across seventh-, eighth-, and ninth-grade students.
In expanding the scope of earlier research and responding to the need for invariance testing across new and diversified samples (Morin et al., 2016), we also evaluated measurement and structural invariance across subgroups with differing levels of musical activity. We expected scores from the German version of the MUSPI-S to demonstrate measurement invariance and invariance of factor variances and covariances across musically active and non-active students and to produce factor-level mean differences for all subscales, with higher factor-level means for musically active students (see, e.g., Arens et al., 2017; Marsh & O’Mara, 2008; Valentine et al., 2004).
Finally, we anticipated that patterns of correlation between German MUSPI-S subscale scores and external outcomes measures would be comparable to those observed for the original MUSPI-S. Specifically, we expected to replicate the noteworthy positive associations found by Morin et al. (2016) between MUSPI-S subscale scores and school grades in music (r ⩾ .30), moderate positive correlations with school grades in the subject of students’ native language (r ⩾ .20; English in the Morin et al. study, German in the present study), and near-zero associations with school grades in mathematics and physical education (r ⩽ .20). We also anticipated that subscale scores on the German MUSPI-S would show moderate correlations with participants’ interest in the school subject of music.
Method
Participants
The sample comprised N = 444 students (aged 11 to 17 years; age: M = 13.22; SD = 0.95), all recruited from two academically selective secondary schools (Gymnasien) in the German federal state of Schleswig-Holstein; 154 (34.7%) were in seventh grade, 151 (34.0%) in eighth grade, and 139 (31.3%) in ninth grade. The sample had a higher percentage of females (n = 258; 58.1%) than males (n = 180; 40.5%), with few non-binary students (n = 4; 0.9%; two missing values; 0.5%). Within almost all schools in Germany, including the two from which we sampled participants, English is taught as a first foreign language. Most students in the sample chose French (n = 210, 47.3%) as their second foreign language, followed by Latin (n = 151, 34.0%). A large majority of students (n = 423, 95.3%) were born in Germany, and most (n = 368, 82.9%) spoke only German at home. We assessed the socioeconomic status of the students’ families by asking them to estimate the number of books in the family home (Paulus, 2009). Students’ responses to this question indicated that the majority came from homes with high socioeconomic status (see Supplemental Appendix A). To distinguish levels of musical activity, we used the following three questions: (1) “Do you play a musical instrument in an orchestra, an ensemble, or a band?”; (2) “Are you taking extracurricular instrumental or voice lessons?”; and (3) “Do you sing in a choir?”. We then divided students with a valid score on these three questions (n = 441; three missing values) into two groups: “musically active” students, that is, those who answered “yes” to at least one of these three questions (N = 212 musically active students [n = 79 male; n = 130 female; n = 3 non-binary]) and “musically non-active” students, that is, those who answered “no” or “[I] used to, but I do not anymore” (N = 229 musically non-active students [n = 99 male; n = 127 female; n = 1 non-binary; two missing values]).
Procedures and measures
The data reported here were part of a longer, 12-page questionnaire consisting of multiple-choice questions. The research was approved by the Ministry of General Education and Vocational Training, Science, Research and Culture of Schleswig-Holstein. In line with German and European data protection law, we provided school administrators, teachers, participants’ parents/caregivers, and the participants themselves with full information about the study, ensuring they knew that participation was voluntary and that their responses would be completely anonymous. Both the participants’ parents/caregivers and the participants themselves provided written informed consent to participate. Externally trained testers visited the schools to administer the paper-and-pencil questionnaires, which students completed in quiet classroom conditions. The testers then collected the completed questionnaires and packed them in sealed envelopes.
The questionnaire began with introductory information and a manual to generate a personal pseudonymized identification (ID) code, followed by items about sociodemographics variables (including age, gender, current school year/grade level, type of school attended) and socioeconomic status, such as parental occupations, country of birth, language(s) spoken at home, and how many books there were in the family home. The next set of questions focused on students’ choice of a second foreign language at school and their musical backgrounds. These items were followed by items designed to measure students’ overall self-esteem and self-perceptions about relationships with parents and peers (Arens et al., 2013), proficiency in various school subjects (Marsh, 1992), physical appearance (Schwanzer et al., 2005), and interests in various subject areas (Artelt et al., 2013; Baumert et al., 1997). Several control items, such as “Please circle the number 5,” were randomly distributed throughout the questionnaire.
Interest in the school subject of music
To assess participants’ interest in the school subject of music, we next adapted two items from the German-language studies “Bildungsverläufe und psychosoziale Entwicklung im Jugendalter (BIJU)“ (Baumert et al., 1997) and “Bildungsprozesse, Kompetenzentwicklung und Selektionsentscheidungen im Vorschul- und Schulalter” (Artelt et al., 2013). Participants were asked to respond to the items “Would you like to have more lessons in [the subject of] music at school than you have now?” and “Do you look forward to having a lesson in [the subject of] music at school?” on a five-point Likert scale, selecting either not at all (1), a little (2), moderately (3), quite a lot (4), or a lot (5). We considered previous estimates of reliability for this scale to be acceptable for the purposes of the study in relation to both alpha (α) and omega (ω) coefficients (α = .88 and ω = .89).
The short form of the Music Self-Perception Inventory (MUSPI-S)
Following these items, participants completed the German translation of the MUSPI-S and were then asked, “What grade did you get on your last school report?” for various subject areas. We assessed music self-concepts using the short form of the Music Self-Perception Inventory (MUSPI-S) from Morin et al. (2016). Creating the German-language version of the inventory entailed strict adherence to a process of translation and back translation. Initially, the first, second, and third authors and three student assistants at the Musikhochschule (University of Music) Lübeck (Germany) all independently translated the original English items into German. The next stage, after the resolution of discrepancies among these translations, was to compile the German MUSPI-S. One native speaker of English and one first-language speaker of German with professional English skills back-translated this initial version. The team completed the process by revising the German-language version to ensure that items from the final German MUSPI-S were equivalent in content to the English original (see Table 1 for the complete set of German-language MUSPI-S items used in this study and Morin et al., 2016, for the corresponding English-language items). Students provided responses using the following six-point Likert-style scale: false (1), mostly false (2), more false than true (3), more true than false (4), mostly true (5), and true (6).
Descriptive Statistics, Reliability Coefficients, and Parameter Estimates for the Measurement Model From Table 2 (Baseline Model).

Note. M = mean on item metric, SD = standard deviation on item metric, α = alpha reliability coefficient (Cronbach, 1951), ω = omega reliability coefficient (McDonald, 1970, 1999), λ = standardized factor loading; δ = standardized item uniqueness. The items are a translation into German of the short form of the Music Self-Perception Inventory (MUSPI-S) as compiled by Morin et al. (2016).
School grades in various subjects
In the final set of items, levels of academic attainment were measured by asking students to provide their most recent report grades in the school subjects of German, English, the student’s second foreign language (such as French [n = 210; 47.3%] or Latin [n = 151; 34.0%]), mathematics, physics, biology, visual arts, and music. Grades in the German school system cover a range from one to six, with one representing the best and six the weakest grade. We reverse-coded school grades within our data analyses so that higher numerical values reflected higher levels of academic attainment.
Statistical analysis
We conducted all statistical analyses using R version 4.0.3 (R Core Team, 2023). First, we derived descriptive statistics (means and standard deviations) for all MUSPI-S subscales, along with alpha (Cronbach, 1951) and omega (McDonald, 1970, 1999) reliability coefficients (R semTools package, version 0.5-6, Jorgensen et al., 2022) from our data. Unlike alpha (α), omega (ω) has the advantage of considering the strength of association between items and constructs and of taking item-specific errors into account (Sijtsma, 2009).
Second, to examine the internal structure of MUSPI-S scores, we conducted confirmatory factor analyses (CFAs) using the lavaan package in R (version 0.6-13; Rosseel et al., 2023). The CFA approach provides a stringent evaluation of goodness of fit for theoretically prespecified models (Brown, 2006). For the CFAs, we followed Morin et al. (2016) in choosing the WLSMV procedure (robust diagonally weighted least squares estimation) with its default settings for robust standard error and robust test statistics (Rosseel, 2012; see also Bandalos, 2014; Finney & DiStephano, 2013). Models allowed for correlations among factors, and full information estimation was used to take into account the small amount of missing data per item (the average percentage of missing values is only M = 0.60% across the 28 items of the MUSPI-S; percentages for each item ranged from 0% to 1.36%). In the CFAs, models were identified by fixing the unstandardized factor loadings of the first item of each scale to one.
Third, in the next set of models, we ran multiple-group confirmatory factor analyses (MGCFAs; see, e.g., Byrne, 2008; Byrne et al., 1989) to test for measurement and structural invariance of MUSPI-S scores across genders, school years (i.e., grade levels), and levels of musical activity following sequences recommended by Meredith (1993) and Millsap (2011). To this end, we included subgroups formed by gender (female and male), 1 school year (seventh-, eighth-, and ninth-grade students), and level of musical activity (musically active and non-active students) as grouping variables. We followed the typical forward approach in exploring invariance across these groups by imposing an increasing number of cross-group equality constraints within the models and continually checking the change in goodness-of-fit indices (i.e., △goodness-of-fit indices) implied by these constraints. The first four steps of the MGCFAs involved hierarchical tests for invariance of the measurement parameters (i.e., configural, weak, strong, and strict invariance). The last two steps, relating to the invariance of factor variances and covariances and invariance of factor means, entailed tests for invariance of the structural parameters across the various subgroups (Meredith, 1993; Millsap, 2011). As a follow-up to the last step, we conducted post hoc comparisons for the full strong invariance model whenever findings of previous research had suggested differences in factor-level means among subgroups. In these analyses, one subgroup factor-level mean was set to equal zero for identification purposes, and the other subgroup factor-level means were freely estimated.
To evaluate the goodness of fit for the CFAs, we report comparative fit index (CFI), root mean square error of approximation (RMSEA), and standardized root mean square residuals (SRMRs; Brown, 2006; Kline, 2005). We also provide the WLSMV chi-square test statistics with the corresponding degrees of freedom. For the CFIs, we considered values higher than 0.95 as an indication of good model fit (Hu & Bentler, 1998). For the RMSEAs and their 90% confidence intervals, we considered values lower than 0.05 as indicative of a good fit, those between 0.05 and 0.08 as indicative of a reasonable fit, and those greater than 0.10 as indicative of a poor fit (Brown & Cudeck, 1993). Finally, for SRMRs, we considered values of 0.08 or lower to reflect a reasonable fit (Hu & Bentler, 1998). However, we caution readers that the cut-off values for goodness-of-fit indices described here are subjective in nature and function only as rough guides (Marsh et al., 2004; Marsh & Hau, 1996).
Within the MGCFAs, we followed recommendations made by Chen (2007; see also Cheung & Rensvold, 2002) in assessing change (△) in goodness-of-fit indices such as △CFI, △RMSEA, and △SRMR between nested models when cross-group equality constraints were added. Specifically, we assumed invariance when the change in CFI (△CFI) was smaller than 0.010; the change in RMSEA (△RMSEA) was smaller than 0.015; and the change in SRMR (△SRMR) was smaller than 0.030 for configural and weak invariance and smaller than 0.015 for strong and strict invariance, factor variances and covariances invariance, and factor means invariance. When these established cut-off values are exceeded, the more parsimonious (invariant) model should be retained.
Finally, in our last set of analyses, we incorporated school grades in music, German, English, the participant’s second foreign language, mathematics, physics, biology, and visual arts (each defined as single-item factors), and participants’ interest in the school subject of music (defined as a multiple-item factor), into the CFAs for the purpose of examining the convergent and discriminant validity of self-concept factor scores from the German MUSPI-S.
Results
Descriptive statistics and reliability estimates
Descriptive statistics, alpha coefficients, and omega coefficients for each MUSPI-S subscale appear in Table 1. As would be desired in a measure of this nature, scores from the German MUSPI-S were highly variable, with item-scale standard deviations ranging from 1.20 (Composing) to 1.49 (Dancing/Moving) and item-scale means ranging from 3.53 (Composing) to 4.57 (Reading). In rank order from high to low, the sampled students rated themselves as most proficient in Reading (M = 4.57), followed, respectively, by Global MSC (M = 4.53), Instrument Playing (M = 4.46), Listening (M = 3.94), Dancing/Moving (M = 3.63), Singing (M = 3.55), and Composing (M = 3.53). Overall, MUSPI-S subscales also display fully satisfactory levels of reliability, with alphas ranging between α = .93 and α = .97 (Mα = .95) and omegas between ω = .93 and ω = .98 (Mω = .95).
Model fit, measurement and structural invariance, and factor level mean comparisons
As shown in Table 2, the CFA model, assuming separate correlated factors for Global MSC and the six domain-specific subscales, provides an excellent fit to the data: χ2(266) = 437, CFI = .998, RMSEA = .024, and SRMR = .025 (see baseline model), with consistently high factor loadings (λ = .83 to λ = .98, Mλ = .91; see Table 1). MUSPI-S subscale factor scores for Singing (r = .20 to r = .48, M r = .39) and Dancing/Moving (r = .07 to r = .48, M r = .31) are not as strongly linked to the other MUSPI-S subscale factor scores as are Instrument Playing, Reading, Composing, and Listening to one another (r = .40 to r = .67, M r = .59; see Table 3). Further, Global MSC factor scores correlate more closely with subscale factor scores in Instrument Playing, Reading, Composing, and Listening (r = .61 to r = .88, M r = .73) than with those in Singing and Dancing/Moving (r = .31 to r = .45, M r = .38).
Goodness-of-Fit Indices of the CFA and MGCFA Models for Testing Measurement and Structural Invariance.

Note. N = sample size, χ2 = WLSMV chi-square test, d.f. = degrees of freedom, CFI = comparative fit index, RMSEA = root mean square error of approximation, CI = confidence interval, SRMR = standard root mean residual, △ = change; *p ≤ .01.
Latent Factor Correlations Among the MUSPI-S Subscales.

Note. All correlations are statistically significant at p < .001, except the italicized value (p > .05).
Gender
We ran MGCFAs for gender subgroups to test the configural, weak, strong, and strict measurement invariance of MUSPI-S scores. Based on the goodness-of-fit indices shown in Table 2, the models of configural, weak, strong, and strict invariance meet established △CFI, △RMSEA, and △SRMR criteria for adequate fit across the gender subgroups. Next, we tested the invariance of factor variances and covariances and the invariance of factor means across those subgroups. The model for testing invariance of factor variances and covariances meets established criteria for △CFI, △RMSEA, and △SRMR, whereas the model of invariance of factor means yields an △RMSEA value (0.022) beyond the cutoff value of 0.015 (see Table 2). Combined with Fan and Sivo’s (2009) observation that △goodness-of-fit indices are not generally useful in factor mean invariance analysis, these results provide evidence that factor-level means may differ across gender subgroups. Post hoc comparison results in which factor-level means for females are fixed to zero for identification purposes (see Table 2, strong invariance model) reveal that factor-level means for males (expressed in standard deviation units) are significantly lower than those for females in Global MSC (−0.368, p < .001), Singing (−0.425, p < .01), Instrument Playing (−0.280, p < .05) and Dancing/Moving (−0.944, p < .001), but not reliably different for Reading (−0.108, p = .429), Composing (−0.084, p = .473), and Listening (−0.182, p = .167) (see Supplemental Appendix B for descriptive statistics on these subgroups and independent sample t-tests on observed subscale score metrics).
School year
The tests of measurement invariance across subgroups formed by participants’ current school year (i.e., grade level) show that CFI, RMSEA, and SRMR values do not drop by more than their established cutoff values across successive measurement invariance models (Table 2). Accordingly, these findings support configural, weak, strong, and strict invariance across these subgroups. Invariance tests for factor variances and covariances and factor means likewise provide no trustworthy evidence that relationships among the underlying MUSPI-S factor scores or factor means vary across seventh-, eighth-, and ninth-grade students at the time of the study (see Supplemental Appendix C for descriptive statistics on these subgroups and one-way ANOVAs on observed subscale score metrics).
Musical activity
Model fit results in Table 2 confirm configural, weak, strong, and strict measurement invariance between musically active and non-active students but not invariance of factor variances and covariances or factor means across these subgroups. Goodness-of-fit indices support the measurement model underlying the MUSPI-S factor scores but reveal differences in variability, interrelationships among factor scores, and factor means between these two subgroups. Post hoc comparisons, with factor-level means for musically active students fixed to zero for identification purposes, indicate that musically non-active students (in standard deviation units) score significantly (p ⩽ .001) lower in Global MSC (−1.249), Singing (−0.734), Instrument Playing (−1.421), Reading (−1.137), Composing (−0.854), and Listening (−1.148), but not significantly different in Dancing/Moving (−0.181, p = .215) (see Supplemental Appendix B for descriptive statistics on these subgroups and independent sample t-tests on observed subscale score metrics).
Relationships between MUSPI-S subscale factor scores and external outcome measures
Table 4 includes correlation coefficients between subscale factor scores for the German-language MUSPI-S and external outcome measures. Overall, correlations between MUSPI-S subscale factor scores and external outcome measures largely replicate patterns found by Morin et al. (2016). That is, correlations linking MUSPI-S subscale factor scores to school grades in most subjects are null to weak (r ⩽ .20), and this is particularly true for subjects with little relation to musical abilities, such as mathematics, physics, biology, and visual arts. Across subject areas, correlations between Global MSC, Instrument Playing, Reading, and Listening scores and school grades in German, English, and participants’ second foreign language are generally greater (r ⩾ .20) than those in other areas. In most instances, MUSPI-S subscale factor scores are correlated more closely with school grades in music than with school grades in other subjects. Among MUSPI-S subscale factor scores, Global MSC has the strongest correlation with both interest (r = .52) and grades (r = .37) in the school subject of music. In further support of their convergent and discriminant validity, all MUSPI-S subscale factor scores, apart from Singing (r = .26) and Dancing/Moving (r = .16), have moderate to high correlation coefficients (rs range from .34 and .52) with interest in the school subject music.
Descriptive Statistics for External Outcome Measures and Their Latent Factor Correlations With MUSPI-S Subscale Factor Scores.
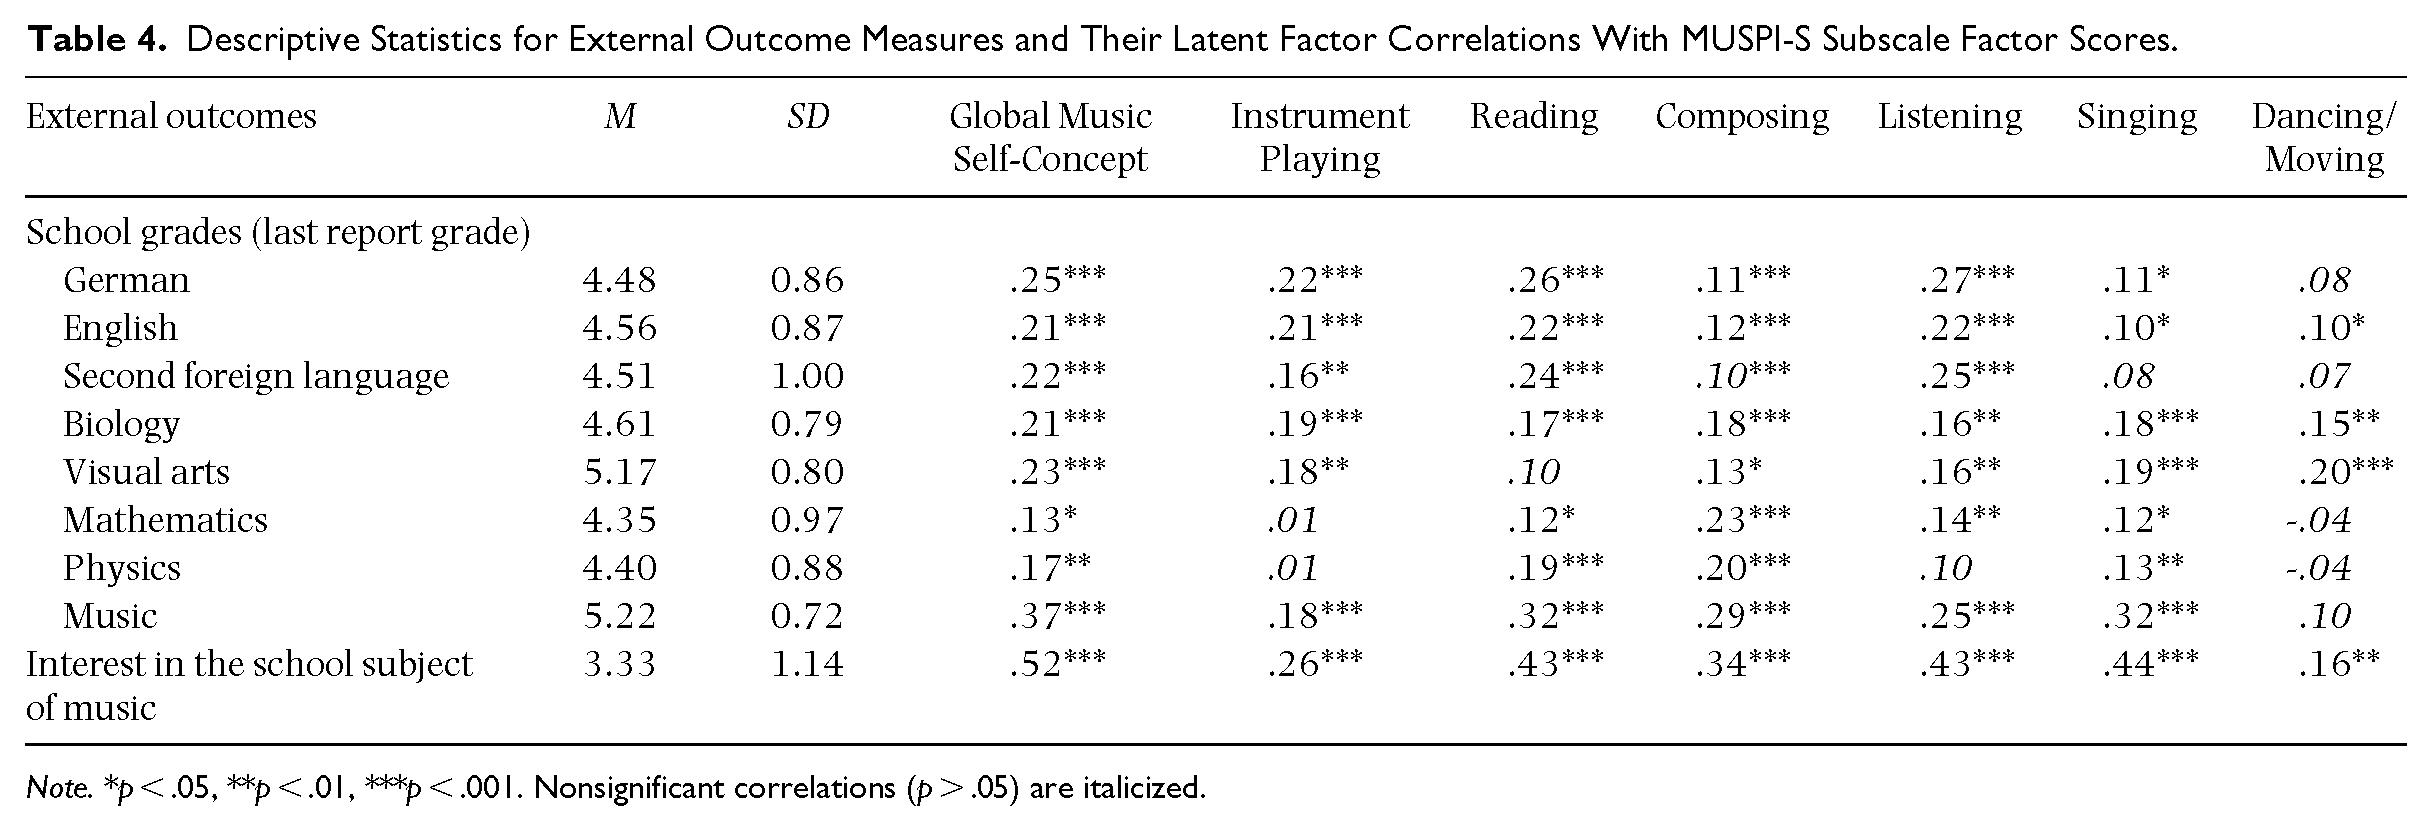
Note. *p < .05, **p < .01, ***p < .001. Nonsignificant correlations (p > .05) are italicized.
Discussion
In the study reported here, we translated items from the shortened form of the MUSPI (Vispoel, 1994, 2021, 2003) described by Morin et al. (2016) into German and derived descriptive statistics, reliability estimates, indices of factor model fit and invariance of measurement and structural parameters across subgroups, and evidence of convergent and discriminant validity with external outcome measures. In general, these results were remarkably well aligned with those reported by Morin et al. for the original MUSPI-S with samples of American students at similar school years (i.e., grade levels).
Descriptive statistics, reliability estimates, and model fit
Because scores from the German MUSPI-S would typically be used for norm-referencing and comparative purposes, subscale scores should be reasonably variable, and this proved to be the case here in terms of subscale standard deviations and differences in means across subscales. German MUSPI-S subscale scores also yielded fully satisfactory levels of reliability in relation to alpha and omega coefficients. Factors within the CFAs were well-defined, and the hypothesized measurement model, representing the Global MSC subscale and the domain-specific MUSPI-S subscales Instrument Playing, Reading, Composing, Listening, Singing, and Dancing/Moving provided excellent fit to the data. Latent factor correlations among the MUSPI-S subscales replicated findings from previous studies (Morin et al., 2016, 2017; Vispoel, 1993, 1994, 2021, 2003) and confirmed related theoretical and empirical expectations found for other self-concepts (see, e.g., Marsh & Craven, 2006; Shavelson et al., 1976). Specifically, Global MSC was more closely related to Instrument Playing, Reading, Listening, and Composing than to Singing and Dancing/Moving, and the former four constructs were more strongly correlated with one another than they were correlated with the latter two constructs.
Distinctions between MUSPI-S Dancing/Moving scores and other MUSPI-S subscale scores parallel the separation noted by Rose et al. (2022) between dance and other facets of music. Dance is likely to be more closely connected to fitness and capacity for aerobic and physical exercise than to musical ability per se (see, e.g., Angioi et al., 2009; Vispoel, 1993, 1995, 1996). Similarly, dancing, other physical activities, and organized training in sports are more strongly associated with physical self-concept, self-perceptions of sporting skills, and overall self-esteem than are other dimensions of the music self-concept (Liu et al., 2015; Vispoel, 1995). Such distinctions can be further explored in future research by linking MUSPI-S subscale scores with measures of participatory and observational dance experience, such as the Goldsmiths Dance Sophistication Index (Gold-DSI; Rose et al. 2022), and Dance subscale scores from the adolescent and adult forms of the Arts Self-Perception Inventory (ASPI; Vispoel, 1993, 1996).
Measurement and structural invariance and factor-level mean comparisons
Results from our MGCFAs supported strict measurement invariance (i.e., configuration, loadings, thresholds, uniquenesses) of German MUSPI-S scores across gender, school year (i.e., grade level), and musical activity subgroups. Overall, these findings replicate those attained by Morin et al. (2016); but extend them to encompass differing levels of musical activity. Nevertheless, important factor-level mean differences in subcomponents of music self-concept were found between many of these subgroups.
Differences in factor-level means between females and males
Post hoc comparisons of factor-level means in the strong invariance model revealed that female students were significantly higher than males in Global MSC, Singing, Instrument Playing, and Dancing/Moving but not in Reading, Composing, and Listening. Such differences mirror those from previous studies in which females, in comparison to males, showed higher levels of involvement, motivation, skills, and self-perceptions related to music (see, e.g., Morin et al., 2016, 2017; Simpkins et al., 2010; Vispoel & Rizzo, 2003). In this context, previous research has demonstrated that gender differences may have an impact on young people’s musical involvement, achievement, choice of instruments to study, and professional avocations (see, e.g., Harrison & O’Neill, 2000; Maidlow & Bruce, 1999; Welch et al., 2004).
Differences in factor-level mean across school years
Our findings of no statistically significant differences between seventh-, eighth-, and ninth-grade students in the MUSPI-S factor-level means fully replicated results from the MUSPI-S calibration and cross-validation samples from Morin et al. (2016). These results also align with those reported by Vispoel (2003) concerning similar patterns of associations among the facets of music self-concept considered here for junior high and college students. They run counter, however, to the theoretical expectation that music self-concept becomes increasingly multifaceted and nuanced as students grow older and gain more musical experience (Austin & Vispoel, 2000; Eccles et al., 1993; Vispoel, (Vispoel 1994, 2021). Such findings might be due in part to self-perceptions of musical abilities being less distinct at younger ages and the absence of scales within currently available instruments measuring more finely-grained subdomain-specific components of music proficiency that might better elicit these expected age- or grade-related trends.
Differences in factor-level means between musically active and non-active students
Our results for subgroup comparisons further demonstrated that musically active students had higher factor-level means on all subscales measured by the German MUSPI-S, except for Dancing/Moving, thereby providing evidence of the validity of the German MUSPI-S scores in identifying distinctions between these subgroups. Such differences in perceptions of musical proficiency may reflect greater motivation, positive performance experiences, and/or more frequent and positive feedback from other students, parents, and teachers for students actively involved in music (e.g., Arens et al., 2017; Marsh & Craven, 2006; Marsh & O’Mara, 2008; Valentine et al., 2004). The non-significant group difference on the MUSPI-S subscale Dancing/Moving again demonstrates the distinctiveness of these skills from other music-related abilities (e.g., Morin et al., 2016, 2017; Rose et al., 2022; Vispoel, 1994, 2021, 2003).
Relations with school grades and interest in the school subject music
As further evidence of convergent and discriminant validity, and once again in keeping with Morin et al. (2016), German MUSPI-S Global MSC factor scores correlated more strongly with school grades in music than with school grades in other subjects. The stronger correlations found among non-music subject grades typically involved subjects related to literacy (German, English, and participants’ second foreign language, such as French or Latin). These results support the view of Morin et al. (2016) that verbal skills play an important role in the formation of music self-concepts and the improvement of music-related skills within elementary and secondary schools (Vispoel, 1994, 2021, 2003). Stated differently, reading and listening skills may be fundamental to the development of both music and language proficiency. Music-related perceptual abilities (such as audiation; see, e.g., Gerhardstein, 2002) used while playing an instrument, reading music, or listening to music may support students in learning languages and boost their academic success in those subjects. Gordon (2007), for instance, argued that students with advanced musical perceptual or audiation skills have a deeper understanding of (foreign) language and better pronunciation skills, thereby resulting in better school grades in those subject areas in comparison to other students.
Our correlational findings also indicated that, with the exception of the Dancing/Moving subscale, most MUSPI-S subscale factor scores correlated more strongly with interest in the school subject of music than with school grades in other subject areas we included in the study. These results are in line with the multidimensional nature of self-concepts emphasized in recent research in this area (see, e.g., Marsh, 2007; Marsh & Craven, 2006; Marsh & Scalas, 2010; Shavelson et al., 1976), in which correlations of variables within the same domain (e.g., music self-concept with school grades in music here) were stronger than correlations across different domains (e.g., music self-concept with school grades in mathematics; see, e.g., Morin et al., 2016).
Taken collectively, the findings summarized here imply that facets of music self-concept, though correlated with each other, are well-differentiated and distinct from other theoretically related constructs with which they share relationships (Morin et al., 2016, 2017; Vispoel, 2003). Such findings also suggest that, in tandem with other ways of conceptualizing and measuring music self-concept (e.g., Fritzsche et al., 2011; Penthin et al., 2017; Spychiger, 2017; Spychiger et al., 2009; see also Fiedler & Spychiger, 2017), self-perceptions of musical abilities (e.g., playing an instrument, reading, composition, singing, etc.; see Vispoel, 1994, 2021, 1995, 2003; Yeung et al., 2001) can function as important predictors of various outcomes across the lifespan and therefore are useful in explaining interindividual differences in external outcome measures related to music such as school grades, motivation, interest, sophistication, and engagement. Finally, constructs measured, in particular, by the MUSPI-S subscales Global MSC, Instrument Playing, Reading, and Listening are emphasized in the curriculum for music education within the German federal state of Schleswig-Holstein and elsewhere, further highlighting the utility of such measures.
Limitations and future directions
The present study has some limitations that should be considered when interpreting the findings and defining directions for future research. The data analyzed were restricted to seventh- to ninth-grade students in two academically selective secondary schools in Germany. Future studies should focus on more diverse levels of education, broader age ranges, as well as different types of musical or non-musical activities and levels of musical sophistication (Müllensiefen et al., 2014) and engagement (Chin & Rickard, 2012). The assessed data were cross-sectional in nature, thus precluding direct causal interpretations of the developmental dynamics of music self-concept. Longitudinal investigations into the development and trajectories of music self-concept over time may answer questions about structural differentiation and levels of development throughout childhood, adolescence, and adulthood. Further, relationships between subcomponents of music self-concept and other academic and non-academic self-concepts should be further investigated to better understand the location of music self-concept in Shavelson et al.’s (1976) and other models of self-concept (e.g., Arens et al., 2022; Vispoel, 2003). Finally, researchers are encouraged to conduct further validation studies into measurement and structural invariance across the German and English versions of MUSPI-S and future translations of the MUSPI-S to other languages in addition to expanding scales to incorporate other domains of music proficiency and more specific subcomponents within the broader music domains examined here.
Conclusion
The findings reported here confirmed that the German MUSPI-S yielded sound psychometric results in line with those reported for the original MUSPI-S. Subscale reliability coefficients were no lower than .93 despite each subscale having only four items, and the hypothesized measurement models underlying German MUSPI-S scores provided excellent overall fits to the data that were invariant across gender, school year (i.e., grade level), and musical activity subgroups. Gender differences in German MUSPI-S factor-level means also replicated those found for the original English MUSPI-S but extended findings to confirm anticipated differences across musical activity subgroups. Overall, these findings support the continued use of the German translation of the MUSPI-S to efficiently assess a wide range of self-perceived abilities in music for both research and practical purposes.
Supplemental Material
sj-docx-1-pom-10.1177_03057356241272999 – Supplemental material for Validating scores from the short form of the Music Self-Perception Inventory (MUSPI-S) with seventh- to ninth-grade school students in Germany
Supplemental material, sj-docx-1-pom-10.1177_03057356241272999 for Validating scores from the short form of the Music Self-Perception Inventory (MUSPI-S) with seventh- to ninth-grade school students in Germany by Daniel Fiedler, Johannes Hasselhorn, A. Katrin Arens, Anne C. Frenzel and Walter P. Vispoel in Psychology of Music
Footnotes
Declaration of conflicting interests
The author(s) declared no potential conflicts of interest with respect to the research, authorship, and/or publication of this article.
Funding
The author(s) disclosed receipt of the following financial support for the research, authorship, and/or publication of this article: Our work was funded by Grant AR 877/3-1 from the German Research Foundation (Heisenberg fellowship) for A. K. Arens.
Supplemental material
Supplemental material for this article is available online.
Notes
References
Supplementary Material
Please find the following supplemental material available below.
For Open Access articles published under a Creative Commons License, all supplemental material carries the same license as the article it is associated with.
For non-Open Access articles published, all supplemental material carries a non-exclusive license, and permission requests for re-use of supplemental material or any part of supplemental material shall be sent directly to the copyright owner as specified in the copyright notice associated with the article.