
Abstract
If music connects to our most resonant emotional strings, why have not we used it to assess emotions? Our goal was to develop and validate the Measure of Emotions by Music (MEM). A total of 280 participants were randomly assigned to MEM Condition 1 (excerpts) or MEM Condition 2 (excerpts and adjectives). All participants responded to the PANAS-X. The internal consistency (α) of the MEM subscales (Happy, Sad, Scary, Peaceful) was in acceptable-to-strong range and similar to the PANAS-X. Construct validity of the MEM illustrated cohesive convergence to the PANAS-X. Confirmatory factor analysis confirmed the validity of a four-factor solution, as intended in the MEM. Split-half reliability shows good fidelity. A total of 69% of the respondents mentioned a preference for the MEM. The MEM demonstrates very good psychometric characteristics, seems to be an appreciated way to measure emotional states and may represent an interesting alternative for clinical groups having difficulties to identify their emotion with words.
Music and emotions has been of interest since the dawn of time (Rochon, 2018). Leading thinkers and scientists believe that music predates language and allowed our ancestors to have a system of emotional communication, social cohesion, and sexual selection. In particular, Schopenhauer and Jankélévitch believe that music manages to make us feel emotions that are so deep within us that they are ineffable (Jankélévitch, 1983/2003; Schopenhauer, 1819/1909). Over the past decades, much scientific research has focused on how music can evoke emotions. However, to our knowledge, there is no measure of emotion that uses music in the same way as words to describe the emotions felt and there is a need for innovative ways to access emotion. For instance, people on the autism spectrum condition (ASC) and with alexithymia have difficulty identifying emotions verbally (Akbari et al., 2021). In a systematic review, Huggins et al. (2020) emphasize the importance of developing alternative ways for self-administered questionnaires to better measure emotional self-awareness and improve our understanding of how autistic persons identify and feel their own emotions. Therefore, this study aims to validate a new measure of emotion using the emotional musical excerpts validated by Vieillard et al. (2008), as the language of feeling.
Taking into account some limitations of verbal reports (written or spoken) to assess emotions, the advantages of using musical excerpts are of great importance at least at two levels. First, self-reported verbal questionnaires are affected by social desirability, that is, the tendency to under or overvalue socially unwelcome or desirable attitudes (Latkin et al., 2017; Näher & Krumpal, 2012) as well as language barrier, that is, misunderstanding of the meaning of words due of language proficiency (Choi & Pak, 2004). Also, there are documented translation issues of some emotions in some languages that have no direct words to describe the same emotion (Lomas, 2021; Zentner & Eerola, 2010). Music may be a useful way to circumvent these issues, as music is less culturally sensitive (Balkwill et al., 2004; Fang et al., 2017; Fritz et al., 2009) and may be perceived or felt effortlessly by the listener if used as proxies for specific emotions. In fact, emotional response to music is processed automatically by the brain (Bigand & Poulin-Charronnat, 2006) and may be free of cultural barriers (Fritz et al., 2009). Fritz and colleagues (2009) showed that although Western listeners performed significantly better than native Africans (Mafas) on a task aimed at recognizing three emotions (happy, sad, and scary) using musical excerpts, Mafas still identified these excerpts as proxies for such emotions.
Also, cross-cultural research has shown that culture has little effect on the recognition of emotions in music. Indeed, Western listeners can discriminate emotions in Indian raga music (Balkwill & Thompson, 1999), and Japanese listeners can discriminate between the emotions of Western and Hindustani music (Balkwill et al., 2004). Moreover, intense emotional responses to music are related to clarity, sudden increase in sound, and rigidity of music, regardless of cultural aspects (Beier et al., 2022). Finally, comparing major and minor modes of Western music with Chinese listeners, Fang et al. (2017) showed that recognition of Western music emotions was valid cross-culturally.
Secondly, some populations (i.e., ASC or alexithymia) having difficulty identifying their emotions (Akbari et al., 2021) through words may benefit from an alternative way to better represent how they feel. A measure of emotion with music may be suitable in this context. Therefore, there is a need to provide a reliable and valid measure of emotions through music and this article aims to address this issue.
Theoretical background
Philosophical debate between emotivism and cognitivism
There are two main currents in music and emotion research: emotivism and cognitivist (Vempala & Russo, 2018). For the emotivists, listeners recognize and feel the emotions elicited by music, whereas for the cognitivists, music does not induce true emotions but is rather perceived as a symbol that represents human emotions (Davies, 2010; Konečni, 2008; Sloboda & Juslin, 2010). Recently, Vempala and Russo (2018) have combined both perspectives to create a metacognitive model of emotion recognition in music. In this model, emotional judgment in music depends on an interdependence of cognitive processes and basic emotional mechanisms. This article proposed an approach that will use musical excerpts specifically composed to represent basic emotions. The musical excerpts will thus generate basic emotions in the listeners, and they will use cognitive processes to introspect on their emotional state.
Music and emotion
Studies since 2000 have brought scientific evidence that music can induce specific emotions and can activate regions in the brain typically associated with emotions (Chanda & Levitin, 2013; Koelsch, 2014; Särkämö, 2018; Zatorre & Salimpoor, 2013). For instance, newborns have innate preference for consonances and not dissonances (Trainor et al., 2002). This mechanism is governed by the parahippocampal gyrus, amygdala, hippocampus, and temporal poles (Gosselin et al., 2005, 2007; Koelsch et al., 2006). fMRI studies show that these regions are activated by exposure to unpleasant music (dissonance) and decrease their activity with pleasant music (consonance; Koelsch et al., 2006). Regions, such as the amygdala are implicated for scary music, and patients with amygdala damage have difficulty identifying “scary” musical excerpts. Interestingly, patients with brain damage who are unable to recognize a familiar melody are, nevertheless, able to recognize emotions associated with the melody (Peretz et al., 1998, 2001). Moreover, individuals with congenital amusia are still able to identify emotions of music even though they are unable to recognize the music (Gosselin et al., 2015).
Peretz et al. (1998) have shown that a musical excerpt of 250 ms is sufficient to discriminate sad from happy music. Excerpts associated with anger, happiness, and sadness could be identified within a duration of less than 100 ms (Nordström & Laukka, 2019). Finally, several researchers have shown that music induces the same emotional responses as a basic emotion (Gagnon & Peretz, 2003; Mitterschiffthaler et al., 2007; Witvliet & Vrana, 2007). For example, in Lundqvist et al. (2009), musical excerpts were chosen to represent a specific emotion and these excerpts induced the same emotions in the listeners.
Variations and combinations of different musical features such as tempo, major or minor mode, consonance (positive affect), and dissonance (negative affect), can be manipulated to express specific emotions (see table one in Juslin & Laukka, 2004). Emotional excerpts validated by Vieillard et al. (2008), and used in this study, take advantage of this knowledge.
Measuring emotion verbally and nonverbally
There is a wide range of ways to measure emotions verbally (written or spoken words) or nonverbally (without words; mostly physiological data), each with its own benefits and limitations. The most common way to assess emotions induced by music is verbally by self-report with Likert scales (Eerola, 2018). These include standardized measures such as the Differential Emotion Scale (Izard et al., 1993), the PANAS, and the expanded version (PANAS-X; Watson & Clark, 1994; Watson et al., 1988), and the Profile of Mood States (Mcnair et al., 1971). These measures lack of phenomenological data of the emotions felt with music (Lee et al., 2020; Zentner & Eerola, 2010). Self-report measures require to choose from a predetermined category and are thus subject to report bias. Moreover, words may not always be interpreted the same way from the perspective of the researcher and the participants or even between participants. To date, self-reported questionnaires may be the most reliable to distinguish basic emotions (Barrett, 2006), and are easy to quantify (Zentner & Eerola, 2010). However, considering that words are not always obvious to represent emotions and are highly subjective, Zentner and Eerola suggest exploring other measurement methods of emotions.
Emotions can also be measured peripherally and indirectly through nonverbal methods (Eerola, 2018). The peripheral method consists of measuring emotions by physiological reactions (heart rate variability, skin conductance, respiration, facial electromyography, and temperature) (for a review, see Hodges, 2010). A limitation of these measures is that they are not always sensitive to the emotional experience at stance (Etzel et al., 2006; Nater et al., 2006). Also, these measures are more likely to assess valence or arousal levels of an emotional response rather than discrete emotions (Cacioppo et al., 2000; Mauss & Robinson, 2009; Siegel et al., 2018). Although this method may be the most objective, it might not be reliable (Barrett et al., 2019). Meta-analyses shows that physiological reactions associated with a specific emotion are inconsistent (Cacioppo et al., 2000; Siegel et al., 2018; Stemmler, 2004). For indirect measures, they evaluate emotional states through automatic and non-intentional reactions (Fazio & Olson, 2003). These measures do not require introspection so they are less likely to be biased (Lee et al., 2020). However, these measures may be less sensitive than direct measures.
Measuring emotions through behavioral reactions may provide cues about emotion since some are associated with behaviors (e.g., avoidance and fear) (Lang et al., 1983). Yet, observing behaviors would not adequately distinguish discrete emotions (Lee et al., 2020), and there is insufficient evidence to support that emotions are always associated with behaviors (DeWall et al., 2015; Schwarz & Clore, 2007).
Emotional recognition of visual stimuli can also assess emotions nonverbally. The systematic review by Barrett et al. (2019) highlights that the reliability of perceiving emotional states of facial stimuli depends mostly on how participants are asked to complete the tests, and whether the answers are verbal or nonverbal. Particularly, identifying emotional states from a short list of adjectives (a verbal response) tends to show moderate to strong evidence. However, this limits participants to forced choices and is subject to the same biases as verbal measures. Interestingly, when participants are in a free labeling task (verbal), inferences of emotional states vary considerably. Additionally, expression and perception of facial emotions varies from culture and situation and would be determined more by experience and environment than by universal recognition (Barrett et al., 2019; Caldara, 2017). Furthermore, facial patterns may not be reliable enough to deduct emotional states (Barrett et al., 2019). They point out that we don’t know how facial expressions translate emotions in everyday life and that there is a need to study the mechanisms by which people perceive emotion.
As illustrated, verbal and nonverbal measures have both benefits and limitations. Yet, in music and emotion research, the aforementioned measures were used to assess music-induced emotion. None of them have sought to assess participants’ emotional states through, and not as a result of, musical excerpts. Given the limitations of verbal self-reports of emotions, replacing them with music could be a unique and enjoyable way to overcome these limitations.
Using music to assess emotional states
Since there is a need for alternative ways to assess emotions (Huggins et al., 2020), music is an interesting avenue. Numerous studies have shown that music can elicit genuine emotions (Lundqvist et al., 2009; Vieillard et al., 2008; Vuoskoski & Eerola, 2011). The meta-analysis of Juslin and Laukka (2004) also revealed that emotion judgments in music remain consistent across listeners in over 100 studies. Surprisingly, to our knowledge, no existing tool has used musical excerpts, as response choices, to assess emotions. Thus, our goal is to fill this gap by developing and validating the Measure of Emotions by Music (MEM), a measure that uses musical excerpts to assess emotions through music.
Objective and hypothesis
The purpose of this study was to develop and validate a new psychometric tool for measuring emotional states with musical excerpts as response choices. Based on Vempala and Russo’s (2018) model, the main hypothesis of this research is that music can be used to assess emotions. This study will answer the following question: Does the Measure of Emotion by Music (MEM) represent a psychometric valid and reliable way of measuring emotional states?
Method
Participants
From December 2020 to April 2021, 280 participants were recruited on Web platforms like Facebook, LinkedIn, and by email through student associations of French-speaking universities in Quebec and Ontario, Canada. The inclusion criteria were being at least 18 years old and understanding French. The exclusion criteria was having psychological health issues or hearing health conditions not corrected by a prosthesis that could affect hearing.
Ethical considerations
This research was approved by the Research Ethics Board for student projects involving humans at both participating universities (2020–2021). Participants were informed of the nature and objective of the study and signed a consent form. Considering that participants may experience negative emotions, references to psychosocial support were added to the consent form.
Measures
Sociodemographic questionnaire
It contains questions such as age, gender (female, male, other), education level (elementary, high school, diploma of vocational study, college, bachelor’s degree, master’s, and above), type of program, current studies (full-time, part-time) and/or working (full-time, part-time), type of job, and annual income.
Positive and Negative Affect Schedule–Expanded Form
The PANAS-X contains 60 adjectives of emotional states (Watson & Clark, 1994). Items are divided into four categories: (1) General Dimension Scales (positive affect, negative affect), (2) Basic Negative Affect Scales (fear, hostility, guilt, sadness), (3) Basic Positive Affect Scales (joviality, self-assurance, attentiveness), and (4) Other Affective States (shyness, fatigue, serenity, surprise).
The choice of response is in Likert form (never, a little, moderately, quite often, always) and the test last approximately 10 min.
MEM
The emotional musical excerpts used have been validated by Vieillard et al. (2008). Their database contains 56 classical piano excerpts recorded in mp3 or MIDI format. These original excerpts have been conceived to be associated with the following emotions: happy, sad, scary, and peaceful. For the MEM, the 32 first MIDI files in their database were used. To listen to the musical excerpts or to consult the methodology used in their design, please visit the Isabelle Peretz Laboratory. 1
In the first experiment of Vieillard et al. (2008), the mean percentage of the correspondence between participants’ emotion identification and the intended emotion of the music excerpts was 99 % for happiness, 84 % for sadness, 82 % for scariness, and 67 % for peacefulness. The overall weighted Kappa coefficient (measuring interrater reliability) was 0.824. In their second experiment, the percentage of correct recognition was 95% for happiness, 86% for sadness, 71% for scariness, and 91% for peacefulness. The speed of recognition was 483 ms for happiness, 1,446 ms for sadness, 1,737 ms for scariness, and 1,261 ms for peacefulness. In the last experiment, a strategy of dissimilarity judgments by presenting 16 excerpts in 780 paired combinations (ABBA) was shown. The Pearson coefficient for the reliability of dissimilarity judgments was 0.87, suggesting a high agreement. The happy, sad, and scary excerpts were also cross-culturally validated (Fritz et al., 2009).
The MEM was completed under two conditions (see Supplementary File 1 online). The time required to complete each condition was approximately 10 min. Both conditions contain two identical elements:
The two conditions have the same eight sets of four musical excerpts for a total of 32 excerpts (eight peaceful, eight happy, eight scary, and eight sad). The eight excerpts of each emotion are the first ones provided in the database of the Isabelle Peretz Laboratory. Each excerpt is represented by identical icons. When participants click on the icon, they can hear the excerpt. They can listen to the four excerpts of a set and then click on the one that represents the emotion they have felt for the last 24 hrs.
From one set of questions to the next, the excerpts were moved one answer choice to the right so that the four emotions are placed equally at each position (see Supplementary File 2 online).
In the second condition only, participants had to answer a short multiple choice written questionnaire (happy, sad, scary or peaceful) to identify the emotion associated with the excerpt.
The MEM (Conditions 1 and 2) and the PANAS-X were integrated into a single questionnaire on the Qualtrics web application.
Procedure
When entering Qualtrics, participants were randomly assigned to one of the two MEM conditions and had to complete the MEM and the PANAS-X (Watson & Clark, 1994). In both MEM conditions and when filling the PANAS-X, participants responded to the sentence: “In the past 24 hours, I have felt.” For the MEM, participants were asked to choose the musical excerpt that corresponded to their emotional state. In total, participants were presented with eight consecutive questions each having four musical excerpts. The participants could choose only one musical excerpt per question, the one that best represented their current emotion. At the end of the study, participants were asked to identify which questionnaire (MEM or PANAS-X) they preferred.
Analytic strategy
First, descriptive statistics are presented to characterize the two groups on the different sociodemographic variables and describe the results of the MEM and the PANAS-X.
The validation of the MEM followed two steps:
Construct validity: (a) Internal consistency of each of the four subscales (peaceful, happy, scary, sad) was examined with Cronbach’s alpha coefficient; 2 (b) Convergence of the MEM and the PANAS-X subscale scores was assessed with stepwise regressions. The dependent variables are the four subscales of the MEM, and the independent variables are the 11 subscales of the PANAS-X. Residuals of regressions models were checked for normality. The stepwise method has been chosen for three reasons: the goal was to explore which PANAS-X subset of variables best explained the variance of each MEM variables, rather than to verify a particular existing model or to compare different models; the prediction of MEM scores with the PANAS-X subscales scores was also exploratory and not a main objective; it was not possible to exclude a priori some of the PANAS-X subscales on the basis of some preexisting empirical or theoretical rationale. Considering drawbacks of stepwise regression, Bayesian regression was used to challenge models found (Genell et al., 2010). Finally, we used a Bootstrap approach (N = 1,000) to verify the stability of the regression coefficients obtained by the different stepwise models; (c) Last step for construct validity, we performed a confirmatory factor analysis (CFA) with the full MEM dataset. We used structural equation modeling (SEM) and mediation analysis. We report the chi-square (χ2) statistic, and to examine how the four-factor model of emotions fit our empirical findings, we used the following model fit indicators: comparative fit index (CFI) and Tucker–Lewis Index (TLI), with values >.95 considered excellent; and root-mean square error of approximation (RMSEA) with values below .06 and upper confidence interval below .08 deemed excellent (Marsh et al., 2004). As our indicators were dichotomous (coded 0 and 1), we used the robust weighted least square, mean and variance adjusted estimator, which provides less biased solutions with categorical data. There were no missing values.
Split-half correlation with a Spearman-Brown coefficient (rSB) was used to calculate the correlation between the two halves of the test. The eight excerpts per emotion have been therefore separated (1, 2, 3, 4 vs. 5, 6, 7, 8) and the correlation served as an index of item reliability. Test–retest reliability was not evaluated considering the fluctuations of moods and the possibility of memorizing the musical excerpts.
Secondary analyses verify if participants correctly identified emotions in the second MEM condition. Contingency coefficients were calculated between the score of each MEM subscale and the score of each adjective, with the sum of choices made. The standardized coefficient (Blaikie, 2003) is the contingency coefficient divided by the maximum contingency coefficient. 3 This standardized coefficient varies from 0 to 1 independently of the number of cells in the table. Bootstrapping was performed for each coefficient to obtain confidence intervals. The last secondary analysis is descriptive and reports the percentage of preference for the MEM and the PANAS-X.
Results
Descriptive statistics
In MEM Condition 1, mean age of the participants (n = 128) was 29.05 years (SD = 11.71). For MEM Condition 2, participants were on average 30.50 years of age (SD = 11.85; n = 141). Participants were mainly from Canada (75.19%), were female (80.45%) and had a University degree (51.88%; see in Supplementary File 3 online).
Descriptive analyses
MEM
Eight new continuous variables were created that were the sum of choices (0 = not selected; 1 = selected) of peaceful, happy, scary, and sad excerpts and for the adjectives (in condition 2). This resulted in eight variables with scores ranging from 0 to 8 per participant. Table 1 shows the descriptive statistics of the MEM. For the MEM Condition 2, the mean choice and standard deviation of adjectives goes as follows: Peaceful (2.78 and 2.76), Happy (2.76 and 2.72), Scary (.80 and 1.59), and Sad (1.66 and 2.58).
Mean Values and Standard Deviations of the Choice of Musical Excerpts.
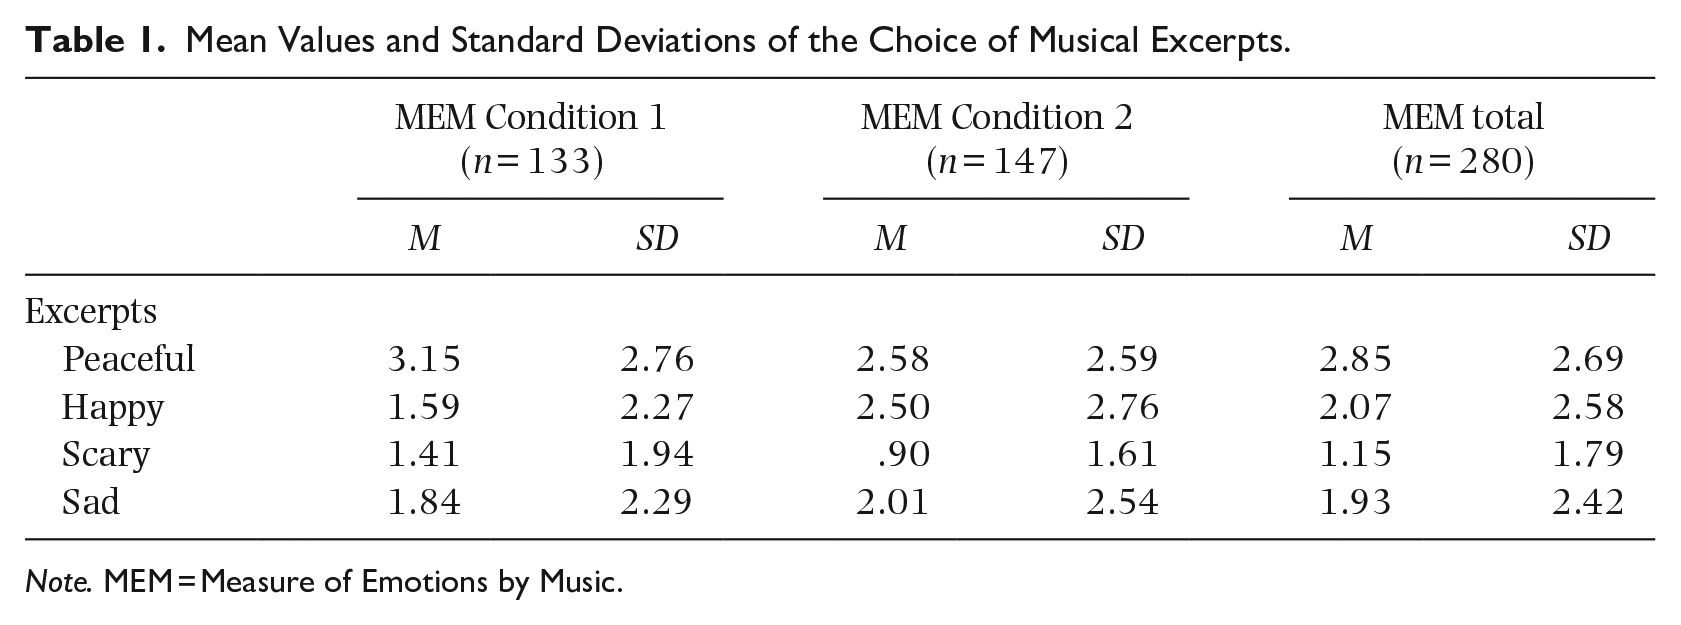
Note. MEM = Measure of Emotions by Music.
PANAS-X
Mean values and standard deviations of subscales were as follows (N = 280): Serenity (9.47 and 2.79), Joviality (23.62 and 7.18), Fear (11.73 and 4.69), and Sadness (10.64 and 4.94). The means, standard deviations, and Cronbach’s alphas of all the PANAS-X subscales are shown in Supplementary File 4 online. The Cronbach’s alphas were: Negative Affect, 0.88; Positive Affect, 0.88; Serenity, 0.75; Joviality, 0.91; Fear, 0.83; and Sadness 0.85. Alphas of the Watson and Clark (1994) sample and those of the current sample are similar.
Construct validity
Internal consistency of the MEM scales
Consistency analyses (Cronbach’s alphas) revealed good coherence of the items to the scale for the MEM subscales: Peaceful, 0.85; Happy, 0.88; Scary, 0.79, and Sad, 0.86.
Convergence between MEM subscales and PANAS-X subscales
Peaceful excerpts
The overall model was significant, F(3,276) = 24.68, p < .001, and explained 21.1% of the variance (20.3% adjusted variance). Table 2 shows the values of the standardized coefficients, the t-test, and the semi-partial correlations of the four subscales of the MEM. The PANAS-X serenity explained 10.5% of the variance in the peaceful MEM, the self-assurance 2.62%, and the sadness 2.53%. This means that a high score on serenity of the PANAS-X, a low score on self-assurance and on sadness are all associated with a high score on the peaceful excerpts.
Multiple Regressions between the MEM and PANAS-X Subscales.
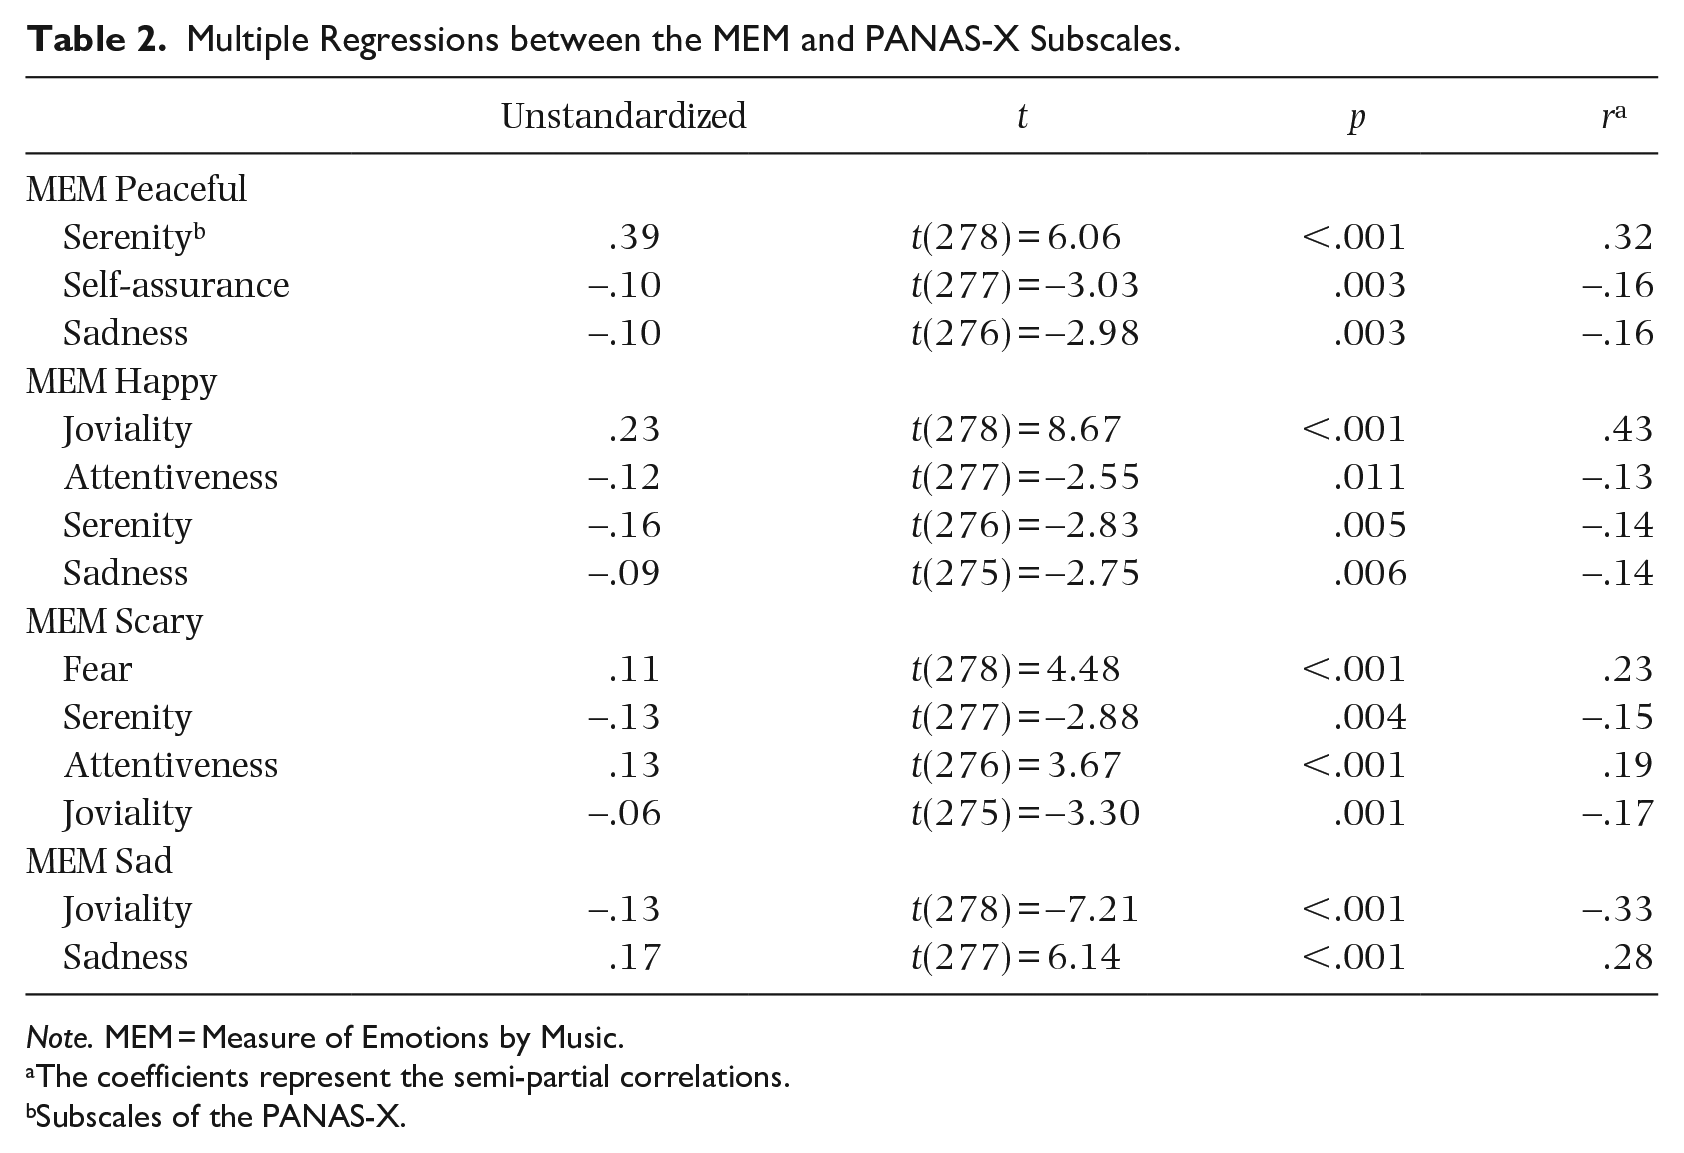
Note. MEM = Measure of Emotions by Music.
The coefficients represent the semi-partial correlations.
Subscales of the PANAS-X.
Happy excerpts
The overall model was significant, F(3,275) = 35.14, p < .001, and explained 33.8% of the variance (32.9% adjusted variance). Joviality of the PANAS-X explained 18.06% of the variance in the happy MEM, the attentiveness 1.56%, serenity 1.93%, and sadness 1.82%. Thus, by having a high score in joviality and a low score in the other subscales mentioned, participants tended to choose more happy excerpts.
Scary excerpts
The overall model was significant, F(4,275) = 28.3, p < .001, and explained 29.2% of the variance (28.1% adjusted variance). Four subscales of the PANAS-X were significant predictors of the scary excerpts: Fear (5.15% of the variance), Serenity (2.13%), Attention (3.5%), and Joviality (2.7%). These results suggest that the higher participants scored on the PANAS-X fear and attentiveness, and the lower they scored on the serenity and joviality, the more scary excerpts were chosen.
Sad excerpts
The overall model was significant, F(2,277) = 98.94, p < .001, and explained 41.7% of the variance (41.2% adjusted variance). Joviality explained 10.96% of the variance and sadness 7.95%. The lower the participants scored on joviality of the PANAS-X, and the higher they scored on sadness, the more likely participants were to choose sad excerpts.
Table 3 presents the results of the bootstrap procedure and the Bayesian regressions. The unstandardized coefficients for each variable of each model were compared with those obtained by the bootstrap procedure. As seen, the Bootstrap-corrected Bayesian coefficients were very close of the original regressions. In sum, the Bayesian regressions confirmed the models obtained by the stepwise regressions.
Comparisons of Regression Coefficients Models from the Stepwise Procedure and Bootstrap one and Result of the Bayesian Regressions.
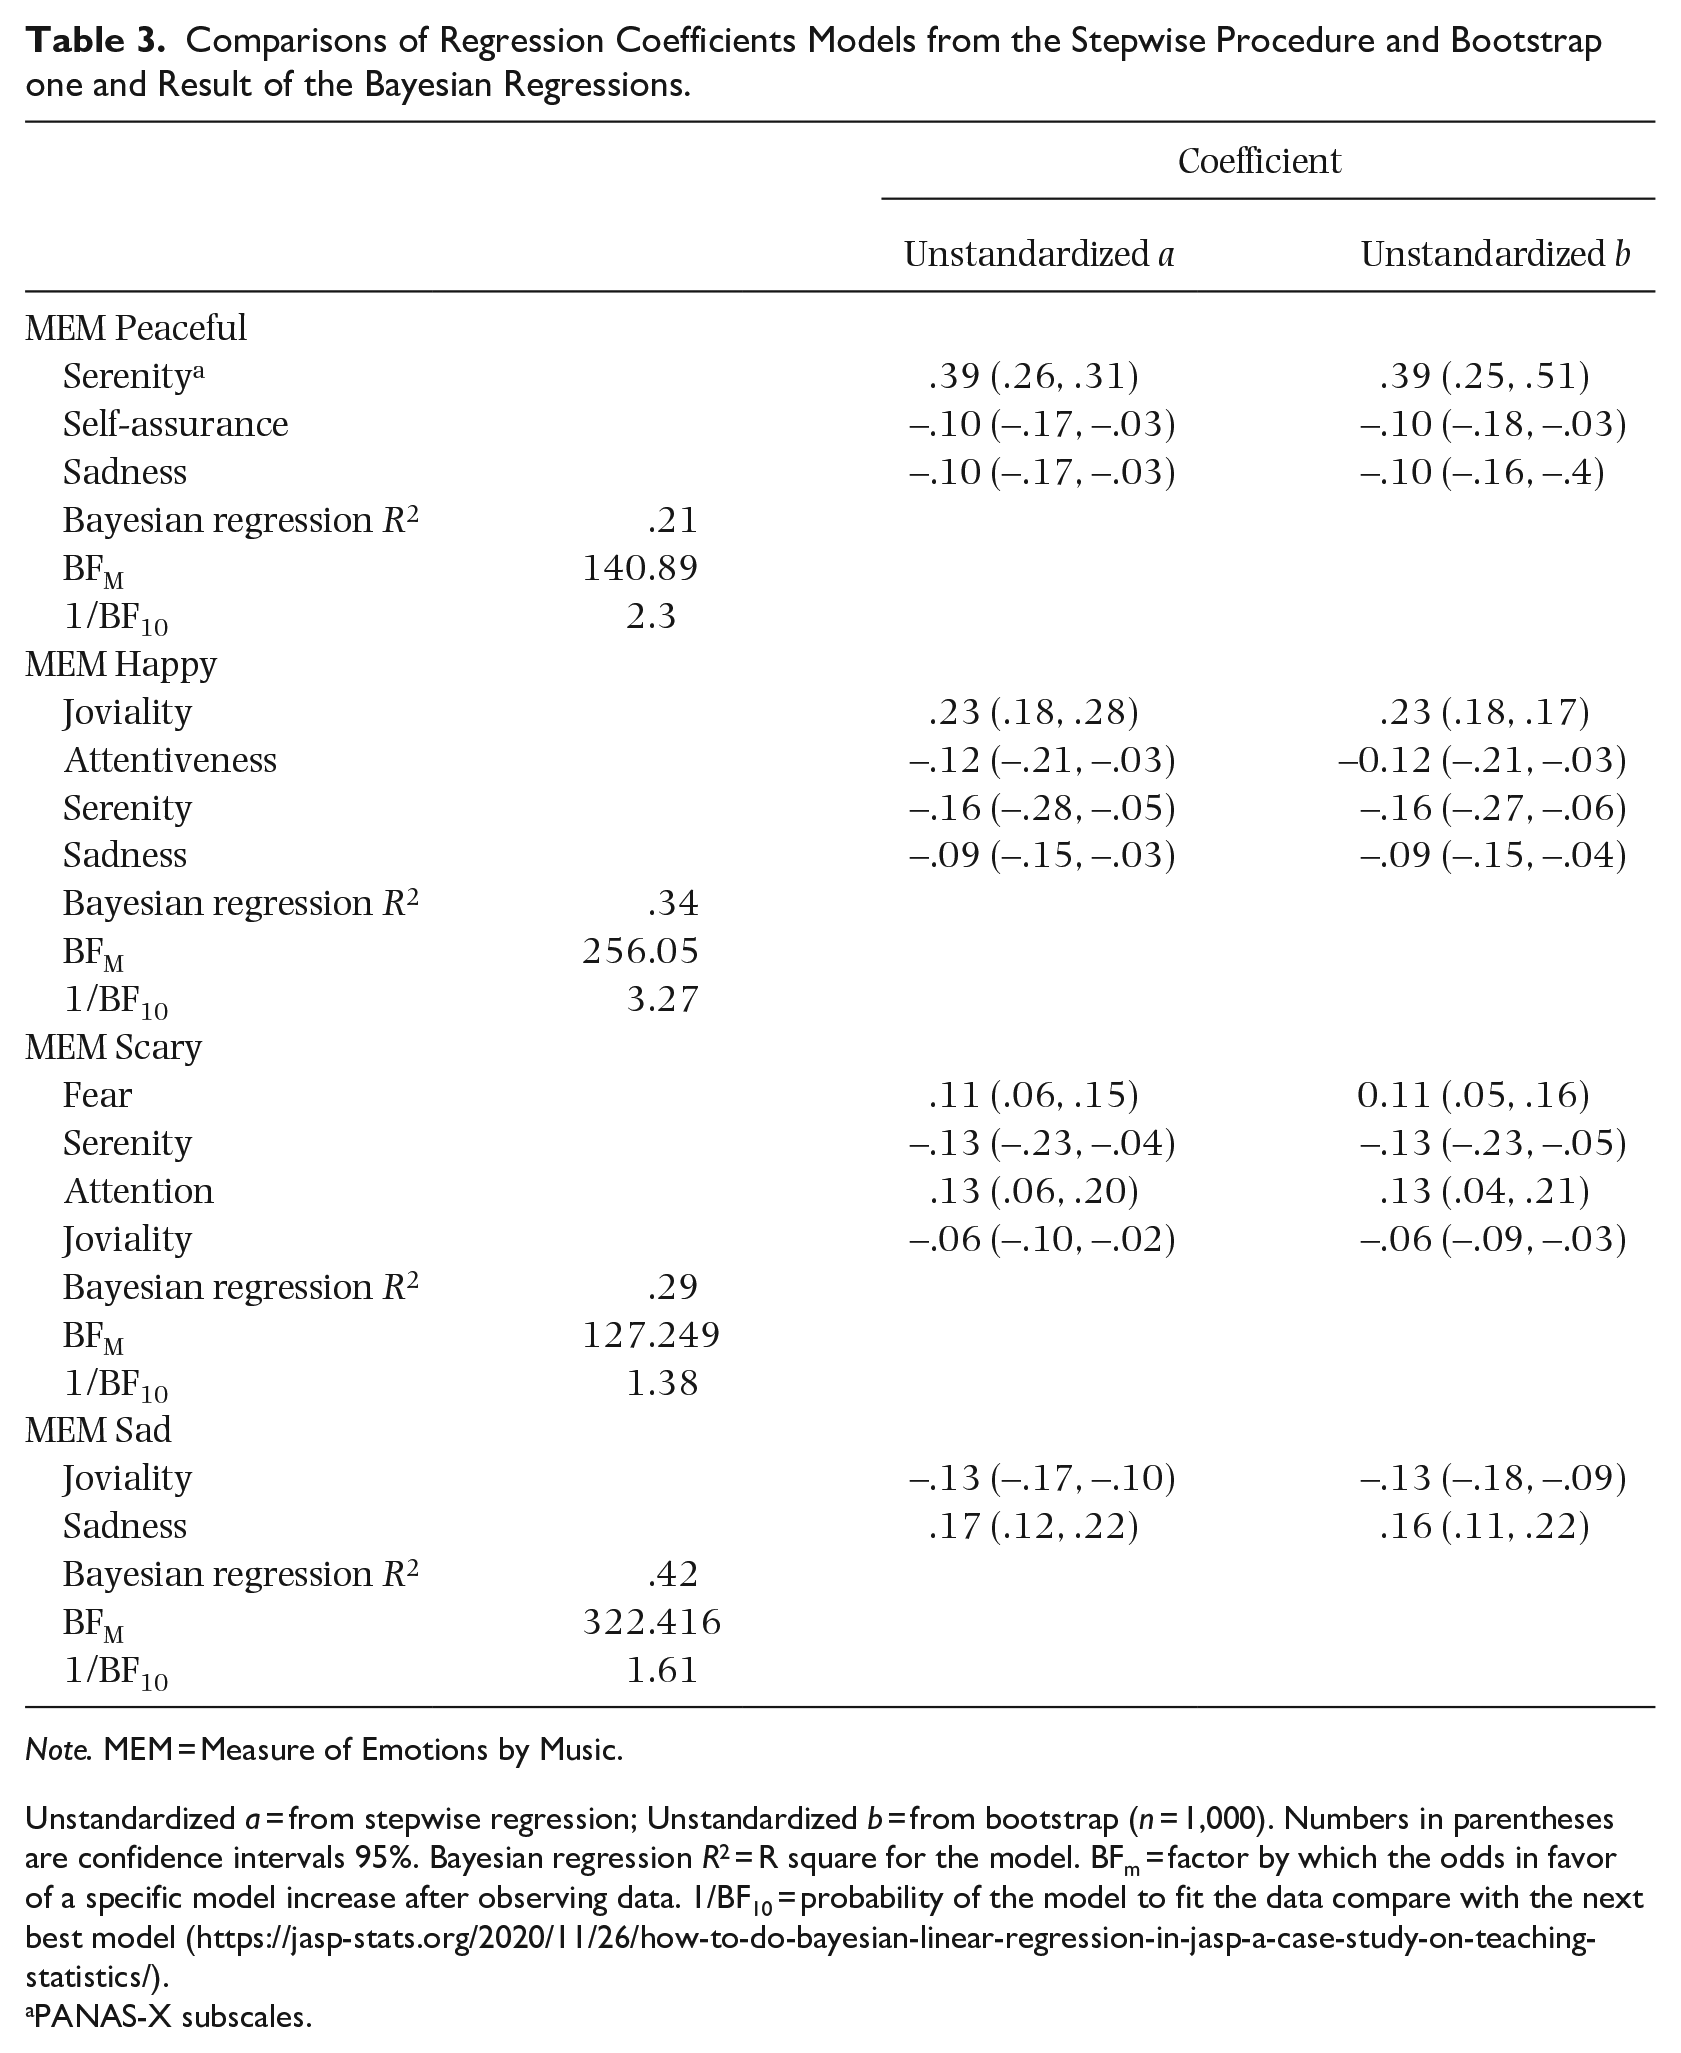
Note. MEM = Measure of Emotions by Music.
Unstandardized a = from stepwise regression; Unstandardized b = from bootstrap (n = 1,000). Numbers in parentheses are confidence intervals 95%. Bayesian regression R2 = R square for the model. BFm = factor by which the odds in favor of a specific model increase after observing data. 1/BF10 = probability of the model to fit the data compare with the next best model (https://jasp-stats.org/2020/11/26/how-to-do-bayesian-linear-regression-in-jasp-a-case-study-on-teaching-statistics/).
PANAS-X subscales.
The best models chosen for each MEM variable correspond to those obtained by the stepwise regressions. The BFM factors revealed that the odds of each model fitting the data increased markedly compared with the equal prior probability hypothesis (i.e., before observing the data). For example, the selected factor coefficient was 256.05 for the best model of the MEM Happy. Compared with the next best model that includes only the following PANAS-X subscales (Joviality, Attentiveness, Serenity, and Sadness) which is 72.01, the previous model fits the data better. For the MEM Peaceful, the best factor coefficient was 140.89 compared with 58.99 for the next best model. For the MEM Scary, it is 127.25 compared with 90.45. Finally, for the MEM Sad, the coefficient of the best model was 382.42 compared to 221.84. The probabilities that the best models fit the data better as compared (1/BF10) with the next well-fitting model varies from 1.38 to 3.27. This means that the model chosen for the MEM Happy is 3.27 times more likely to be the best model to the empirical data compared with the model that has the second highest coefficient.
CFA
We performed a CFA with the 32 MEM items each loading on its respective factor (Peaceful, Happy, Scary, and Sad; eight items per factor). CFA results confirmed the validity of a four-factor solution, with adequate model fit, χ2(458) = 640.09, p < .001; CFI = .96; TLI = .96; RMSEA = .04 (.03, .04). Bivariate correlations between the four factors are presented in Table 4, and parameter estimates are presented in Supplementary File 5 online.
MEM Correlations Between Factors.
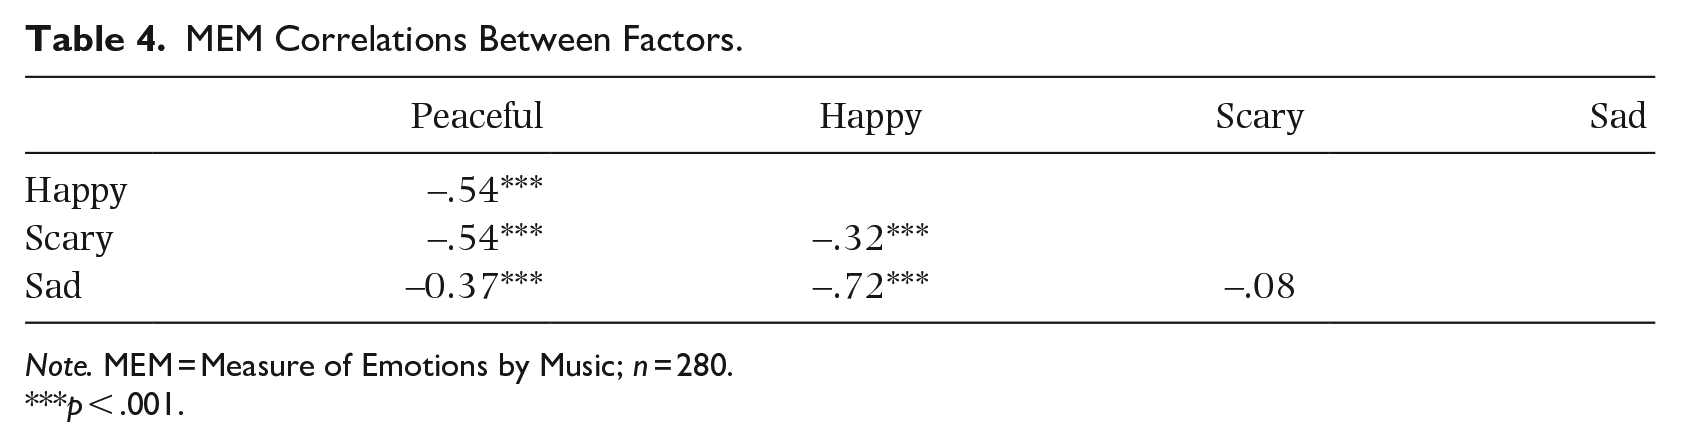
Note. MEM = Measure of Emotions by Music; n = 280.
p < .001.
Test–retest reliability: bisectional correlation (split half correlation Spearman–Brown)
Reliability analysis based on the split half correlation (rSB) show that the four subscales of the MEM have high reliability coefficients: Peaceful, 0.83; Happy, 0.87; Scary, 0.77; Sad, = 0.86.
Identification of emotion musical excerpts
Contingency coefficient values (standardized) revealed a very strong association between the emotional excerpts and the corresponding adjectives. They varied from .875 to .930 (see in Supplementary File 6 online)
Preference between the MEM or PANAS-X
The playfulness and overall enjoyable experience that music provides to measure emotional states was one of our main rationale to validate the MEM. In order to examine whether participants favored words or music to assess emotions, we asked participants to select the questionnaire they preferred. Out of 275 participants, 69% preferred the MEM (5 non-responses).
Discussion
The main purpose was to develop and validate a new measure of emotion with music. Inspired by the metacognitive model of Vempala and Russo (2018) stating that emotional judgments of music depend on a interdependence between felt emotion and cognition, we had strong reasons to believe that the emotional excerpts validated by Vieillard et al. (2008), based on the assumption that emotional recognition is universal (Fritz et al., 2009), would allow participants to identify their emotions as adequately as with words. Indeed, the psychometric properties of our validated instrument showed good fidelity and validity.
Our results demonstrated the fidelity and the validity of the MEM through various means. First, the internal consistency of the MEM showed acceptable to strong Cronbach’s alphas. This suggests that participants chose musical excerpts in a consistent manner. This was also supported by CFA that demonstrated a clear four-factor structure. Second, construct validity illustrated that the four subscales of the MEM had good convergence with the corresponding emotions of the PANAS-X. Moreover, the happy, scary, and sad excerpts had a negative relationship with the opposite emotions in the PANAS-X, that is, sadness, r = –0.14; serenity, r = –0.15; and joviality, r = –0.33. Finally, our factor analysis confirmed that the peaceful, happy, scary, or sad excerpts were uniquely related to a single emotion factor. This provided even further evidence of construct validity. In sum, the MEM has strong psychometric characteristics comparable to those of the PANAS-X (Watson & Clark, 1994), confirming its validity.
Furthermore, to ensure the accuracy of the excerpts in measuring the same emotion, we performed an inter-item fidelity analysis. The results revealed that the four excerpts were strongly related within each category. That is, when participants choose an emotion, they are more likely to select the same one again. As mentioned previously, this analysis offers a good estimation of the reliability.
Secondary analyses have shown that there is a strong relationship between the choices of excerpts and the corresponding emotions by adjectives. This step further supports that the participants recognize the emotions of the excerpts. The last secondary analysis highlighted that 69% of participants preferred to assess their emotional state with music (through the MEM) rather than through words. The inclination toward this new measure of emotions is not negligible and could constitute a new and appreciated avenue to evaluate emotions in scientific research.
Although other methods of assessing emotional states have been widely used in research for decades, they have limitations that the MEM addresses. Most notably, self-reported verbal measures are not always as convenient to represent emotion, are at risk of response bias, of language barriers, and are difficult to translate (Choi & Pak, 2004; Latkin et al., 2017; Näher & Krumpal, 2012; Zentner & Eerola, 2010). Using music, the socially associated meanings of words could be avoided and no translation is required. One could argue that music is also influenced by cultural norms, and this argument would be valid, but the excerpts used for the MEM were not developed to appeal to a culture but to be used in research for emotion (Vieillard et al., 2008), and were validated cross-culturally (Fritz et al., 2009).
The MEM addresses another limitation of previous measures of emotions, that is, the measures of facial expressions. Facial expressions are affected by culture and are not sufficient to adequately infer emotional states (Barrett et al., 2019; Caldara, 2017). However, emotion in music can be recognized cross-culturally (Balkwill et al., 2004; Fang et al., 2017; Fritz et al., 2009). Therefore, the MEM is a very interesting tool for researching emotions with diverse samples and languages. The MEM also overcomes the shortcomings of behavioral observation, of peripheric and indirect measures, by using a reliable and easy method to quantify response, that is, through self-report (Barrett, 2006; Zentner & Eerola, 2010).
Limitations
We acknowledge that the MEM has certain limitations. First, the MEM has four sets of emotional excerpts that are validated (Vieillard et al., 2008). In this sense, the small number of emotions in the MEM reduces the choice of more refined emotional states. A likely avenue would be to create new musical excerpts to target other emotions, or to use more emotional categories of validated musical excerpts such as those in the Geneva Emotional Music Scales (Zentner et al., 2008).
Another limitation is the likelihood that participants will recognize the musical excerpts with repeated measures. Since the laboratory of Isabelle Peretz has 56 musical excerpts, some of which we did not use, it would be possible to create other versions of the MEM to address this limitation for longitudinal research. Also, because we had as exclusion criterion that anyone with a mental health or hearing disorder (not corrected by a prosthesis) were excluded from the research, our sample may not be representative of the general population, As well, our sample was highly educated, young, and mostly female, which could have biased the results.
A further limitation is the timing of the data collection that happened during the COVID-19 pandemic. Considering all the adverse factors associated with the pandemic, there were concerns about mental health and emotional state of people in general. As our participants were evaluated during this crisis, this may have affected their responses to the PANAS-X and, therefore, the association between the MEM and the PANAS-X. In this regard, we have provided, in Supplementary File 4 online, a descriptive analysis comparing the responses to the MEM and PANAS-X. In short, negative affects were significantly higher in our sample than the original PANAS-X but these differences remain in the small range. As such, we believe that the COVID-19 pandemic influenced to a certain degree the participant’s emotional state, mostly through higher mean-level of negative emotional states. These differences do not seem to have affected the reliability or the validity of our results. For instance, internal consistencies achieved with our sample with regard to the PANAS-X are similar to those reported by Watson and Clark (1994). Replicating the study in a non-pandemic context would be ideal, though a complete return to normality for everyone may not happen for quite some time.
Implication for future research
As this study aimed to present a validation of the MEM to the research community, there are many implications of our findings to future research. First, it would be interesting to test whether the MEM facilitates the assessment of emotional states in populations with difficulties in verbal expression of emotion, as is the case with ASC and alexithymia. Recent research suggests that music may facilitate the identification of their emotional states (Akbari et al., 2021; Lonsdale, 2019; Lyvers et al., 2020; Wagener et al., 2021). Indeed, neuroscience research shows that the ASC brain processes music in the same way as neurotypical people (Caria et al., 2011). In some cases, ASCs have better music perceptual abilities (Heaton, 2009) and their perception of emotions in music is intact (Heaton et al., 2008). Also, a study has shown that music therapy helps to decrease the symptoms of alexithymia, as it allows individuals with this condition to express their emotions through music (Akbari et al., 2021). Moreover, Lyvers et al. (2020) suggest that individuals with alexithymia use music to feel and regulate their emotions in the same way that some do with illicit substances. Similarly, Lonsdale (2019) has shown that people with alexithymia may use music to regulate their negative emotions. Therefore, music could be a good alternative for assessing emotional states in these populations. Beyond using the MEM as an assessment tool, we could consider using the musical excerpts included in the MEM as a means to communicate emotions in a population of nonverbal ASC. Creating a mobile application that uses the MEM could serve this purpose.
Third, our study has revealed that 69% of participants preferred to respond to the MEM rather than the PANAS-X. The playfulness and originality of using music to assess emotions could increase research participation rates and further capture participant’s attention during data collection. Because the emotions of the excerpts used in our study are universally recognized (Fritz et al., 2009), using the MEM instead of verbal measures of emotions could circumvent some biases with words such as language or cultural barriers. It is well known that it is difficult to translate a questionnaire adequately and that long and complex translation procedures must be used. Music used in lieu of a verbal questionnaire could overcome these difficulties. Borrowing from Schopenhauer (1819/1909), we indeed believe that music would be “the language of feeling and of passion, as words are the language of reason” (p. 339).
Conclusion
If music really did appear before language in human evolution (Rochon, 2018), it is surprising that this study is the first to show that music can be used in the same way as words to assess emotional states. We have shown in this study that the MEM is a reliable and valid questionnaire to evaluate emotional states. Our results showed that participants who reflected on how they felt over the past 24 hr were able to consistently choose the same emotional category of music clips. Similarly, the emotions conveyed by our musical excerpts were consistent with those of one of the most widely used affective state questionnaire (PANAS-X, Watson & Clark, 1994). This indicates that the emotional sense individuals give to music may be as accurate as words, and may be used to assess emotion in scientific research. Instead of reading a long list of adjectives to explain how one feels, this study opens the avenue for individuals to listen and choose music instead. This study opens new research opportunities in the field of music and emotions, and also may have practical implications for populations having difficulties with the use of words to express their emotions.
Supplemental Material
sj-pdf-1-pom-10.1177_03057356221146811 – Supplemental material for Validation of the Measure of Emotions by Music (MEM)
Supplemental material, sj-pdf-1-pom-10.1177_03057356221146811 for Validation of the Measure of Emotions by Music (MEM) by Éric Hanigan, Arielle Bonneville-Roussy, Gilles Dupuis and Christophe Fortin in Psychology of Music
Supplemental Material
sj-pdf-2-pom-10.1177_03057356221146811 – Supplemental material for Validation of the Measure of Emotions by Music (MEM)
Supplemental material, sj-pdf-2-pom-10.1177_03057356221146811 for Validation of the Measure of Emotions by Music (MEM) by Éric Hanigan, Arielle Bonneville-Roussy, Gilles Dupuis and Christophe Fortin in Psychology of Music
Supplemental Material
sj-pdf-3-pom-10.1177_03057356221146811 – Supplemental material for Validation of the Measure of Emotions by Music (MEM)
Supplemental material, sj-pdf-3-pom-10.1177_03057356221146811 for Validation of the Measure of Emotions by Music (MEM) by Éric Hanigan, Arielle Bonneville-Roussy, Gilles Dupuis and Christophe Fortin in Psychology of Music
Supplemental Material
sj-pdf-4-pom-10.1177_03057356221146811 – Supplemental material for Validation of the Measure of Emotions by Music (MEM)
Supplemental material, sj-pdf-4-pom-10.1177_03057356221146811 for Validation of the Measure of Emotions by Music (MEM) by Éric Hanigan, Arielle Bonneville-Roussy, Gilles Dupuis and Christophe Fortin in Psychology of Music
Supplemental Material
sj-pdf-5-pom-10.1177_03057356221146811 – Supplemental material for Validation of the Measure of Emotions by Music (MEM)
Supplemental material, sj-pdf-5-pom-10.1177_03057356221146811 for Validation of the Measure of Emotions by Music (MEM) by Éric Hanigan, Arielle Bonneville-Roussy, Gilles Dupuis and Christophe Fortin in Psychology of Music
Supplemental Material
sj-pdf-6-pom-10.1177_03057356221146811 – Supplemental material for Validation of the Measure of Emotions by Music (MEM)
Supplemental material, sj-pdf-6-pom-10.1177_03057356221146811 for Validation of the Measure of Emotions by Music (MEM) by Éric Hanigan, Arielle Bonneville-Roussy, Gilles Dupuis and Christophe Fortin in Psychology of Music
Footnotes
Funding
The author(s) disclosed receipt of the following financial support for the research, authorship, and/or publication of this article: This research received a grant from the “Faculté des sciences humaines” of the Université du Québec à Montréal.
Supplemental material
Supplemental material for this article is available online.
Notes
References
Supplementary Material
Please find the following supplemental material available below.
For Open Access articles published under a Creative Commons License, all supplemental material carries the same license as the article it is associated with.
For non-Open Access articles published, all supplemental material carries a non-exclusive license, and permission requests for re-use of supplemental material or any part of supplemental material shall be sent directly to the copyright owner as specified in the copyright notice associated with the article.