
Abstract
Processing musical meter—the organization of time into regular cycles of strong and weak beats—requires abstraction from the varying rhythmic surface. Several studies have investigated whether meter processing requires attention, or if it can be both pre-attentive and attentive. While findings on temporal expectation (processing meter per se) indicate benefits of attention, studies on meter processing in complex, dual-task contexts (meter used for temporal orientation) consistently report pre-attentive processing. Also, while surface-based approaches to meter (meter aided by pattern repetition) show some benefits of attention, structural approaches (meter not aided by pattern repetition, increased complexity) find pre-attentive-only processing. Therefore, in the present study, we hypothesized that pre-attentive processing increases with cognitive load, and we compared surface with structural meter processing. Supporting our hypothesis, we saw improved behavioral performance for surface meter, as well as electroencephalogram (EEG) evidence that structural meter elicits pre-attentive processing while surface meter does not. Our findings highlight the need for increased awareness in approaches to meter processing and support the idea that increased cognitive demand may recruit pre-attentive processing of temporal structure. At the practical level, our findings suggest that focusing listeners’ attention on meter, for example, when practicing dance, may not increase their understanding of meter structure.
Keywords
The temporal structure of music is based on regular events occurring at different frequency levels, where beat is nested into meter. The meter level (lower frequency) corresponds to beat cycles, where the first beat of each cycle is strong and the others are weak (Fitch, 2016; Kotz et al., 2018). Perceiving meter in music requires abstraction from a varying rhythmic surface (Fitch, 2013), as the regular recurrence of a strong beat must be inferred from the varying rhythmic surface.
An ongoing discussion around meter processing concerns attention requirements. The dominant question has been whether meter processing is independent from attention—that is, it can occur with or without attention, or whether it requires attention. This question has been part of a debate on whether meter is fundamental to human cognition: attention requirements would speak against meter as a fundamental ability (see, for example, Winkler et al., 2009). The hypothesis of attentive-only meter processing has also been linked to theories of timing, according to which longer (suprasecond) time units may require more cognitive control, and hence more attention than shorter units such as beats (Grahn, 2012). From these viewpoints, increased complexity would require more attention.
Answers to the question of attention requirements have been mixed. One research line focuses on meter as a source of temporal orientation in non-temporal tasks (Grahn, 2012) like, for example, detecting pitch deviants. Although participants were not asked to pay attention to meter in these studies (pre-attentive processing), target events presented at strong beats were detected with increased accuracy compared with events at weak beats (Bolger et al., 2013, 2014; Escoffier et al., 2010; Keller & Burnham, 2005; Schwartze et al., 2011). A different research line concerns temporal expectation—the ability to anticipate and judge the temporal onset of an event within musical time (meter as target). Here, results become mixed. Some studies suggest that meter is perceived under pre-attentive conditions (Bouwer et al., 2014, 2016; Geiser et al., 2010; Vuust et al., 2009; Winkler et al., 2009; Zhao et al., 2017), and direct comparisons between different levels of attention to temporal information (attention to tempo vs. pitch vs. arithmetic task) indicated similar levels of entrainment to meter (Celma-Miralles & Toro, 2019; Lenc et al., 2020). In contrast, Geiser et al. (2009) asked participants to focus on meter itself (attentive) versus pitch (pre-attentive), and evoked response potentials (ERPs) showed that meter processing occurs only under attentive conditions. Also, even though Bouwer and colleagues (2014, 2016) found evidence of pre-attentive meter processing, they found larger effect sizes for attended compared with unattended meter (Bouwer et al., 2016).
While these studies focused on testing between two alternatives—meter processing is (1) both pre-attentive and attentive versus meter processing (2) needs attention—a recent electroencephalogram (EEG) study (Silva & Castro, 2019) targeting temporal expectation found evidence in favor of a third possibility: meter processing may be (3) pre-attentive only or, at least, it may be more effective under pre-attentive circumstances. Specifically, the authors found both pre-attentive and attentive structural meter processing at an early time window, and pre-attentive but not attentive processing at a later stage. This third picture emerged as meter was operationalized in a novel way, closer to the idea that meter implies abstraction (Fitch, 2013) and in line with modern concepts of musical time (Caplin, 2002). Previous studies had used surface approaches to temporal regularities, with regular meter operationalized as the repetition of a rhythmic pattern (e.g., Geiser et al., 2009; Lenc et al., 2020; Vuust et al., 2009), and meter violations as pattern changes, by adding or removing events from the original pattern (see Figure 2). In contrast, Silva and Castro (2019) adopted a structural approach to meter, meaning that the perception of meter cycles was not aided by rhythmic pattern repetition.
Silva and Castro (2019) raised the possibility that the novel pattern of pre-attentive but not attentive ERPs was a response to the increased cognitive demands of structural meter compared with surface meter. Neuroimaging data (Thaut et al., 2014) have shown that different neural substrates are engaged in structural meter processing (right prefrontal and inferior frontal cortical areas) versus pattern recognition (right temporal cortex), strengthening the notion that structural versus surface meter recruit different neural resources. The hypothetical positive relation between cognitive demand and pre-attentive processing would be in line with the idea that using the implicit system instead of the explicit one may be a more efficient way to deal with complex sequences (Masters, 1992; Reber et al., 1980). It would also be in line with findings that meter processing for temporal orientation—that is, while performing another task and thus under high cognitive demand—is consistently pre-attentive (Bolger et al., 2013, 2014; Escoffier et al., 2010; Keller & Burnham, 2005; Schwartze et al., 2011), while meter processing related to temporal expectation—under less cognitive strain—may be exclusively attentive (Geiser et al., 2009).
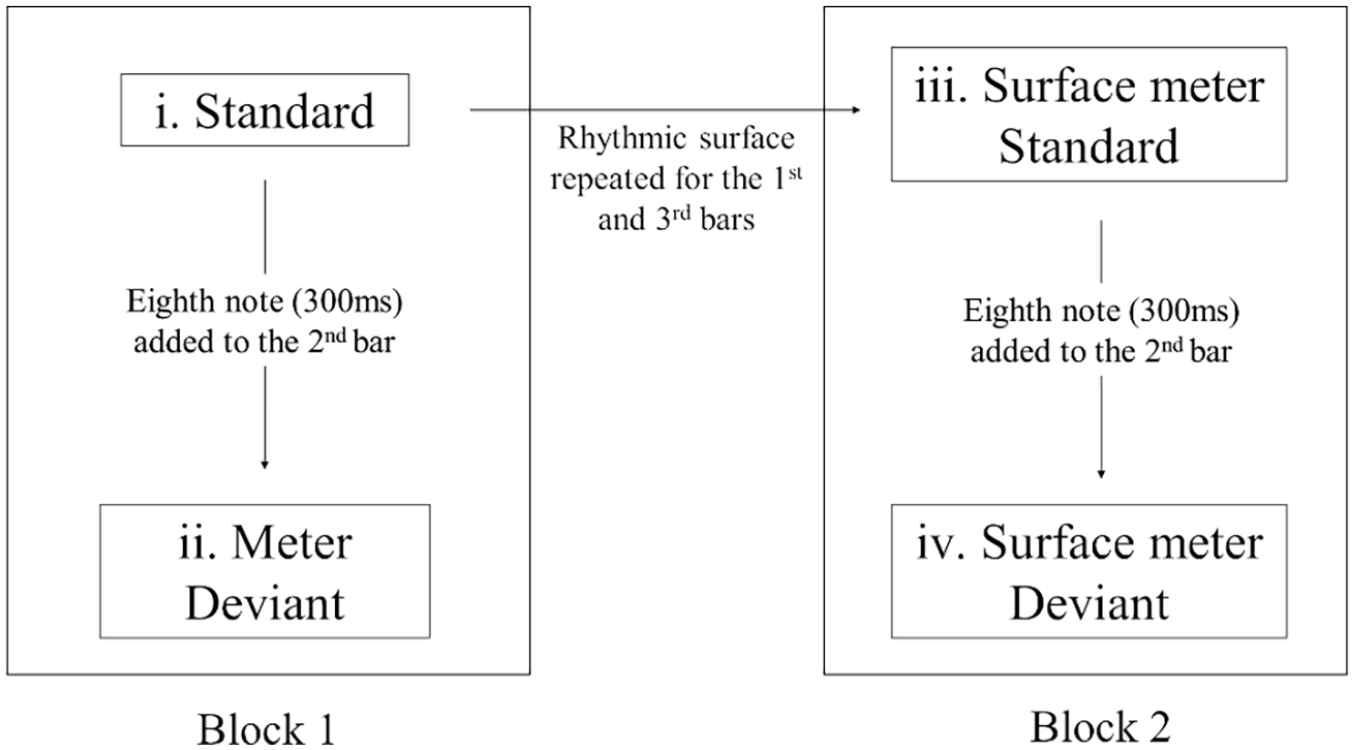
The possibility that structural meter engages more pre-attentive processing than surface meter due to increased abstraction has not been properly tested yet, in the sense that the two types of meter have not been examined using the same paradigm and participants. To address this gap, we compared ERP responses with attended (attentive processing) versus unattended temporal violations (pre-attentive processing) of structural versus surface meter, using the same paradigm as Silva and Castro (2019). Attentive versus pre-attentive responses to structural meter-related violations (index of structural meter processing) were collected in one experimental block, and responses to surface meter-related violations (index of surface meter processing) in another block (Figure 1). A single group of participants was exposed to the two types of temporal violations, performing similar tasks in both. We predicted that the increased levels of abstraction engaged in structural meter would generate lower behavioral accuracy in discriminating between standards and deviants, as well as increased amplitude in EEG markers of pre-attentive processing.
Generation of Stimulus Materials and Distribution Across Blocks.
Materials and methods
Participants
Twenty-eight healthy adults participated in the experiment. After excluding participants with excessive EEG artifacts, 22 were considered in the analysis (4 men; age: M = 22.23, SD = 6.91 years; schooling: M = 13.82, SD = 1.53 years). All were right-handed and did not report hearing impairments. None was taking medication or reported psychiatric or neurological disease. Nine had formal musical education (M = 6.25, SD = 4.06, range: 1–12 years). All participants signed informed consent in line with the declaration of Helsinki.
Stimuli
A schematic representation of the stimulus generation process is presented in Figure 1. Each stimulus consisted of a three-bar rhythmic sequence with 600-ms beat length, based on triple meter (3/4, see Figure 2). The duration of each sequence ranged between 5,400 and 5,700 ms, depending on stimulus type. To highlight meter, the first note of each bar (strong beat) had increased intensity compared with weak beats (70 vs. 61 dB in the attack portion, see Windsor, 1993). These MIDI-generated sequences were played with a constant pitch set to G5, with a xylophone timbre (for short attacks), and they were generated using Anvil Studio (Version 2019.03.01 64 bit).
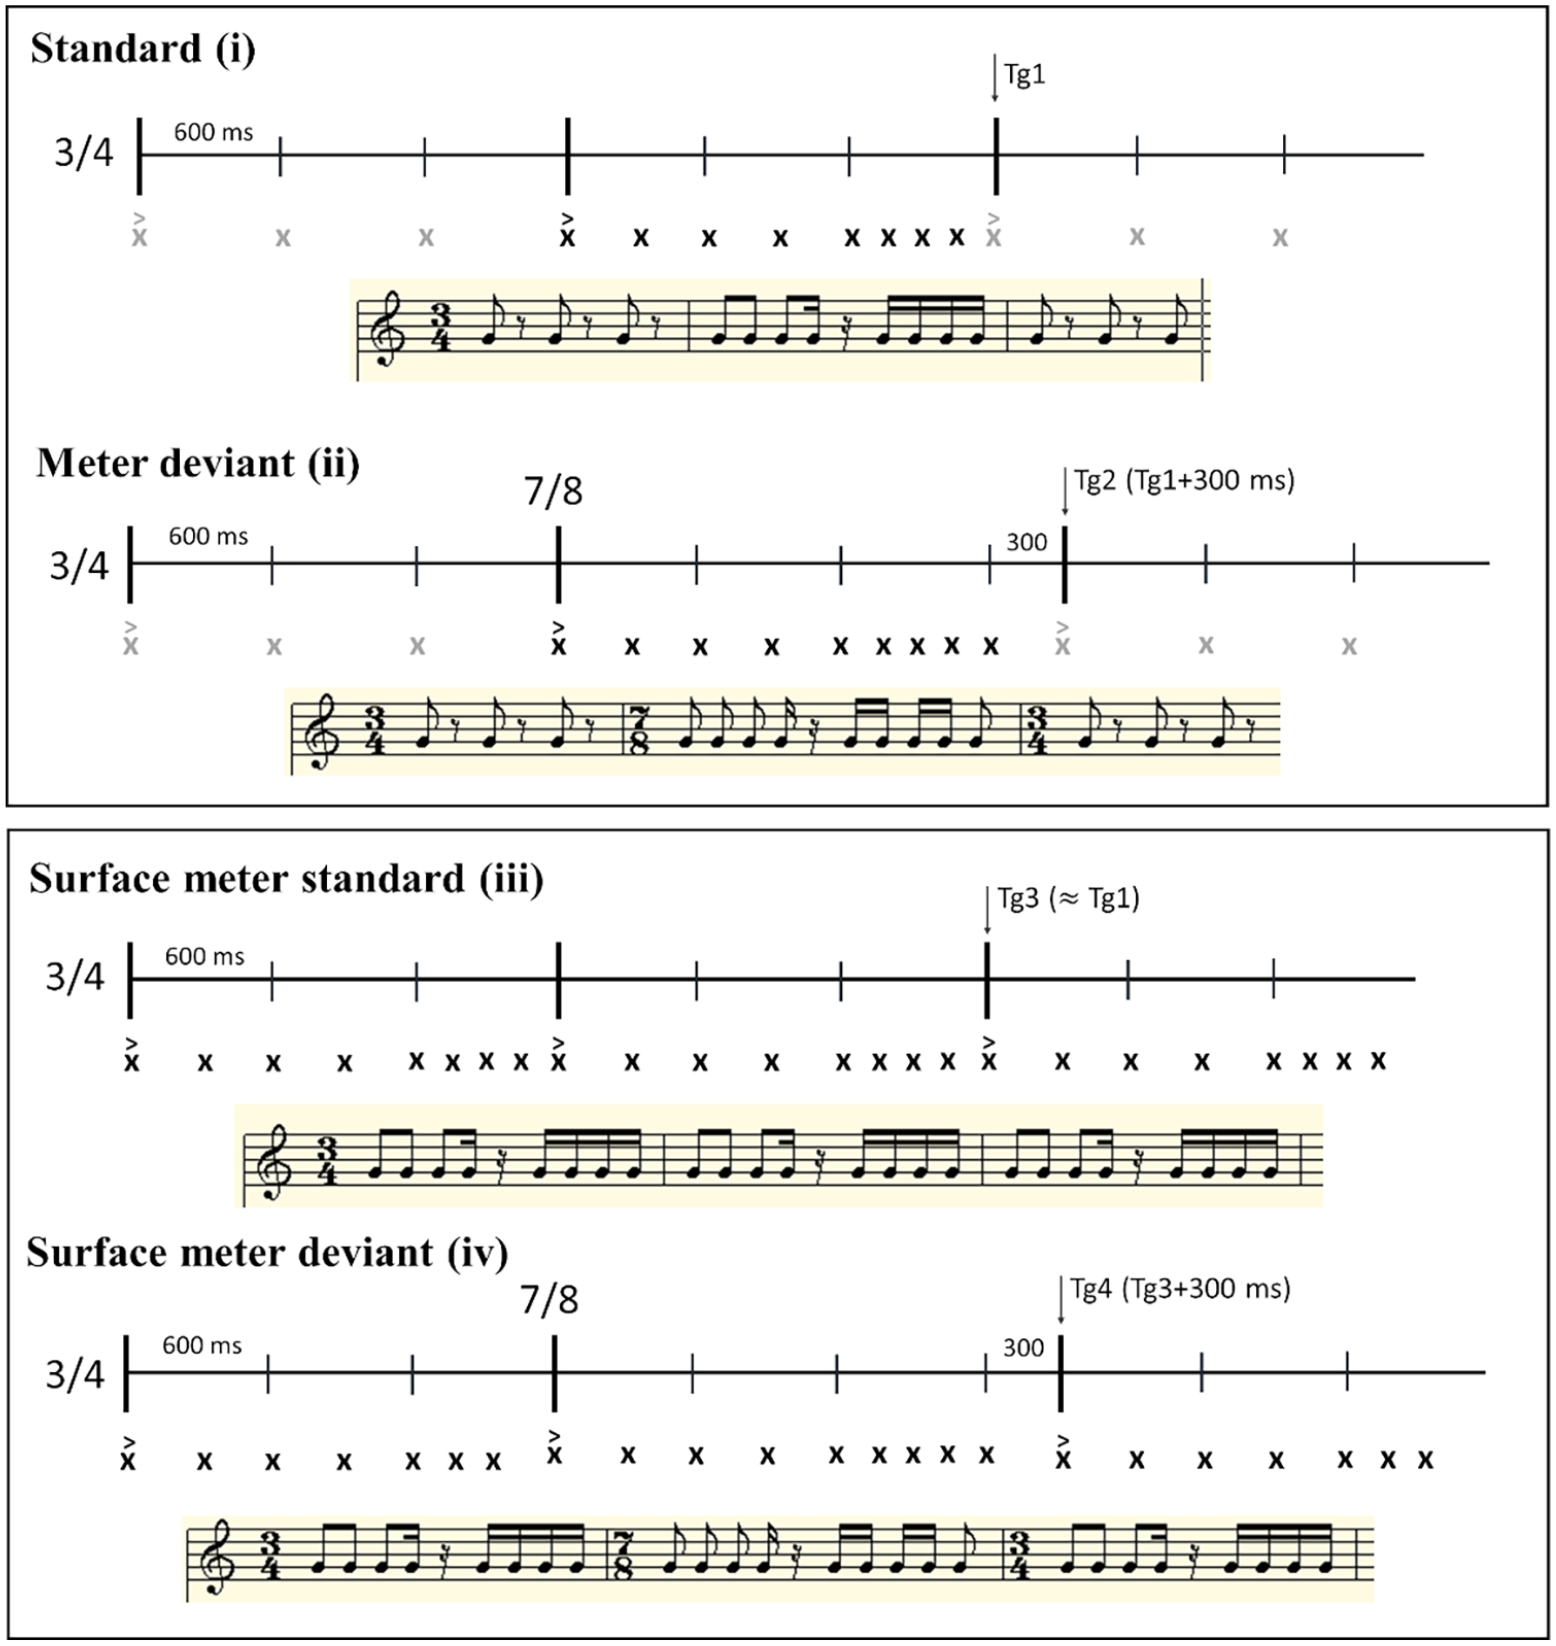
Example Stimuli for All Stimulus Types. Sequences of Xs (Above) Are Schematic Representations of the Onset of Notes, Also Presented in Standard Music Notation (Below). The list of Standard Stimuli Can Be Found in Appendix A in Supplementary Materials Online.
In each experimental block (Block 1—structural meter; Block 2—surface meter, see Figure 1), we had 29 different standards (see Appendix A in Supplementary Materials online) and 29 different deviants, derived from standards. To generate deviant sequences, we used Geiser et al.’s (2009) approach, where half-beat (300 ms) was added to the second bar: this allowed the second bar to be perceived as a group of 7 eighth-note units (7/8), contrasting with the preceding group of three quarter-note units (3/4). Participants were therefore confronted with a delayed onset for the third bar. The reason why we used delayed onsets—rather than early onsets, which have also been used in Geiser et al. (2009) and Silva and Castro (2019)—was that Silva and Castro showed a correlation between behavior and EEG for delayed, but not for early onsets.
Structural meter standards (Figures 1 and 2i) contained three 3/4 bars. The first and last bars were composed of eighth notes that marked the beat onset, while the second bar was composed of varying rhythmic phrases using quarter-, eighth-, and sixteenth-notes (see Appendix A in Supplementary Materials online). In structural meter deviants (Figures 1 and 2ii), the second bar was transformed into a longer, 7/8 bar. Changing the rhythmic pattern from the first to the second bar in both standard and structural meter deviant versions was critical to our design, in that it granted that listeners would not rely on pattern changes to detect deviants.
Surface meter standards (Figures 1 and 2iii) were generated from structural meter standards by copying the rhythm of the second bar into the first and third bars. Thus, rhythmic phrases were the same for all three bars. Surface meter deviant generation followed the same procedure as in structural meter (Figures 1 and 2iv). In contrast to structural meter deviants, surface meter deviants could be detected based on pattern changes (the same pattern with one event added).
The two experimental blocks were presented twice: first in a pitch-deviant detection task (pre-attentive temporal processing condition) and then in an explicit temporal violation detection task (attentive temporal processing condition). To make the pitch-detection task possible, we lowered the pitch of one note to C5 in 33% of the sequences (both standards and deviants). The target note was always the second beat of the third bar to guarantee that meter deviance detection (occurring before, at the second bar) was not disturbed.
Each block had a set of triggers (Tg) that marked its critical events (Figure 2). In the structural meter block, a trigger was placed at the onset of the third bar of standard stimuli, capturing the third bar onset (Tg1); another was placed 300 ms later for deviant stimuli, capturing the delayed third bar onset (Tg2). In the surface meter block, triggers were placed similarly to the structural conditions (Tg3 and Tg4). Therefore, in both blocks, we intended to capture the correlates of delayed onsets relative to listeners’ expectations and the corresponding perception of irregularity in the preceding temporal unit.
Procedure
In both structural and surface meter blocks, participants were presented the same set of temporal standards versus deviants twice: once in a pitch-deviant detection task (pre-attentive meter processing); twice in a temporal-violation detection task (attentive meter processing). To minimize attention to meter in the pre-attentive conditions, all participants started with the pitch-deviant detection task. Before the tasks, participants were given brief verbal and graphic explanations on the concepts of beat, meter and bar, and they were presented with examples of standard and deviant sequences. Each block included three practice trials.
Each trial consisted of the following sequence: a 200-ms fixation cross, an auditory stimulus (between 5,400 and 5,700 ms, depending on the condition), a written question on the screen (“Is there a low-pitched note, different from all the others?,” or “Did the meter change?”). Each question called for a keypress, to which participants answered “yes” or “no” in a self-paced manner. The next trial started immediately after the keypress. The assignment of keys to responses was balanced across participants. Participants had a break between each of the four tasks (two tasks per block).
Block order was balanced across participants. We created four pseudo randomizations of stimuli, one per block × task. For each pseudo randomization, two stimulus orderings were created (A and B), with B having the order of halves switched compared with A (A, 1–29; B, 15–29 followed by 1–14). Half the participants listened to Versions A, and the other half to Versions B. Stimuli were delivered through loudspeakers in an acoustically shielded room.
Before starting the experiment, participants signed the informed consent forms and filled in a sociodemographic questionnaire. The total duration of the experiment ranged between 50 and 70 min.
EEG recording and preprocessing
Participants sat comfortably in front of the stimulation computer. They were asked to move as little as possible during the tasks and to blink between trials. EEG data were collected using a Biosemi ActiveTwo system at a 512-Hz sampling rate. Sixty-four active channels were mounted on a BioSemi elastic headcap following the 10 to 20 system. Electrodes were referenced to two external electrodes placed at the right and left mastoid bones. Another external electrode was placed under the left eye to detect vertical electrooculograph (EOG) artifacts. During electrode placement, signal quality was kept under the system-recommended thresholds.
EEG data were preprocessed using the Fieldtrip toolbox (Oostenveld et al., 2011) for MATLAB. Epochs were extracted by marking 200 ms before and 1,000 ms after trigger points (see “Stimuli” section). Epoch-based artifact rejection was then performed in two stages: first, EOG artifacts were removed through inspection of variance in vertical (EOG external electrode bipolarly referenced to Fp1) and horizontal movements (F7 referenced to F8); second, trial variance was inspected to remove epochs containing other artifacts, and also to remove defective channels. Epochs were then baseline corrected (baseline = 200 ms), detrended, re-referenced to the mastoid electrodes, and band-pass filtered between 0.01 and 30 Hz. Removed channels were interpolated using nearest neighborhood averaging. Epochs were averaged for each condition per participant, and these were grand averaged.
Statistical analysis
We examined behavioral results using d′, an index of discrimination (Stanislaw & Todorov, 1999). We compared participants’ performance across the two temporal conditions (structural meter and surface meter) in each of the two tasks (pitch vs. meter deviant detection) using separate ANOVAs. To determine potential influences from musical training, which have been reported for meter processing (Geiser et al., 2009, 2010; Palmer & Krumhansl, 1990; Perna et al., 2018; Yates et al., 2016 for meter, but see Bouwer et al., 2014), we added musical training (yes vs. no) as a between-subjects factor. In addition, we checked whether the behavioral performance of participants without musical training was above chance levels, using one-sample tests against zero.
Concerning EEG data, we grouped grand averaged channels into nine regions of interest (ROIs), following Silva and Castro (2019): right anterior (Fp2, AF8, AF4, F4, F6), middle anterior (F1, Fpz, AFz, Fz, F2), left anterior (FP1, AF7, AF3, F3, F5), right central (FC6, FC4, C4, C6, CP6, CP4), middle central (FC1, C1, CP1, CPz, Cz, FCz, FC2, C2, CP2), left central (FC5, FC3, C3, C5, CP5, CP3), right posterior (P4, P6, P8, PO8, PO4), middle posterior (P1, Oz, POz, Pz, P2), and left posterior (P3, P5, P7, PO7, PO3).
Visual inspection of the waveforms highlighted increased positivity for deviants along the entire epoch for structural meter and surface meter processing. This ruled out the presence of a negative component marking deviance perception, which has been reported in some studies (MMN, see Geiser et al., 2009, or N2b, Bouwer et al., 2016). Therefore, we focused on the series of visible positive peaks matching commonly reported auditory ERPs (Winkler et al., 2013), which we referred to as P1 (80–120 ms), P2 (150–275 ms), P3 (300–500 ms), and P600 ms (600–800 ms, see Friederici, 2002). Along with MMN or N2b, the literature on meter processing often refers to an increased P3 component in deviants (Bouwer et al., 2016), although its latencies (180–260 ms) resemble those of our P2. For each block and time window, we ran 2 × 2 × 3 × 3 repeated-measures ANOVAs, comprising attention (attended vs. unattended), stimulus type (standard vs. deviant), caudality (anterior, central, posterior), and laterality (left, middle, right) as factors. To allow a direct comparison with Silva and Castro’s (2019) study, we made a complementary analysis based on 300-ms time windows (TWs): 0 to 300, 300 to 600, and 600 to 900 ms.
As our goal was to investigate the balance between pre-attentive and attentive processing in structural versus surface meter, we focused on attention × stimulus-type interactions and further interactions with topographic factors (attention × stimulus type × caudality, laterality, or caudality × laterality) for each temporal structure. The highest-order interaction was broken down to locate the regions where attention × stimulus-type interactions occurred: for instance, when both attention × stimulus type and attention × stimulus type × caudality were significant, we broke down the latter. Once located, these regions were analyzed for stimulus-type effects per attention condition. When attention × stimulus-type interactions were null, we examined the main effects of stimulus type. Significant main effects of stimulus type or interactions of these with topographic factors would indicate attention-independent (attentive and pre-attentive) temporal processing, while nonsignificant effects would point to the absence of EEG signatures of temporal processing, whether attentive or pre-attentive.
In a complementary test of the hypothesis that increased cognitive demand goes along with increased presence of pre-attentive processing, we compared high versus low d′ participants (defined by median split) for their use of attentive versus pre-attentive processing (attention × stimulus-type interaction in each group). We predicted that, whenever pre-attentive processing was present, low d′ participants (those with more difficulty in performing the task) would show increased stimulus-type effects for the unattended condition compared with attended, while high d′ participants would show the reverse pattern.
All statistical decisions were guided by conventional null-hypothesis-significance-testing, based on the alpha threshold of .05. Sphericity violations were handled with Greenhouse–Geiser corrections. We also calculated Bayes factors (BF) in favor of the alternative hypothesis over the null one (BF10), with JASP software (JASP Team, 2020) and using default priors. Unlike traditional null-hypothesis-significance-testing, which relies on dichotomous information (significant vs. non-significant results), BF quantify the relative predictive performance of two alternative hypothesis (alternative vs. null, or null vs. alternative), measuring the strength of evidence in favor of one over the other (Biel & Friedrich, 2018; van Doorn et al., 2021). BF are particularly relevant to strengthen claims of null effects and clarify marginal results, and this was how we have mostly used them in the present study. Following the heuristics provided in van Doorn et al. (2021), we considered BFs between 1 and 3, 3 and 10, 10 and 30, and above 30 as weak, moderate, strong, and very strong evidence in favor of the alternative hypothesis. While BFs above 1 support the alternative hypothesis, BFs below 1 indicate evidence in favor of the null hypothesis, and evidence here becomes stronger as values decrease: BFs between 1 and 0.33 provided weak evidence, between 0.33 and 0.10 moderate, between 0.10 and 0.03 strong, and below 0.03 very strong.
Results
Behavioral results
In the pitch deviant detection task (pre-attentive temporal processing), Wilcoxon signed-rank tests against zero showed above-chance discrimination for both structural meter (M = 7.16, SD = 0.73, p < .001) and surface meter (M = 4.45, SD = 1.99, p < .001), with very strong BF10s (>30). Notwithstanding, the mixed ANOVA with meter type and musical training as factors (Figure 3) indicated improved pitch detection for structural meter, F(1, 20) = 105.13, p = .004,
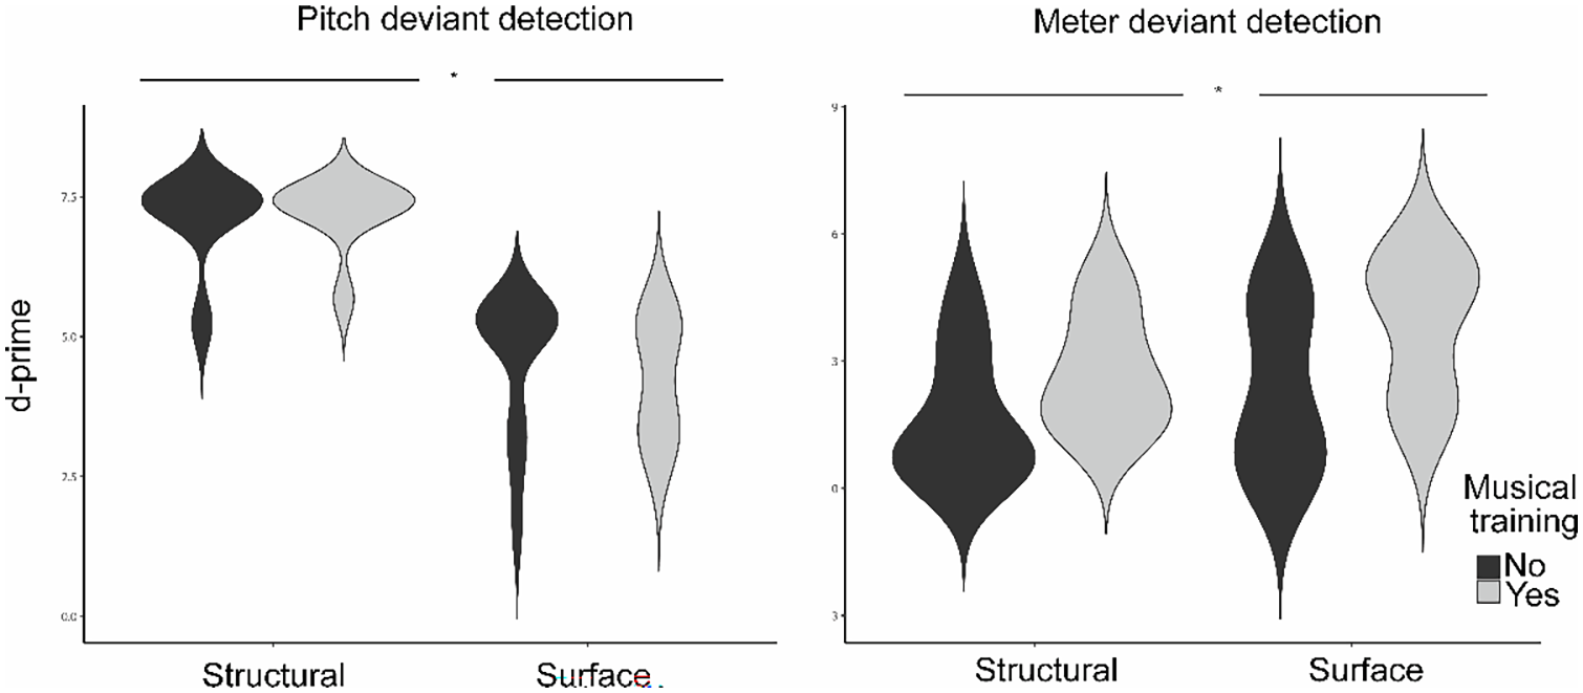
Behavioral Results in Pre-attentive (Pitch Deviant Detection) and Attentive (Meter Deviant Detection) Conditions. The Width of Shapes Represents the Approximate Frequency of Data Points in Each Region.
In the meter-deviant detection task (attentive temporal processing), one-sample tests against zero also showed above-chance temporal discrimination for both meter types, structural meter: M = 2.05, SD = 1.54, t(21) = 6.24, p < .001; surface meter: M = 2.87, SD = 1.95, V = 231, p < .001. Bayesian evidence was very strong in both cases (BF10 > 30). The mixed ANOVA (Figure 3) showed a main effect of meter type, F(1, 20) = 6.98, p < .016,
In sum, participants performed better in the pitch deviant detection task when they were listening to structural meter compared with when they were listening to surface meter. Concerning differences in meter deviance detection across meter types, increased performance for surface meter compared with structural meter supports our first hypothesis. It is worth noting that d′ values for structural meter reached much higher values here, M = 2.05, than in Silva and Castro (2019), M = 0.49. Why would the same task, performed by a sample of participants with similar characteristics (5 out of 18 participants with musical training, ranging from 1 to 6 years of training), induce such differences in performance? This may be evidence in favor of our hypothesis of increased pre-attentive processing under increased cognitive demand: Silva and Castro (2019) presented three different types of meter deviance (delayed onset, early onset, and silent onset) instead of one (delayed onset, as here), and this may have made the task more difficult than in the current study.
EEG results
Tables 1 to 4 summarize the EEG results for structural versus surface meter.
Structural and Surface Meter Processing Results at 80 to 120 ms (P1).
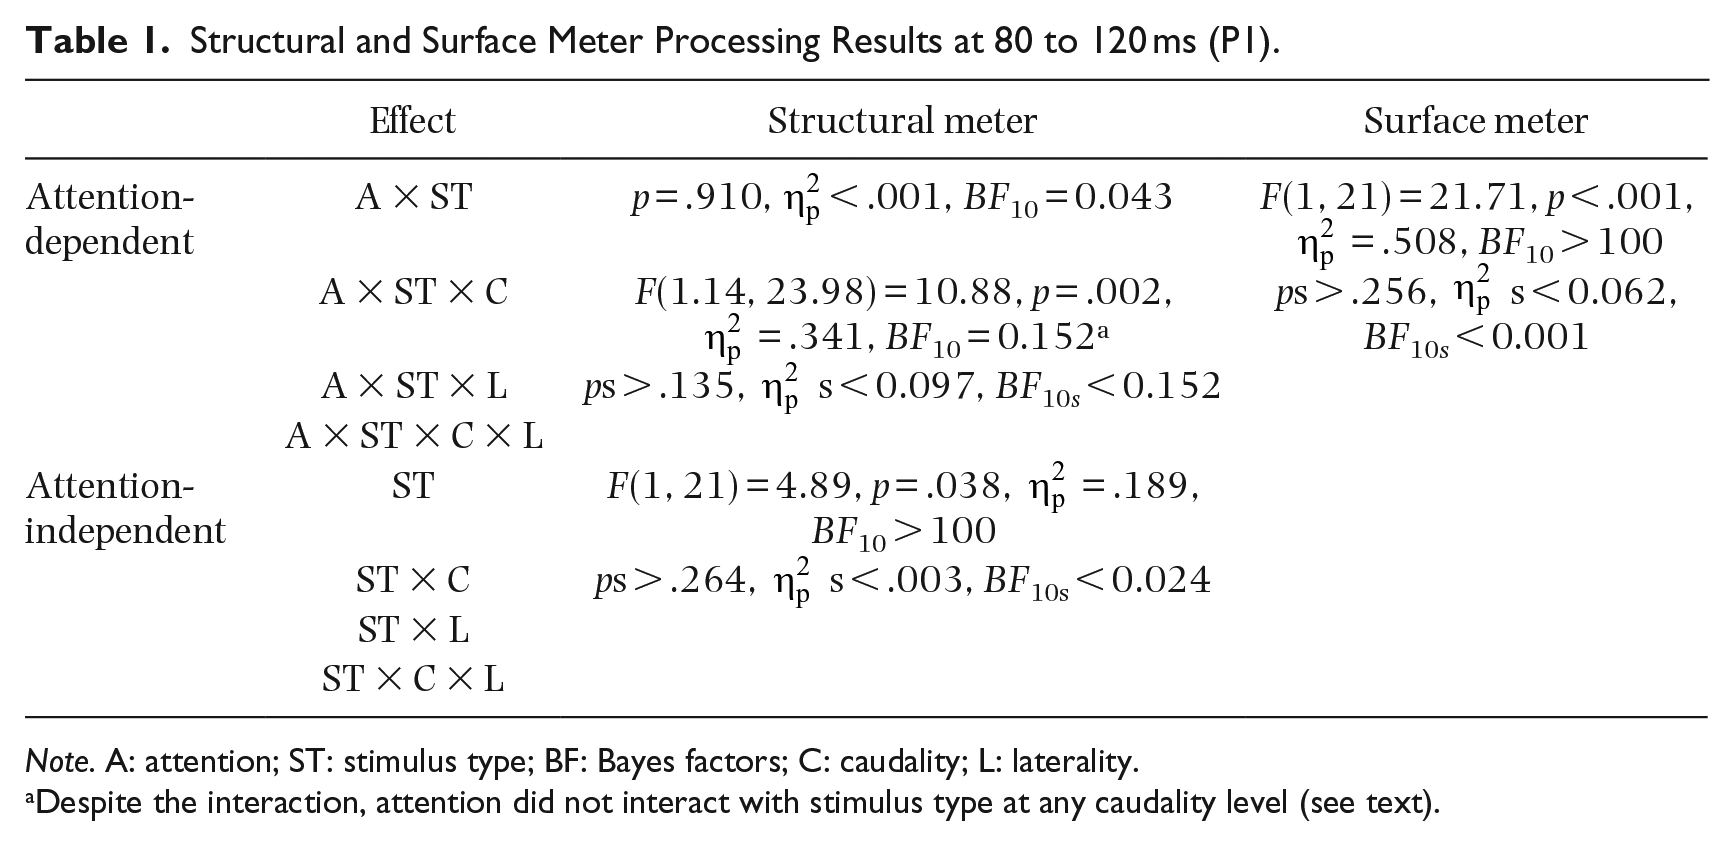
Note. A: attention; ST: stimulus type; BF: Bayes factors; C: caudality; L: laterality.
Despite the interaction, attention did not interact with stimulus type at any caudality level (see text).
Structural and Surface Meter Processing Results at 150 to 275 ms (P2).
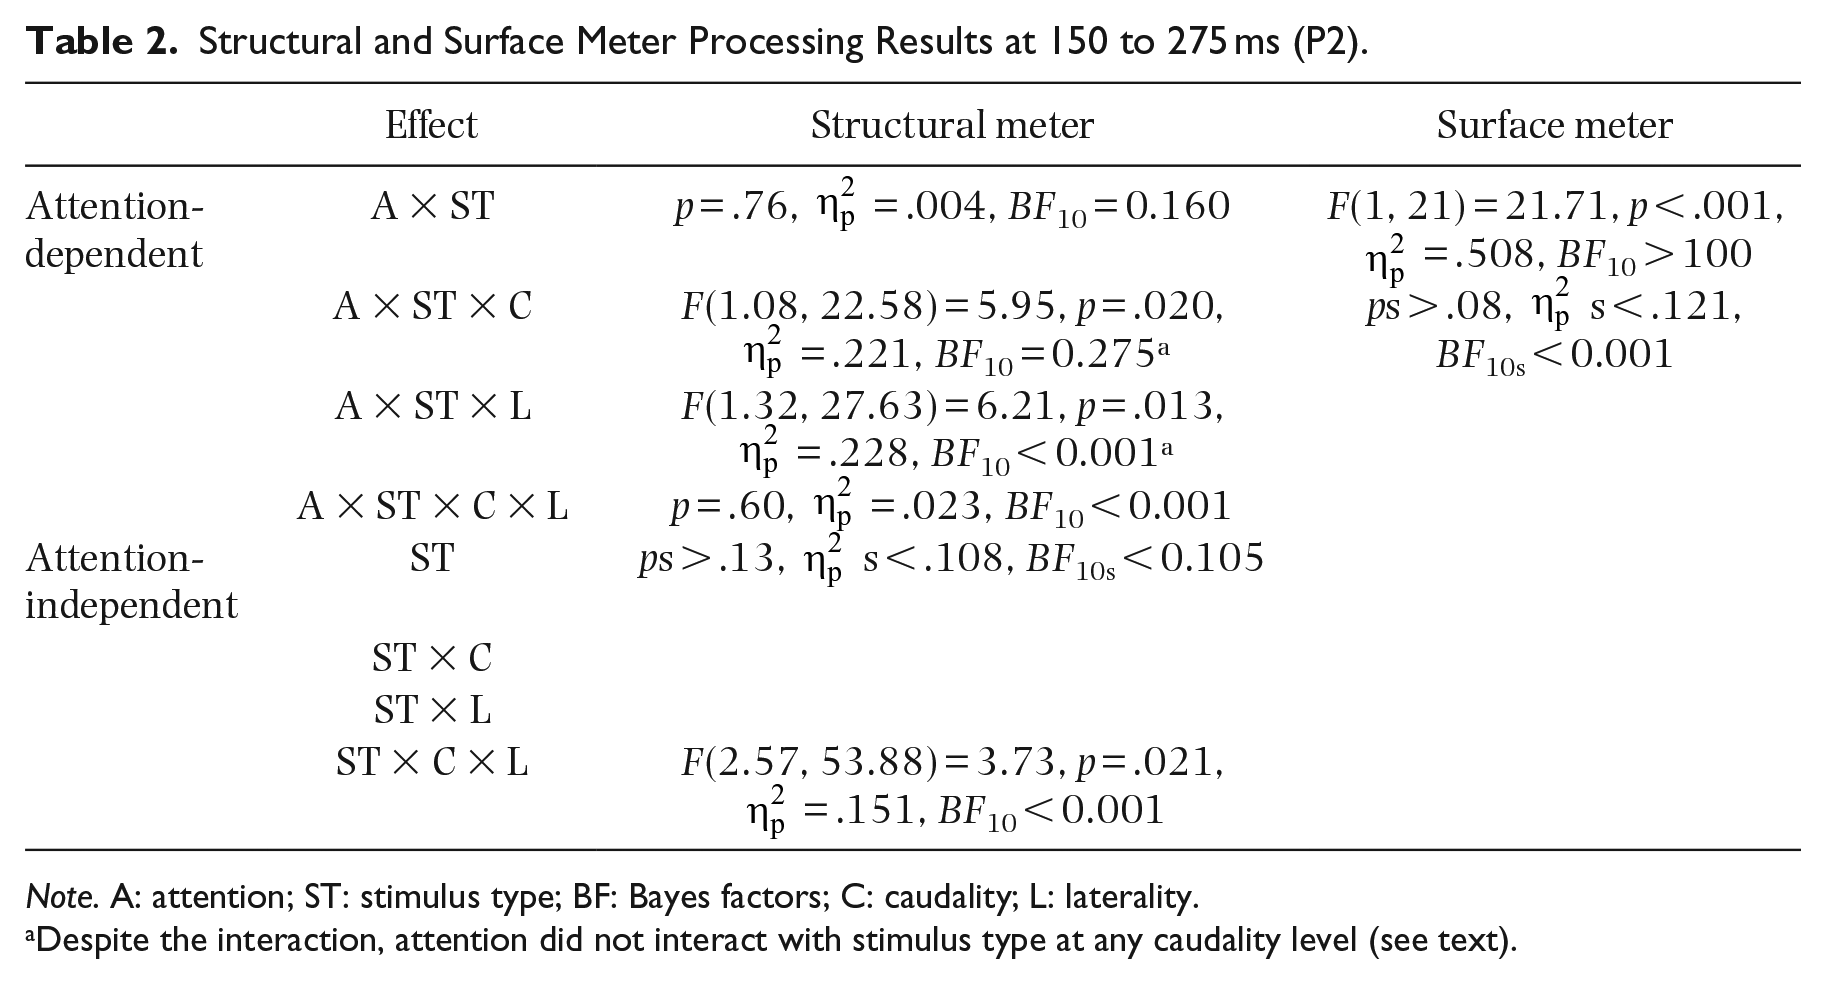
Note. A: attention; ST: stimulus type; BF: Bayes factors; C: caudality; L: laterality.
Despite the interaction, attention did not interact with stimulus type at any caudality level (see text).
Structural and Surface Meter Processing Results at 300 to 500 ms (P3).
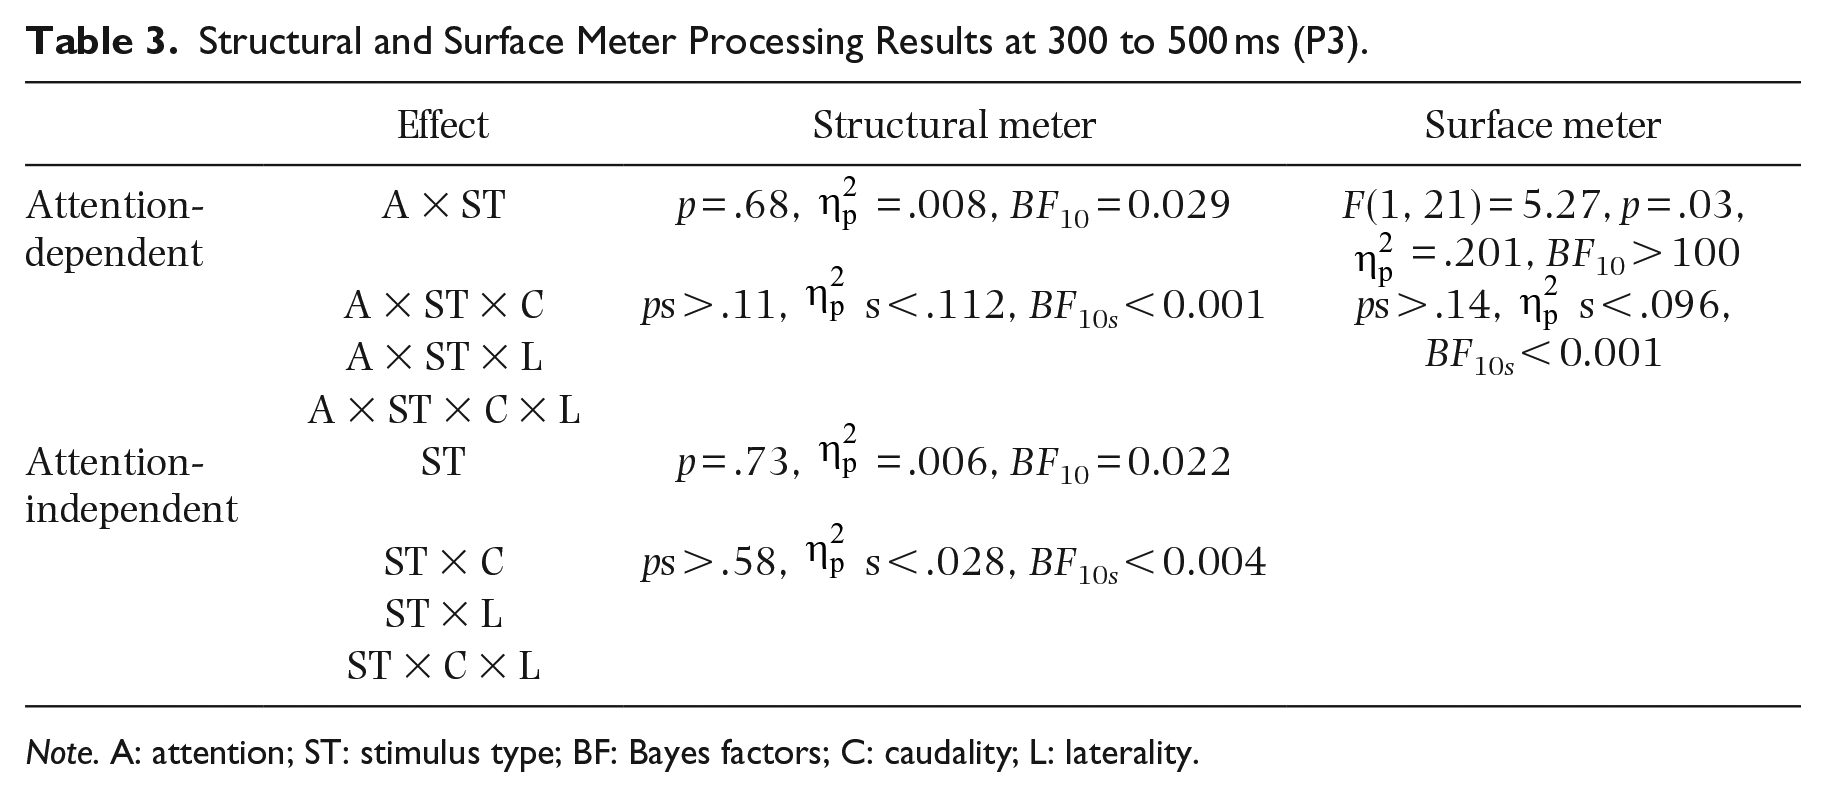
Note. A: attention; ST: stimulus type; BF: Bayes factors; C: caudality; L: laterality.
Structural and Surface Meter Processing Results at 600 to 800 ms (P600).
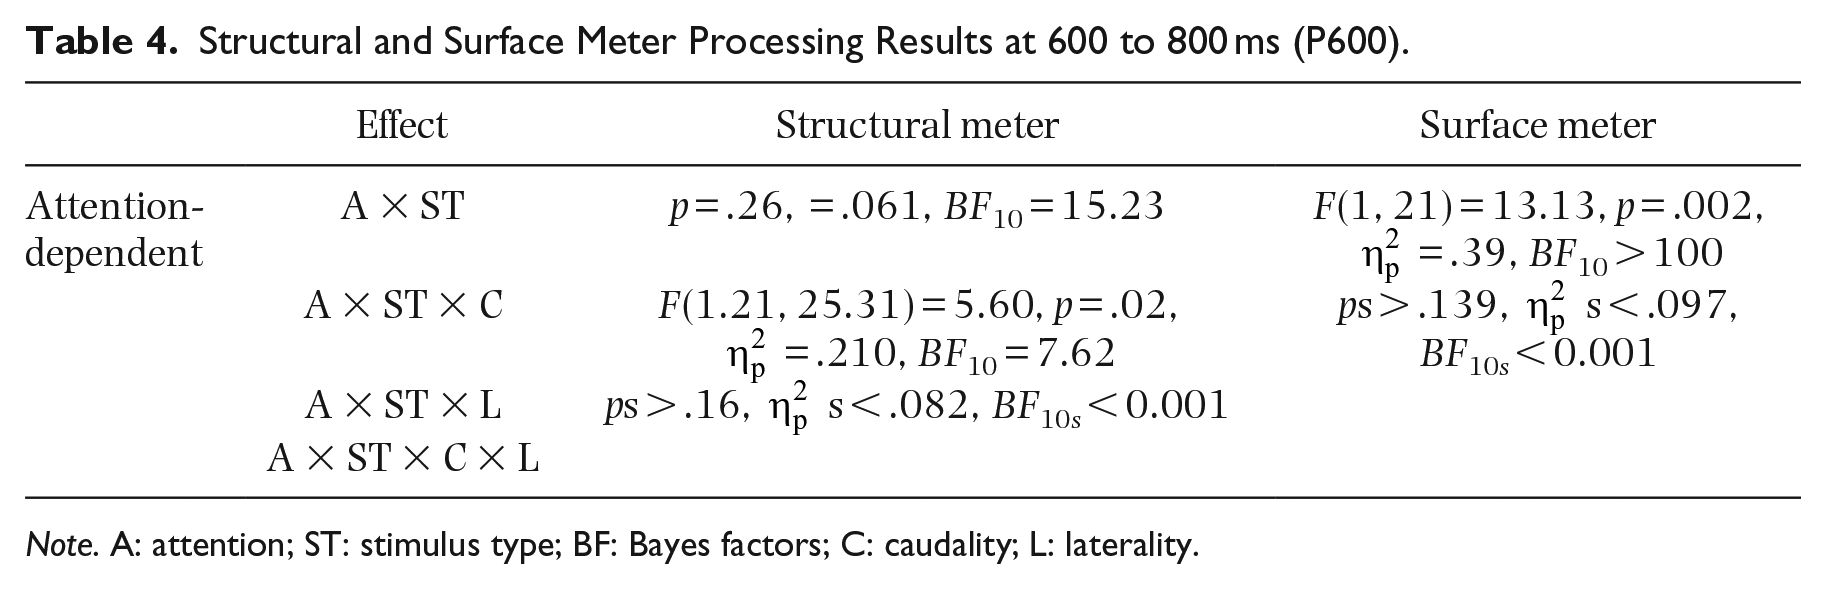
Note. A: attention; ST: stimulus type; BF: Bayes factors; C: caudality; L: laterality.
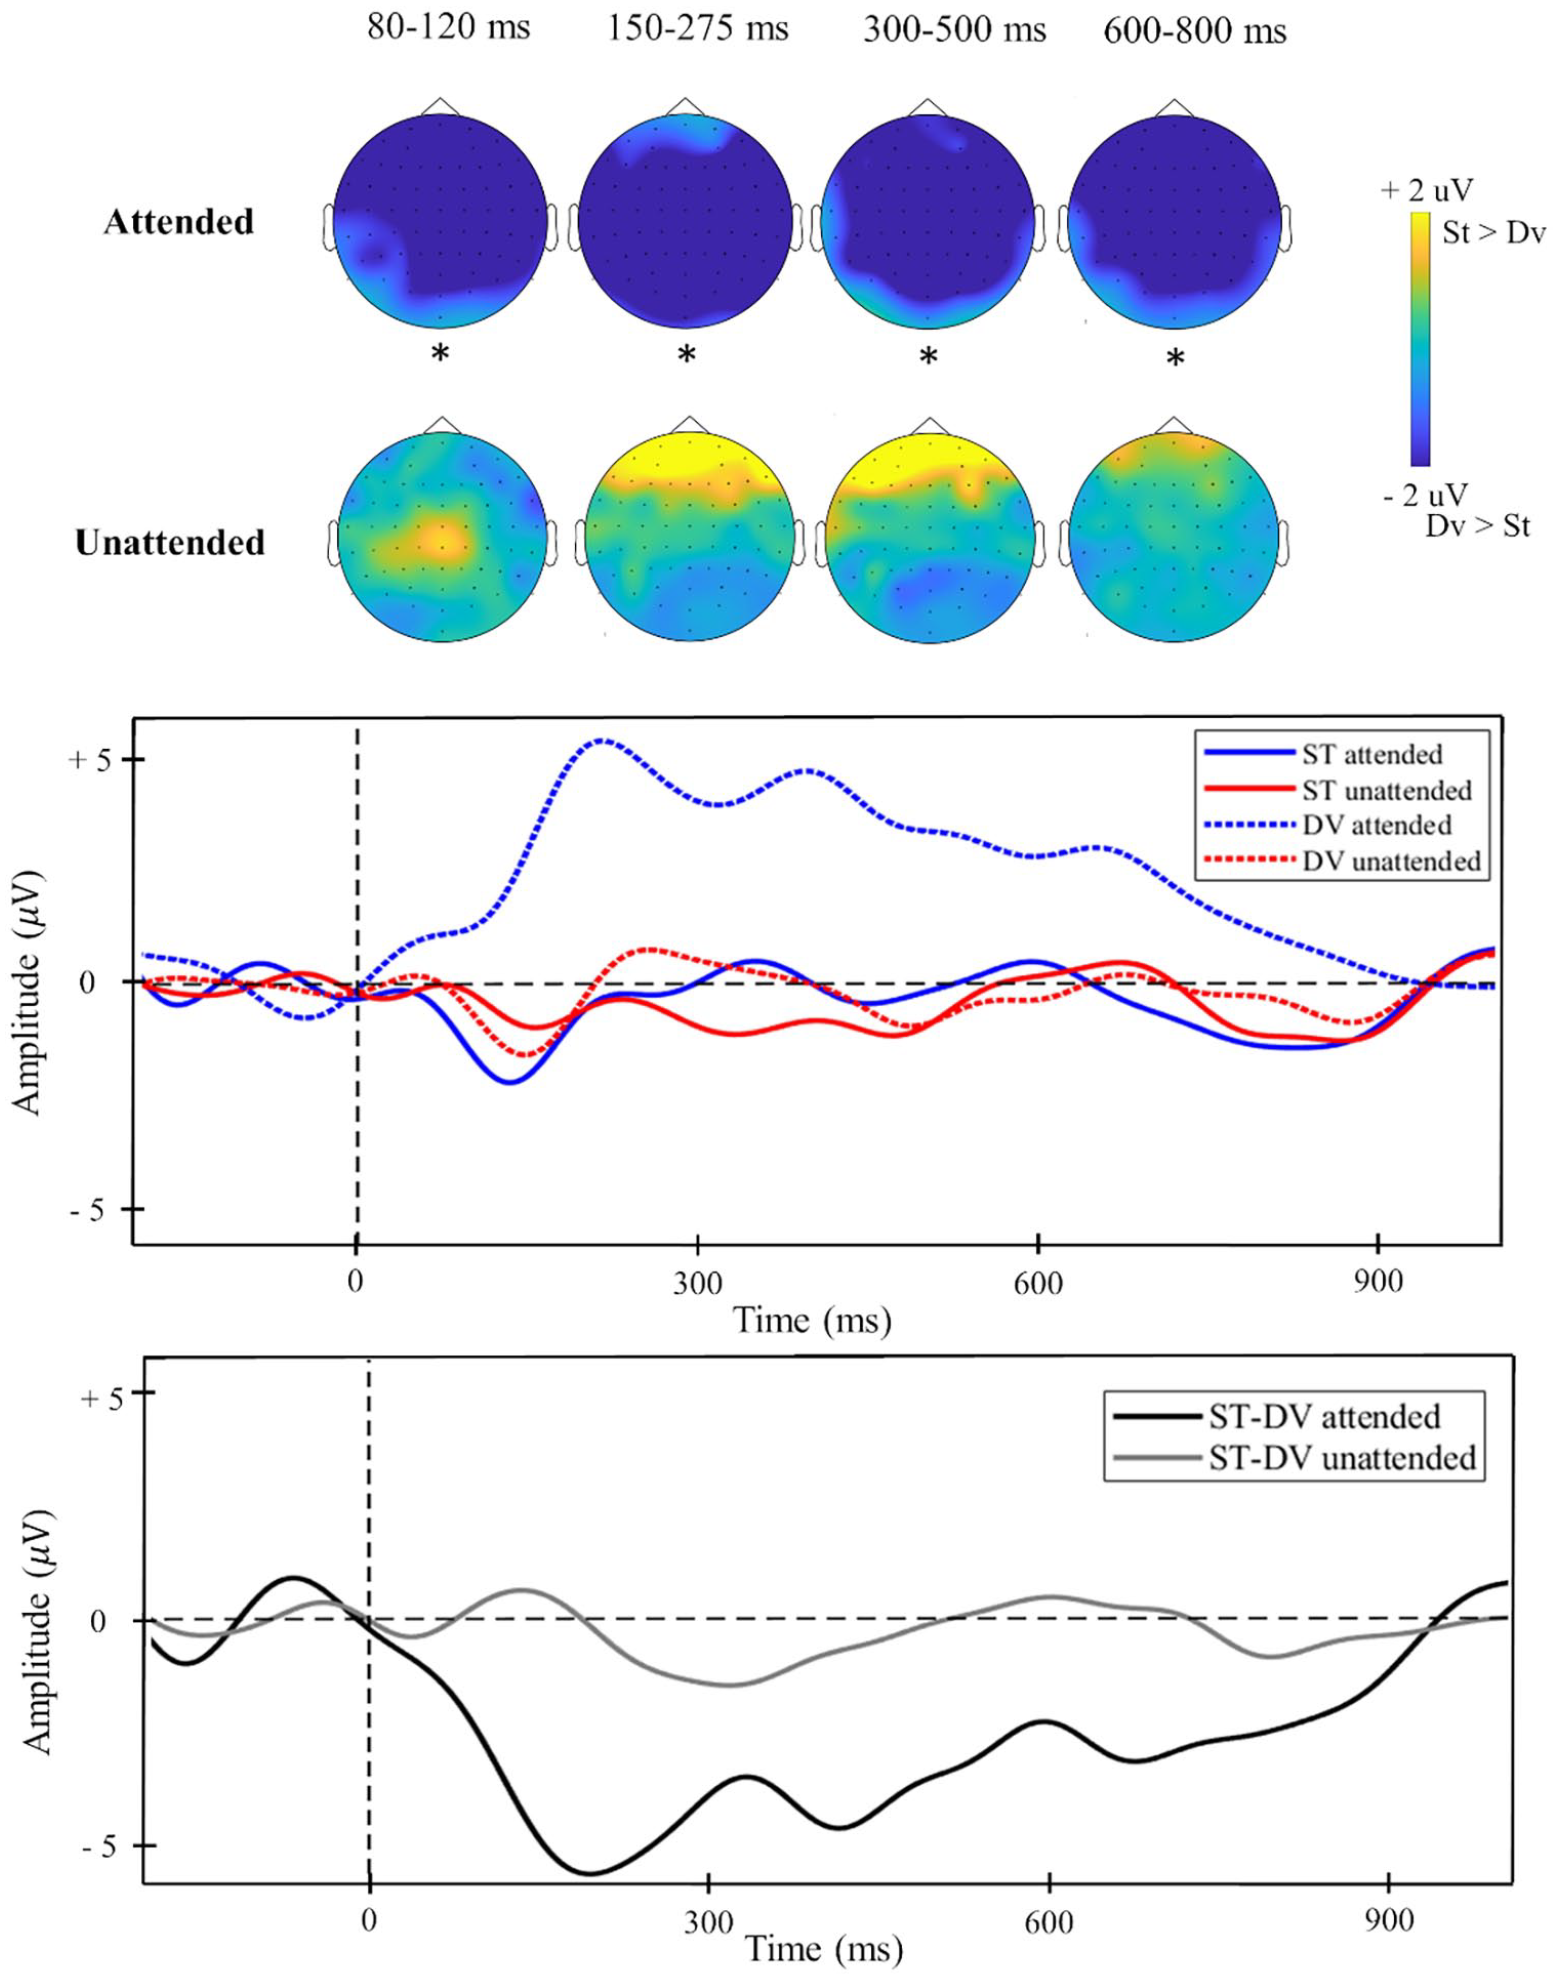
Structural meter processing: pre-attentive and attentive at early stages
Time Window 1 (80–120 ms, P1, Figure 4): as shown in Table 1, interactions engaging Attention × Stimulus Type were nonsignificant. The main effect of stimulus type was compatible with an attention-independent increased P1 component for meter violations.
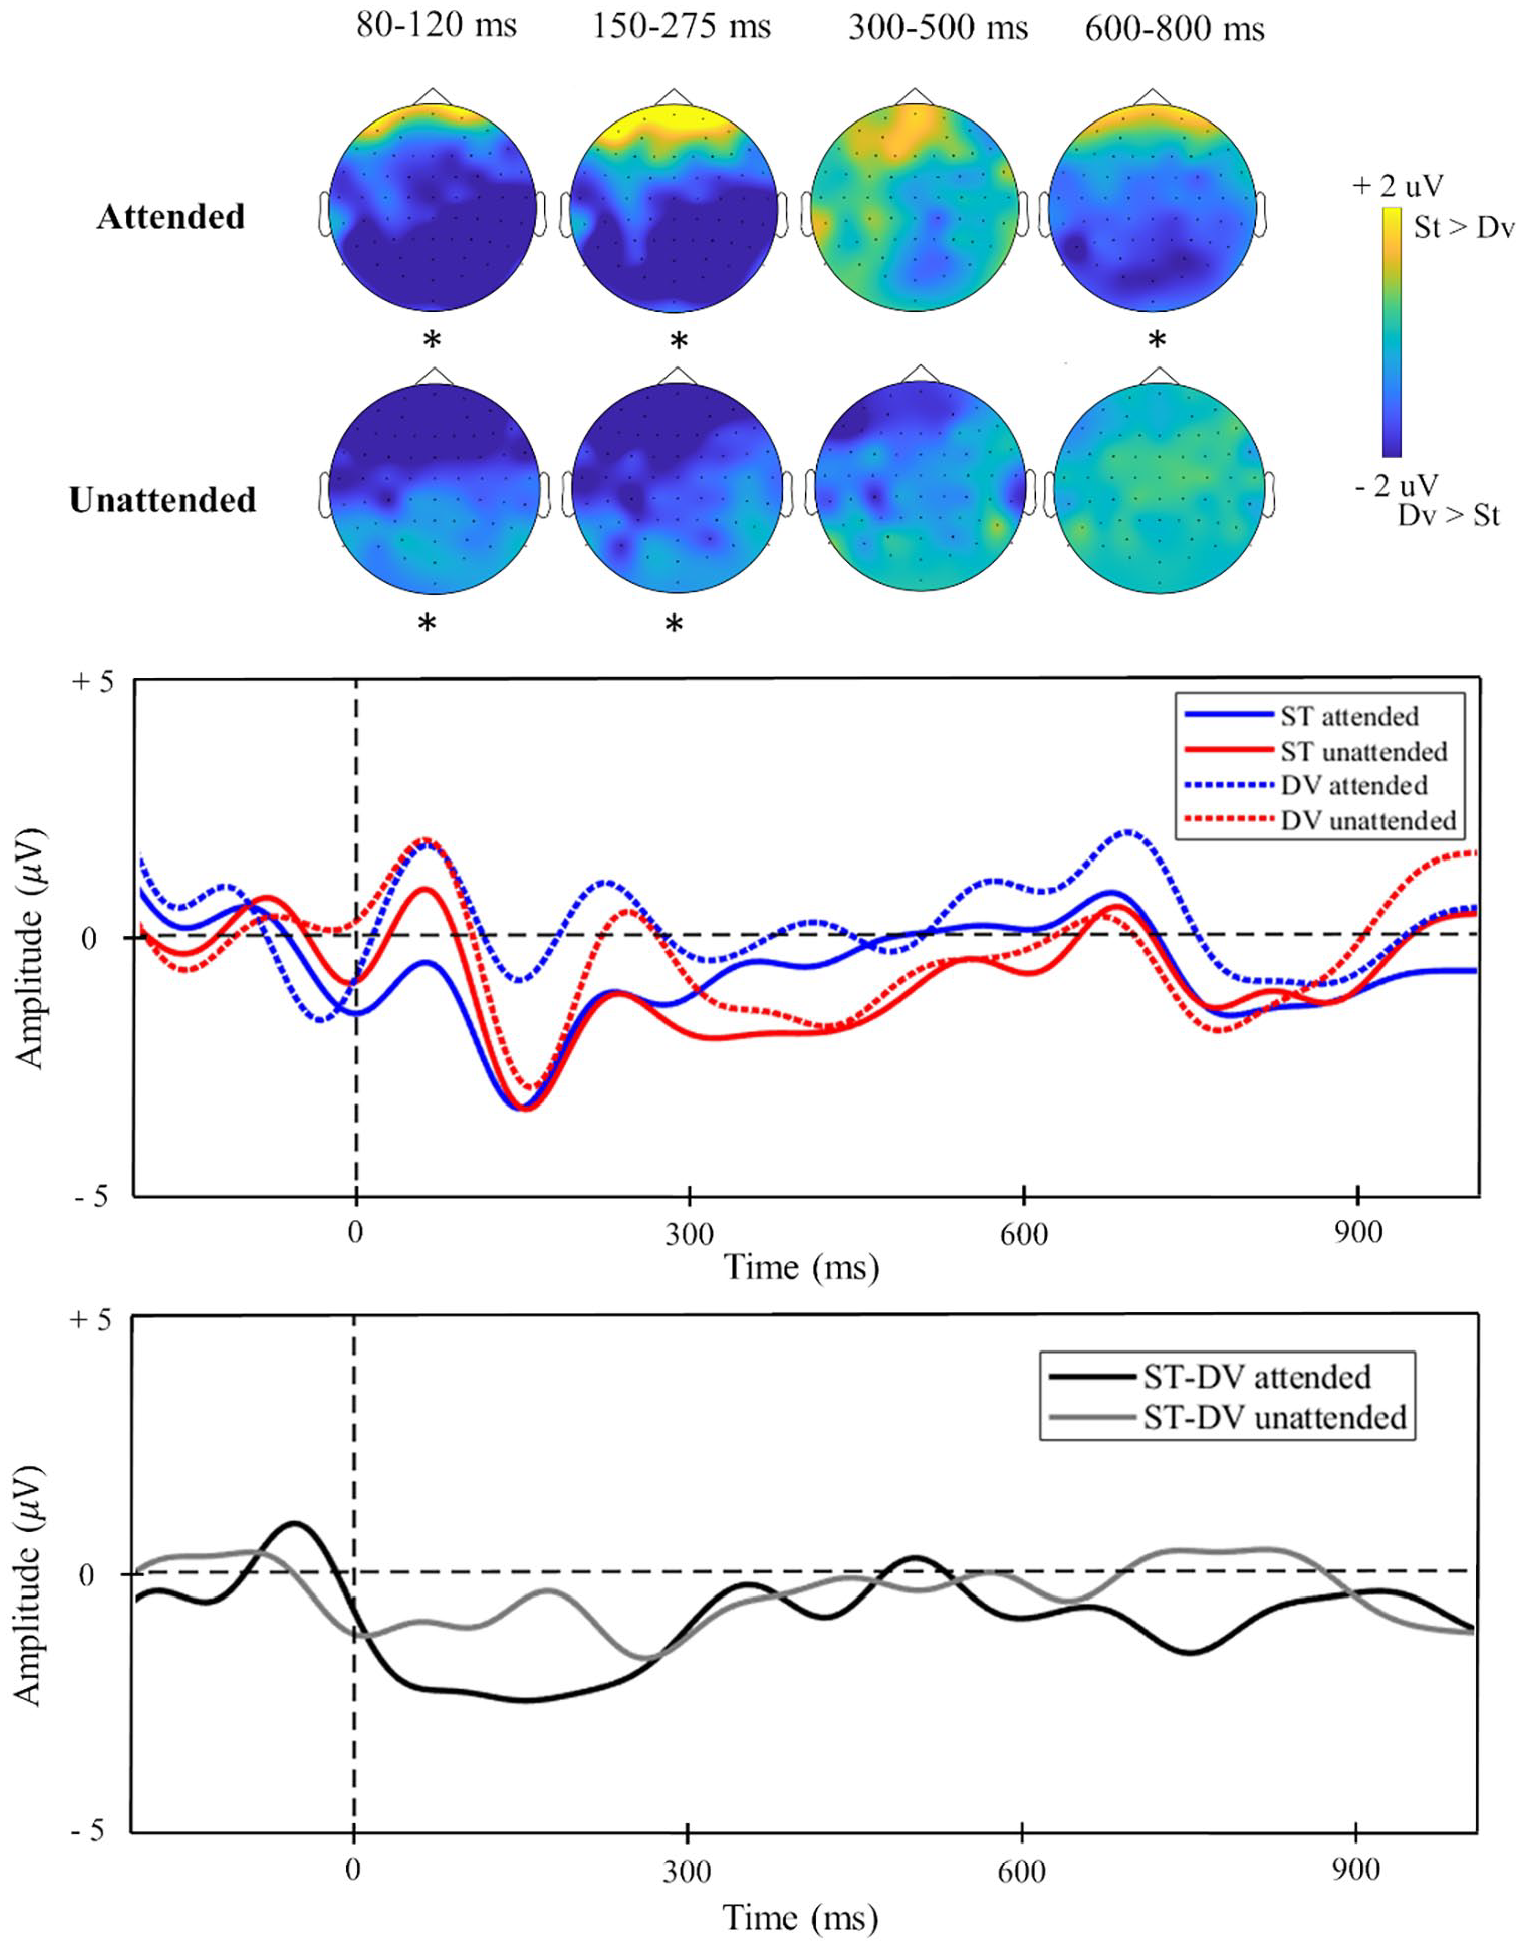
Topographic Maps (Top) and Demonstrative Waveform (Middle) for Structural Meter Processing Under Attended and Unattended Conditions. The Bottom Waveform Displays the Corresponding Difference Waves (Standard-Deviant) for Attended Versus Unattended. In Topographic Maps, Darker Shades Represent Positive Standard-Deviant Values (Increased Negativity for Beat Violations) and Lighter Shades Negative Values (Increased Positivity for Beat Violations). Asterisks Below the Topographic Maps Represent Significant Standard (ST)-Deviant (DV) Differences. In Waveforms, Dark Lines Refer to Attended Conditions and Lighter Lines to Unattended. Right Central Region Electrodes Were Selected.
Time Window 2 (150–275 ms, P2): As shown in Table 2, attention-dependent stimulus-type effects were null, but local attention-independent effects could be observed: breaking the significant Stimulus Type × Caudality × Laterality interaction into individual regions showed stimulus-type effects for right central, F (1, 21) = 5.23, p = .033,
Time Window 3 (300–500 ms, P3): As illustrated in Table 3, no relevant effects emerged in this time window, hinting that P3 may not be an appropriate component for indexing structural meter processing.
Time Window 4 (600–800 ms, P600): Breaking the Attention × Stimulus Type × Caudality interaction (Table 4) into the three caudality levels, no significant Attention × Stimulus Type emerged for anterior electrodes, p = .88,
Overview: Pre-attentive processing of structural meter was present at earlier time windows, but absent between 600 and 800 ms. Between 300 and 500 ms, neither attentive nor pre-attentive processing signatures were observed. Analyses of correct trials only (Appendix B in Supplementary Materials online) showed the same pattern of results. Complementary analyses based on 300-ms time windows for comparison with Silva and Castro (2019) showed marginal attention-independent effects for 0 to 300 and 300 to 600 ms (without Attention × Stimulus Type interactions), and significant attention-dependent effects (attentive only) between 600 and 900 ms (Appendix C in Supplementary Materials online). Note that Silva and Castro’s (2019) analysis was restricted to the 0 to 300 and 300 to 600 ms time windows, with results showing attention-independent processing between 0 and 300 ms and pre-attentive-only processing between 300 and 600 ms.
Surface meter processing: attentive-only in all time windows
Time Window 1 (80–120 ms, P1, Figure 5): Breaking down the significant Attention × Stimulus Type interaction (Table 1), we saw a significant stimulus-type effect in the attended condition across the whole scalp increased positivity for deviants: F(1, 21) = 6.37, p = .02,
Topographic Maps (Top) and Demonstrative Waveform (Middle) for Surface Meter Processing Under Attended and Unattended Conditions. The Bottom Waveform Displays the Corresponding Difference Waves (Standard-Deviant) for Attended vs. Unattended. In Topographic Maps, Darker Shades Represent Positive Standard-Deviant Values (Increased Negativity for Beat Violations) and Lighter Shades (Increased Positivity for Beat Violations). Asterisks Below the Topographic Maps Represent Significant Standard (ST)-Deviant (DV) Differences. In Waveforms, Dark Lines Refer to Attended Conditions and Lighter Lines to Unattended. The Middle Posterior Region Was Considered.
Time Window 2 (150–275 ms, P2): The significant Attention × Stimulus Type interaction (Table 2) indicated significant stimulus-type effects (increased positivity for deviants) across the whole scalp for attended, F(1, 21) = 8.72, p = .008,
Time Window 3 (300–500 ms, P3): Following the Attention × Stimulus Type interaction (Table 3), the unattended condition showed nonsignificant stimulus-effects, p = .53,
TW 4 (600–800 ms, P600): Following the significant Attention × Stimulus Type interaction, we saw increased positivity for deviants across the whole scalp in the attended condition, F(1, 21) = 21.75, p < .001,
Overview: Pre-attentive processing was not recruited for surface meter in any time window. Analyses of correct trials only (Appendix B in Supplementary Materials online) showed the same pattern of results. Complementary analyses based on 300 ms segments (Appendix D in Supplementary Materials online) also showed the same pattern of results, with attention-dependent processing in all time windows.
Attention effects according to behavioral performance
To cross-test the hypothesis that increased cognitive demand goes along with increased pre-attentive processing, we added d′ (high vs. low) to the analysis of time windows where pre-attentive processing was observed. This included the P1 and P2 time windows in structural meter processing (Figure 6).
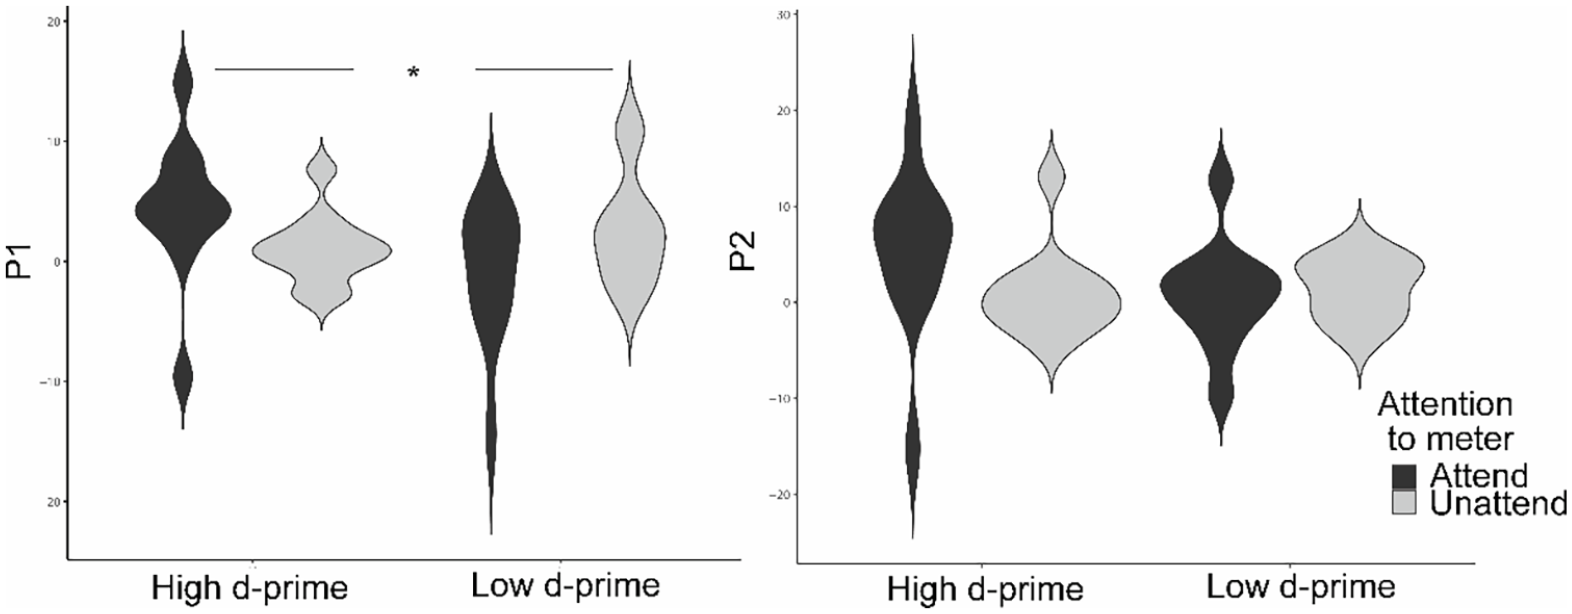
Attentive Versus Pre-attentive Processing of Structural Meter in Low Versus High d′ Participants. For the P1 Time Window, High d′ Participants Rely on Attentive Processing and Low d′ on Pre-attentive Processing. The P2 Time Window Shows the Same Pattern, Although Differences Did Not Reach Significance. The Width of Shapes Represents the Approximate Frequency of Data Points in Each Region.
For the P1 time window, we found a significant Attention × Stimulus Type × d′ interaction, F(1, 21) = 6.77, p = .017,
For the P2 time window, attentive and pre-attentive processing at right central, right posterior and middle posterior regions, the Attention × Stimulus Type × d′ interaction did not reach significance, p = .243,
In sum, cross-tests comparing low and high d′ participants strengthened the idea that structural meter requires more pre-attentive processing than surface meter.
Discussion
In the present study, we tested the hypothesis that structural meter engages more pre-attentive processing than surface meter due to increased abstraction and we found converging evidence in favor of it. First, behavioral results showed that surface meter is easier to process then structural meter, thus strengthening the idea that surface meter requires less abstraction. Second, EEG results showed that pre-attentive processing is not engaged in surface meter processing, but it exists in the earlier stages of structural meter processing. Third, when both attentive and pre-attentive processing were present, participants with lower behavioral discrimination (increased difficulty in dealing with meter processing) relied mostly on pre-attentive processing, while high-performing individuals did the opposite. Four and final, comparisons between the present EEG results and those of Silva and Castro (2019) highlight that Silva and Castro obtained lower behavioral performances (d′ = 0.49, against 2.05 in the current study), and this lower performance co-occurred with increased reliance on pre-attentive processing (pre-attentive only, while we had both attentive and pre-attentive in similar time windows). Altogether, these findings converge on the idea that cognitive demand goes along with reliance on pre-attentive processing of meter.
Despite the observed differences in attention patterns for structural versus surface meter, the ERP components that marked the processing of both temporal structures were rather similar: in both, we found increased positivity for deviants between 80 and 120 ms (a first positive peak, P1) and between 150 and 275 ms (second positive peak, P2). These peaks were attention-independent for structural meter and attentive only for surface meter. Increased P1 and P2 components have been reported in response to temporal irregularities (Neuhaus & Knösche, 2006), consistent with our findings. Also in both structural and surface meter, we found a late positive peak between 600 and 800 ms, larger for deviants, and resembling the P600 (Friederici, 2002; Hagoort & Brown, 2000). This component was attentive-only in both cases. The P600 has been related to syntactic-like violations—not only in speech, but also in music (e.g., irregular chord sequences, see Friederici, 2002)—namely, as an index of revision and integration following deviance detection. It is possible that this component reflects participants’ revision and integration of the deviant meter cycle (the 7/8 m cycle) in the 3/4 cycle context. Another possibility is that the positive peak reflected the onset of the next beat (second beat of third bar). In the 300 to 500 ms time window, a third positive peak—again increased for deviants—was apparent in structural as well as surface meter processing (P3), but it was significant only for surface meter (attentive-only processing).
The results we obtained for structural meter are in line with Silva and Castro’s (2019) study, where pre-attentive processing was observed between 0 and 600 ms. One difference regards the fact that Silva and Castro found pre-attentive-only processing between 300 and 600 ms, while here processing was both attentive and pre-attentive. As pointed out above, this would be consistent with Silva and Castro having engaged participants in detecting three different types of meter deviance and, thus, the task was more demanding than the current one. Behavioral results confirmed this, in that d′ values in Silva and Castro were considerably lower than in the present study. Concerning the present results on surface meter (attentive only), they are in line with those from Geiser et al. (2009), but at odds with several other studies that found pre-attentive processing in surface meter (Bouwer et al., 2014, 2016; Vuust et al., 2009; Winkler et al., 2009; Zhao et al., 2017). The reason for this divergence may be that several of these studies used sound omissions instead of sound additions as markers of deviance (Bouwer et al., 2014, 2016; Winkler et al., 2009). This may have induced different processes, namely something closer to meter as temporal orientation, guiding listeners attention to the presence versus absence of a target event. The similarity with Geiser et al.’s (2009) results makes sense given the identical paradigms, based on sound additions creating meter deviants. Future research could compare the two types of surface meter deviances—omissions versus additions—to test whether using sound omissions increases pre-attentive processing due to the induction of processes related to meter as temporal orientation.
We interpreted the increased presence of pre-attentive processing in structural meter compared with surface meter as an indicator that increased cognitive load (here, increased abstraction) recruits pre-attentive processing. Although this reading is consistent with other pieces of evidence (see above), we cannot exclude alternative explanations. One that pops out from behavioral results is the possibility that surface meter captures participants’ attention more strongly, even when they are asked not to pay attention to temporal information: we saw increased pitch discrimination in surface than in structural meter, raising the possibility that participants were less able to ignore temporal information in surface than in structural meter. Could this mean that the increased pre-attentive processing we saw in structural meter was due to participants’ increased ability to ignore meter, rather than to the increased cognitive load imposed by structural meter? One argument against this possibility is that, despite the poorer pitch discrimination in surface meter, participants still performed well above chance. Therefore, they were able to focus their attention on pitch. Moreover, we can look at differences in pitch discrimination as additional evidence for our main hypothesis: structural meter imposes greater cognitive demand, it is preferably processed pre-attentively, and thus it frees attentive mechanisms to focus on the pitch deviant detection task. Testing the “easier to ignore” versus the “harder to process” hypotheses on structural meter remains a challenge for future research.
Supplemental Material
sj-docx-1-pom-10.1177_03057356221129323 – Supplemental material for Meter without rhythmic pattern repetitions increases pre-attentive processing
Supplemental material, sj-docx-1-pom-10.1177_03057356221129323 for Meter without rhythmic pattern repetitions increases pre-attentive processing by Rui Gomes, Regina Abreu and Susana Silva in Psychology of Music
Footnotes
Acknowledgements
The authors are grateful to Svetlana Postarnak and Ana Raquel Moutinho for help with data collection, and to São Luís Castro for support in recruiting participants.
Author contributions
S.S. conceptualized the study. R.G. and R.A. created the stimulus set and collected the data. R.G., R.A., and S.S. analyzed the data. R.G. wrote the first draft of the manuscript. S.S. revised the manuscript and supervised the research. All authors contributed to the article and approved the submitted version.
Declaration of conflicting interests
The author(s) declared no potential conflicts of interest with respect to the research, authorship, and/or publication of this article.
Funding
The author(s) disclosed receipt of the following financial support for the research, authorship, and/or publication of this article: This work was funded by the Portuguese Foundation for Science and Technology (FCT UIDB/00050/2020, PTDC/PSI-GER/5845/2020).
Data availability statement
Supplemental material
Supplemental material for this article is available online.
References
Supplementary Material
Please find the following supplemental material available below.
For Open Access articles published under a Creative Commons License, all supplemental material carries the same license as the article it is associated with.
For non-Open Access articles published, all supplemental material carries a non-exclusive license, and permission requests for re-use of supplemental material or any part of supplemental material shall be sent directly to the copyright owner as specified in the copyright notice associated with the article.