
Abstract
X-ray computed tomography (XCT) has been utilised to investigate the porosity structure of slag films in the steel continuous casting. This study explores the efficacy of the XCT technique in characterising and identifying porosity within slag films, including comparisons between vertical XCT slices and images from traditional 2D methods. The results of 3D visualisation reveal that higher porosity on the mould side is not consistent across all slag films, thereby challenging existing beliefs. It has also been observed that the distributions of pore locations vary across different slag films, correlating with their porosity levels. In slag films with low porosity, pores predominantly appear on the sides, whereas, in those with higher porosity, they are distributed throughout. Analysis of pore sizes across various slag films indicates that, although smaller pores are numerous, larger pores significantly contribute to the overall porosity. This research in-depth explored the internal pore structure in slag film via XCT technique, offering insights for optimising slag film design and improving steel casting processes.
Introduction
The global crude steel production in 2022 was 1884.2 million tonnes (Mt), 96.8% of which was cast using continuous casting technology. 1 The success of steel continuous casting can be attributed to the performance of the casting powder that is added to the top of the mould, creating a liquid slag pool as it is heated, and forming a slag film between the water-cooled copper mould and the hot steel shell during its passage down the mould. 2 The slag film controls the horizontal heat transfer from the steel shell to the mould to prevent surface quality defects (e.g. cracks, depressions and deep oscillation marks) and ensure productivity (e.g. faster casting and near-net shape casting).3–5 Therefore, the properties of the slag film, particularly its porosity, play a crucial role in heat transfer efficiency and the surface quality of the cast steel.6–8 In specific, a higher level of porosity typically leads to lower thermal conductivity, as air or gas pockets within the slag film act as insulators, reducing the rate of heat transfer. 6 This variation in heat transfer directly influences the solidification of the steel, affecting its microstructure and consequently its mechanical properties and surface quality. Moreover, apart from the heat transfer efficiency, the porosity also plays a critical role on the mechanical stability of slag film. A highly porous slag may have reduced structural integrity, impacting its ability to form a consistent and effective barrier between the hot steel shell and the mould. This can lead to irregularities in heat transfer and potentially compromise the surface quality of the steel. Therefore, it is crucial to control the porosity of the slag film during casting. Prior to that, an accurate estimation of the porosity within the slag film is of great importance.
Traditional methods to calculate the porosity of slag film include optical microscopy (OM) 9 and scanning electron microscopy (SEM).10,11 Those methods typically provide the morphology and distribution of pores in two dimensions (2D), and fall short in offering a complete, three-dimensional (3D) understanding of the porosity within the film. For instance, what appears as spherical pores in 2D might be columnar in 3D; similarly, small voids identified in 2D could be parts of an interconnected channel throughout the slag film. This discrepancy between 2D and 3D representations can lead to misunderstandings about the actual pore size and shape within the slag film.
Given the significance of pore size and shape in determining thermal conductivity, a 3D examination of the pore structure in the slag film is essential. This is where X-ray computed tomography (XCT) comes into play, which allows for non-destructive reconstruction of the 3D internal structure of objects without any prior preparation.12–15 Over recent decades, XCT has been widely used and demonstrated its efficiency in characterising aspects such as pore shape, size distribution, pore type (open vs. closed) and pore volume (% porosity) in a diverse range of porous materials, such as concrete and cement,16–19 metallic foams20,21 and porous graphite.22,23 However, the application of XCT for investigating mould slag film remains notably underexplored in literatures.
In this work, XCT has been utilised for the first time to study the internal porosity structure of slag film. The objectives are to explore the effectiveness of the XCT technique in characterising porosity in steel continuous casting slag film, and to achieve a comprehensive study of the internal porosity structure of the slag film. To this end, five commercial slag films with varying porosities were analysed. Comparisons have been made between the traditional methods (OM and SEM) and XCT in pore identification. Additionally, 3D visualisation of the internal pore structure has been conducted, with in-depth analysis on the porosity location and size distributions across the slag film.
Experiments and methods
Sample preparation
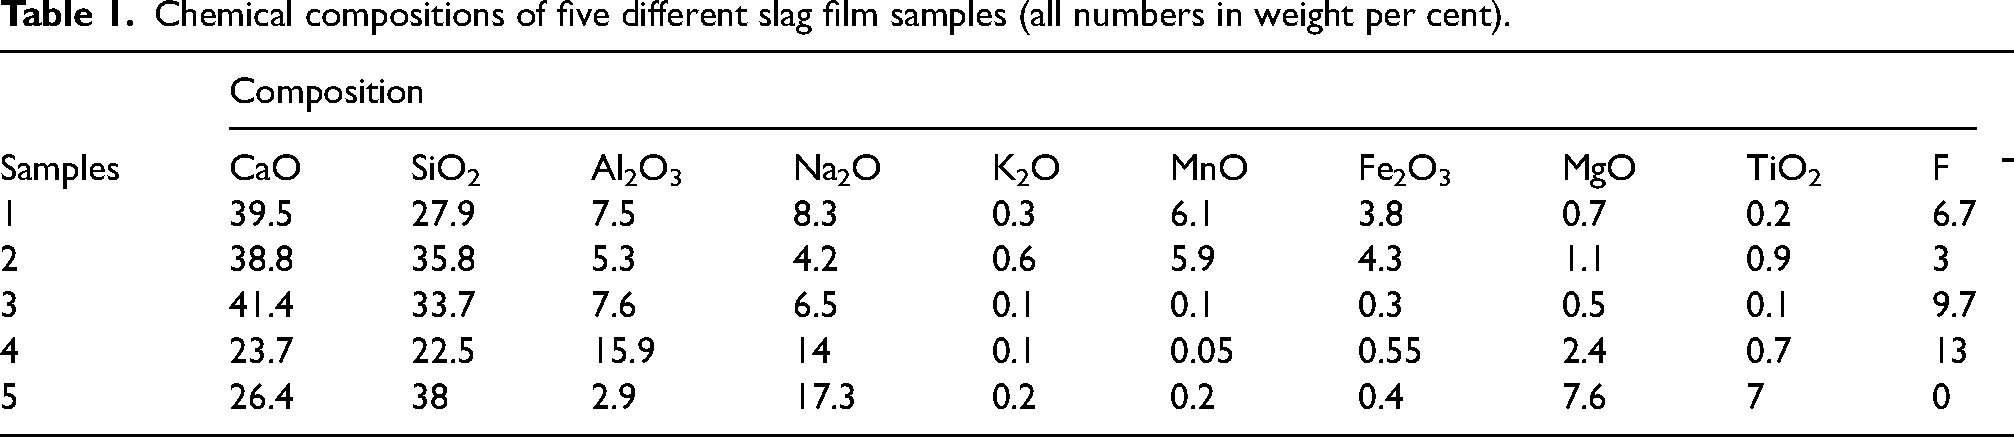
Five commercial slag films with varying porosities were collected from industrial continuous casting moulds, representing a variety of steel grades investigated. Slag sample 1 was taken from a bloom caster for casting an 316L stainless steel, slag sample 2 was collected from a billet caster for casting a low carbon alloy steel, slag sample 3 was extracted from a slab caster for casting a peritectic steel grade, and slag samples 4 and 5 were taken from a pilot slab caster for casting a high aluminium steel grade in the end of two casting sequences using mould powders 4 and 5, respectively. In the end of casting one steel grade, the steel level in the mould goes down which leaves the rim and part of the slag films exposed to air. Then the well-trained operator quickly took a piece of slag film stuck to the mould using a small shovel. This fast sampling and cooling afterwards ensure the slag films taken keep its porosity as it is in the mould during sampling. The chemical compositions of those slag films were determined by X-ray fluorescence, and the results were presented in Table 1. The obtained slag films were processed into square shape, measuring around 10 mm in length and 1–4.5 mm in thickness, using a precision cut-off machine. These specimens were then cold mounted in polyester resin, positioning their cross-sections downward, to prepare for grinding and polishing. The grinding process involved the use of silicon carbide papers with progressively finer grit sizes. For polishing, diamond suspension and colloidal silica were employed, achieving a final surface finish of approximately 0.25 μm.
Chemical compositions of five different slag film samples (all numbers in weight per cent).
Characterisations
Both optical microscopy (OM, Keyence, VHX7000) and scanning electron microscopy (SEM, Zeiss Sigma) were used to characterise the cross-sectional morphology of slag films. The obtained images were utilised to determine the porosity of slag film by an image analysis method. The actual field of view of the digital optical microscope was 2.0–10.0 mm. Since the OM aims to provide an overview of the morphology of the slag films, the magnification of the OM images was chosen as ×50. The SEM images were captured from the identical polished cross-section of the slag film that was previously examined under OM. To ensure detailed analysis, the SEM images were taken at magnifications of ×300, providing a more refined view of the slag film's structure compared to the OM examination. Image analysis was conducted on both OM and SEM micrographs by ImageJ software, 24 to calculate the porosity. For each sample, the OM image at a magnification of ×50 and the SEM image at a magnification of ×300 were used for image analysis.
X-ray microcomputed tomography (X-ray CT, TESCAN UniTOM XL) was used to explore the pore distribution in three dimensions. A lab-based X-ray CT scanner, operated at an accelerating energy of 80 kV that generated a polychromatic X-ray beam, was used to collect the results. The characterised slag films were in square shape, with around 10 mm in length and 1–4.5 mm in thickness. Each tomographic scan encompassed a total of 3083 projections obtained over a 360° rotation, each with an exposure time of 230 ms. A ×10 magnification optical lens was integrated post-scintillator in the system. The resulting reconstructed slices yielded an effective voxel size of (6.8 µm)3. Image processing, including filtering to reduce the noise level in the XCT virtual slices, segmentation to pick out voxels for the pores and quantification of the pores’ size and spatial distributions, were performed using Avizo software version 2020. 25
Results and discussion
OM and SEM image analysis
Figure 1 presents the OM images of five different slag films at ×50 magnification, in which only the relatively large pores, particularly those exceeding 50 μm in diameter, are clearly visible (inset of Figure 1(b)). This limitation might lead to an underestimation of total porosity, as it can cause smaller pores undetected in the OM analysis. To provide detailed insights within the slag film, the SEM images of five slag films at ×300 magnifications are shown in Figure 2. The inset image displays the low-magnification SEM image of each slag film, showcasing the measured region with a white rectangle. Compared to the OM images, the SEM images can achieve clearer visualisation of small pores (diameter below 50 µm), while they are less effective at displaying larger pores (diameter above 200 µm), as shown in Figure 2(e).
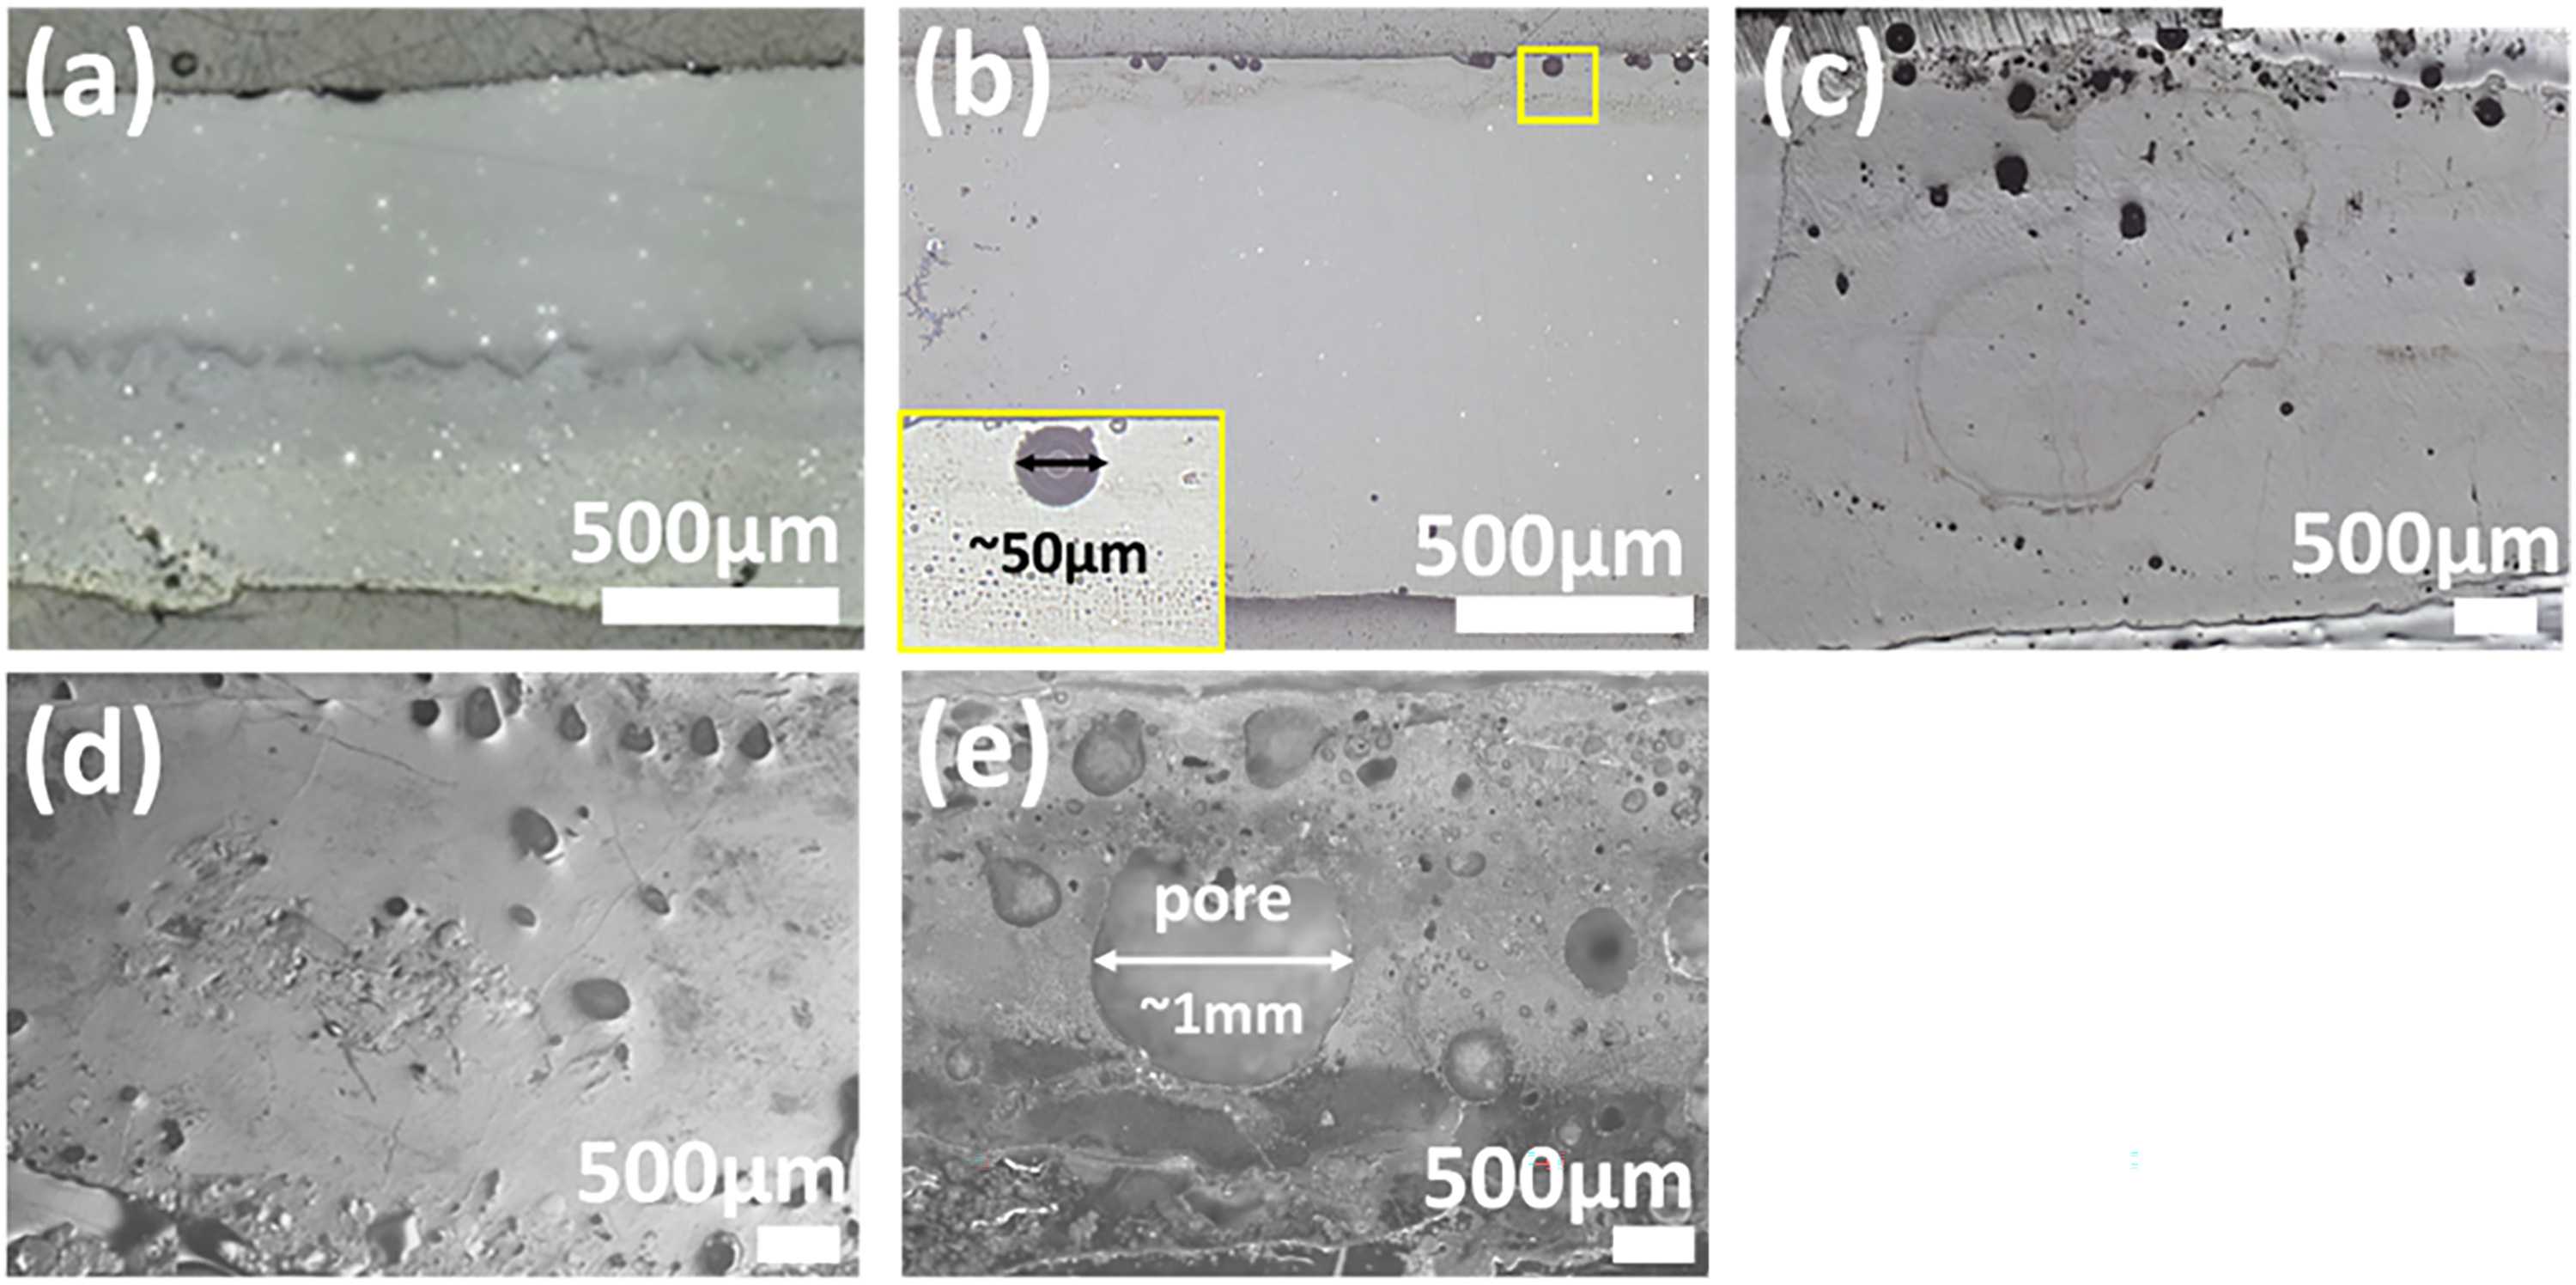
OM images of the cross-section of slag films. (a–e) Samples 1–5. The inset in image (b) presents a magnified view of image (b), with the area of interest highlighted by a yellow rectangle.
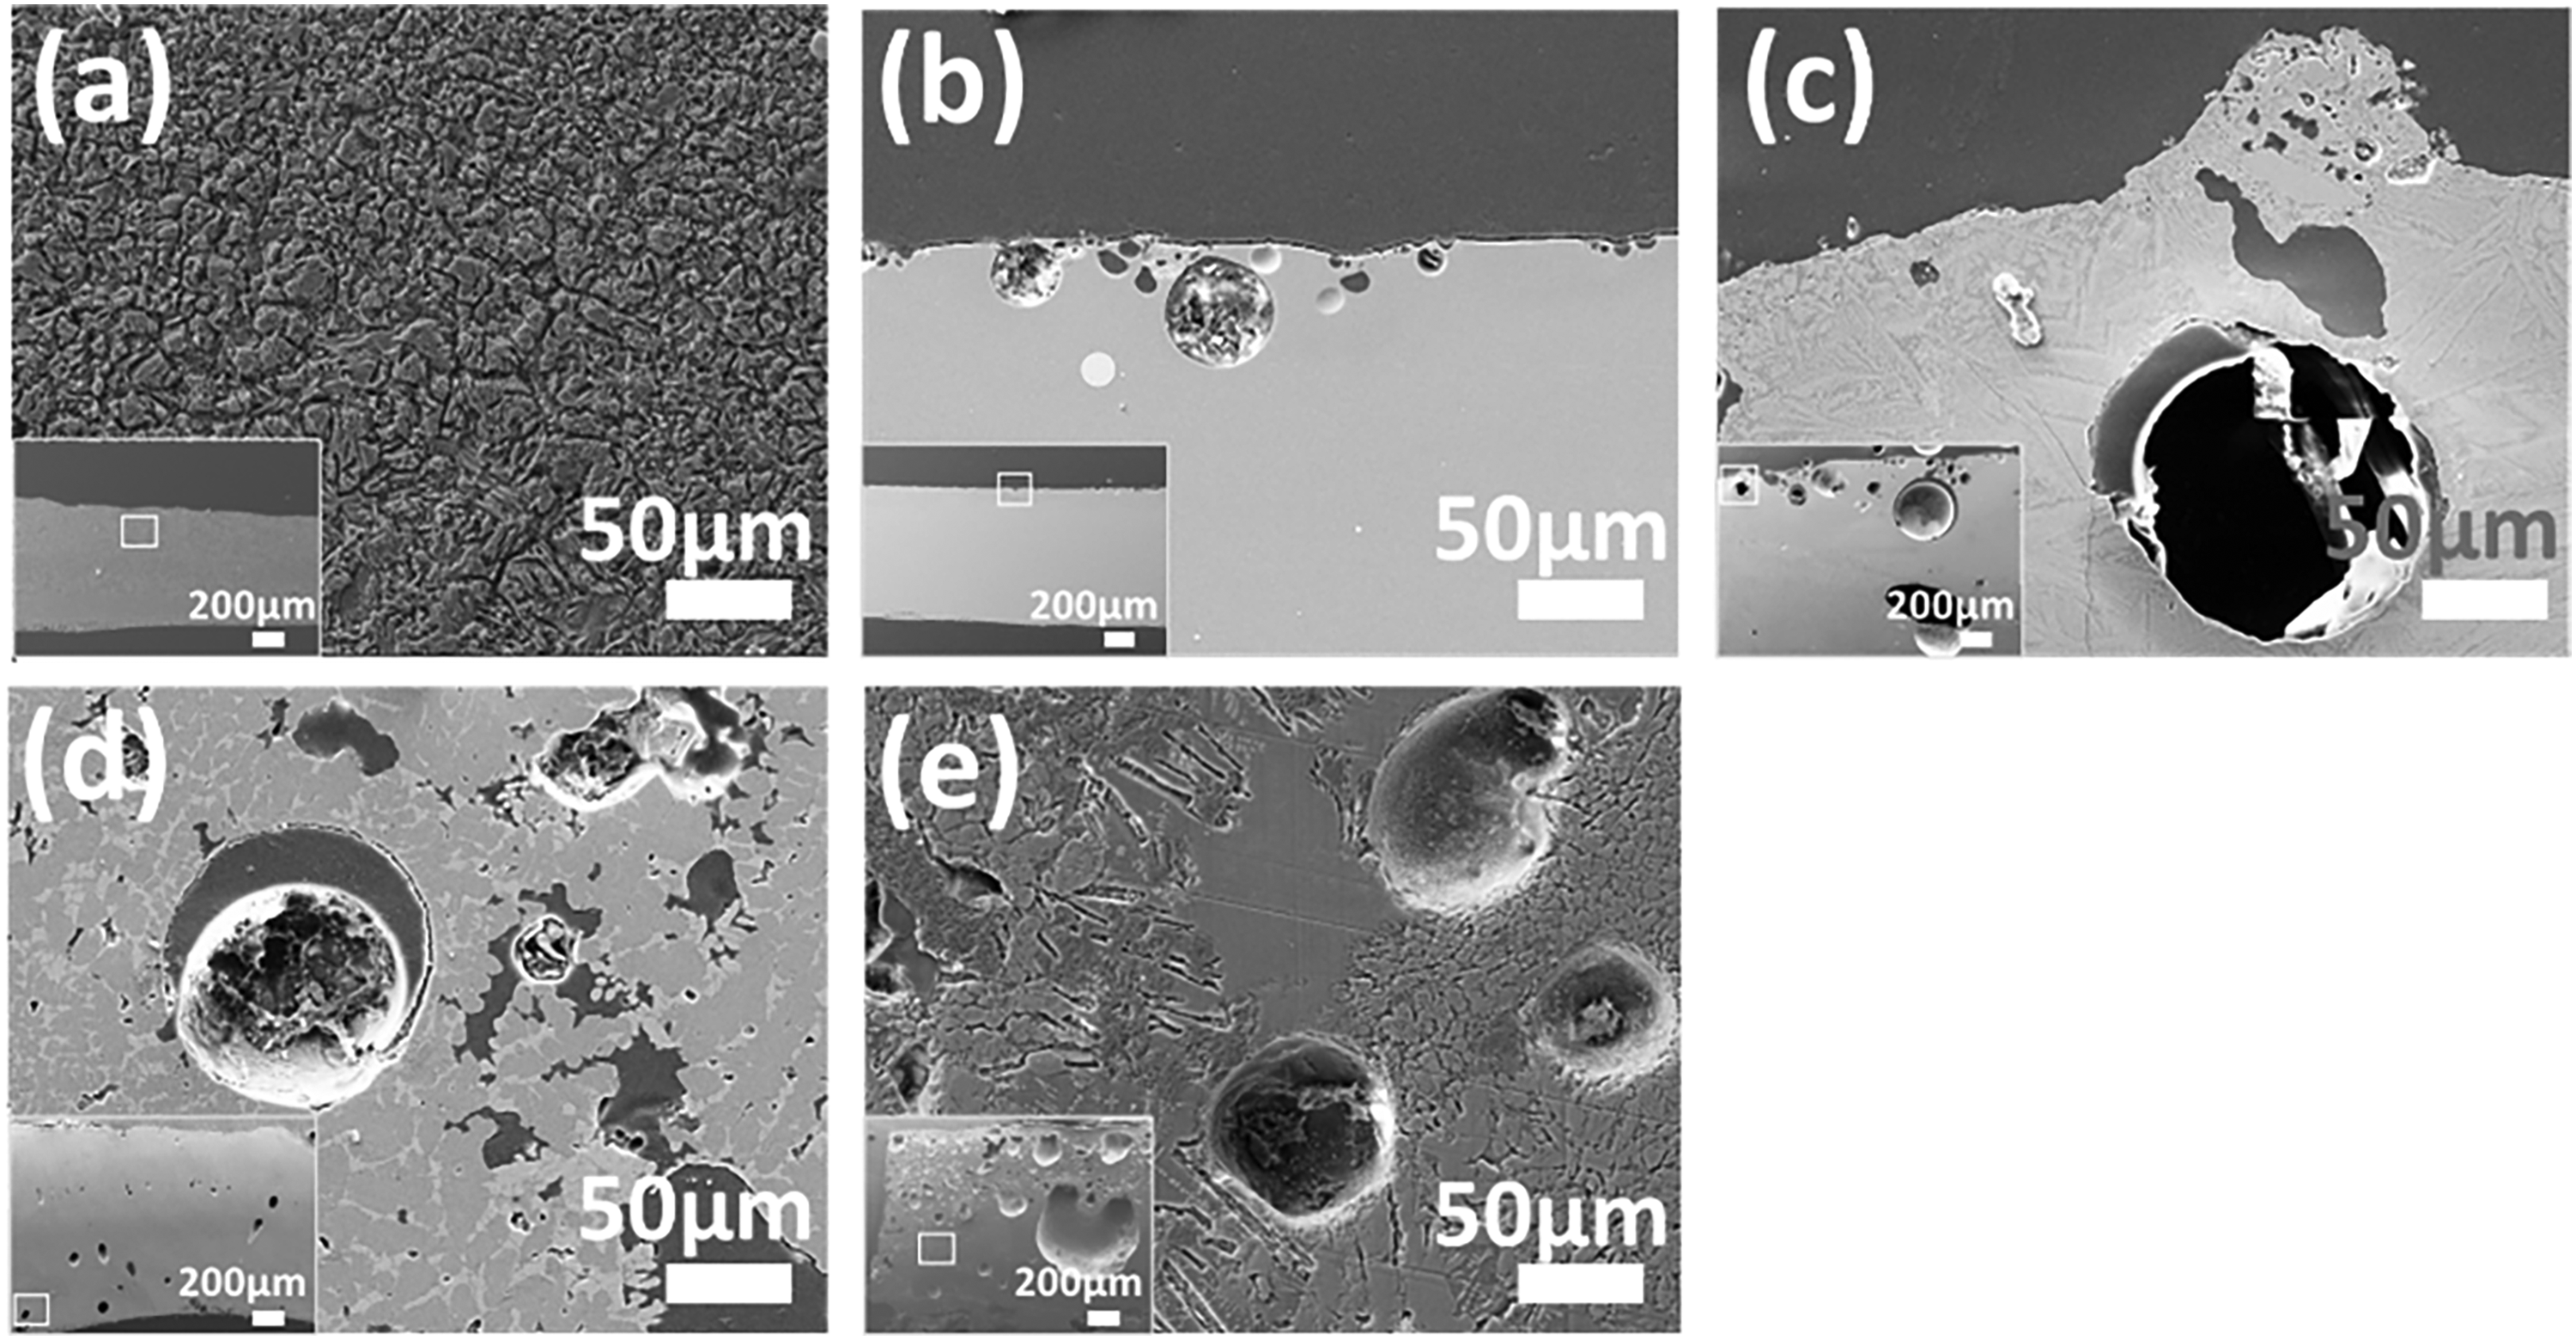
SEM images of the cross-section of slag films. (a–e) Samples 1–5. Each image includes an inset providing an overview of the slag film, with the area analysed by SEM indicated by a white rectangle.
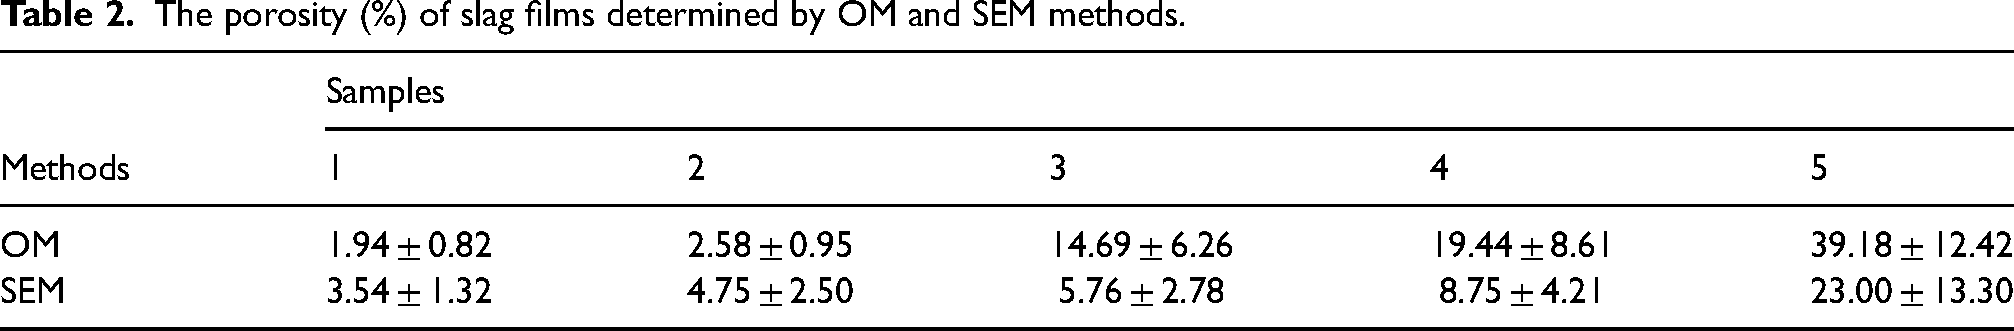
Image analysis was employed to obtain the porosity of slag film, with the process illustrated in Figure 3. Both original OM and SEM images (Figure 3(A) and (B)) were converted into binary black-and-white images (Figure 3(a) and (b)) using ImageJ software, 24 in which the black pixels indicate defects, while white pixels represent dense material. The porosity was determined by dividing the area occupied by these defects by the total area of the image. For each sample, at least 15 images were randomly taken from the cross-section of the slag film, and the results are shown in Table 2. It can be found that the five slag films follow a consistent sequence in porosity levels across both OM and SEM methods: Sample 1 < Sample 2 < Sample 3 < Sample 4 < Sample 5. However, discrepancy exists in the porosity obtained by OM and SEM methods: for low-porosity samples (Samples 1 and 2), the OM image shows lower porosity than SEM image, while for high-porosity samples (Samples 3, 4 and 5), the OM image displays higher porosity than SEM images. This discrepancy is mainly because the OM and SEM images are captured at different magnifications, which allows them to specialise in characterising pores of varying sizes. Additionally, both OM and SEM are 2D surface-based techniques, requiring sample preparation process such as polishing and grinding. The sample preparation process could potentially damage the porous structure of the slag film, leading to inaccurate evaluations of its porosity. Moreover, the porosity measured from 2D planes may differ from those in three dimensions (3D).
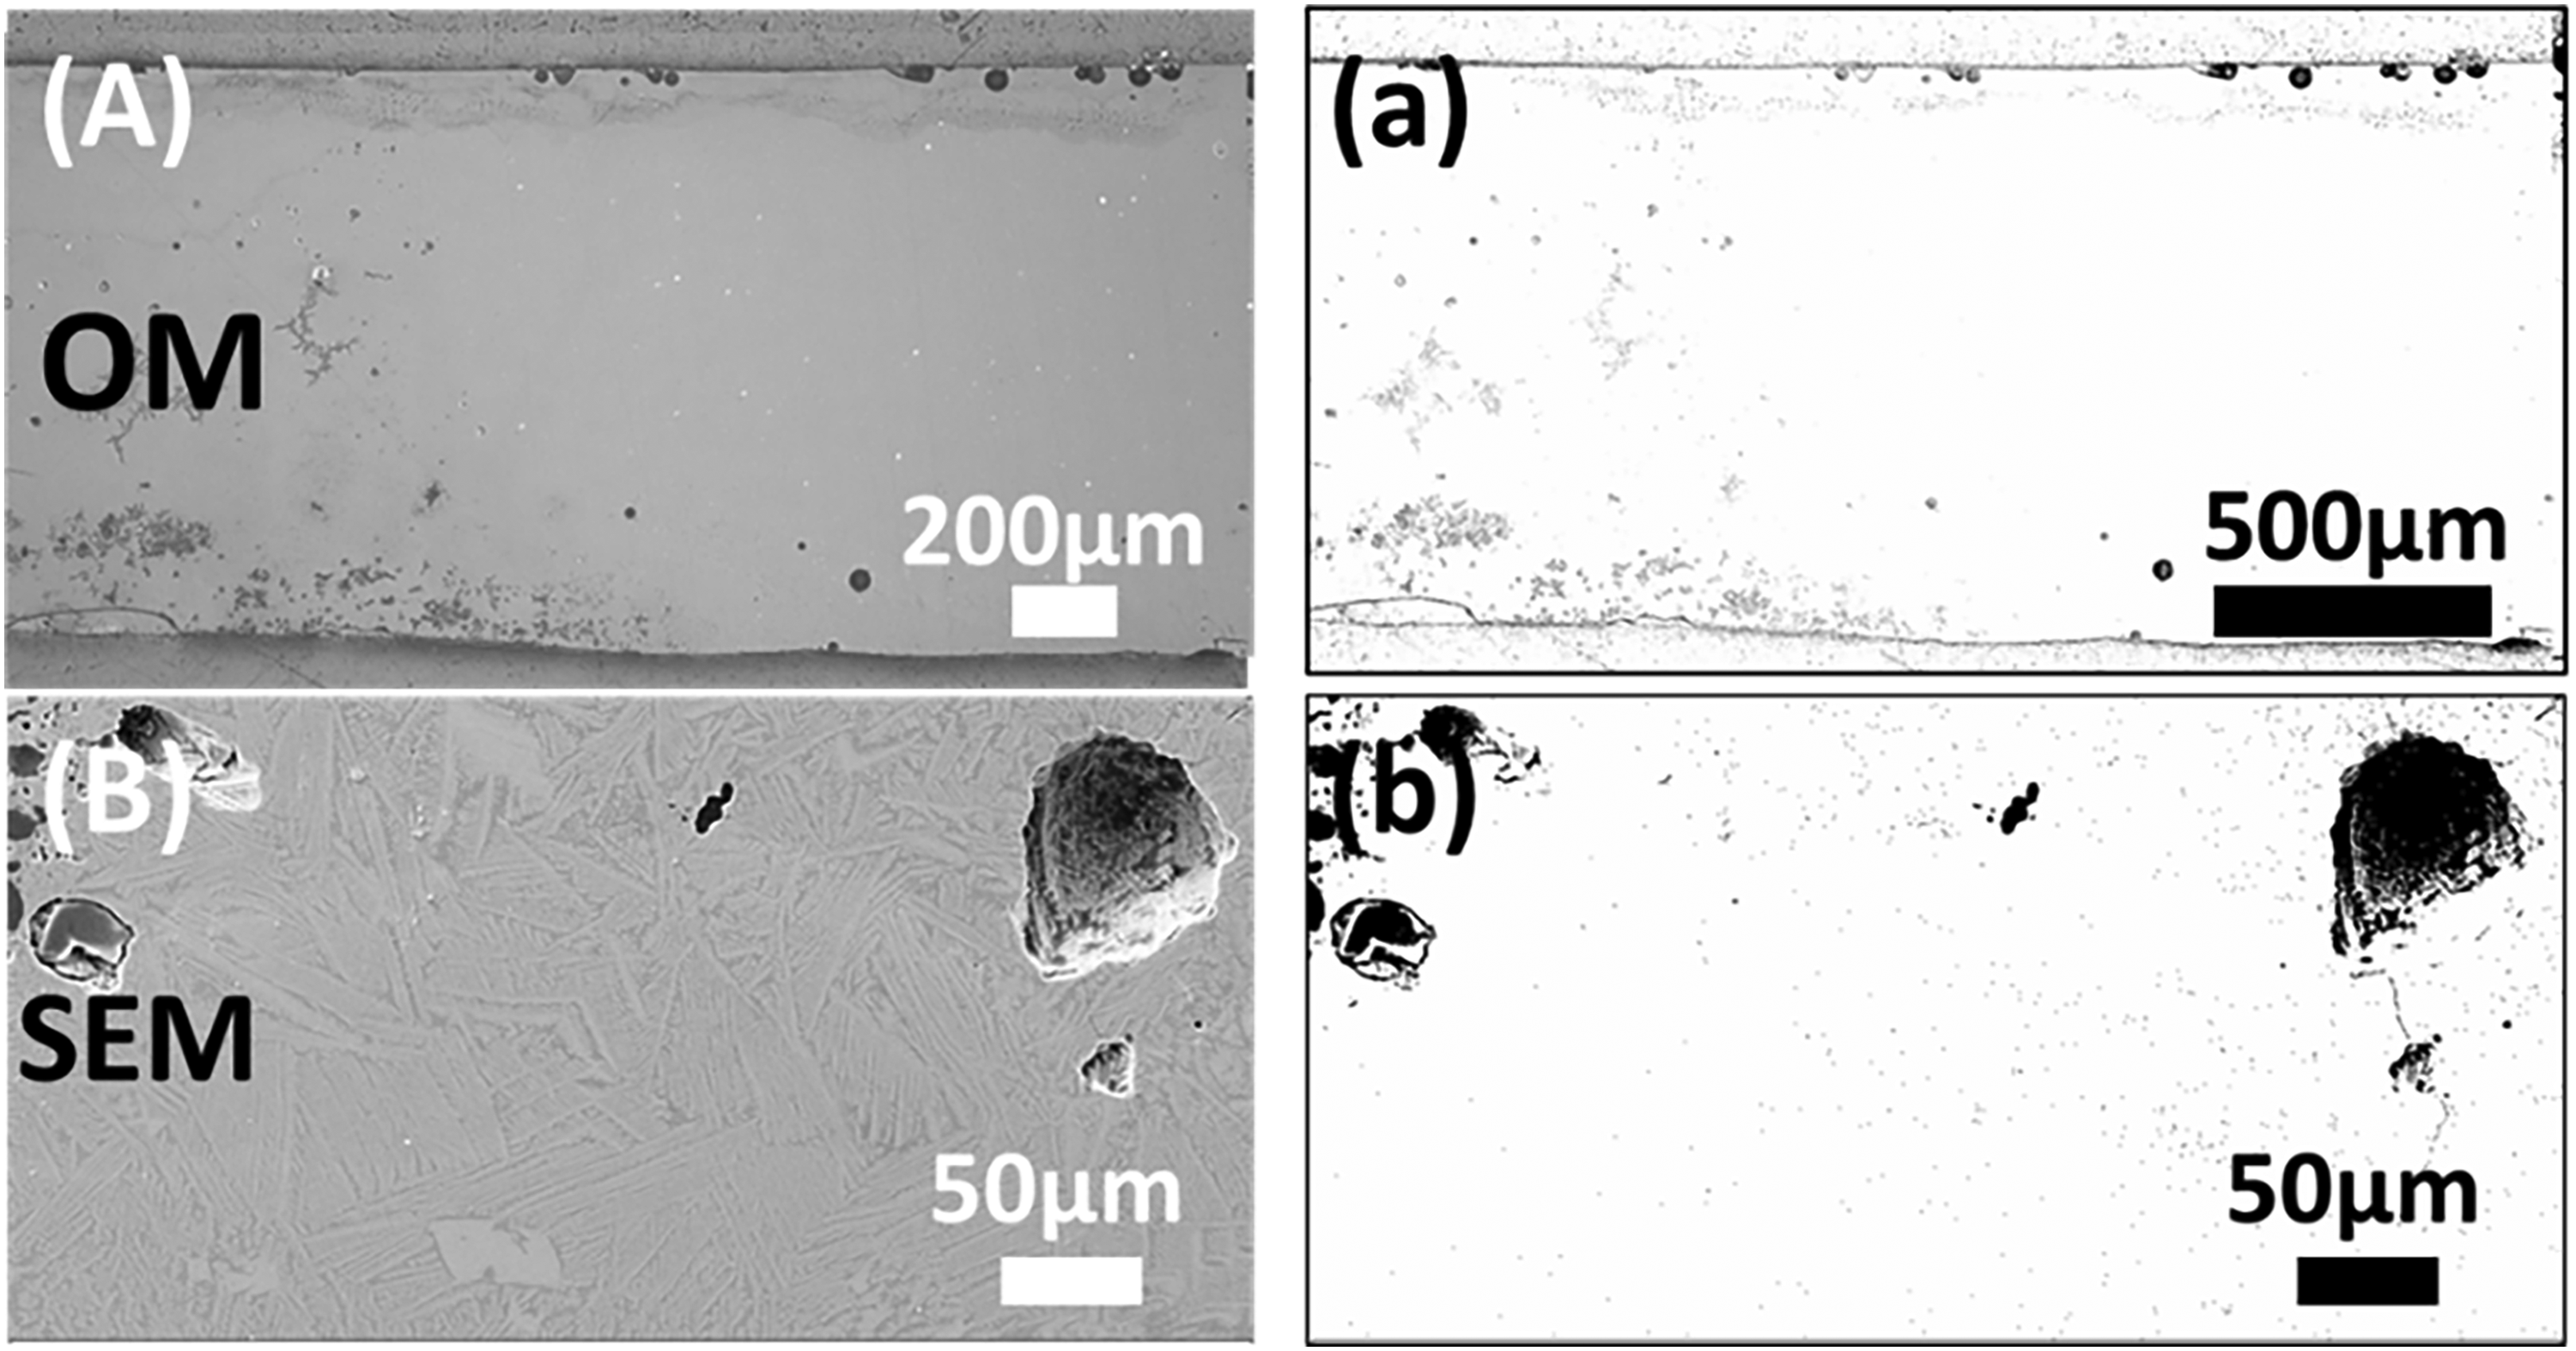
Illustration of the image analysis process of the (A, a) OM images (×50 magnification), and (B, b) SEM images (×300 magnification).
The porosity (%) of slag films determined by OM and SEM methods.
XCT analysis
2D porosity analysis on virtual slices
Prior to examining the pores within the slag films in 3D, it's essential to evaluate the effectiveness of the XCT method in pore characterisation. Therefore, the 2D virtual slices, serving as the building blocks for 3D reconstruction in XCT, have been analysed and compared with results from SEM and OM micrograph analysis.
Figure 4 presents the virtual slices of five different slag films. Since our focus is on the pore distribution in the thickness plane of the slag film, the displayed virtual slices were extracted from the cross-section of the slag film as illustrated in the inset image. These slices were taken from the same plane (x–y plane) as used for OM and SEM imaging, although the exact locations of the slices are different. This ensures a consistent comparative analysis across the three techniques (OM, SEM and XCT). Pores within these virtual slices are clearly visible. Compared to the OM and SEM images, the distinction between porosity and solid areas is more evident in the virtual slice, as determined by the principle of XCT, which primarily relies on density differences within the sample to generate images.
Virtual slices of five different slag films, extracted from the x–y plane as illustrated in the inset of image. (a–e) Samples 1–5.
Grey value-based thresholding segmentation within Avizo software was utilised for pore identification, with an example of the result displayed in Figure 5. Sample 3 has been selected as the representative slag film to display the results of pore identification, due to its intermediate level of porosity among the five slag films. Figure 5(a) presents the 3D volume rendering of Sample 3, with perspectives from the cross-section (x–y plane). The virtual slices from different position of Sample 3 are presented in Figure 5(b) and (c), with their segmentation results. Overall, the identified pores, marked in bule in the segmented images, closely match those observed in the virtual slices. In contrast to OM method, pores smaller than 50 μm but larger than 20 μm in diameter can be clearly characterised and identified from the virtual slices, as shown in Figure 5(d1) and (d2). Additionally, instead of extracting porosity from a specific plane, the porosity obtained through XCT are derived from the entirety of the slag block, encompassing contributions from a diverse range of pore sizes ranging from approximately 20 μm up to the millimetre scale (Figure 5(d2) and (e)). From above, it can be concluded that the XCT technique proves efficient in characterising and identifying pores within slag films. In addition, it provides a more comprehensive evaluation of the porosity within the slag film, in comparison to the OM and SEM methods.
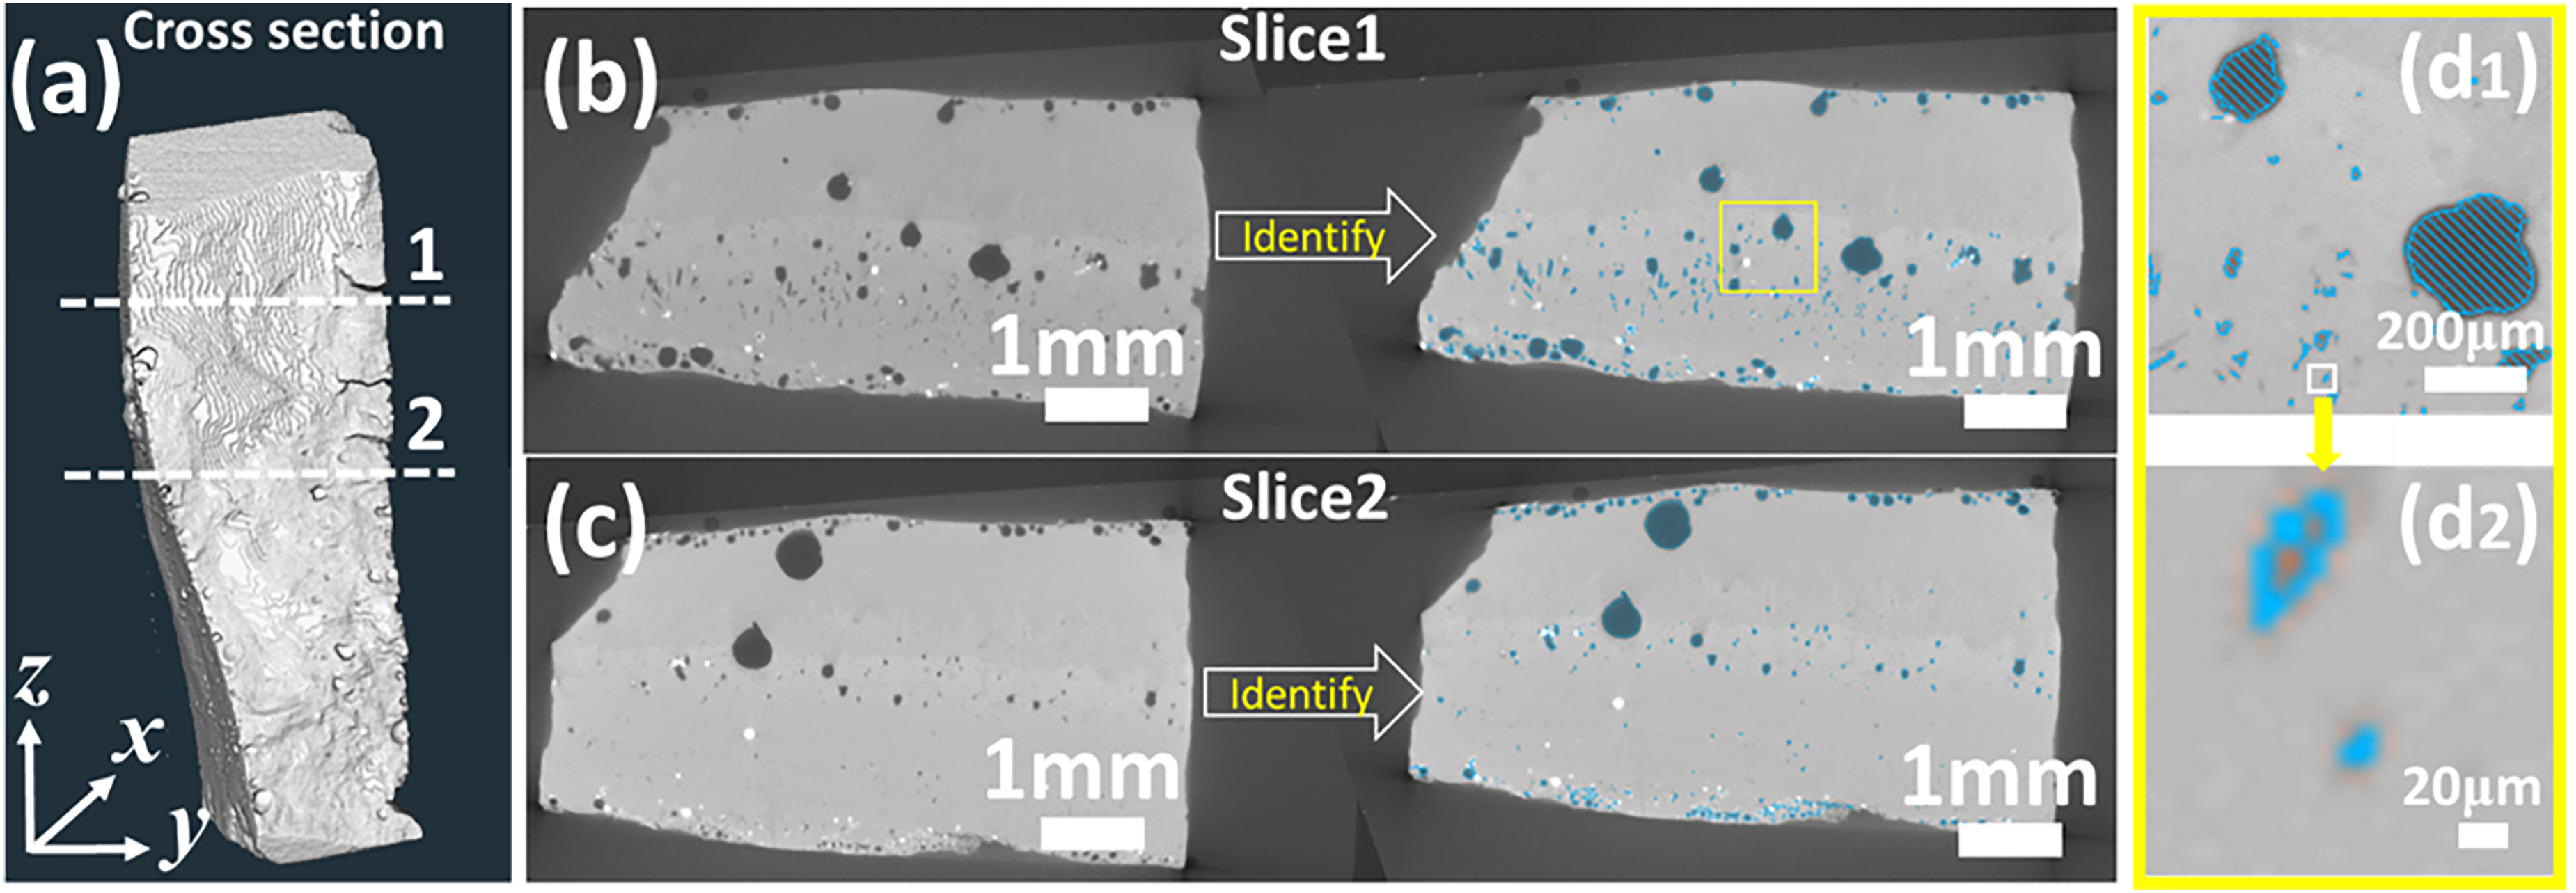
The X-ray CT results of Sample 3 (a) volume rendering viewed from the cross-section of Sample 3, (b) virtual slice (1) taken from the x–y plane of Sample 3, with its segmentation results showing identified pores marked in blue. (c) virtual slice (2) taken from the x–y plane of Sample 3, with its segmentation results showing identified pores marked in blue. The positions of slice (1) and (2) are marked by white dot lines in image (a); (d1) zoomed-in image of the region of interest (RoI) in image (b), as marked by a yellow rectangle; (d2) zoomed-in image of the interested region in image (d1), as marked by a white rectangle.
3D visualisation and quantification of pores
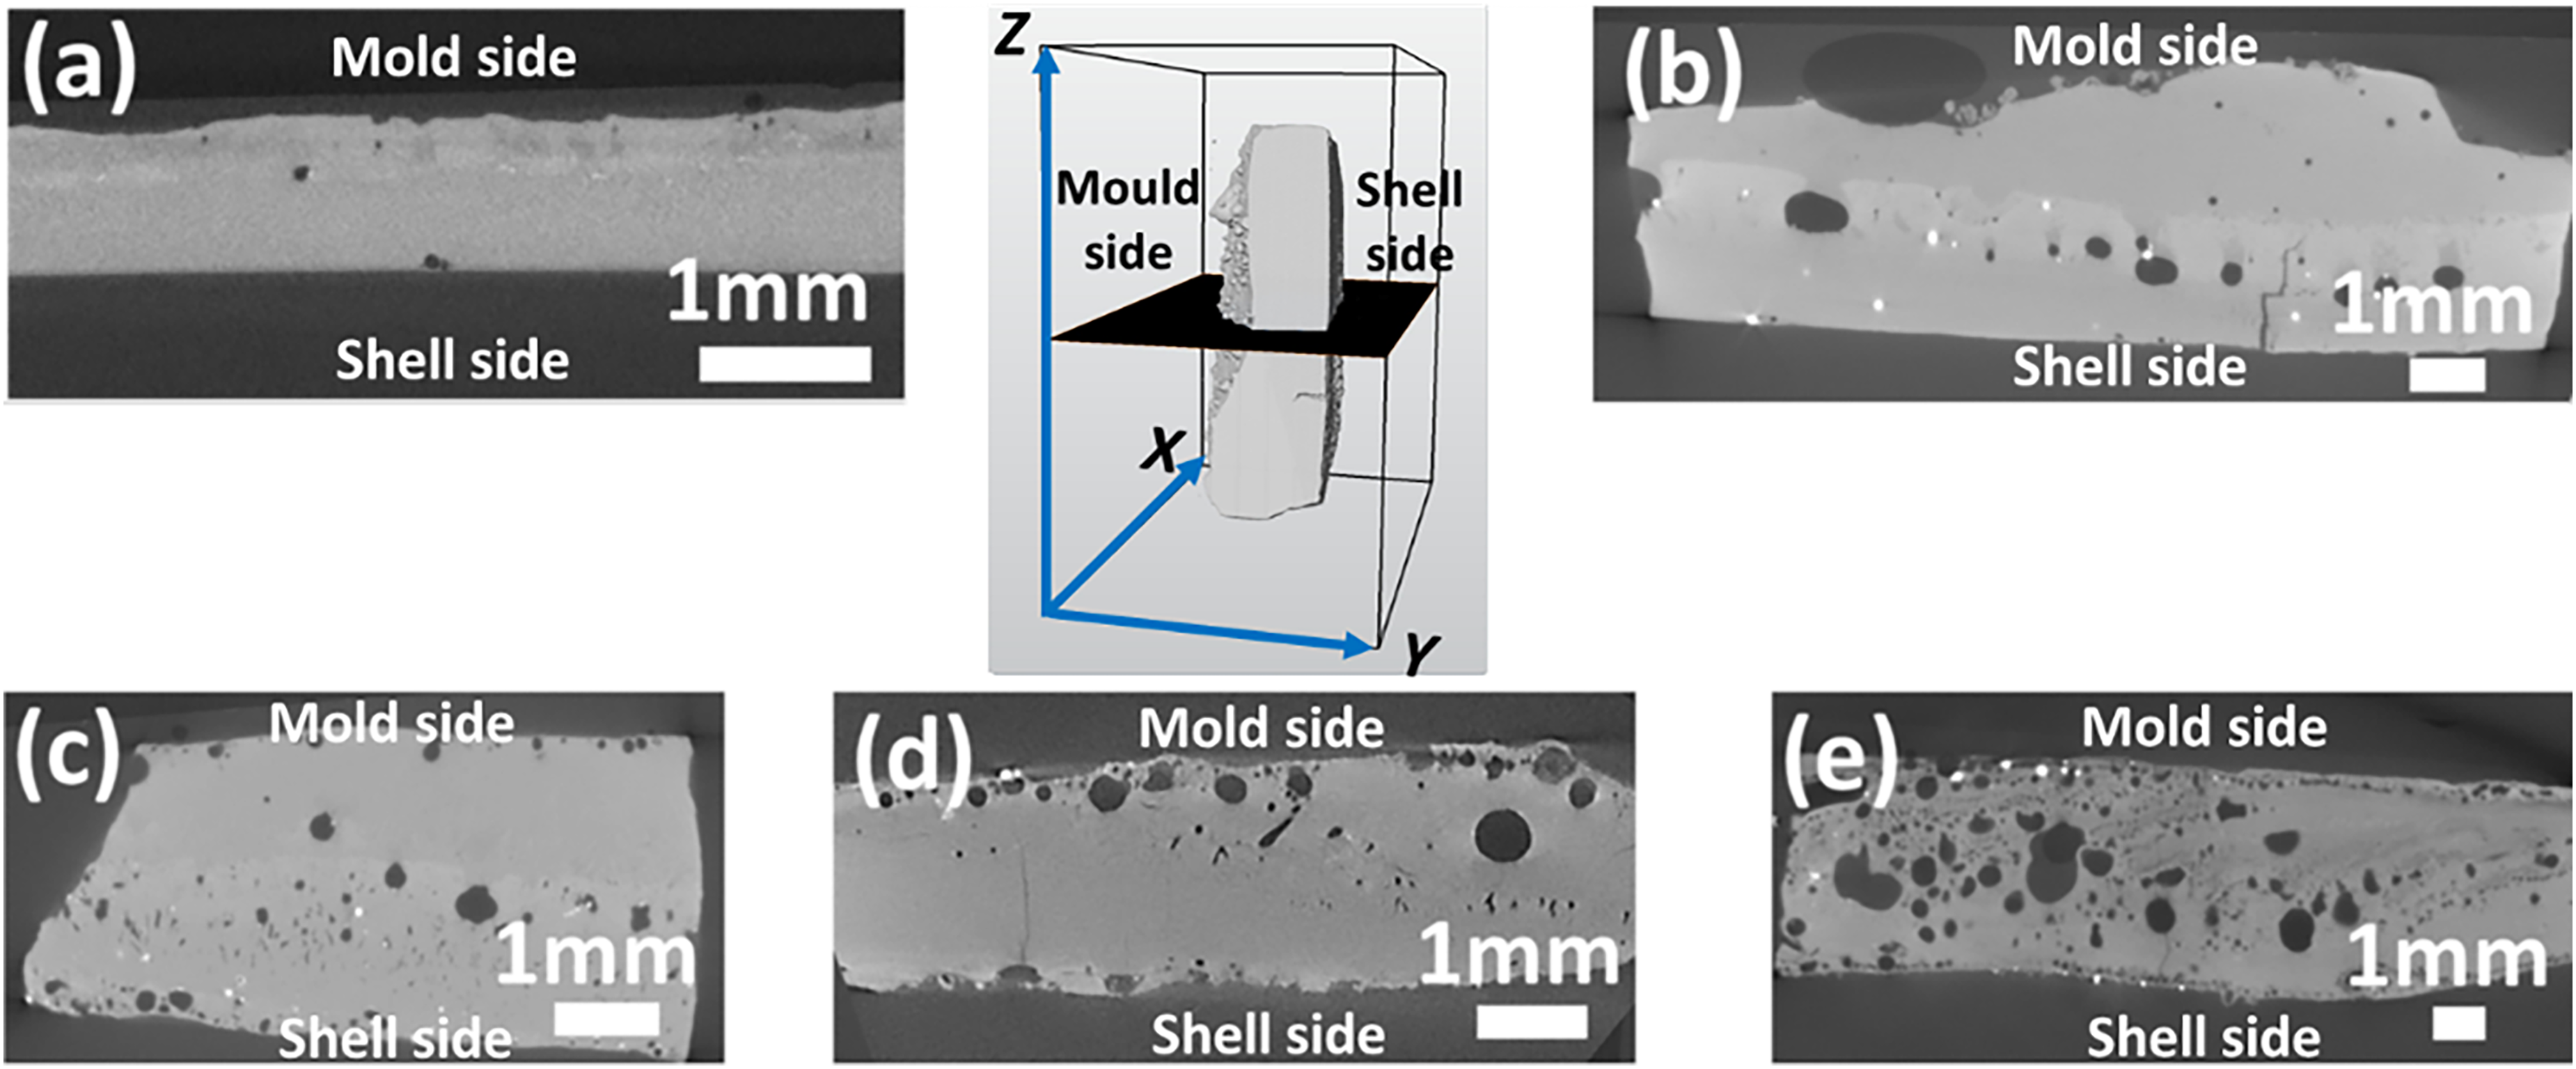
In continuous casting, the slag film serves as a crucial interlayer between the water-cooled mould and hot steel shell, to provide lubrication to the shell and regulate its heat removal rate. The two sides of slag film are exposed to distinct physical, thermal and chemical environments, typically resulting in differing porosity levels. Analysis using 2D characterisation methods generally shows that the mould side has higher porosity than the shell side.26,27 However, this is not always consistent, as the shell side sometimes displays higher porosity, as observed in the work by Bothma et al.28,29 To deepen understanding of porosity distribution within the slag film, 3D visualisation of the internal pores has been achieved within the lamellae-shaped slag film. Notably, the shapes of those films exhibit slight differences, particularly in terms of their thickness, due to their design for various types of steel casting.
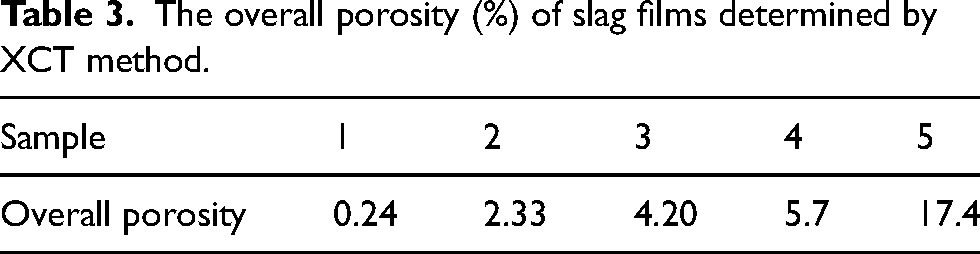
Pore distribution between the mould and steel shell sides can be viewed from the x–y plane perspective as shown in Figure 6(A) to (E). Figure 6(a) to (e) display the evolution of porosity across the thickness direction of slag film. From above, we can see Samples 1, 2, 4 and 5 exhibit higher porosity on the mould side, whereas Sample 3 demonstrate a slightly higher levels of porosity on the shell sides. This observation suggests that the higher porosity on the mould side of the slag film may not be a consistent characteristic across all slag films. Additionally, pores within different slag films exhibit diverse distribution patterns, particularly in correlation with their porosity levels. Table 3 presents the overall porosities of five slag films determined by XCT. Among those five slag films, Sample 1 exhibits the lowest porosity at 0.24%. The porosities of Samples 2, 3 and 4 are of the same order of magnitude, being 10 times higher than that of Sample 1. Their respective porosities are 2.33%, 4.20% and 5.7%, respectively. Sample 5 stands out with the highest porosity at 17.4%. The difference in porosity of slag films could be related to various reasons such as the chemistry of the mould powders, the formation mechanisms and the physical, thermal and chemical environments that the slag films were exposed to. The porosity of the mould slag films, in combination with other parameters such as the crystallinity of the slag films, plays an important role in controlling the horizontal heat transfer between the steel shell and the casting mould. Future efforts will be revealing the link between mould powder performance (e.g. horizontal heat transfer), slag film characteristics (e.g. porosity and crystallinity) and mould powder chemistry and formation mechanisms.
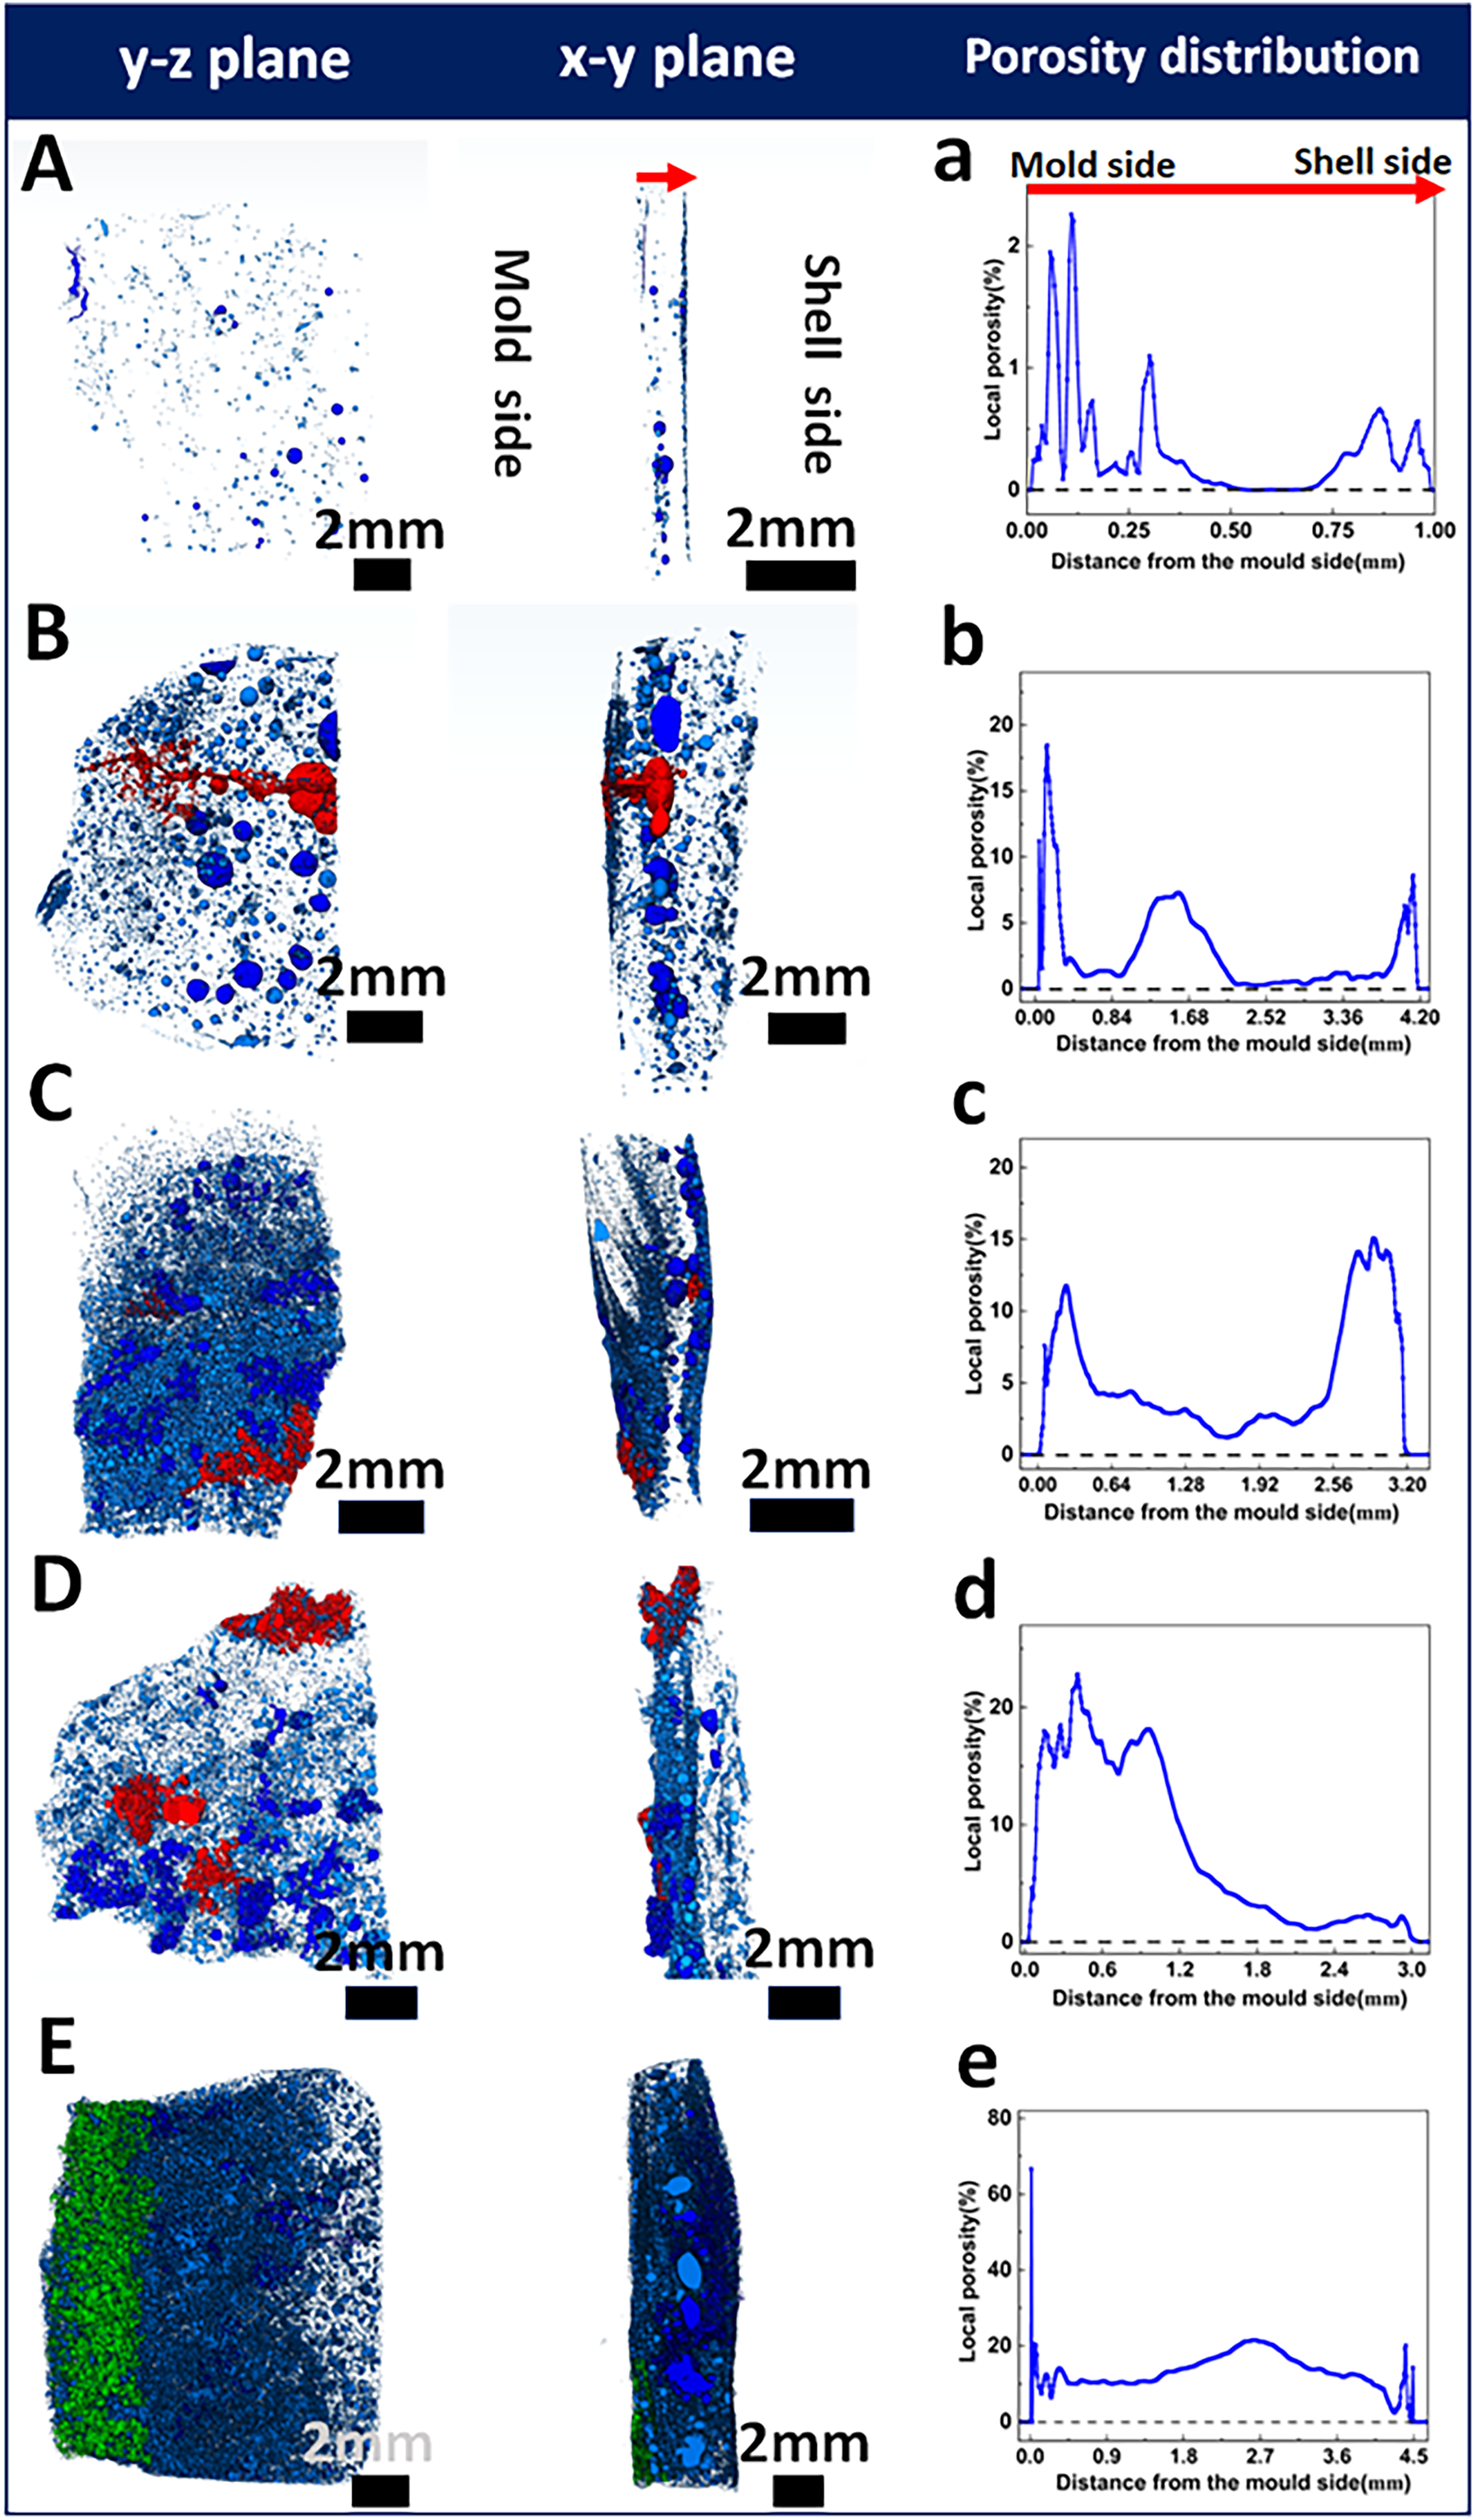
Overview of the internal pores and the evolution of porosity across the thickness direction of slag films. (A–E) volume rendering showing the pores in Samples 1–5 from both y–z and x–y planes. All the scale bars are 2 mm; (a–e) the evolution of local porosity from the mould side to the shell side of Samples 1–5. The thicknesses of Samples 1–5 are around 1, 4.2, 3.2, 3 and 4.5, respectively.
The overall porosity (%) of slag films determined by XCT method.
In Sample 1, most pores are isolated and distributed on both sides of the sample (Figure 6(A) and (a)). However, in Samples 2, 3 and 4, pores distribute not only on both sides of the slag film but also across the middle region, while the majority of pores are concentrated on the sides (Figure 6(b) to (d)). Interconnected regions have been observed at near the sides of those slag films (Samples 2, 3 and 4), as marked in red in Figure 6(B) to (D). Those interconnected regions, found within a small area, are believed to arise from the connection between pores and small cracks. As shown in Figure 6(B), a distinct crack traverses and links the pores. Among those slag films, Sample 5 exhibits the highest porosity at 17.4%. Pores in Sample 5 are not confined to a specific region but are distributed throughout the entire slag film. In Figure 6(E), it's evident that pores about 1 mm in diameter are randomly distributed inside Sample 5, with a considerable number of smaller pores concentrated on the sides, as viewed from the x–y plane. Those small pores contribute to a significantly high local porosity of up to approximately 65% at near the mould side of the Sample 5 (Figure 6(e)). Additionally, an extensive interconnected region has been formed via the interlinking of those small pores, as marked in green in Figure 6(E). The presence of interconnected region can affect the heat transfer behaviour, potentially exacerbating the heterogeneous thermal conductivity within the slag film. However, due to the inadequacy of tradition 2D methods in identifying the interconnected region, little is known about the influence of those interconnected areas on the heat transfer behaviour of slag films. This arises from the fact that the interconnected pores could seem separate in 2D images since their connections might exist in different places. Unlike 2D methods, XCT methods offer the opportunity to identify interconnected regions and facilitate a comprehensive study of the porosity structure of slag film.
From above, we’ve identified three distinct pore location distribution among the five slag films (distribution on two sides, across both sides and the middle region, and throughout the entire cross-section), and summarised their evolution with porosity. The identification of pore location distribution and interconnected pore regions via XCT provides spatial information about the porosity structure within the slag film, which is essential for investigating the heat transfer behaviour of the slag film.
Apart from the pore location distribution, pore size also plays a critical role on the heat transfer behaviour of slag films. In this work, pores within the slag film are categorised into four distinct sizes according to their volume. Since the smallest detectable pore is within a minimum size of ∼20 µm as demonstrated in Figure 4(d2), pores with volumes ranging from 10−6 to 10−5 mm3 are defined as small-sized pores. Pores with volumes between 10−5 and 10−3 mm3 are classified as middle-sized, while large-sized pores range from 10−3 to 1 mm3, and those exceeding 1 mm3 are defined as super-large pores.
The number ratio and volume ratio of pores across various size categories were both analysed, and the quantification results are shown in Figure 7. The pore number ratio for a specific pore size is determined by dividing the count of pores in that category by the total count of pores in the slag film. Similarly, the pore volume ratio for a specific pore size is calculated by dividing the combined volume of pores in that category by the total pore volume in the slag film. The rationale for analysing the number and volume ratios of pores, rather than the actual pore number or volume, is due to the slight differences in the sizes of the slag films. This approach provides the proportion of pores of different sizes within each film and is more efficient for comparing different slag films.
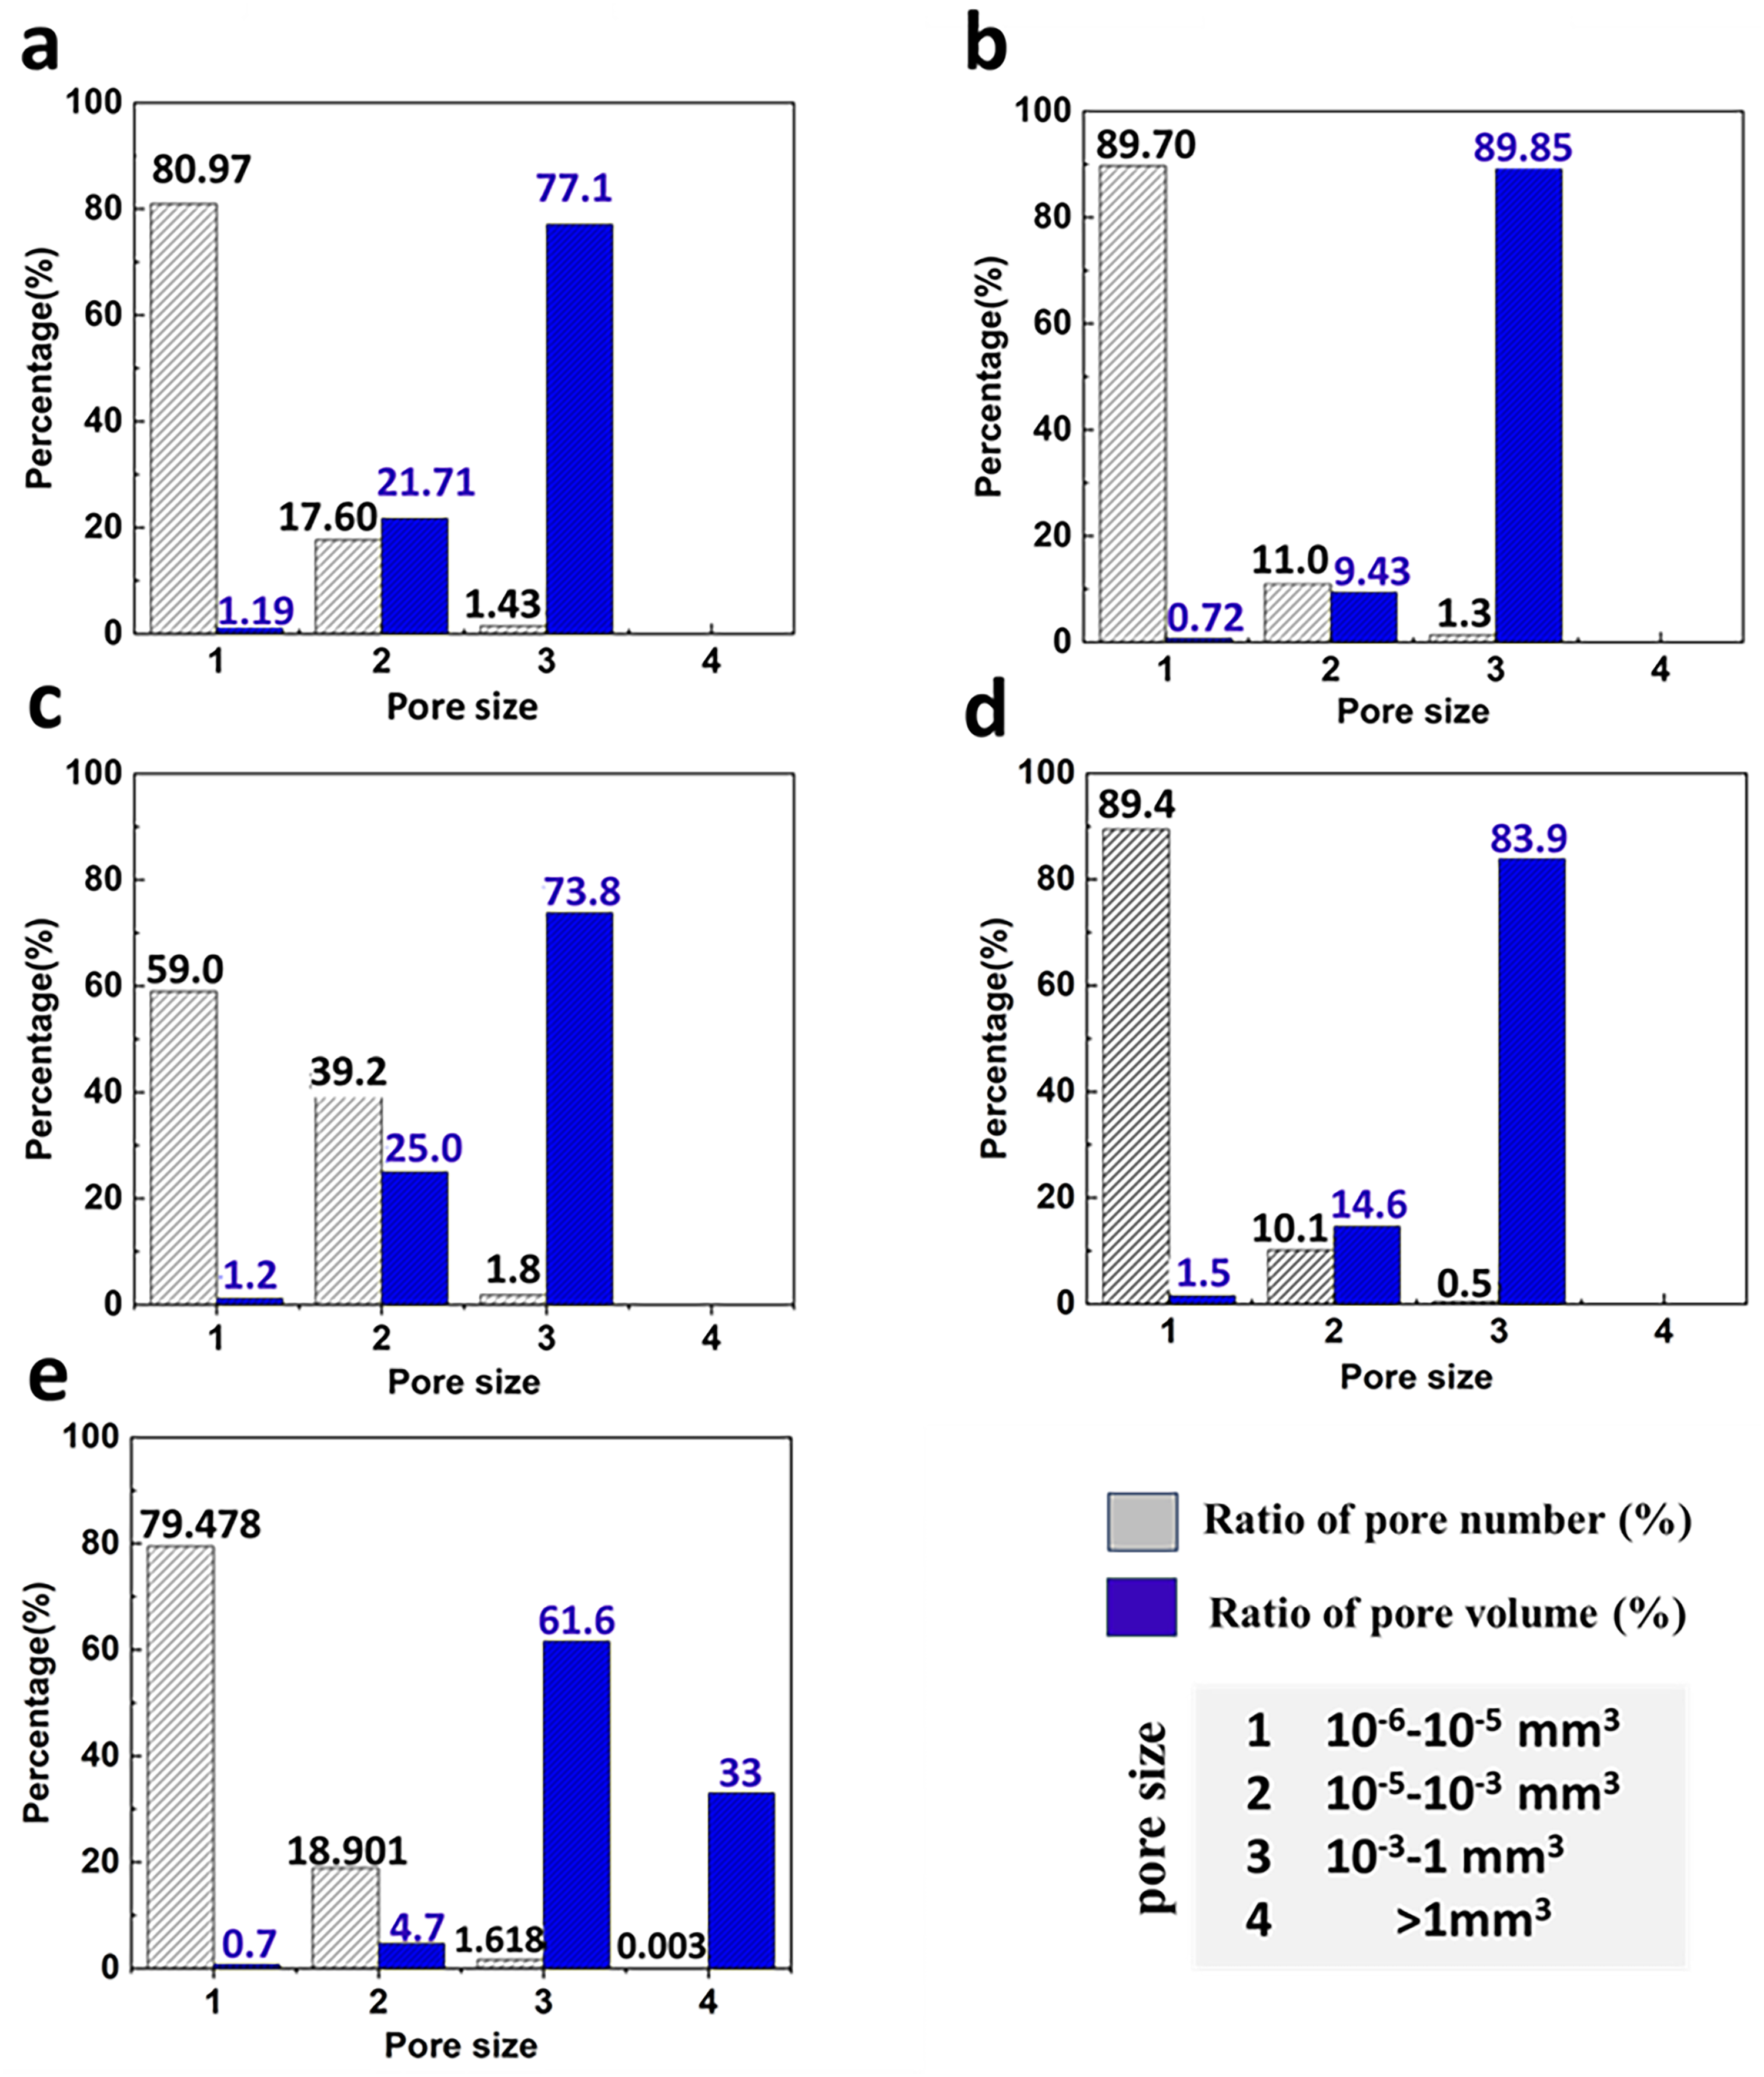
The number and volume ratios of pores of different sizes in five slag films. (a–e) Samples 1–5.
Overall, the pore size distribution in the five samples is notably consistent: as pore size increases, the ratio of pore number correspondingly decreases, while the volume these pores occupy increases. In all five slag films, small-sized pores with volumes ranging from 10−6 to 10−5 mm3 are the most numerous when compared to other sizes, but they contribute the least in terms of volume across all categories. Conversely, large-sized pores, with volumes ranging from 10−3 to 1 mm3, account for most of the volume in all samples. For instance, in Sample 3, small-sized pores make up about 59% of the total pores (potentially even higher in other samples) but contribute only 1.2% to the overall pore volume. In contrast, large-sized pores, despite comprising only 1.8% of the total pore count, contribute to 73.8% of the total pore volume. On the other hand, super-large pores have been observed in Sample 5, which is resulted from the connection of small pores along the side of the slag film, as indicated by the green markings in Figure 6(E).
The XCT quantification results provide insights into the distribution of pores of various sizes within the slag film. Pores of different sizes may contribute differently to thermal insulation. Therefore, by categorising pores into distinct size ranges and analysing their number and volume fractions, we can better understand how pores of varying sizes influence the thermal conductivity of the slag film. Additionally, by optimising the proportions of pores of different sizes, it is possible to adjust the thermal conductivity of slag films.
Conclusion
In summary, this work has demonstrated the application of XCT in determining the porosity of slag films. Compared to traditional 2D methods, the XCT technique proves more effective in detecting and identifying pores within slag films for several reasons: (1) it minimises sample preparation and thereby reduces damage; and (2) it provides 3D pore information, reflecting the true size and distribution of pores.
The XCT technique facilitates a 3D examination of the slag film's internal pore structure and offers an in-depth porosity analysis. It reveals that higher porosity on the mould side of the slag film is not a consistent characteristic across all samples. Furthermore, diverse pore location distributions have been observed, correlating with the overall porosity levels of the slag films. In slag films with low porosity, pores are mainly distributed on the sides, whereas, in those with higher porosity, pores tend to be distributed throughout the entire film. Additionally, the majority of pores in the slag film fall within the size range of 10−6 to 10−5 mm3, while pores in the size range of 10−3 to 1 mm3 account for most of the volume, according to the pore size distribution results. This phenomenon is consistent across the five slag films analysed. The comprehensive porosity analysis provided by XCT leads to a nuanced understanding of the porosity structure of the slag film, offering valuable insights for optimising its thermal performance.
Footnotes
Acknowledgements
The authors would like to acknowledge the financial assistance received from the Research Fund for Coal and Steel (RFCS) under the grant number RFCS-2018-847269. The authors also would like to thank the partners in the project for providing industry slag films and discussions – Sidenor Aceros Especiales S. L., ArcelorMittal Maizières Research, SSAB, Sandvik Materials Technology, Proximion, the Materials Processing Institute, Swerim, and the Open University.
Declaration of conflicting interests
The authors declared no potential conflicts of interest with respect to the research, authorship, and/or publication of this article.
Funding
The authors disclosed receipt of the following financial support for the research, authorship, and/or publication of this article: This work was supported by the Research Fund for Coal and Steel (grant number RFCS-2018-847269).