
Abstract
The mechanical properties of dual-phase (DP) steels are influenced by ferrite grain size, martensite distribution/morphology, and strength differences between ferrite/martensite phases. A sensitivity study was conducted on a continuous annealing line cycle of DP steel manufacturing process to understand the effect of individual segments on the final microstructural features. From the study results, an optimised cycle was developed to obtain a DP steel microstructure with reduced martensite banding, fine ferrite grain size and less untempered martensite. The main modifications are austenite soaking temperature above Ac3 temperature, higher cooling rate of the slow cooling stage, increased soak time at ferrite soaking temperature, and higher over-aging temperature. The optimised cycle produced DP steel microstructure with reduced martensite banding at a similar phase fraction (35%) and decreased ferrite grain size from 8.4 to 5.1 µm. This improved the mechanical properties, increasing tensile strength from 789 ± 21 to 831 ± 14 MPa and total elongation from 15 ± 3 to 20 ± 2%.
Introduction
In the past few decades, dual-phase (DP) steels have been increasingly used for components in the automotive industry due to their excellent combination of strength and ductility.1,2 The presence of a soft ferrite matrix and hard martensite islands in the microstructure gives these steels a low yield-to-tensile strength ratio, high work hardening coefficient and high tensile strength. 3 These mechanical properties are sensitive to the various microstructural features such as second phase volume fraction and type (e.g. presence of bainite/martensite), grain sizes, morphologies, and distributions of the phases, which are in turn directly influenced by the chemical composition and the process parameters.2–7 The processing route of these steels involves continuous casting, reheating, hot rolling and coiling, pickling, cold rolling, and a final continuous annealing process.8,9 The last step of the continuous annealing line (CAL) is crucial in the manufacturing process as critical microstructural features such as grain size, phase fraction, texture, solute distribution, and phase morphologies are established during this step.10–11 These intrinsic material properties will have a profound effect on resulting tensile and formability properties (local/global).
The main objective of the CAL step is to produce a two-phase ferrite–martensite microstructure as the final product. To achieve this, various industries have slightly different approaches depending on their equipment feasibility and the final desired microstructure. To briefly summarise, the CAL step mainly involves heating the cold-rolled material to an inter-critical (Ac1–Ac3) or austenitising (>Ac3) temperature, then soaking for a specific time to obtain required phase balance, followed by slow cooling and a short ‘hold’ zone at an intermediate temperature for obtaining the desired ferrite fraction prior to quenching to the tempering/over-aging temperature for a short hold before cooling to room temperature.12,13 Generally, the final quenching step is done to the over-aging temperature; however, some industries quench to room temperature followed by reheating and soaking to the tempering temperature. This multi-step industrial annealing process is generally overlooked in the published literature, with most of the microstructure evolution literature following the soaking at inter-critical temperature and followed by direct quenching to room temperature to produce a DP steel microstructure.14,15 The influence of time– temperature at a given product speed and gauge/width is therefore critical to optimise the resulting microstructure and hence properties.
Each stage of the CAL step has a distinct and pronounced effect on the final microstructural features and the consequent mechanical properties of these steels. The heating rate employed during the heating stage dictates the amount of overlap between ferrite recovery/recrystallisation, cementite spheroidisation and austenite transformation/cementite dissolution processes.16,17 Various published literature showed that the amount of overlap between these high-temperature processes has a huge effect on the martensite volume fraction and its morphology.14,16,18–21 The soaking step where the strip is held for a given amount of time at inter-critical (Ac1–Ac3) or austenitising (>Ac3) temperature dictates the martensite island size, ferrite grain size, and texture. 11 The next step of slow cooling and a short hold at an intermediate temperature determines the ferrite formation and its grain size. 22 The following fast quenching process generally employs a fast cooling rate to transform all the remaining austenite to martensite. The over-aging/tempering soak temperature and time influence the martensite tempering and therefore the mechanical properties of the steel.23,24 Variations in the CAL parameters have a huge influence on the microstructural features and the consequent mechanical properties of DP steels, with literature reports considering the influence of some specific parameters. Whilst the effects of individual annealing parameter changes have been reported previously there has not been a systematic study on the same DP steel composition for all the annealing parameters.
To produce commercial DP steels with optimum mechanical properties, it is necessary to develop knowledge of the effect of the continuous annealing steps on the microstructural evolution. Thus, it is highly critical to understand the importance of each stage in terms of the amount of variation caused by the important microstructural features. Therefore, this study systematically evaluates the sensitivity of the microstructure and properties of a DP800 steel to variations in the heating rate, soaking temperature, slow cooling rate, ferrite formation temperature and time, and over-aging temperature. Based on the results of microstructural variation with respect to the parameters, a new optimum cycle is proposed.
Experimental procedure
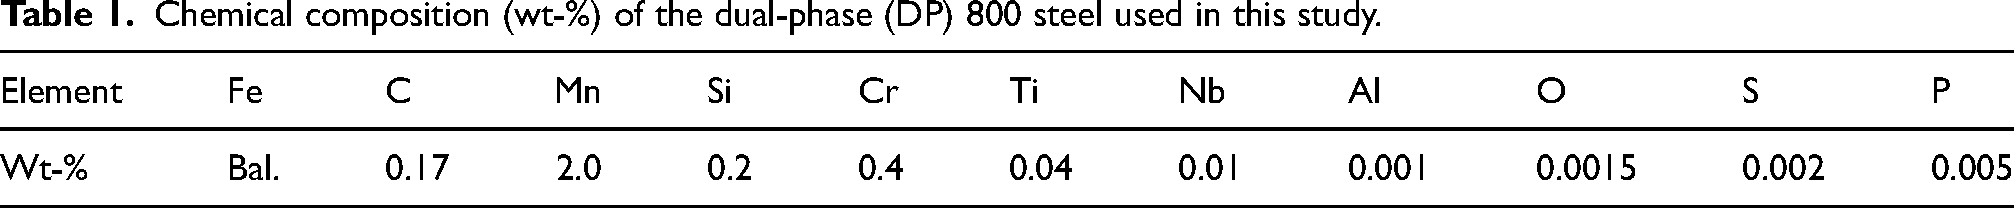
The present work was carried out on a commercial DP 800 composition, as shown in Table 1. A Consarc vacuum induction melting furnace was used to produce the cast ingot of 220 × 80 × 30 mm dimensions. The cast ingot was cut into small blocks of 45 mm length and were soaked for 1 h at a temperature of 1050 °C. After soaking, hot rolling was carried out using a Hille25 hot rolling mill (roll diameter 20 cm) to produce a hot band sheet thickness of 3.5 mm. Hot rolling was completed using seven rolling passes, with a rolling reduction of 30% for the first four passes and 20% for the remaining passes. The final rolling temperature was 860 °C and then the hot-rolled sheet was air cooled to 600 °C and slowly cooled to room temperature for 24 h in an alumina Techne FB-08 fluidised bed to replicate the hot coil cooling. To remove oxide scales, the hot-rolled sheet was pickled using 25% hydrochloric acid for 30 min. The hot-rolled and pickled material was further cold rolled to 75% using a Durston DRM F130 mill (roll diameter 10 cm) to a final thickness of 0.9 mm. Cold rolling was completed using eight rolling passes, with a rolling reduction of 15% for each pass. The laboratory route to produce the DP steel has been benchmarked against commercially produced material to ensure that comparable microstructures (e.g. segregation spacing in the hot-rolled condition, as shown by the ferrite–pearlite band spacing, designed to be the same in the lab and commercial material), and is described in Zhu et al. 8
Chemical composition (wt-%) of the dual-phase (DP) 800 steel used in this study.
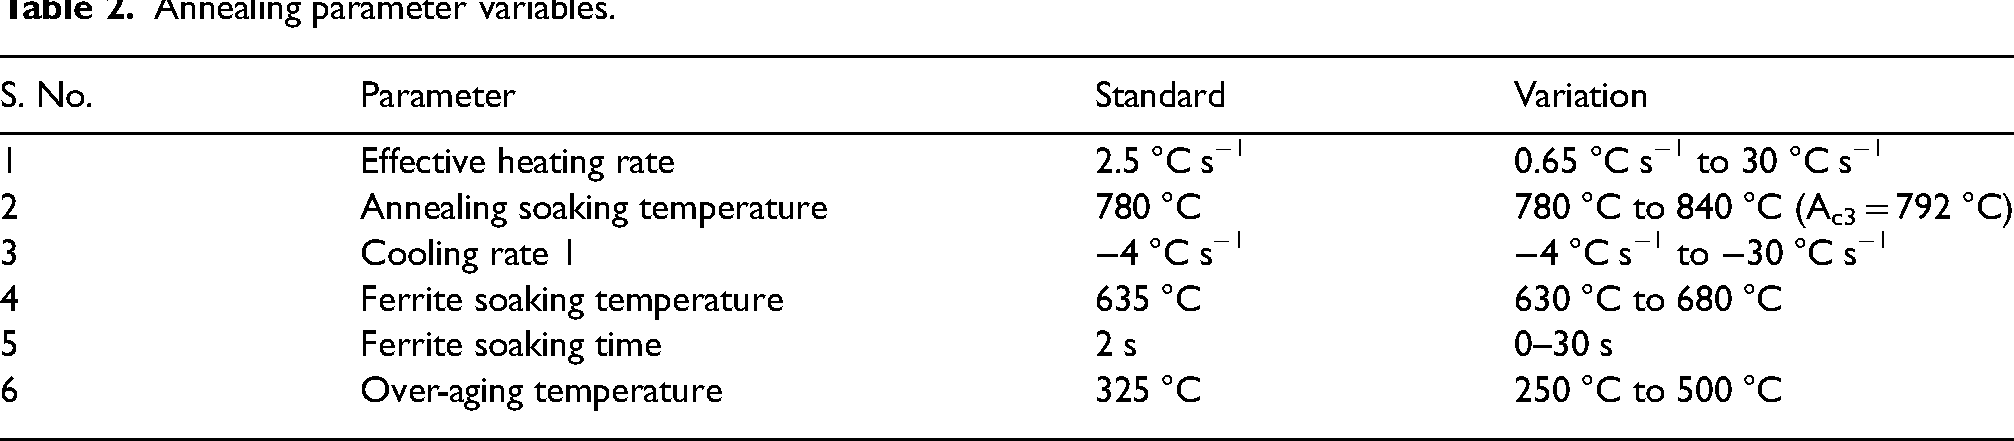
The cold-rolled sheet was cut into rectangular specimens of 10 × 4 × 0.9 mm (L × W × T)dimensions using an Isomet precision cutter. All the CAL heat treatments were conducted using a Bähr Dilatometer 805 A/D equipped with helium gas quenching. A schematic representation of the annealing cycle used in this study is shown in Figure 1. Heat treatments were done in such a way that each of the annealing parameters shown in Figure 1 was systematically varied. Table 2 shows the annealing parameter with its corresponding variation. It should be noted that during any given test, while a single parameter is varied the remaining variables are reverted to their baseline values. In industrial practice, the annealing parameters would not be independently controlled as they are linked by strip thickness and line speed, but this study is looking at sensitivity to the different parameters. The range in parameter variation is selected based on the literature studies and industrial feasibility. For instance, the annealing soaking temperature parameter range was selected to include both inter-critical and fully austenitising effects on the final microstructure.
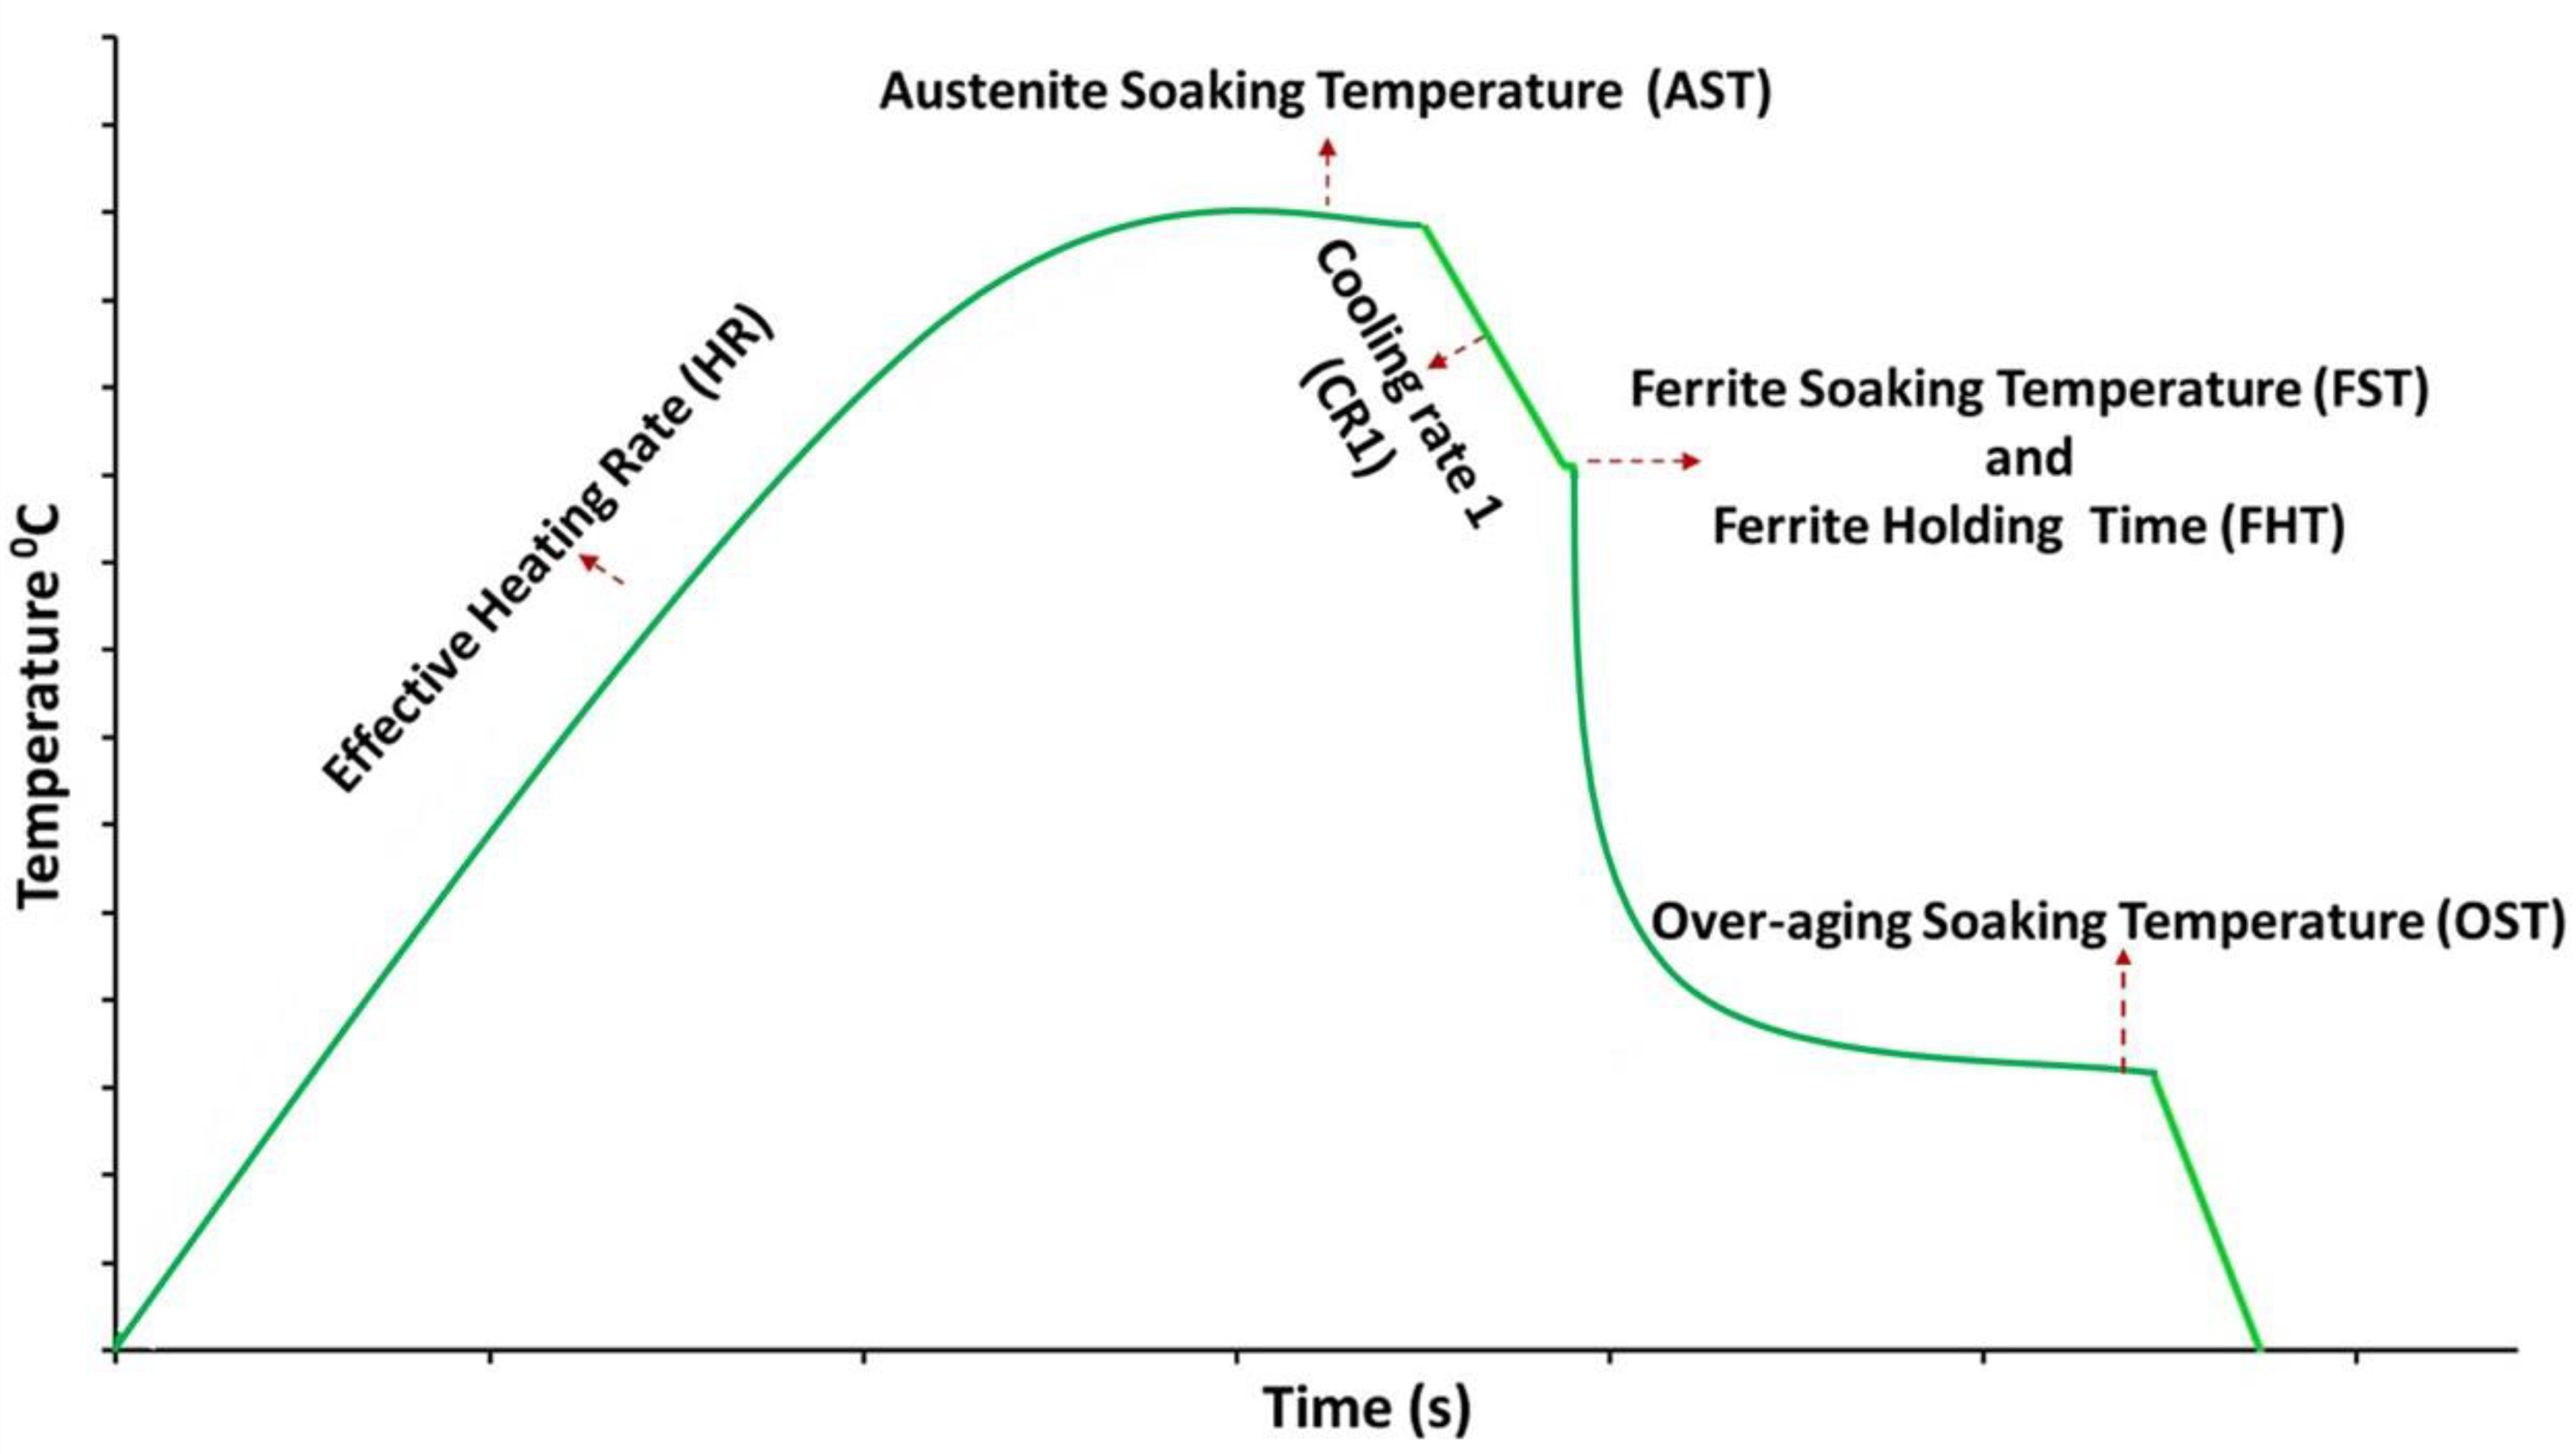
A schematic representation of the annealing cycle used in this study.
Annealing parameter variables.
For metallographic analysis, the hot-rolled, cold-rolled and heat-treated samples were cut and mounted (KunductoMet resin) on the RD-ND plane. Mounted samples were polished using standard metallographic procedures to a final finish of 0.05 µm using an AutoMet 300 Pro automatic polishing machine. For microstructural analysis, the polished samples were etched using Nital 2% solution for 5 s. Optical microscopic analysis was conducted on a Nikon Eclipse LV150N. FEG JEOL 7800F-SEM equipped with a secondary electron detector, and an electron back-scattered diffraction detector (EBSD) was used to generate SEM microstructural images and EBSD maps. Aztec crystal software (Oxford Instruments) was used to analyse the EBSD maps to generate phase classification maps and grain size distributions. Micro-Vicker's hardness measurements were taken using a Wilson hardness testing machine at a load of 2 kg and a dwell time of 10 s. Based on the results, a modified optimum cycle was proposed and for comparison of properties, tensile tests were conducted on Gleeble HDS-V40 heat-treated samples. ASTM-E8 sub-sized samples were used for tensile testing on an Instron 30 kN tensile machine with a strain rate of 0.001 s−1.
Results and discussion
Figure 2(a) shows the optical micrograph of a hot-rolled steel strip microstructure. The simulated coiling stage (slow cooling) in the fluidised bed produced a ferrite-pearlitic microstructure. The pearlite colonies were generally located in bands parallel to the rolling direction. This type of banded ferrite–pearlite hot-rolled microstructure is typical for the industrial production of DP steels.15,17 The banded pearlite morphology is caused by the inherent solidification segregation of solute atoms, especially carbon and manganese, leading to inter-dendritic enrichment. 25 During the benchmarking process, the inter-dendritic spacing was measured and was found to be 183 µm. This segregation exists throughout the downstream rolling process leading to a banded compositional variation throughout the thickness of the sheet. During slow cooling after hot rolling, the ferrite phase forms preferentially in the lean region leading to the formation of pearlite in the enriched banded region. The pearlite fraction was found to be 21 ± 4% and the ferrite grain size parallel to the rolling direction was found to be 6 ± 1.8 µm. Figure 2(b) shows the SEM micrograph of 75% cold-rolled steel. The ferrite grains are elongated slightly more than the pearlite colonies due to their lower hardness and hence strain partitioning during rolling. The ferrite grain boundaries are decorated with fragmented cementite particles which can act as potential nucleation sites for the austenite phase during annealing. The micro-hardness values for the hot-rolled steel and cold-rolled steel were found to be 174 ± 11 and 278 ± 8 HV2, respectively, signifying the introduction of a high dislocation density and residual stresses during the cold rolling. This stored deformation energy plays a significant role during the heating step of annealing, as it influences the recrystallisation process and potential overlap between ferrite recrystallisation, grain growth and austenitisation. This affects the final microstructural features, especially the martensite volume fraction and its morphology.14,16,26–28 In this work, 75% cold rolling reduction has been considered as this is a typical commercial reduction level and previous work has considered the effect of different cold rolling reduction values. 15
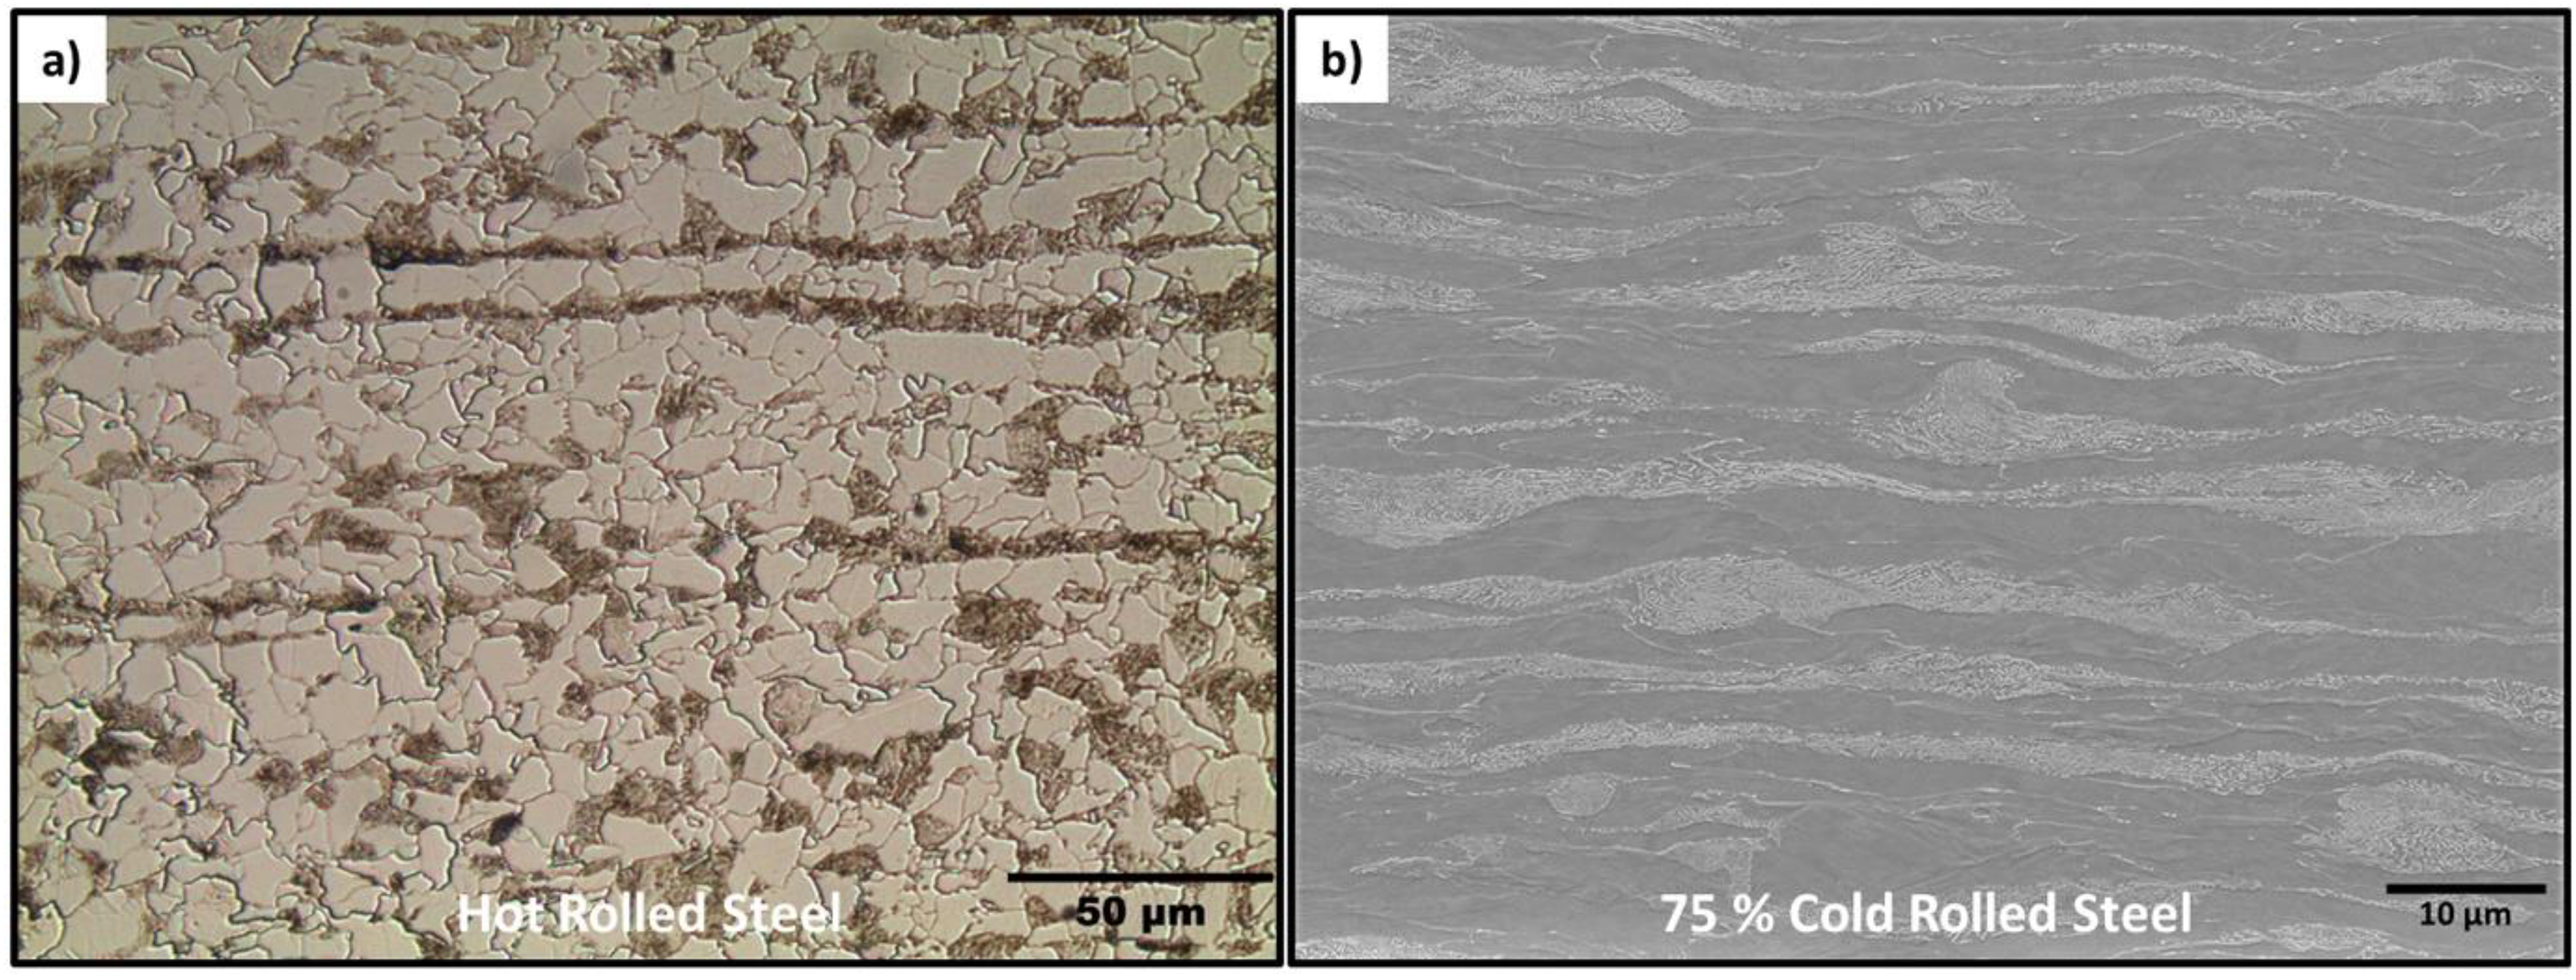
(a) Optical micrograph of hot-rolled steel strip, and (b) scanning electron microscopy (SEM) micrograph of 75% cold-rolled steel strip.
Effect of austenite soaking temperature (AST) with respect to Ac3 temperature
Depending on a steel company's annealing line capability and design, the austenite soaking temperature can be either above or below the Ac3 temperature. This section compares the effect of soaking above and below Ac3 temperature. From ThermoCalc, the Ae1 and Ae3 temperatures for the present composition were found to be 670 °C and 802 °C. Three austenite soaking temperatures were chosen at 780 °C, 825 °C, and 840 °C. All the remaining annealing parameters were kept constant at standard parameters (Table 2).
Figure 3(a) and (b) shows the EBSD band contrast maps of the samples annealed at soaking temperatures of 780 °C and 840 °C, respectively. The average martensite volume percentages were found to be 34% ± 3 for the 780 °C soak temperature sample and 41% ± 7 for the 840 °C sample. A significant amount of martensite banding can be seen in the 780 °C soak temperature sample, whereas the 840 °C soak temperature sample, which was soaked above the Ac3 temperature has relatively more distributed martensite morphology. Figure 3(c) and (d) shows the ferrite grain size distributions (equivalent circle diameter) of the samples annealed at soaking temperatures of 780 °C and 840 °C, respectively. With the increase in soaking temperature above Ac3 temperature (780 °C to 840 °C), both the arithmetic mean and area weight mean of the ferrite grain size decreased from 4.3 to 2.6 µm and 8.4 to 6 µm, respectively. Similar observations were seen for the sample annealed at a soaking temperature of 825 °C (also above Ac3 temperature), where the martensite volume percentage was found to be 42% ± 9 and the ferrite grain size area-weighted mean was found to be 5.7 µm. These differences between the martensite volume fractions and ferrite grain sizes for the samples soaked above and below Ac3 temperatures can be attributed to the competition between ferrite nucleation and ferrite growth during the initial cooling stage (see Figure 1). For the samples soaked below Ac3 (here 780 °C), just before cooling the microstructure contains 5% to 10% ferrite fraction (based on ThermoCalc predictions). Therefore, during cooling, the ferrite fraction can increase by epitaxial growth. However, for the samples soaked above the Ac3 temperature, the formation of ferrite needs to overcome the nucleation barrier with preferential nucleating sites on the austenite triple points and grain boundaries. This leads to a lower ferrite fraction in the samples soaked above Ac3. Moreover, the epitaxial growth of ferrite in the sample soaked below Ac3 happens preferentially along the solute-poor regions leading to more martensite banding. For the samples soaked above Ac3, ferrite nucleation will be preferred in the solute-poor regions but is likely to also occur on triple points/grain boundaries in the solute-rich regions as the initial cooling rate (CR1) of 4 °C s−1 to the ferrite-soak temperature (FST) will result in undercooling below the local Ac3 temperatures in both regions.
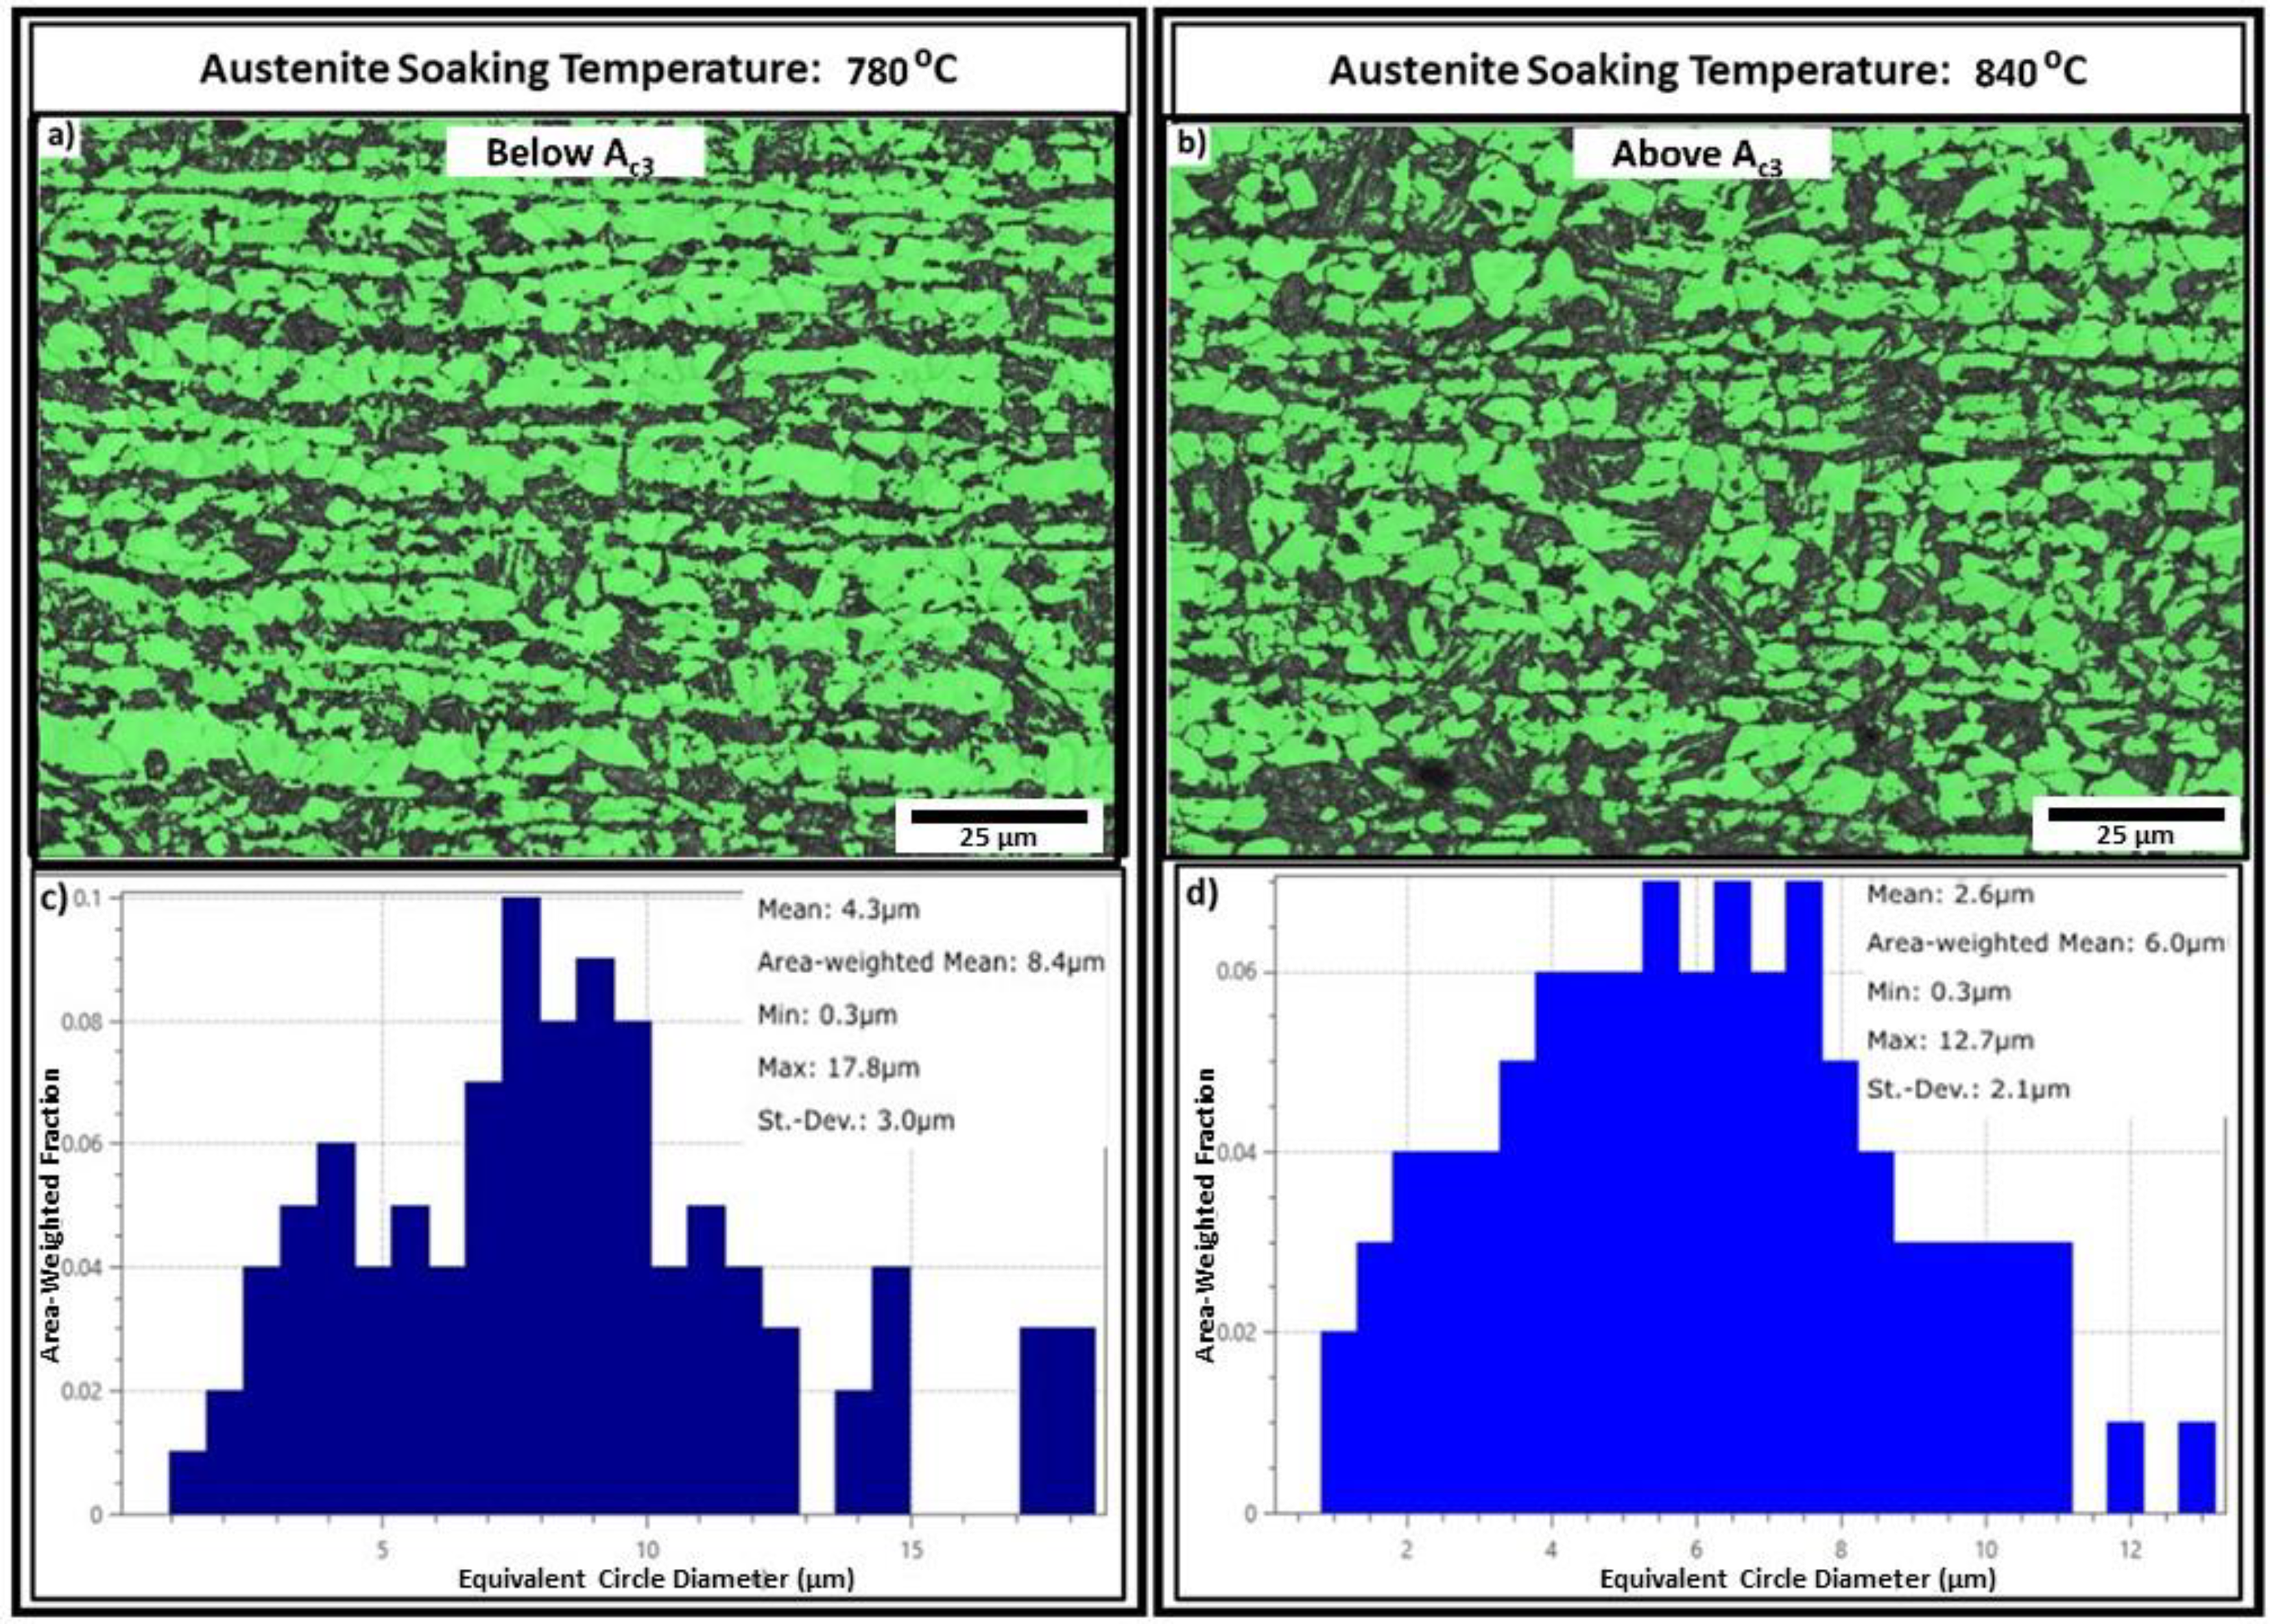
(a, b) Electron back-scattered diffraction detector (EBSD) phase classification maps (ferrite – green and martensite – black) and (c, d) ferrite grain size distributions for the samples annealed at austenite soaking temperatures of 780 °C and 840 °C, respectively.
From the results, it can be concluded that soaking above the Ac3 temperature is beneficial for this annealing cycle because of the finer ferrite grain size and reduced severity of martensite banding in the final microstructure. However, due to the short annealing times, no significant growth was seen when increasing the temperature from 825 °C to 840 °C.
Effect of heating rate (Hr) above Ac3 temperature
In the previous study by the authors, 15 the effect of heating rate for inter-critically annealed (730 °C to 750 °C) DP steels was studied on a similar commercial DP800 steel composition. From that study, it was concluded that an increase in heating rate (0.65 °C s−1 to 30 °C s−1) increases both the martensite volume fraction and the severity of banding and decreases the ferrite grain size. This variation in microstructure is expected to induce a huge influence on the mechanical properties, as the increase in martensite banding increases anisotropy and decreases the formability of these steels.29,30 In this study the effect of heating rate (0.65 °C s−1 to 30 °C s−1) is studied for DP steels annealed above the Ac3 temperature (840 °C).
Figure 4(a) to (c) shows EBSD phase classification maps of samples annealed at heating rates of 0.65 °C s−1, 15 °C s−1, and 30 °C s−1, respectively, to austenite soaking temperature of 840 °C. All the remaining annealing parameters were kept constant at standard parameters (Table 2). The results show that contrary to the inter-critically annealed product, with an increase in heating rate there is no apparent increase in martensite banding. Moreover, there is no trend of increase in martensite volume fraction with the increase in heating rate. The martensite volume fraction of samples annealed at heating rates of 0.65 °C s−1, 15 °C s−1, and 30 °C s−1 were found to be 44% ± 3, 41 ± 5, and 42 ± 7%, respectively. The ferrite grain sizes of samples annealed at heating rates of 0.65 °C s−1, 15 °C s−1, and 30 °C s−1 were found to be 5.93, 6.1, and 5.7 µm, respectively. Therefore, these results show that with an increase in heating rate, there are no significant changes in the microstructural features for the samples annealed above Ac3 temperature. This is caused because above Ac3 temperature full austenitisation occurs and the soaking time (2 min) eliminates any effect caused by the heating rate. The phase balance of ferrite and austenite is developed only during the slow cooling stage (CR1) and the FST of the heat treatment process. As this stage is constant for all the heating rates, there is no meaningful change in the final microstructural features of these samples. Therefore, this study shows that the influence of high heating rates can be reduced by choosing austenite soaking temperature above Ac3 temperature.
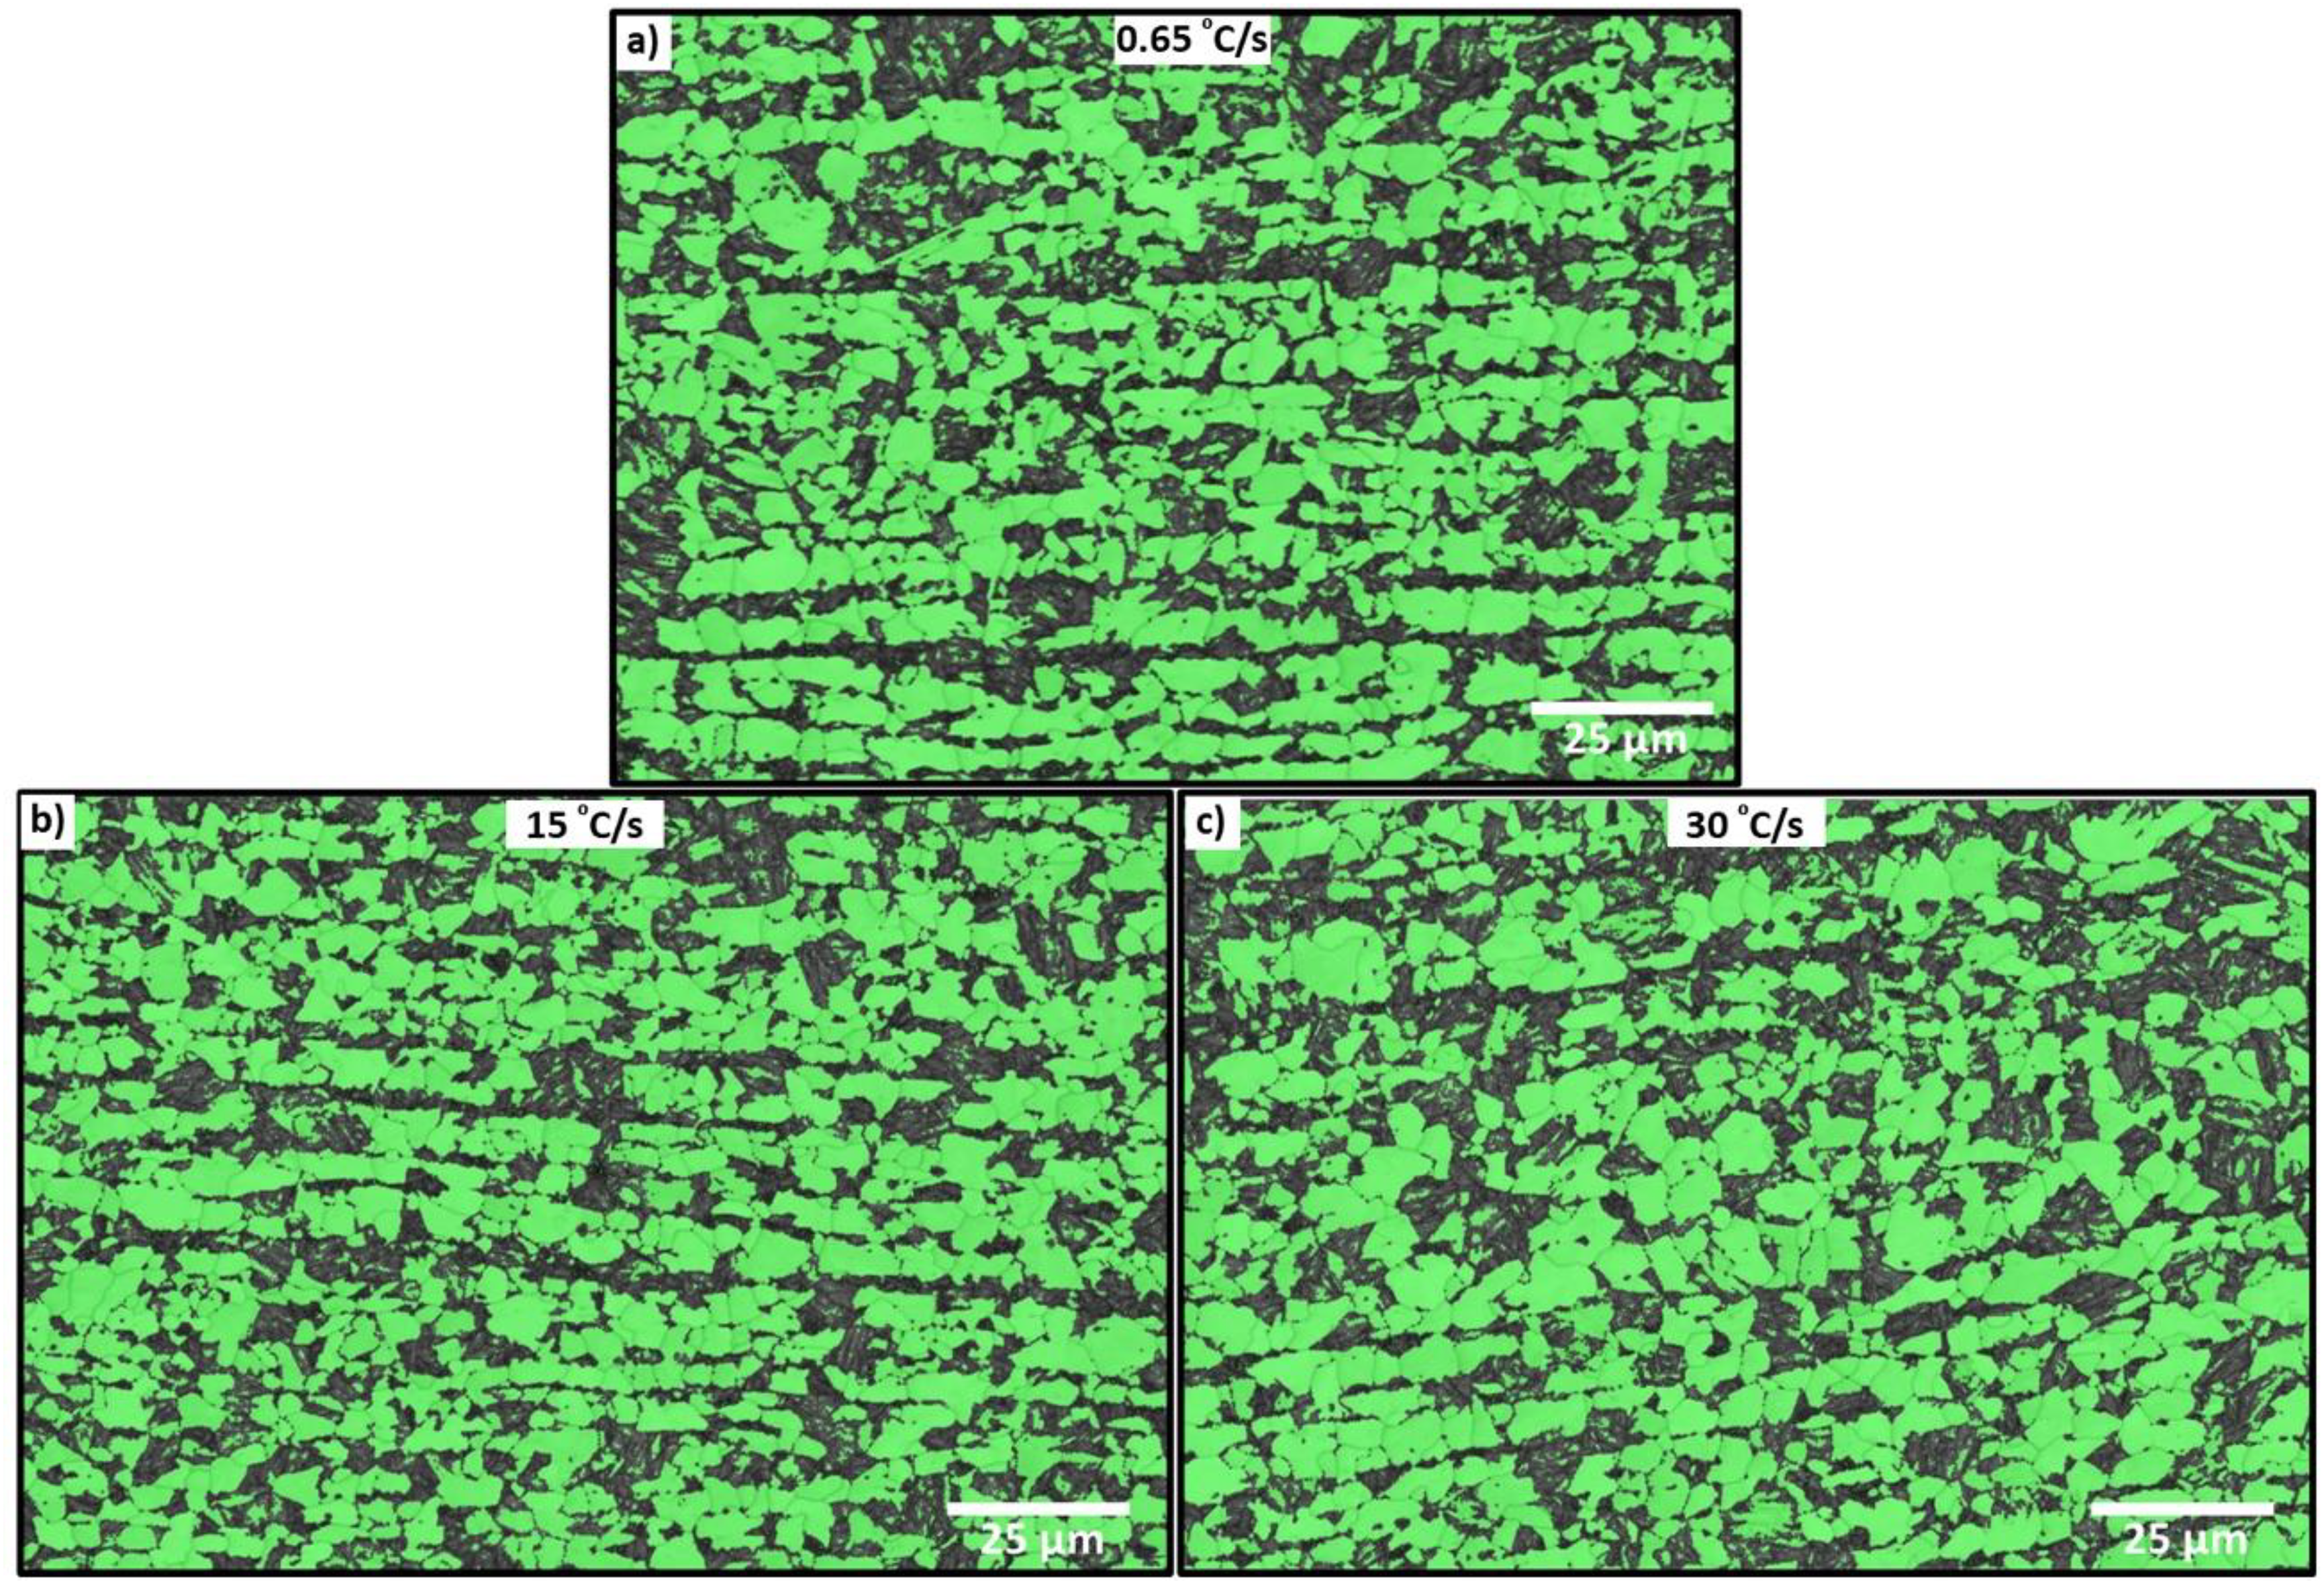
(a, b, c) Electron back-scattered diffraction detector (EBSD) phase classification maps of samples heat treated at heating rates of 0.65 °C s−1, 15 °C s−1, and 30 °C s−1, respectively.
Effect of CR1, FST and ferrite hold time (FHT)
CR1 was varied from 0.5 °C s−1 to 30 °C s−1. All the remaining annealing parameters were kept constant at standard parameters (Table 2). Figure 5(a) and (b) shows the EBSD phase classification maps of the samples annealed at cooling rates of 4 °C s−1 and 30 °C s−1, respectively. The average ferrite grain size (equivalent circle diameter) for the 4 °C s−1 sample and the 30 °C s−1 sample was found to be 8.4 and 5.3 µm, respectively. Whereas the average martensite volume percentage for the 4 °C s−1 sample and the 30 °C s−1 sample was found to be 34 ± 3 and 38 ± 2%, respectively.
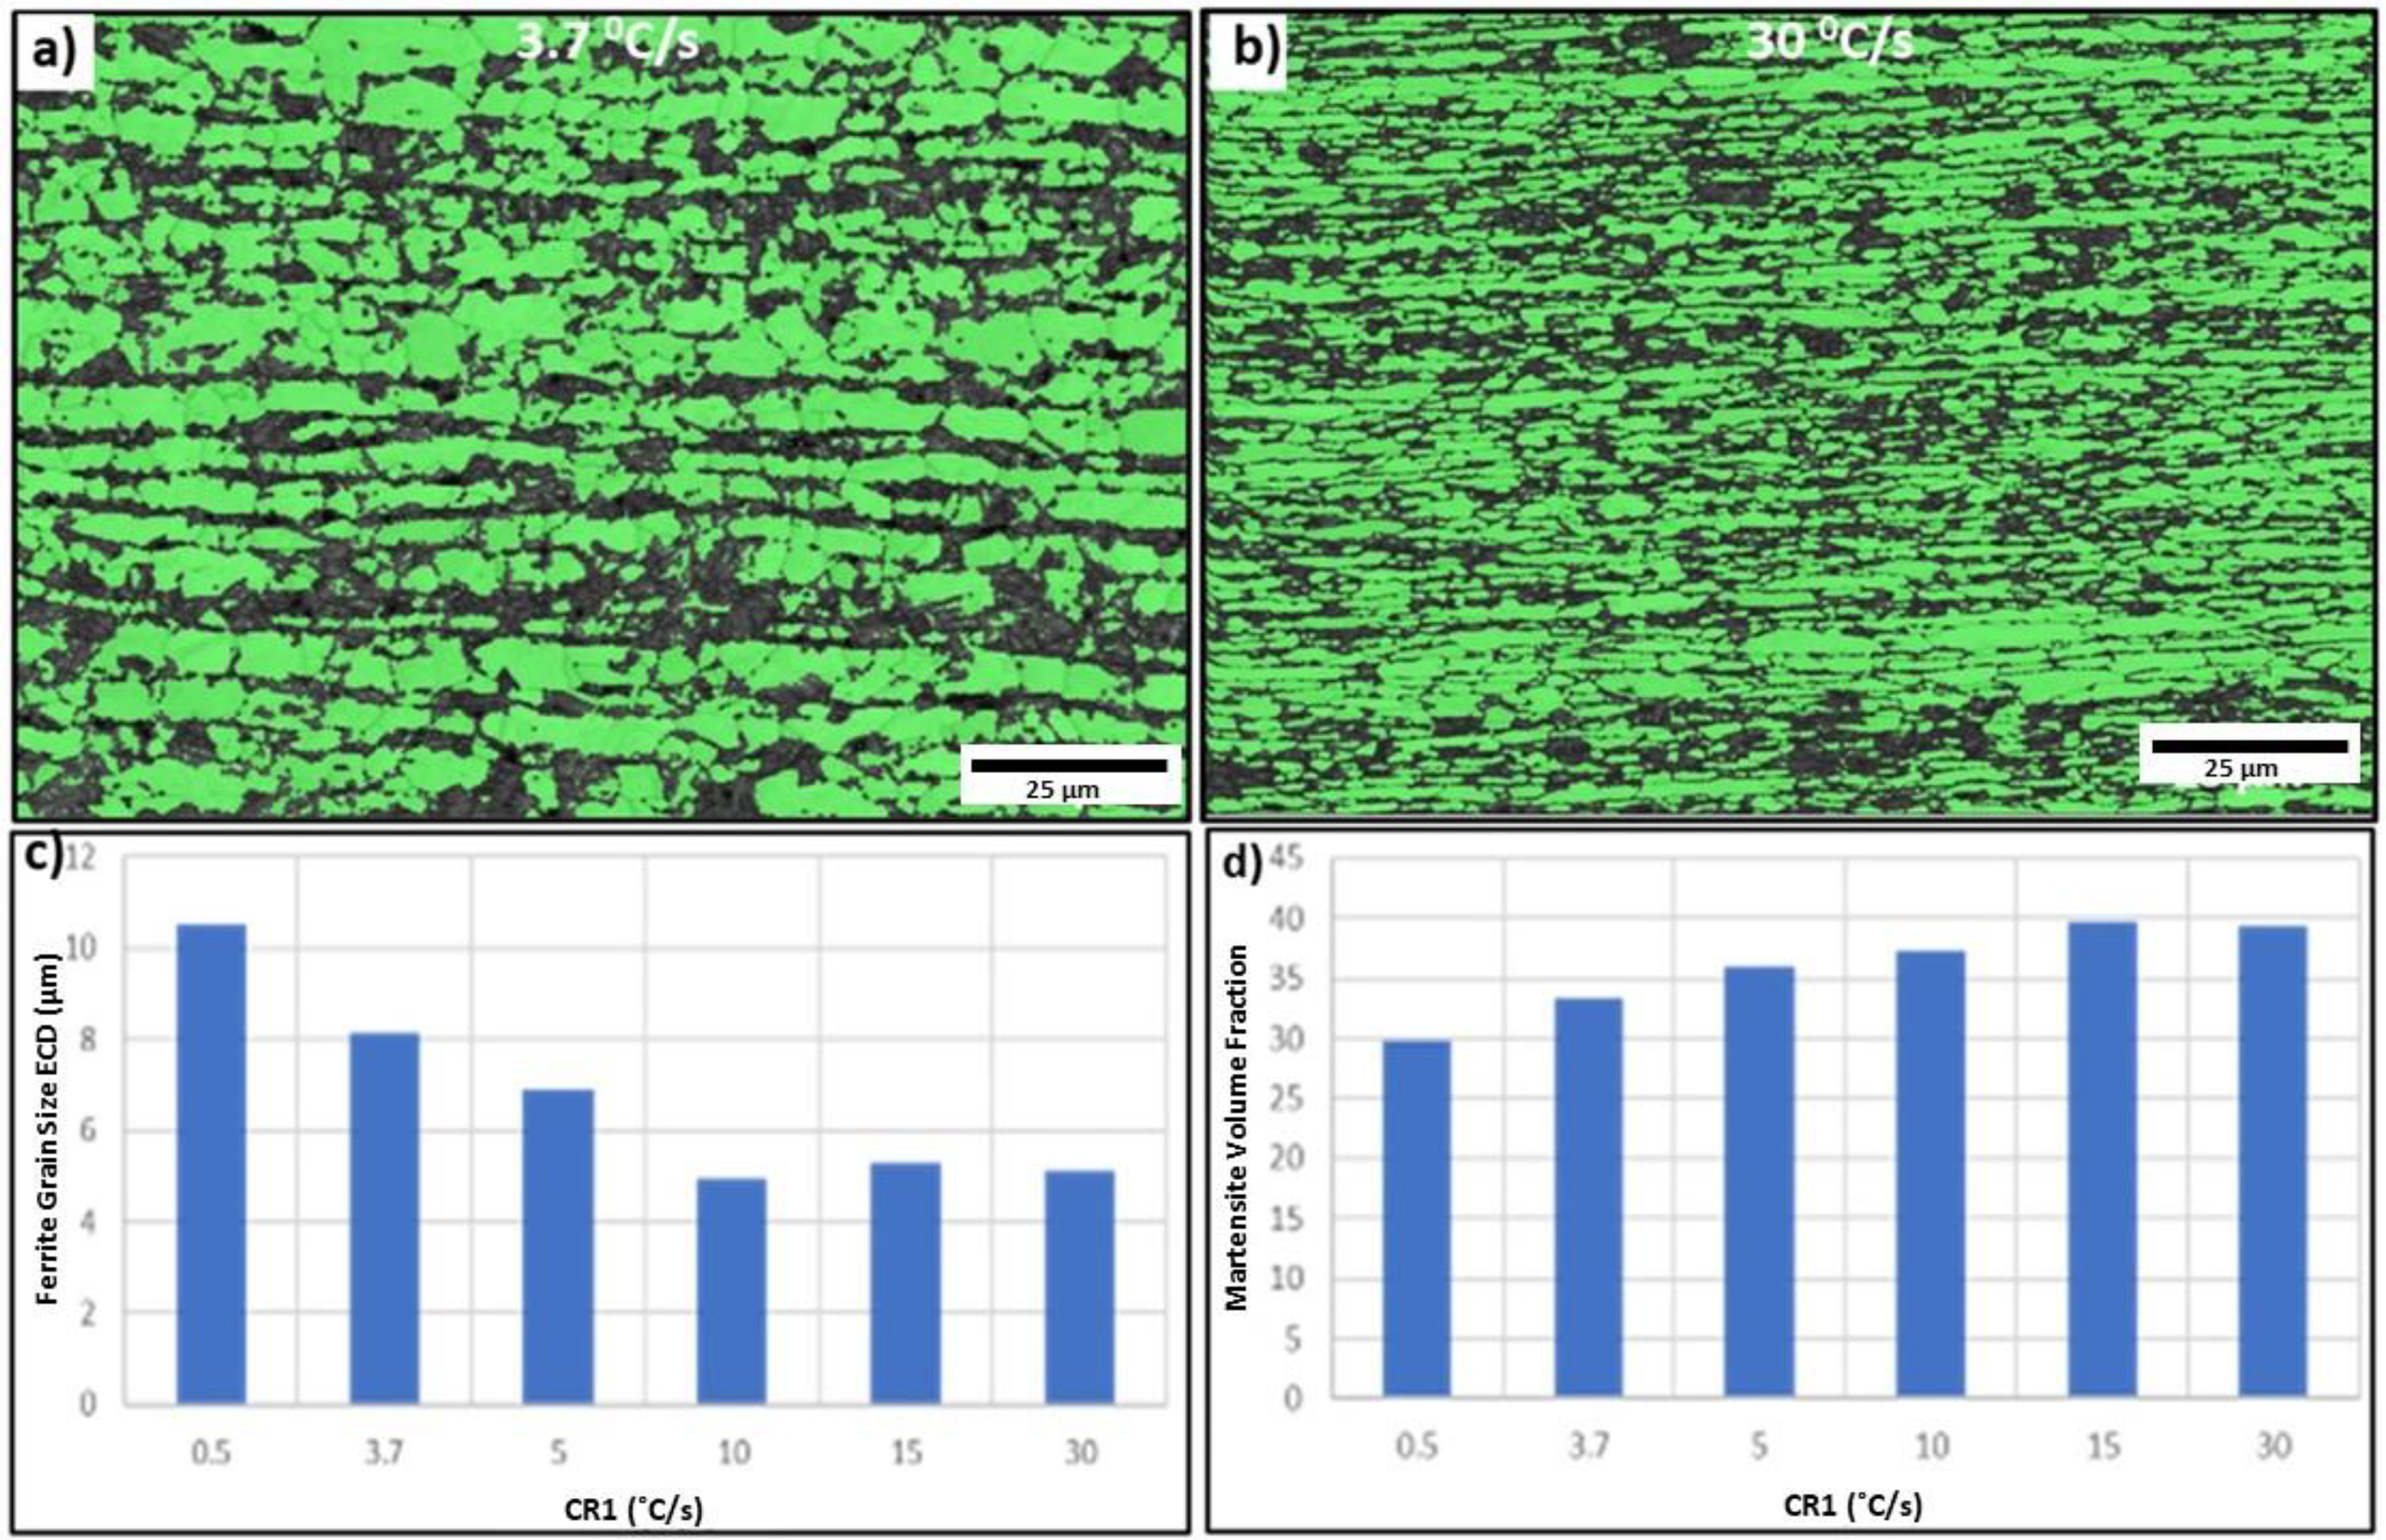
(a, b) Electron back-scattered diffraction detector (EBSD) phase classification maps of samples heat treated at 4 °C s−1 and 30 °C s−1, respectively; (c, d) effect of cooling rate on the ferrite grain size, and martensite volume fraction.
Figure 5(c) shows the effect of CR1 on the ferrite grain size. With an increase in CR1, the ferrite grain size significantly decreased. This can be attributed to the fact that with the increasing cooling rate, the driving force for nucleation and the number of nucleating sites increases. Therefore, this will limit the growth of ferrite grains. Figure 5(e) shows the effect of CR1 on the martensite volume fraction. The martensite volume fraction increased with the cooling rate. However, this increase in martensite volume fraction (34% to 38%) is not significantly high when compared to the effect of austenite soaking temperature above the Ac3 sample.
From these results, it can be concluded that the increase in CR1 is beneficial in terms of producing a finer ferrite grain size. However, it should be noted that the hold time at the ferrite soaking temperature (standard value of 2 s) is important for controlling the martensite volume fraction of 35% in the case of DP800 steel. Figure 6(a) and (b) shows the SEM micrographs of samples heat treated with cooling rates of 30 °C s−1 and 60 °C s−1, respectively, with no holding time at 635 °C. The martensite volume percentages were found to be 48 ± 4 and 76 ± 11%, respectively. This shows that the hold time at a temperature where significant ferrite transformation occurs is required, in this case, 635 °C, such that a consistent and desired martensite fraction is formed for DP800 steel.
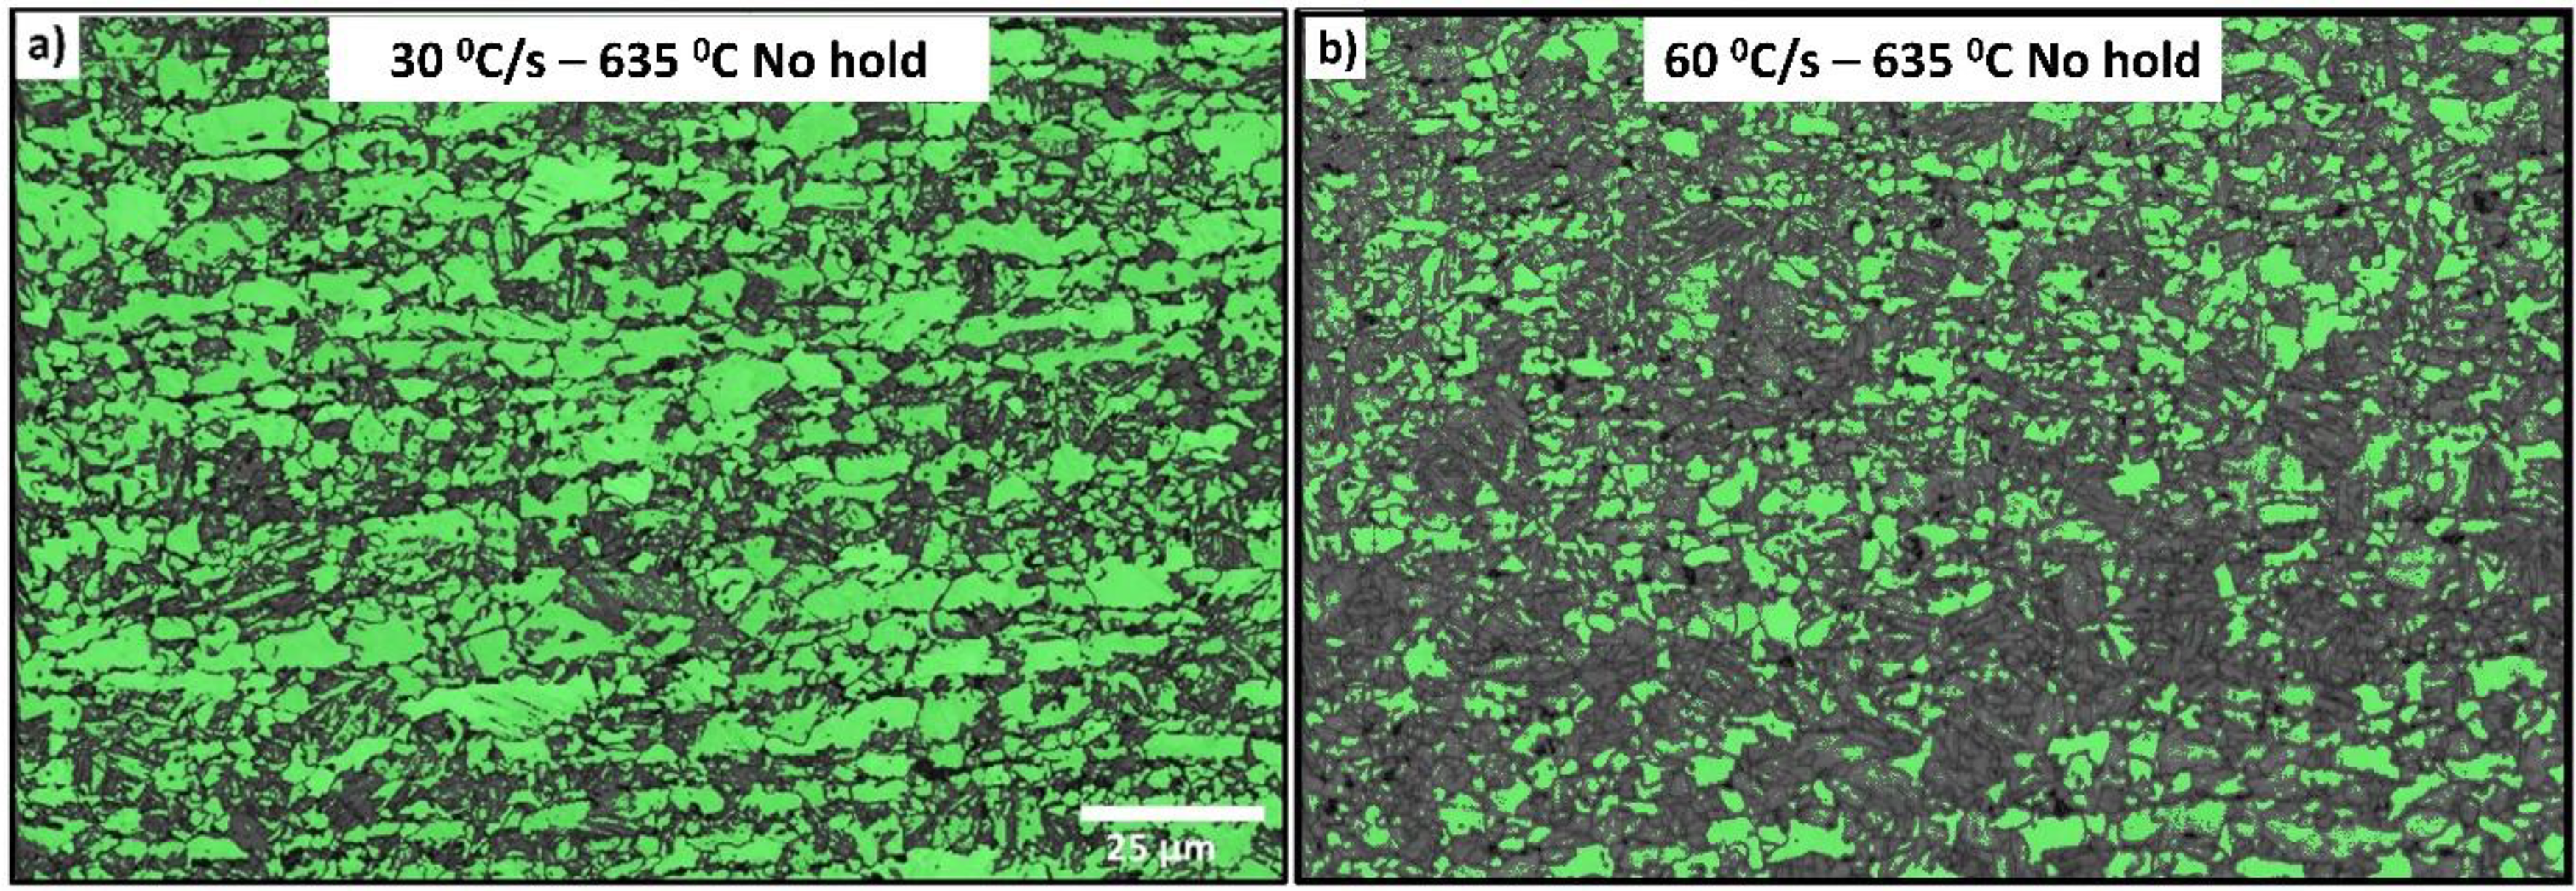
(a, b) EBSD phase classification maps of samples heat treated at cooling rates of 30 °C s−1 and 60 °C s−1 (CR1), respectively, with no holding times at 635 °C.
Figure 7(a) shows the EBSD phase classification maps of the sample annealed at an FST of 680 °C (compared to the ‘standard’ value of 635 °C) for 2 s. The martensite volume percentage and ferrite grain size were found to be 45 ± 3% and 8 µm, respectively. The increase in the ferrite soaking temperature will decrease the driving force for ferrite formation (reduced undercooling) and therefore is expected to result in a lower ferrite fraction/higher martensite fraction. Figure 7(b) and (c) shows the EBSD phase classification maps for samples annealed at the ‘standard’ ferrite soaking temperature of 635 °C with the ‘standard’ holding time of 2 s and a longer hold of 30 s. The martensite volume percentages for the 2 and 30 s samples were found to be 34 ± 3 and 32 ± 5%, respectively, whereas the ferrite grain sizes were found to be 8.4 and 10.3 µm, respectively. The increase in the ferrite soak time did not change the martensite fraction significantly; however, the increase in soak time did increase the ferrite grain size significantly. This can be attributed to grain growth of the ferrite grains with minimum further austenite consumption.
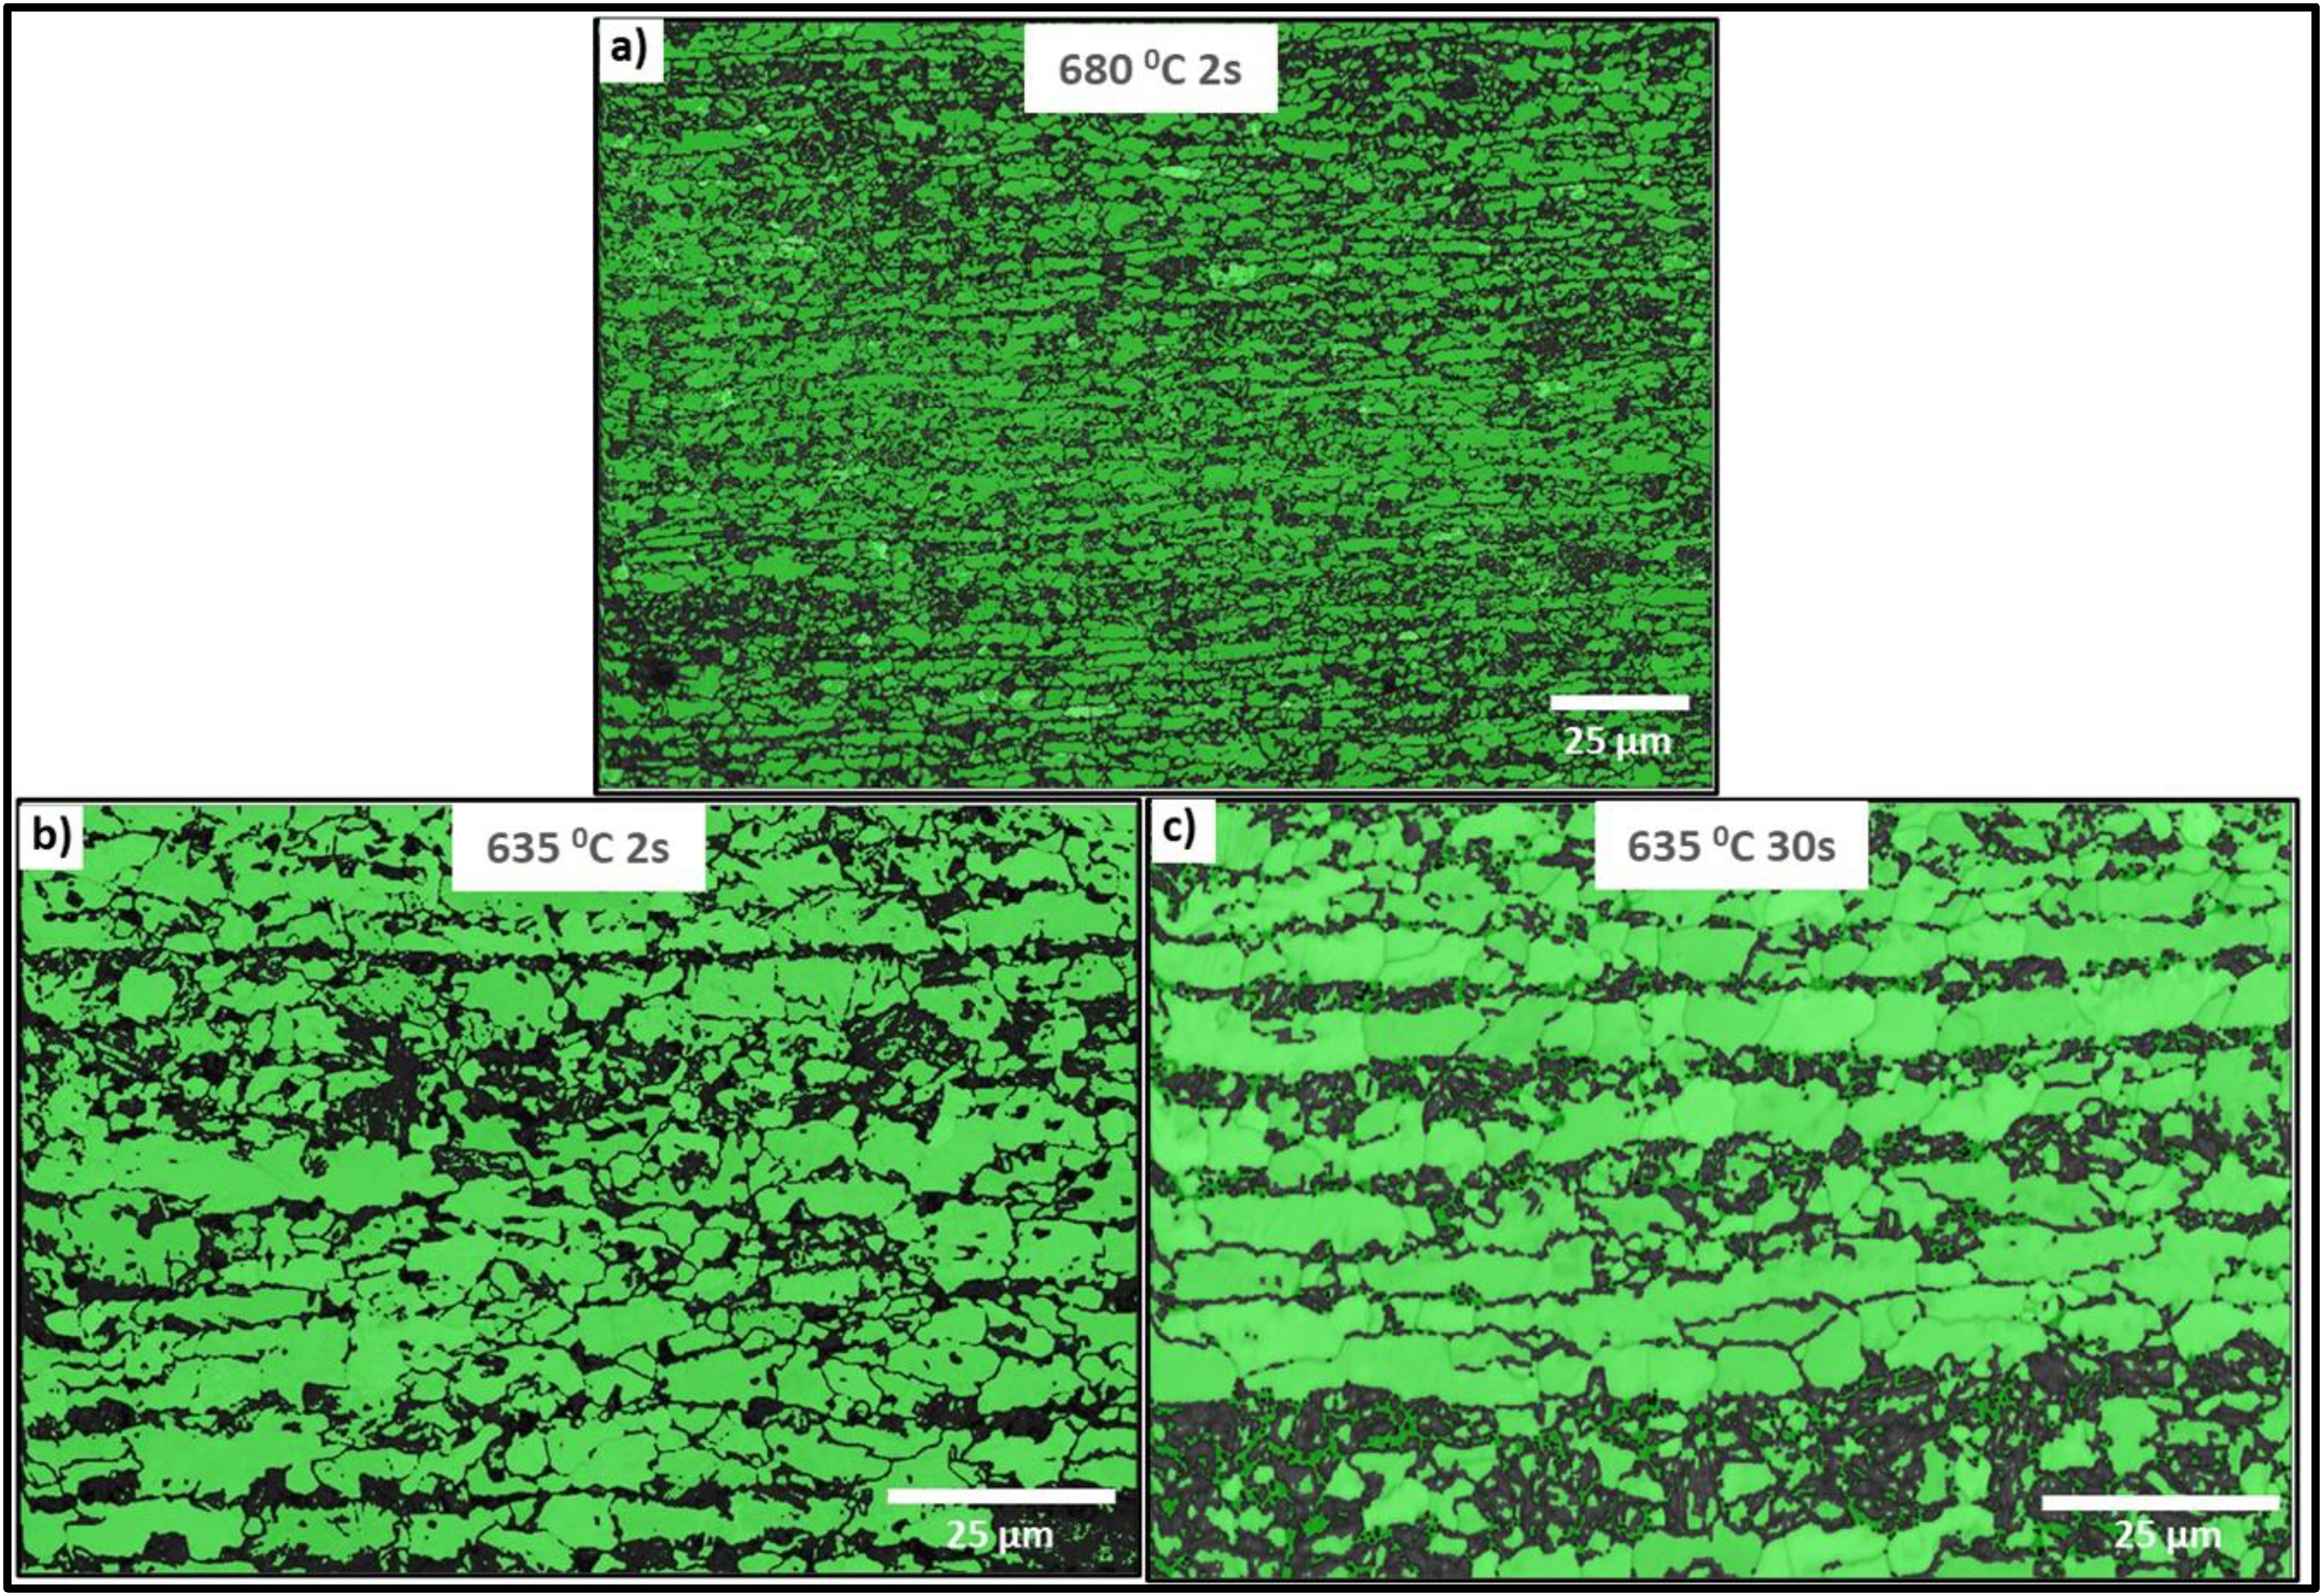
(a, b, c) Electron back-scattered diffraction detector (EBSD) phase classification maps of samples annealed at ferrite soaking 8temperature and time of 680 °C and 2 s, 635 °C and 2 s, and 635 °C and 30 s, respectively.
Effect of over-aging (OA) temperature
The changes the OA temperature has on the microstructure are much more subtle and influence the type of second phase or the tempering response to martensite and so have been assessed additionally through hardness. Figure 8 shows the variation in hardness values (HV2) with changes in the over-aging temperature with SEM microstructures of samples annealed at over-aging temperatures of 250 °C, 350 °C, and 500 °C. It should be noted that the ferrite phase fraction and grain size of all the samples must be similar to the parameters before the over-aging temperature is the same for all the samples. The variation in hardness values is caused by variations in the type and amount of each second phase present in the microstructure. The micrographs show that at the over-aging temperature of 250 °C, the microstructure mainly contains ferrite, tempered martensite, and untempered martensite. Whereas, for the sample with an over-aging temperature of 350 °C produced ferrite, and tempered martensite in the microstructure with a comparatively little amount of bainite and untempered martensite. However, the sample with an over-aging temperature of 500 °C produced ferrite, bainite, and a small amount of untempered martensite in the microstructure. It can be seen that the HV2 values initially decrease with the increase in the over-aging temperature, reach a minimum at 400 °C, and then start to increase with a further increase in the over-aging temperature. Initially, with the increase in over-aging temperature, the amount of carbon trapped in the martensite decreases as the amount of carbide formation increases with the increase in temperature. Moreover, as the temperature increases the amount of bainite increases. The secondary hardening observed above 400 °C is due to the presence of lower bainite as well as untempered martensite formed during final cool to room temperature. It should be noted that the presence of hard untempered martensite in the microstructure causes strain incompatibilities during loading causing premature failure. Therefore, the over-aging temperature should be chosen such that an optimum combination of hard and soft phases presents in the final microstructures to obtain a good combination of strength and ductility.
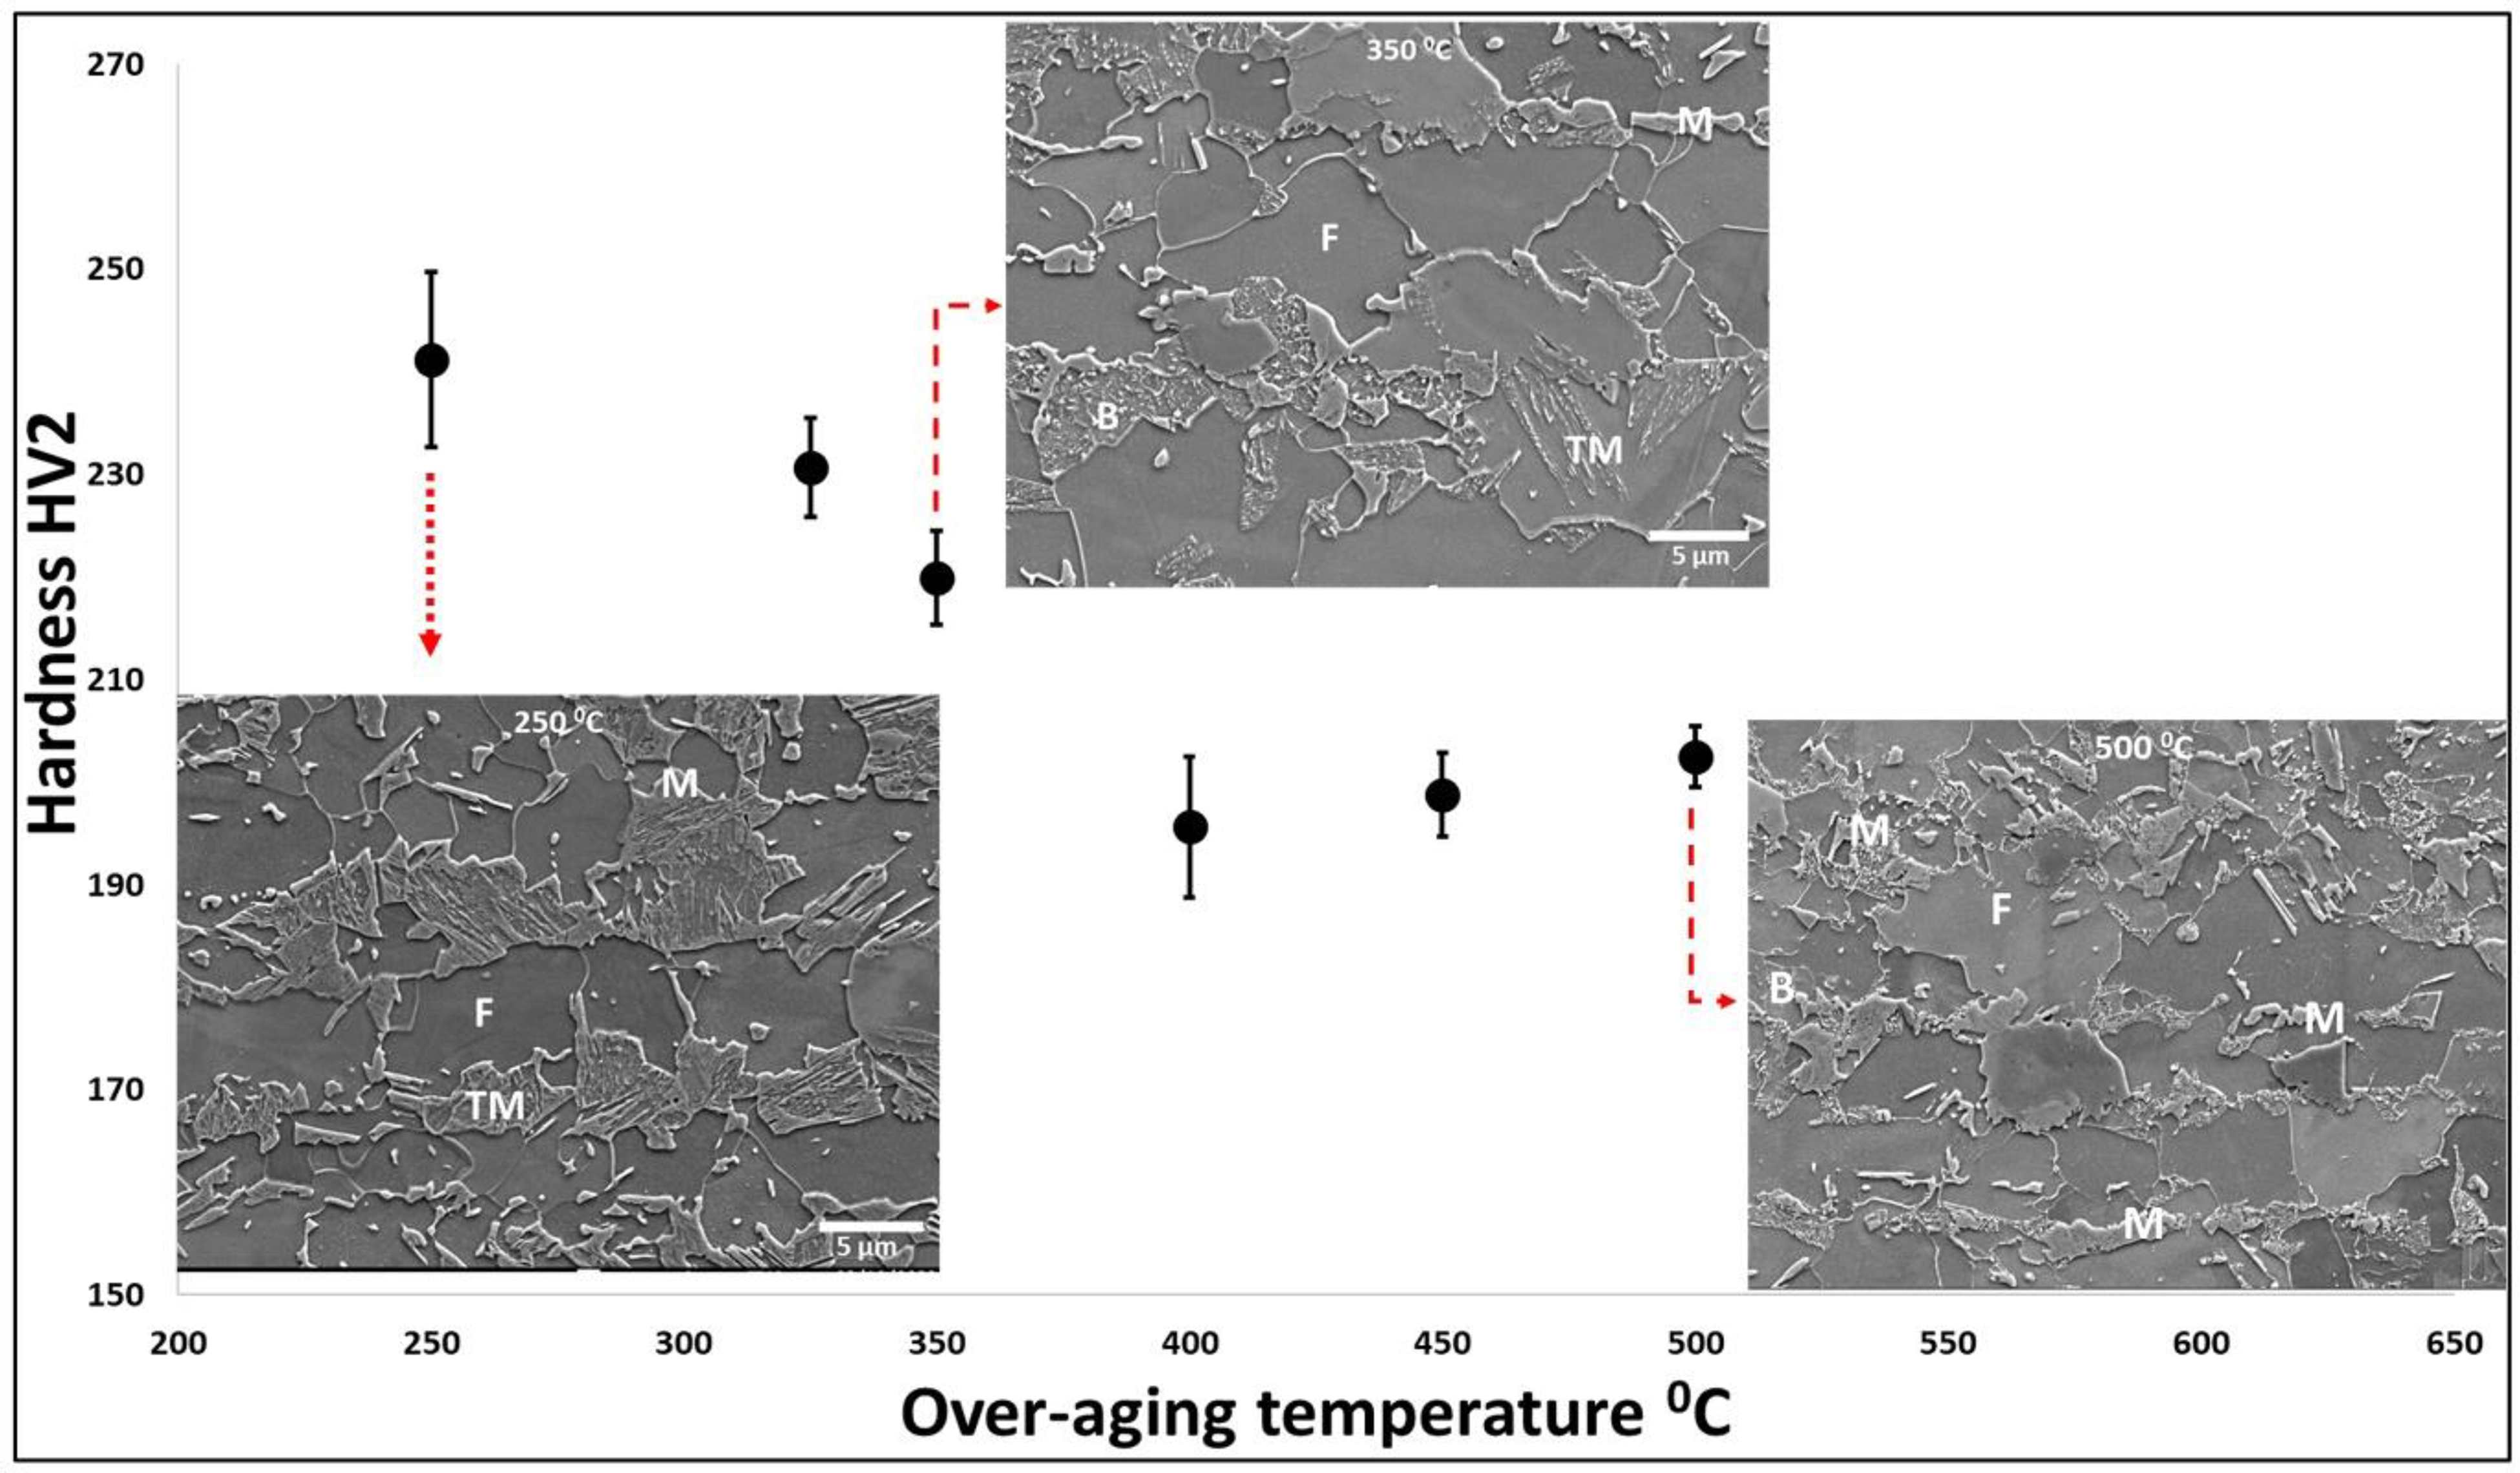
Effect of over-aging temperature on micro-hardness (HV2) measurements with scanning electron microscopy (SEM) microstructures of samples annealed at over-aging temperature of 250 °C, 350 °C and 500 °C.
Optimised CAL cycle
From the results obtained from the sensitivity study of the CAL parameters, the standard cycle is optimised. The target of the optimised CAL cycle is to obtain a final DP steel microstructure with reduced martensite banding, fine ferrite grain size and less untempered martensite. Figure 9(a) and (b) shows the time–temperature plots for standard and optimised CAL. The main modifications include an increase in austenite soaking temperature above Ac3 temperature, an increase in cooling rate of the slow cooling stage, a corresponding increase in soak time at ferrite soaking temperature and an increase in over-aging temperature.
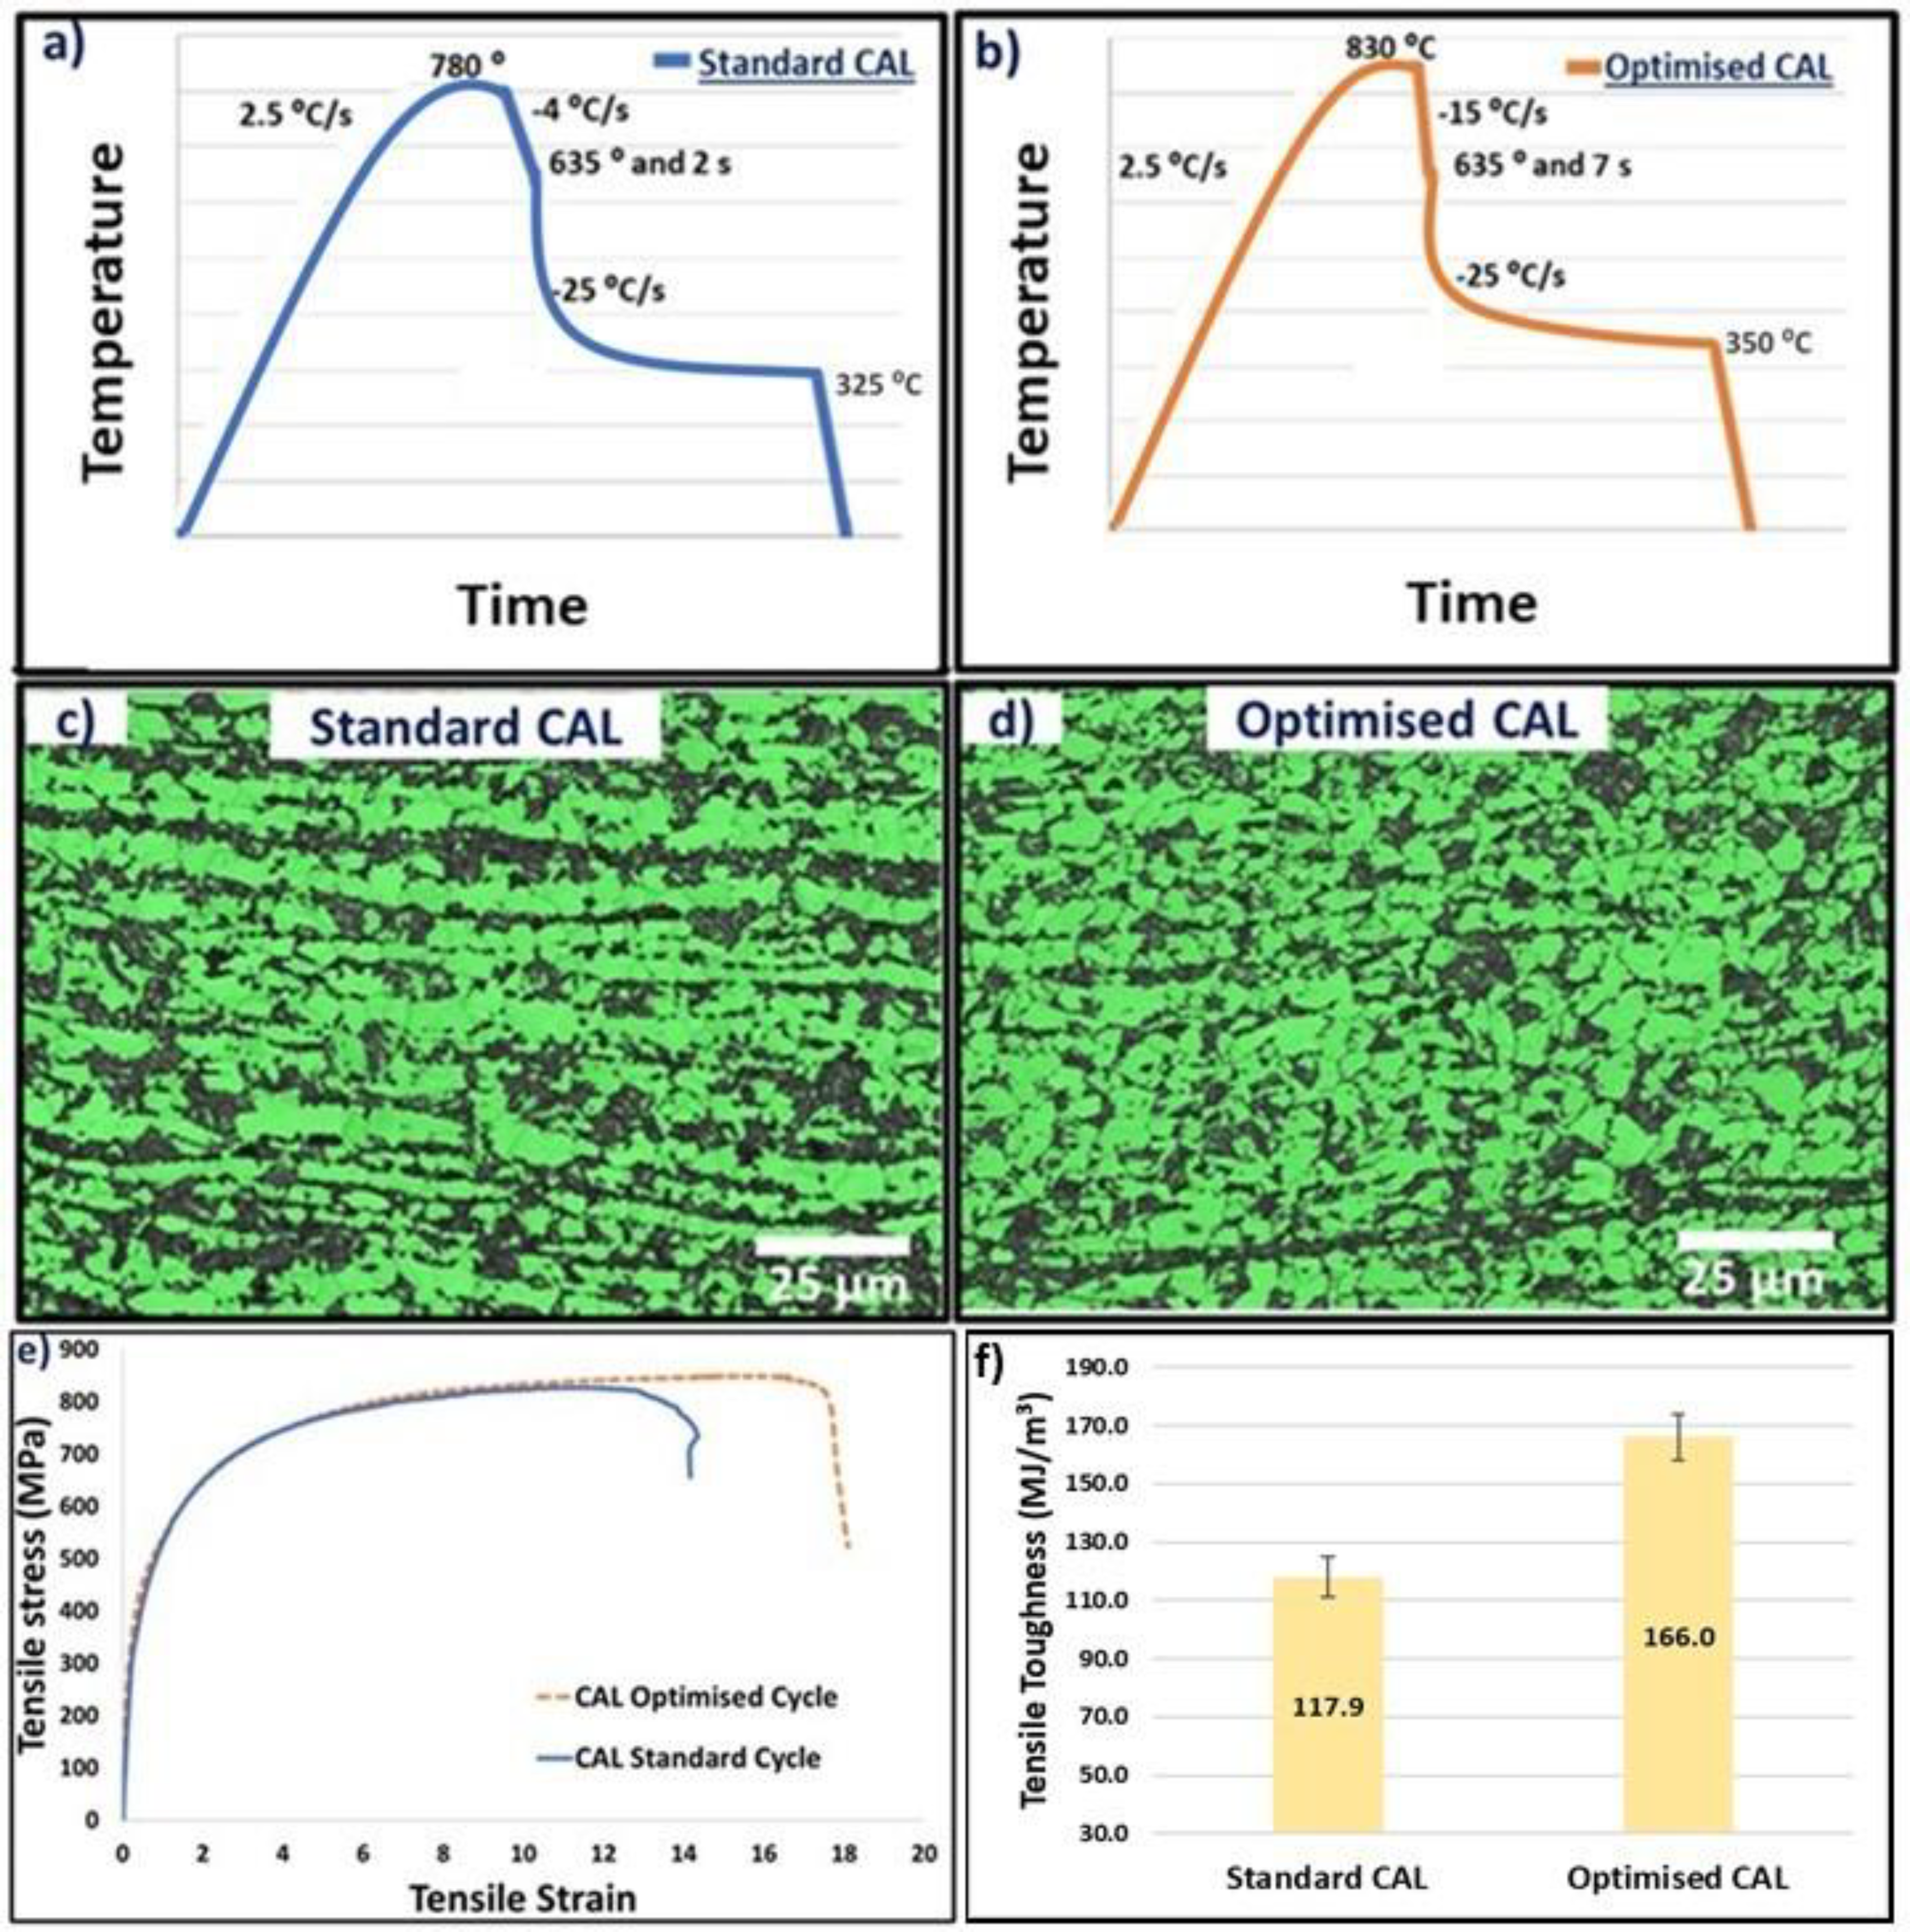
(a, b) Time–temperature plots for standard CAL cycle and optimised CAL cycle respectively, (c, d) EBSD phase classification maps of samples annealed using standard CAL cycle and optimised CAL cycle, respectively, (e) comparison of stress–strain tensile curves of samples annealed using standard CAL cycle and optimised CAL cycle, (f) comparison of tensile toughness values of samples annealed using standard CAL cycle and optimised CAL cycle.
Figure 9(c) and (d) shows the EBSD phase classification maps of samples annealed using the standard CAL cycle and optimised CAL cycle, respectively. The ferrite grain size for samples annealed using the standard CAL cycle and the optimised CAL cycle were found to be 8.4 and 5.1 µm, respectively. Whereas the martensite phase fraction was found to be similar at around 35% for both samples. From the microstructures, it can be clearly seen that the severity of banding has significantly decreased for the sample annealed using the optimum cycle. Figure 9(e) shows the comparison of stress–strain tensile curves of samples annealed using the standard CAL cycle and optimised CAL cycle. Table 3 shows the comparison of tensile properties of standard and optimised CAL samples. From these results, it can be seen that the optimised CAL cycle produced better mechanical properties than the standard CAL cycle. The yield strength, tensile strength and total elongation of the samples annealed using the standard cycle were found to be 375 ± 14 MPa, 789 ± 21 MPa, and 15 ± 3%, respectively. Whereas the yield strength, tensile strength and total elongation of the samples annealed using the optimum cycle were found to be 381 ± 11 MPa, 831 ± 14 MPa, and 20 ± 2%, respectively. The tensile toughness (tensile strength multiplied by total elongation) was calculated to be 117.9 ± 7 and 166 ± 9 MJ m−3, respectively (Figure 9(f)). 31 Therefore, the optimum cycle produced a higher amount of elongation (ductility) with a slight increase in strength. The fine ferrite grain size and reduced martensite banding in the microstructure decrease the strain incompatibilities between soft and hard phases during loading. This decreases the decohesion mechanism between ferrite and martensite phases and thereby decreases the void coalescence during plastic deformation causing an increase in elongation before fracture to failure.32,33
Tensile properties of standard and optimised CAL samples.
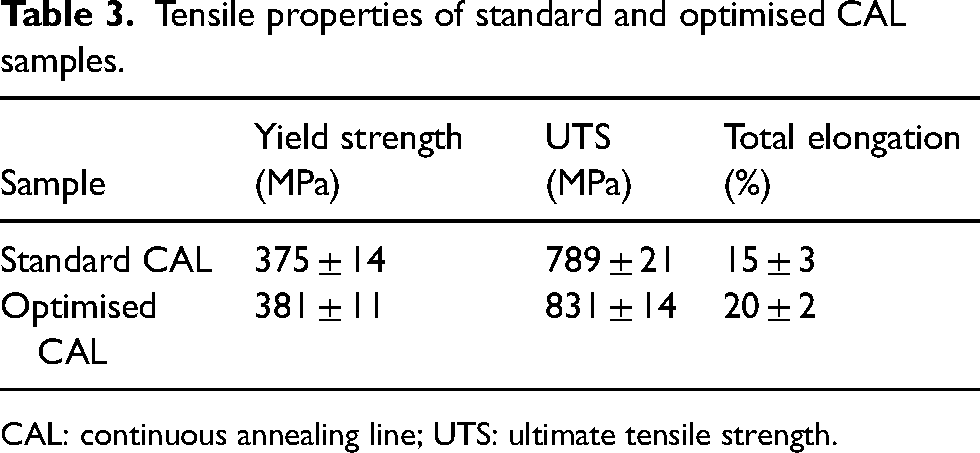
CAL: continuous annealing line; UTS: ultimate tensile strength.
Conclusions
In this work, the sensitivity of CAL parameters of DP800 manufacturing was done using a rapid alloy processing approach. Using the sensitivity study results, an optimised CAL cycle was proposed. It should be noted that the quantitative observations in this study are primarily applicable to the specific CAL used in this study. However, the general trends and conceptual understanding derived from this study will be valid for similar CALs of DP steel manufacture. The following are the main conclusions of the study:
An increase in soaking temperature above Ac3 temperature is beneficial as it causes ferrite grain refinement and less banding. The heating rate (0.65 °C s−1 to 30 °C s−1) has no significant effect on the samples annealed above Ac3 temperature (840 °C), producing microstructures with minimum variation. An increase in cooling rate (CR1) (−4 °C s−1 to 30 °C s−1) decreases the ferrite grain size at relatively similar martensite volume fractions. An increase in ferrite soaking temperature significantly increases the martensite fraction and an increase in ferrite soaking time significantly increases the ferrite grain size at similar phase fractions. For the CAL used in this study, an increase in over-aging temperature from 250 °C to 400 °C decreased the hardness value and then secondary hardening was observed above 400 °C. The optimised CAL cycle produced microstructure with reduced martensite banding and with a decrease in ferrite grain size from 8.4 and 5.1 µm. This resulted in an increase in tensile strength from 789 ± 21 to 831 ± 14 MPa and an increase in total elongation from 15 ± 3% to 20 ± 2%. There is potential for further improvement in the mechanical properties of this steel with full multi-parameter optimisation.
Footnotes
Acknowledgements
The authors would like to highlight the contributions of Dr Bin Xiao and Dr Richard Underhill in their insightful knowledge, as well as the support of Dr Stephen Hewitt and Dr Geoff West for their support in the rapid alloy processing at Warwick.
Declaration of conflicting interests
The authors declared no potential conflicts of interest with respect to the research, authorship, and/or publication of this article.
Funding
The authors disclosed receipt of the following financial support for the research, authorship, and/or publication of this article: This work was supported by the EPSRC (grant number EP/S005218/1).