
Abstract
Hot compression tests of low carbon (0.055C) and medium carbon (0.37C) V-microalloyed steels were carried out in the temperature of 900∼1100 C° and strain rate of 0.005∼10 s–1. The influence of carbon on thermal deformation behaviour and deformation/diffusion mechanism of V-microalloyed steel was studied by three physical constitutive models based on creep theory. It is found that the increase of carbon content has softening effect at low strain rate, but hardening effect at high strain rate. Different carbon content may lead to changes in deformation/diffusion mechanism of V-microalloyed steel. The deformation mechanism of 0.37C steel is dislocation climb, while other deformation mechanism may appear in 0.055C steel. The diffusion mechanism of 0.055C steel is mainly lattice diffusion, while that of 0.37C steel is a synergistic mechanism of lattice diffusion and grain boundary diffusion. The accuracy analysis of the models is consistent with the inferred results of deformation/diffusion mechanism.
Keywords
Introduction
V-microalloyed steel is widely used in petroleum, automobile and other machinery industries. Through controlled rolling, good comprehensive properties such as strength, toughness, formability and weldability can be obtained at a lower cost. 1 The flow stress is one of the basic properties of V-microalloyed steel during thermal deformation, which is important not only in the formulation of hot working process but also in the study of hot working theory. Therefore, it is of great significance to study the variation of flow stress and to establish the constitutive model of V-microalloyed steel during high temperature deformation.
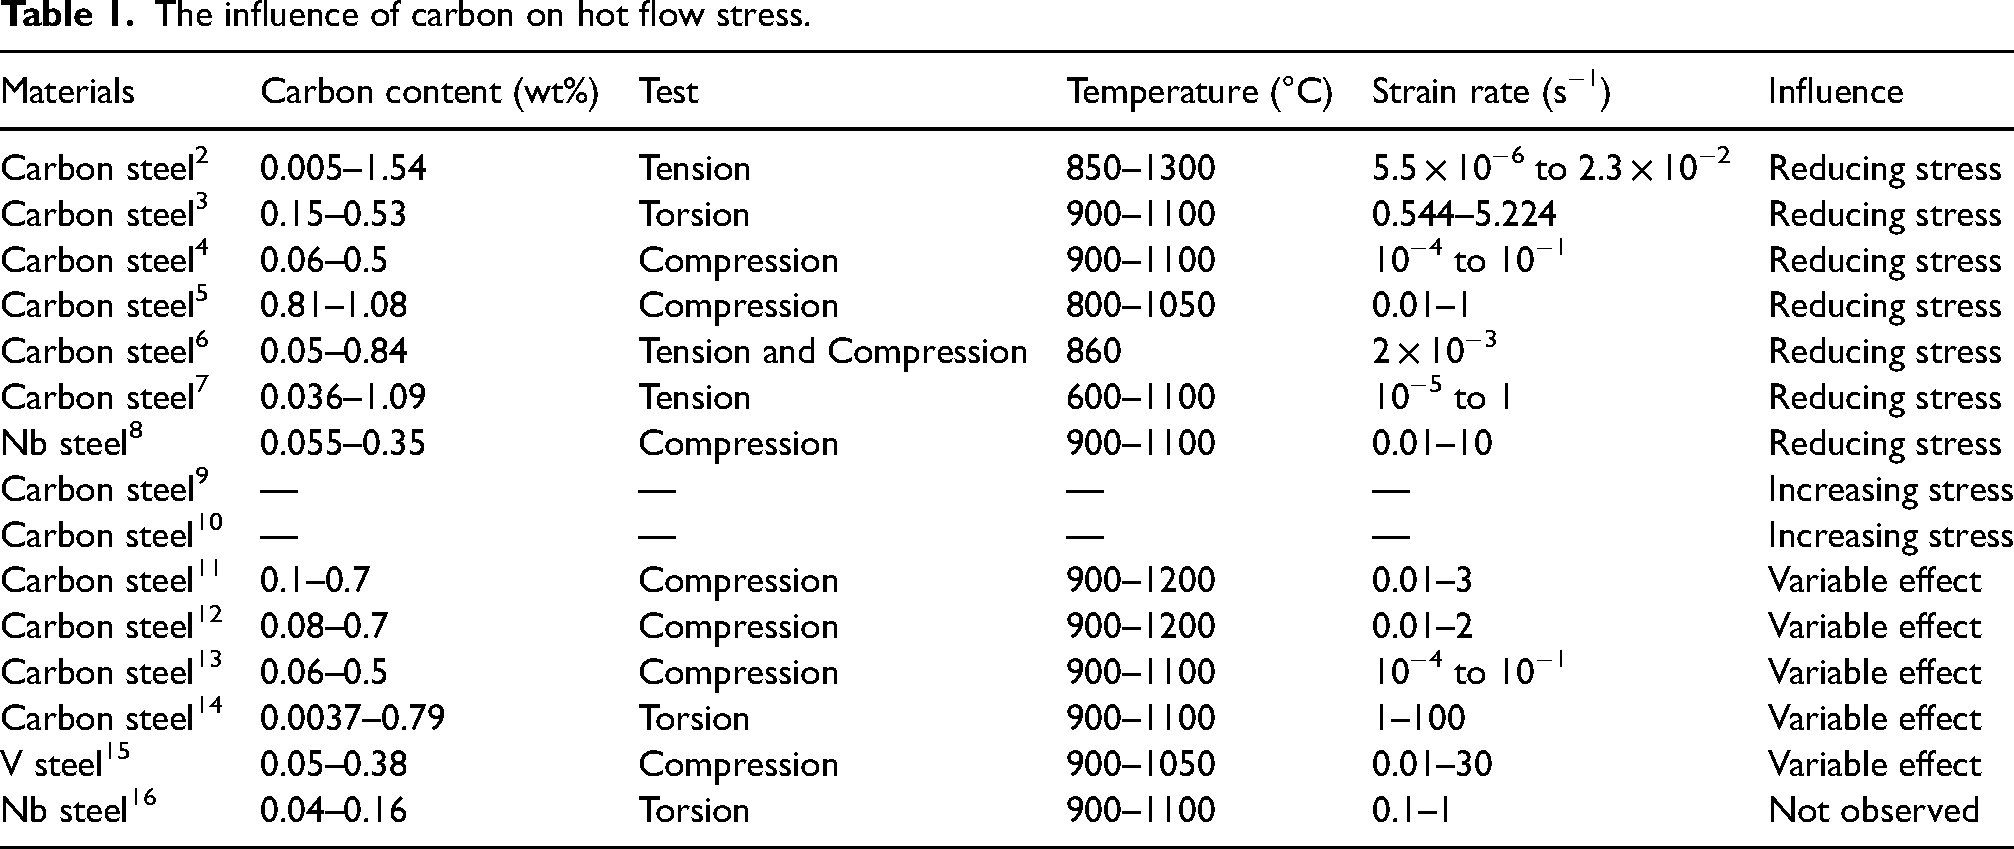
Chemical composition is one of the most important factors affecting the flow stress of steels, and carbon is an essential element in V-microalloyed steel. However, most of the current research on the influence of carbon on hot flow stress is about plain carbon steels, few reports are focused on microalloyed steels, and no unified conclusion has been reached. Table 1 lists the results reported in the literature. The softening effect of carbon (reducing stress)2–8 and hardening effect of carbon (increasing stress)9,10 have been reported, while other studies have shown that the effect of carbon is variable (softening effect at high temperature and low strain rate, while hardening effect at low temperature and high strain rate)11–15 or the effect of carbon is not observed. 16
The influence of carbon on hot flow stress.
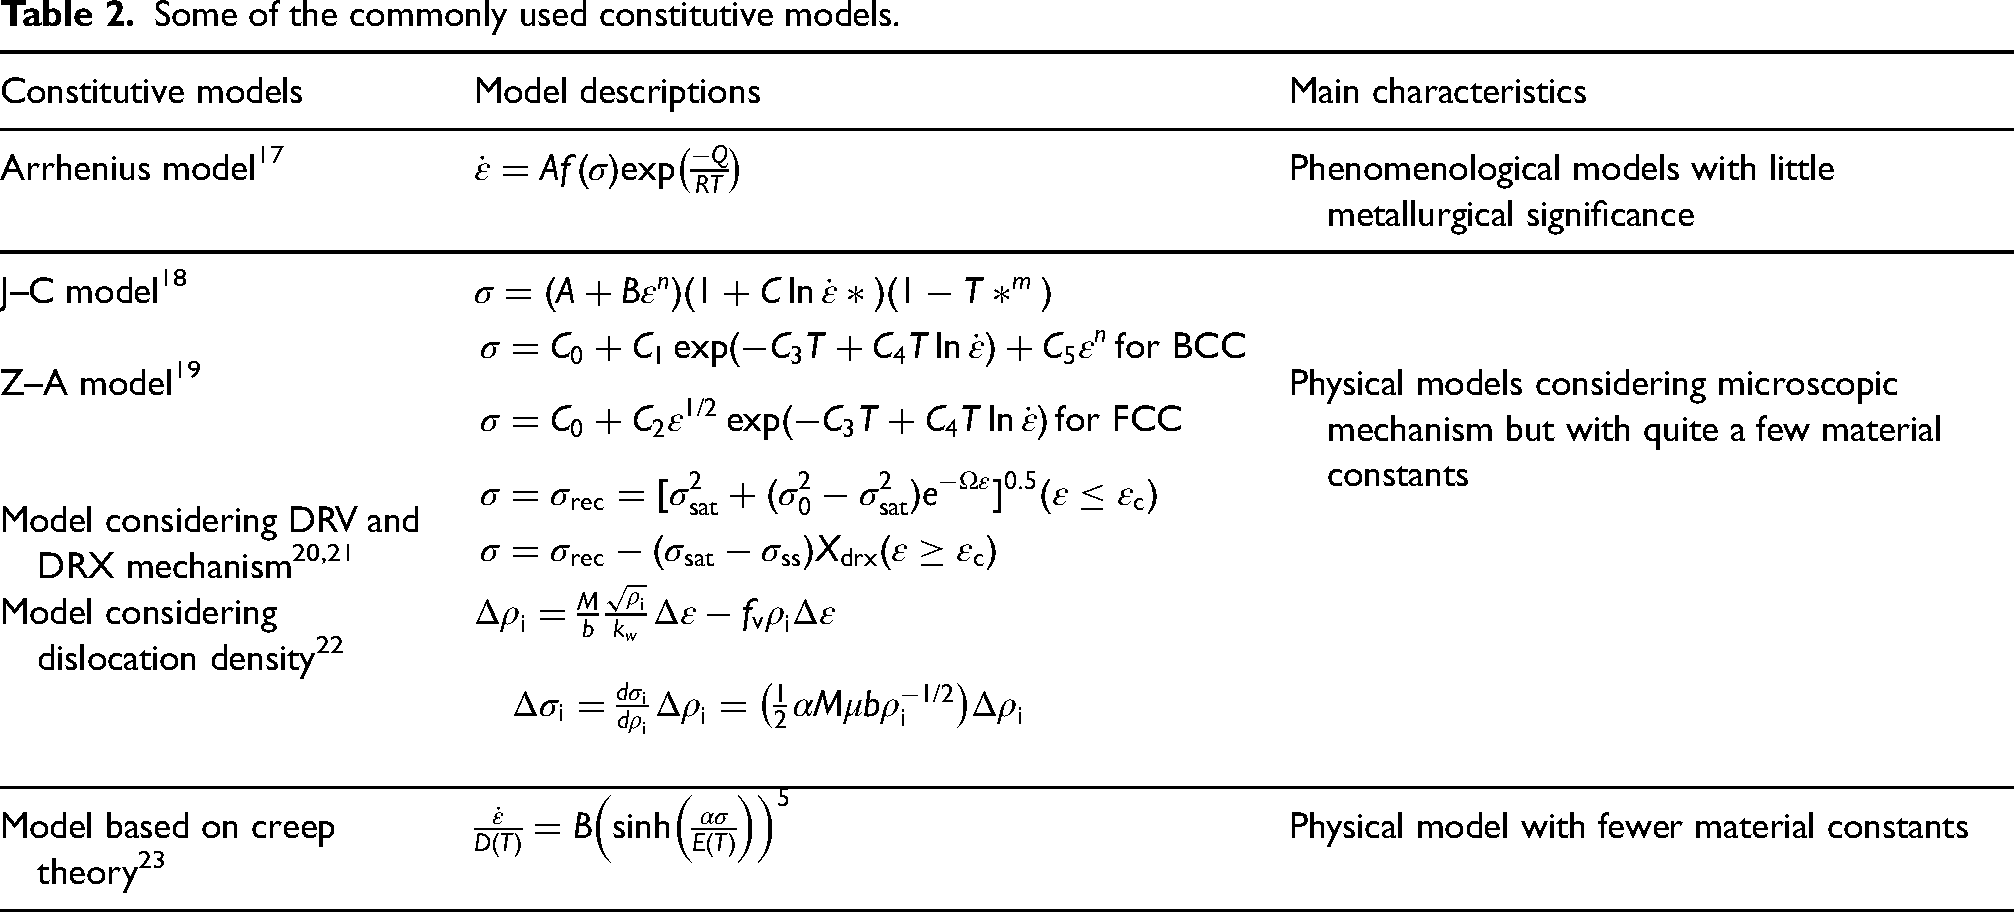
The constitutive model generally includes phenomenological model and physical model. Table 2 lists some commonly used constitutive models, and the description of the material constants in the models can refer to the corresponding literature. The Arrhenius model
17
and the Johnson–Cook (J–C) model
18
have been successfully applied to describe the thermal deformation behaviour of various materials. However, as phenomenological models, they have little metallurgical meaning and cannot reflect the microstructure evolution. Therefore, different physical constitutive models have emerged, such as Zerillii–Armstrong (Z–A) model,
19
model considering dynamic recrystallisation (DRX) and dynamic recovery (DRV) mechanism,20,21 model considering dislocation density,
22
etc. These models consider the microscopic mechanism of the material and contain quite a few material constants, so the calculation is relatively complicated. The physical constitutive model based on creep theory (Equation (1)) contains fewer material constants and has been successfully applied to stainless steel, plain carbon steel, aluminium alloy and magnesium alloy.23–29 Moreover, related researches have shown that it can be used to analyse the deformation and diffusion mechanisms of materials.30–33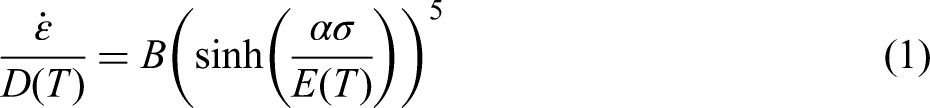
Some of the commonly used constitutive models.
At present, the influence of carbon on thermal deformation behaviour of V-microalloyed steel based on physical constitutive analysis has not been reported, nor has the influence of carbon on deformation/diffusion mechanism of V-microalloyed steel been studied. In this paper, the peak stress constitutive models and strain compensation constitutive models of low carbon and medium carbon V-microalloyed steels are studied and the influence of carbon on deformation/diffusion mechanism is discussed.
Experimental materials and methods
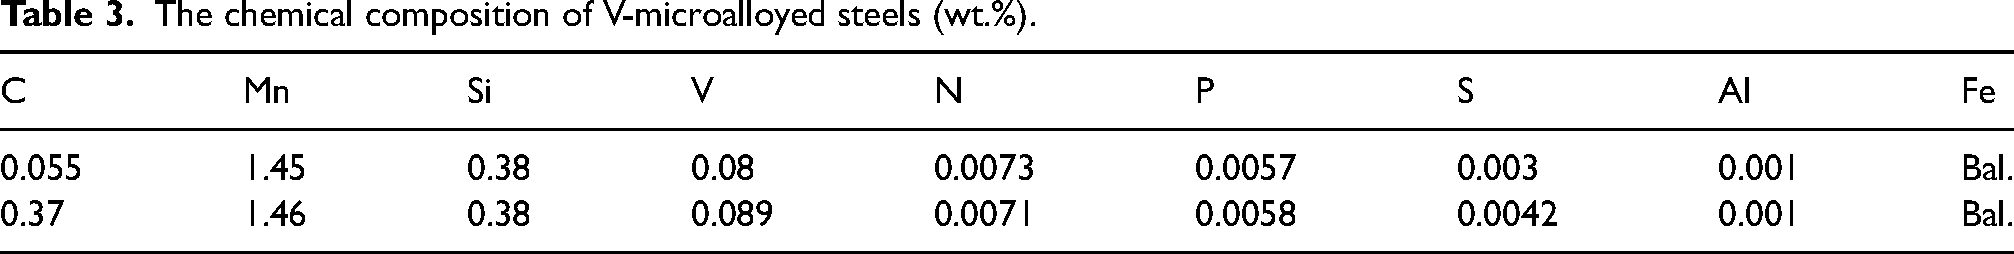
Table 3 shows the chemical composition of V-microalloyed steels. The steels were melted and casted into 50 kg ingots in vacuum induction furnace, and the ingots were hot forged into bars with a diameter of 20 mm, then the steels were heated to 900 °C, held for 30 min followed by air-cooling in order to refine the grains and homogenise the microstructure.
The chemical composition of V-microalloyed steels (wt.%).
The hot compression experiment of the experimental steels was carried out on a Gleeble-1500 thermal simulation testing machine, and the hot compression specimen was a cylinder of Ф8 × 15 mm. Before compression, the sample was heated to 1150 °C at a rate of 10 °C/s, kept for 5 min, and then cooled to the deformation temperature at a rate of 10 °C/s. The temperature range of thermal compression deformation was 900 to 1100 °C, with an interval of 50 °C, held at the deformation temperature for 30 s, and then the specimens were compressed to 60% engineering strain at strain rates of 0.01, 0.1, 1 and 10 s−1, respectively. After compression, the specimens were water-cooled to room temperature immediately.
Results and discussion
The influence of carbon on stress and strain
Figure 1 shows the hot compression stress–strain curves of 0.055C steel and 0.37C steel at 900 and 1000 °C with four different strain rates. At lower strain rates (0.005 and 0.1 s−1), the stress rises to the peak and then softens to a stable state, and the shape of the curve is a DRX curve. At this time, 0.055C steel has higher flow stress than 0.37C steel. However, the peak value on the stress–strain curve disappears at higher strain rates (1 and 10 s−1), and the curve is a DRV curve. In this case, 0.37C steel has higher flow stress than 0.055C steel. Therefore, it can be inferred that the influence of carbon on flow stress is variable, with softening effect at low strain rate and hardening effect at high strain rate.
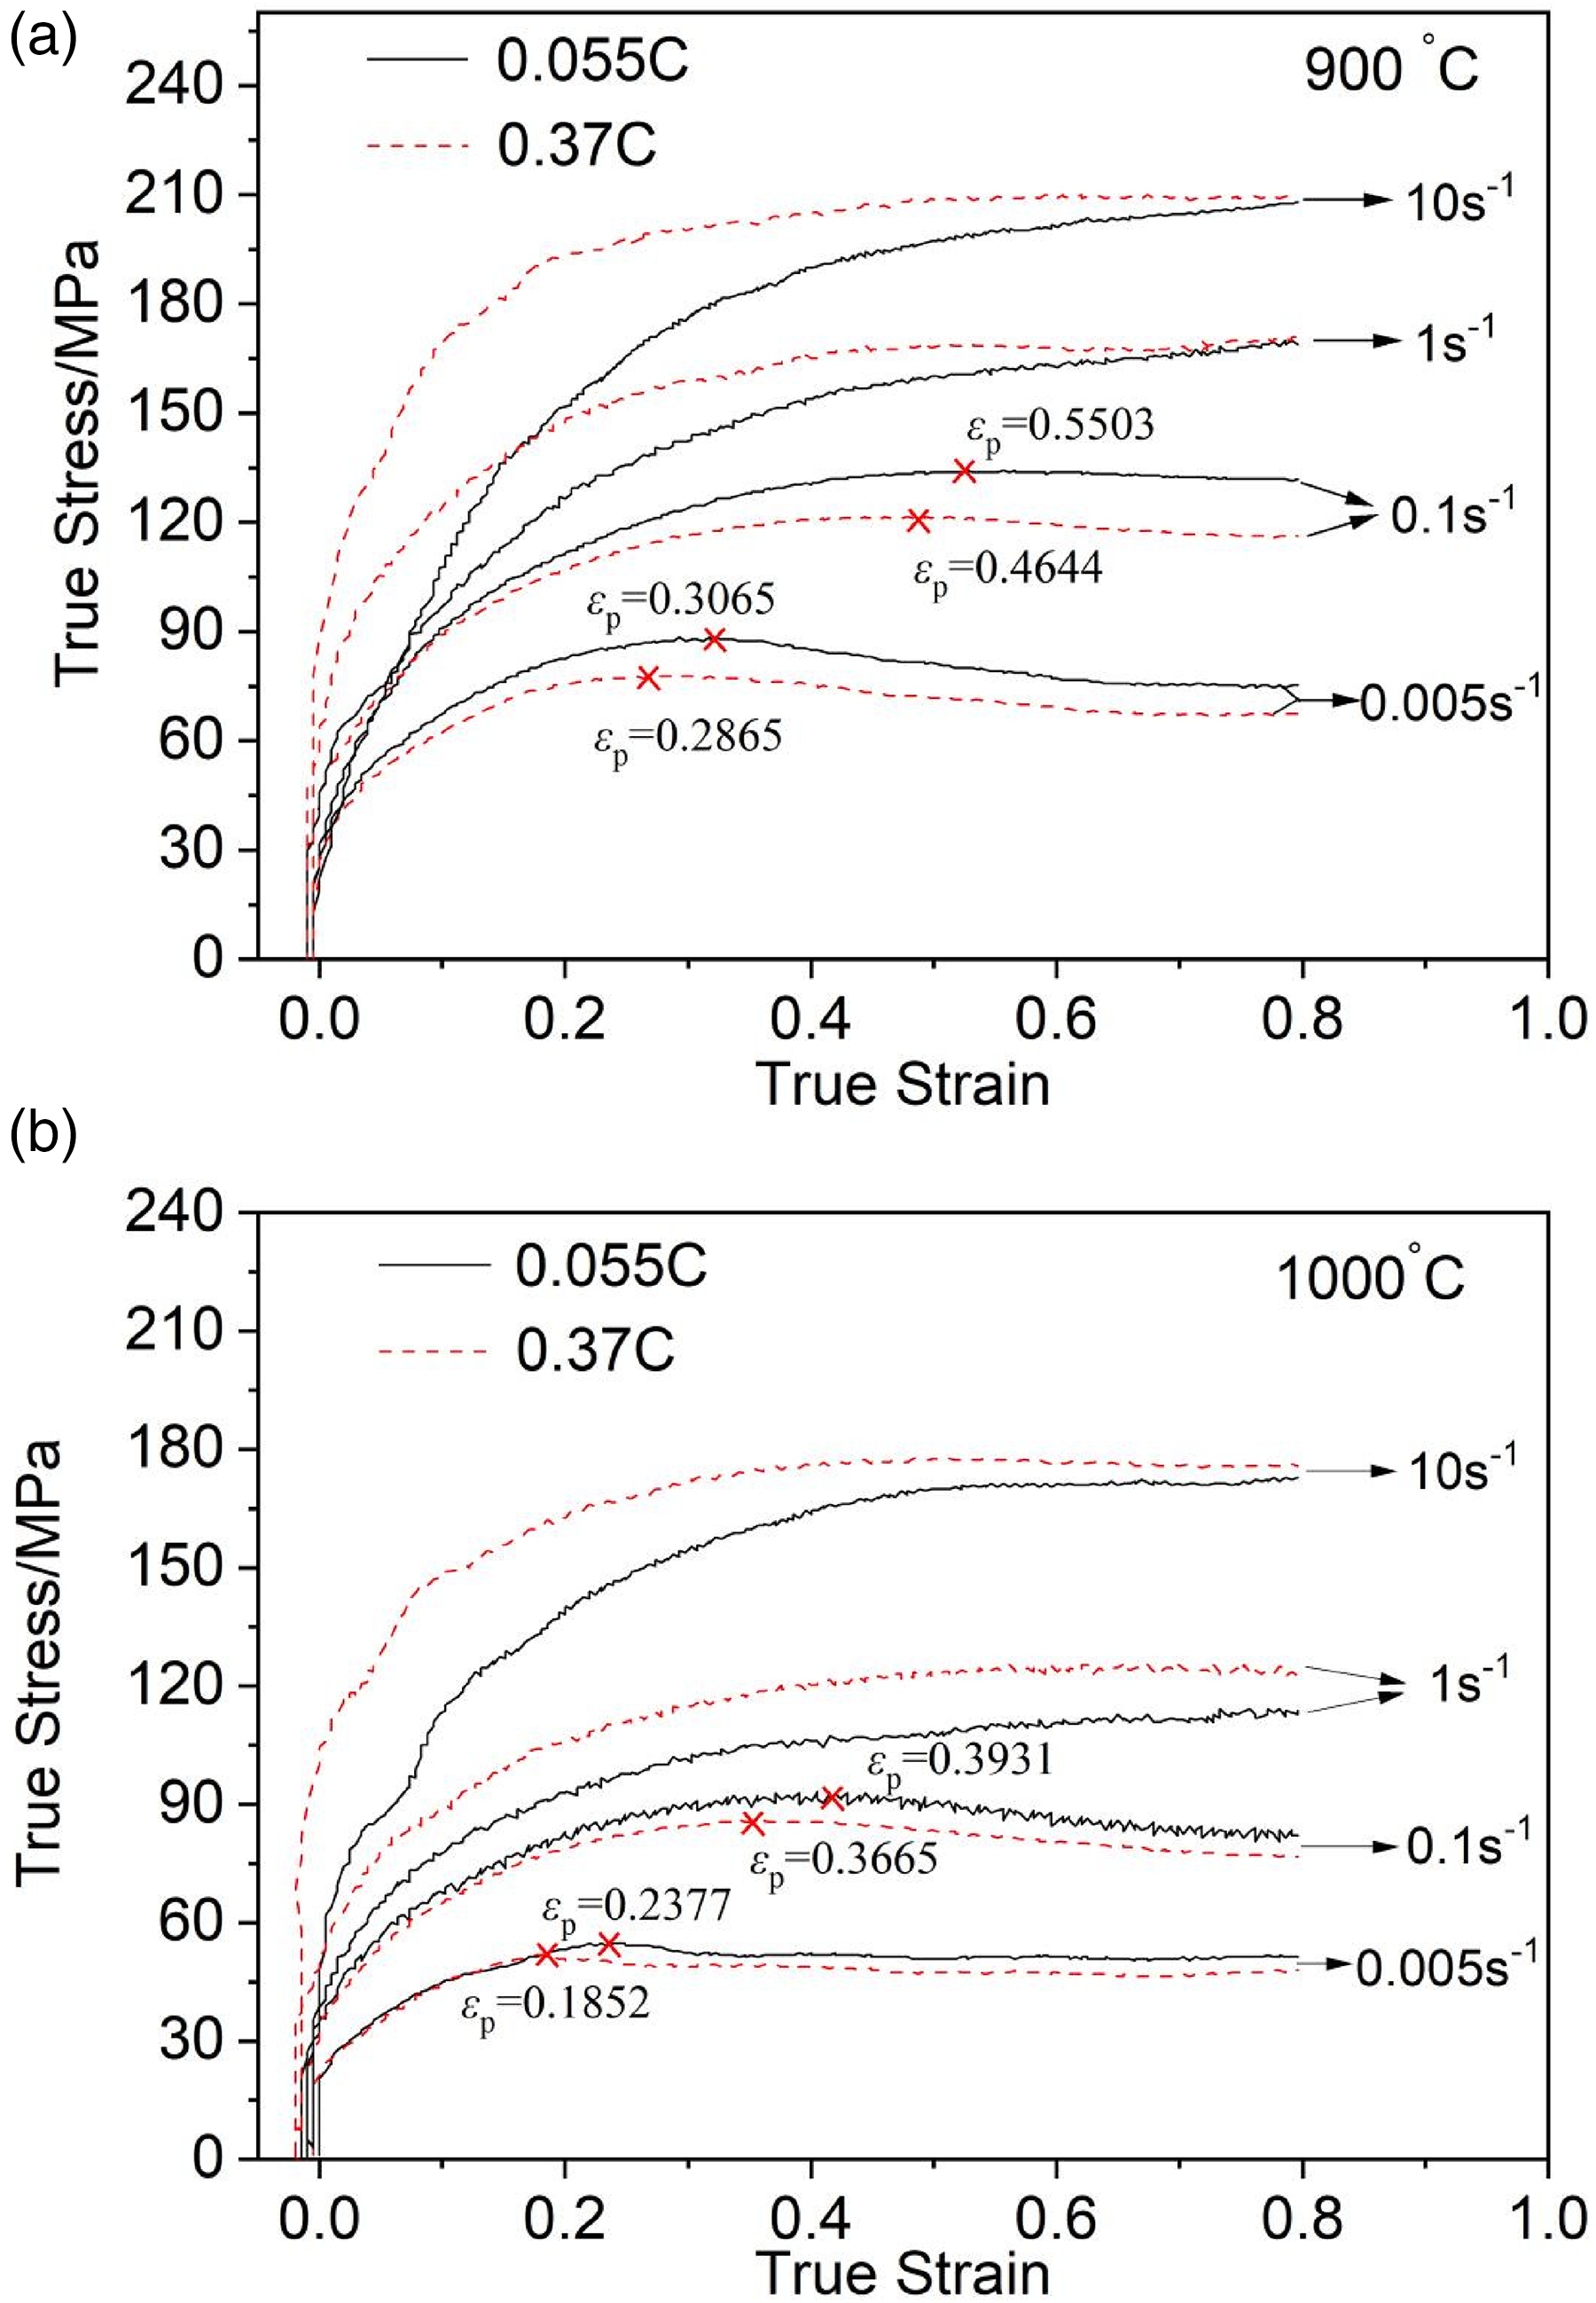
The stress–strain curves of V-microalloyed steels: (a) 900 °C; (b) 1000 °C.
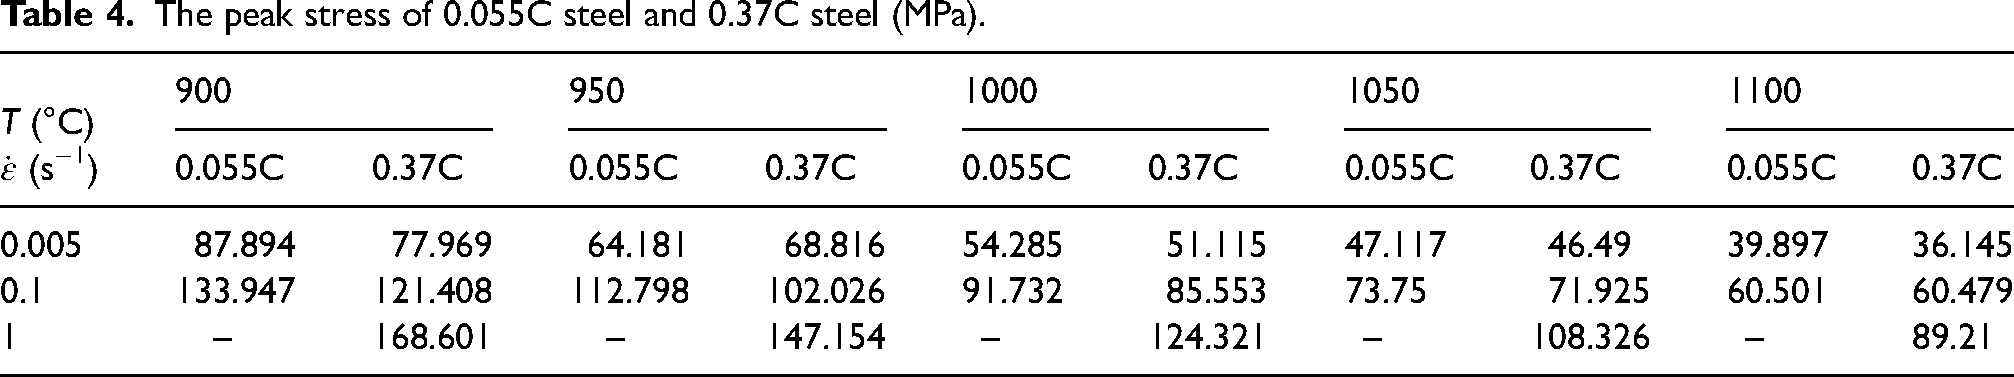
The peak stress (σp) of 0.055C and 0.37C steels was calculated by selecting the curve with obvious unimodal DRX characteristics, and the results are shown in Table 4. The data clearly show that the peak stress increases with increasing strain rate and decreases with increasing deformation temperature, and 0.055C steel has higher peak stress than 0.37C steel when deformed under the same condition.
The peak stress of 0.055C steel and 0.37C steel (MPa).
The peak strain (εp) is an important parameter, which can be used as a reference to predict whether DRX occurs. The curves at lower strain rates (0.005 and 0.1 s−1) have obvious unimodal DRX characteristics, marking the peak points and peak strain values in Figure 1. It is seen that 0.055C steel has higher peak strain than 0.37C steel under the same condition, indicating that the increase of carbon content promotes the occurrence of DRX. Consistent with this, several works have also shown that the addition of interstitial atoms such as carbon and boron can promote the initiation of DRX.34–36
As for the mechanism of carbon softening at lower strain rates, the current view is mainly related to diffusion. Sherby 37 suggested that the change in creep strength was related to the increase in iron self-diffusivity with increasing carbon content. The increase of self-diffusivity indicates that the bonds between atoms become weaker, and indeed, the austenite-iron lattice expands with the addition of carbon. 38 It is concluded that the hot deformation of carbon steel in γ phase is controlled by DRX process assisted by vacancy diffusion and σp decreases with the addition of carbon, the solution softening effect is caused by the increase of vacancy diffusivity and the enhancement of DRX process when carbon is added to γ phase. 7 Carbon is an interstitial atom in iron and has a high diffusivity, so it has little effect on high temperature dislocation behaviour, but increasing carbon content increases carbon diffusivity in iron, which may reduce any dislocation drag effect. 5 Wray 1 confirmed that the accelerated diffusion of iron in austenite led to a decrease in flow stress with increasing carbon content. Serajzadeh et al. 12 attributed the promoting effect of carbon on DRX to the increase of carbon diffusion rate in austenite. Due to the influence of carbon on lattice expansion, the self-diffusion rate of steel is increased, and thus the DRX rate and recovery rate in the diffusion control process are increased. Therefore, the increase of carbon content contributes to the diffusion process and promotes the DRX progress controlled by diffusion.
However, it can be seen from Figure 1 that when the strain rate increased to 1 and 10 s−1, 0.37C steel has higher flow stress than 0.055C steel, indicating that carbon has hardening effect at higher strain rates. Under these conditions, the addition of carbon can reduce the stacking fault energy (SFE) of the material, 39 thus reducing the dislocation mobility and DRV rate, resulting in increased stress.
Physical constitutive model considering lattice diffusion mechanism
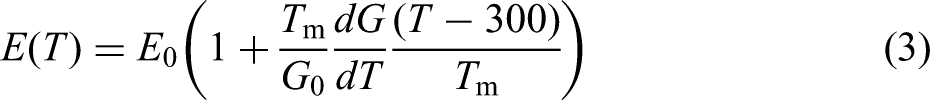
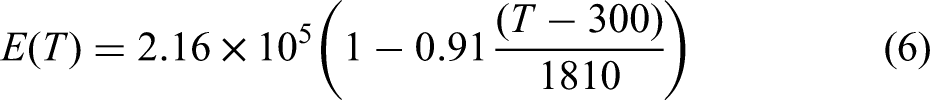
The self-diffusion coefficient and Young's modulus of the material can be written as: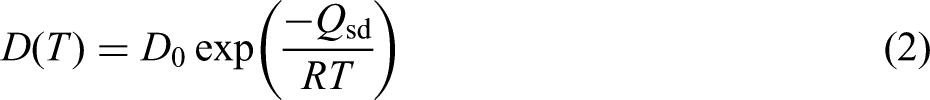
Usually, D(T) is set as the lattice diffusion coefficient. In this case, only the lattice diffusion mechanism of the material is considered, then: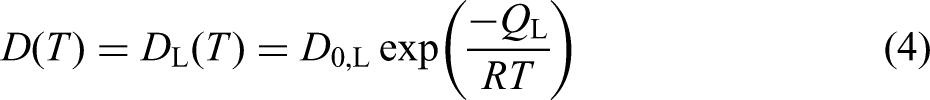
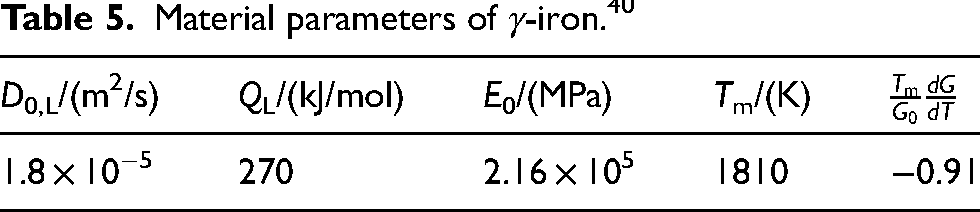
Table 5 shows various parameters of γ-iron in the above equations,
40
γ-iron is similar to the V-microalloyed steels, so the γ-iron parameters are used to obtain D(T) and E(T).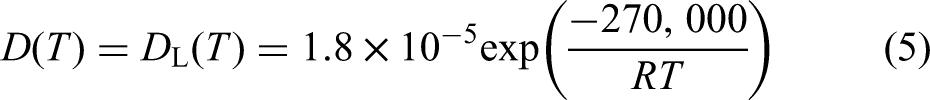
Material parameters of γ-iron. 40
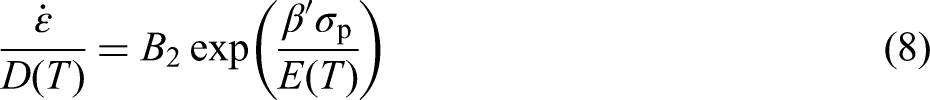
Physical constitutive model including exponential 5
Equation (1) is a physical constitutive equation including exponential 5, and the unknown parameters B and α in Equation (1) need to be determined. Using the linear regression method, Equations (7) and (8) are introduced, and σp is selected for analysis.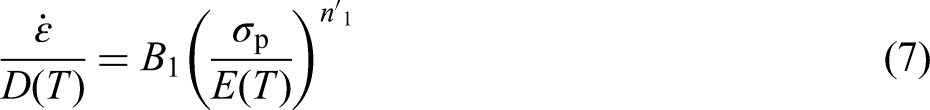
According to the above two equations,
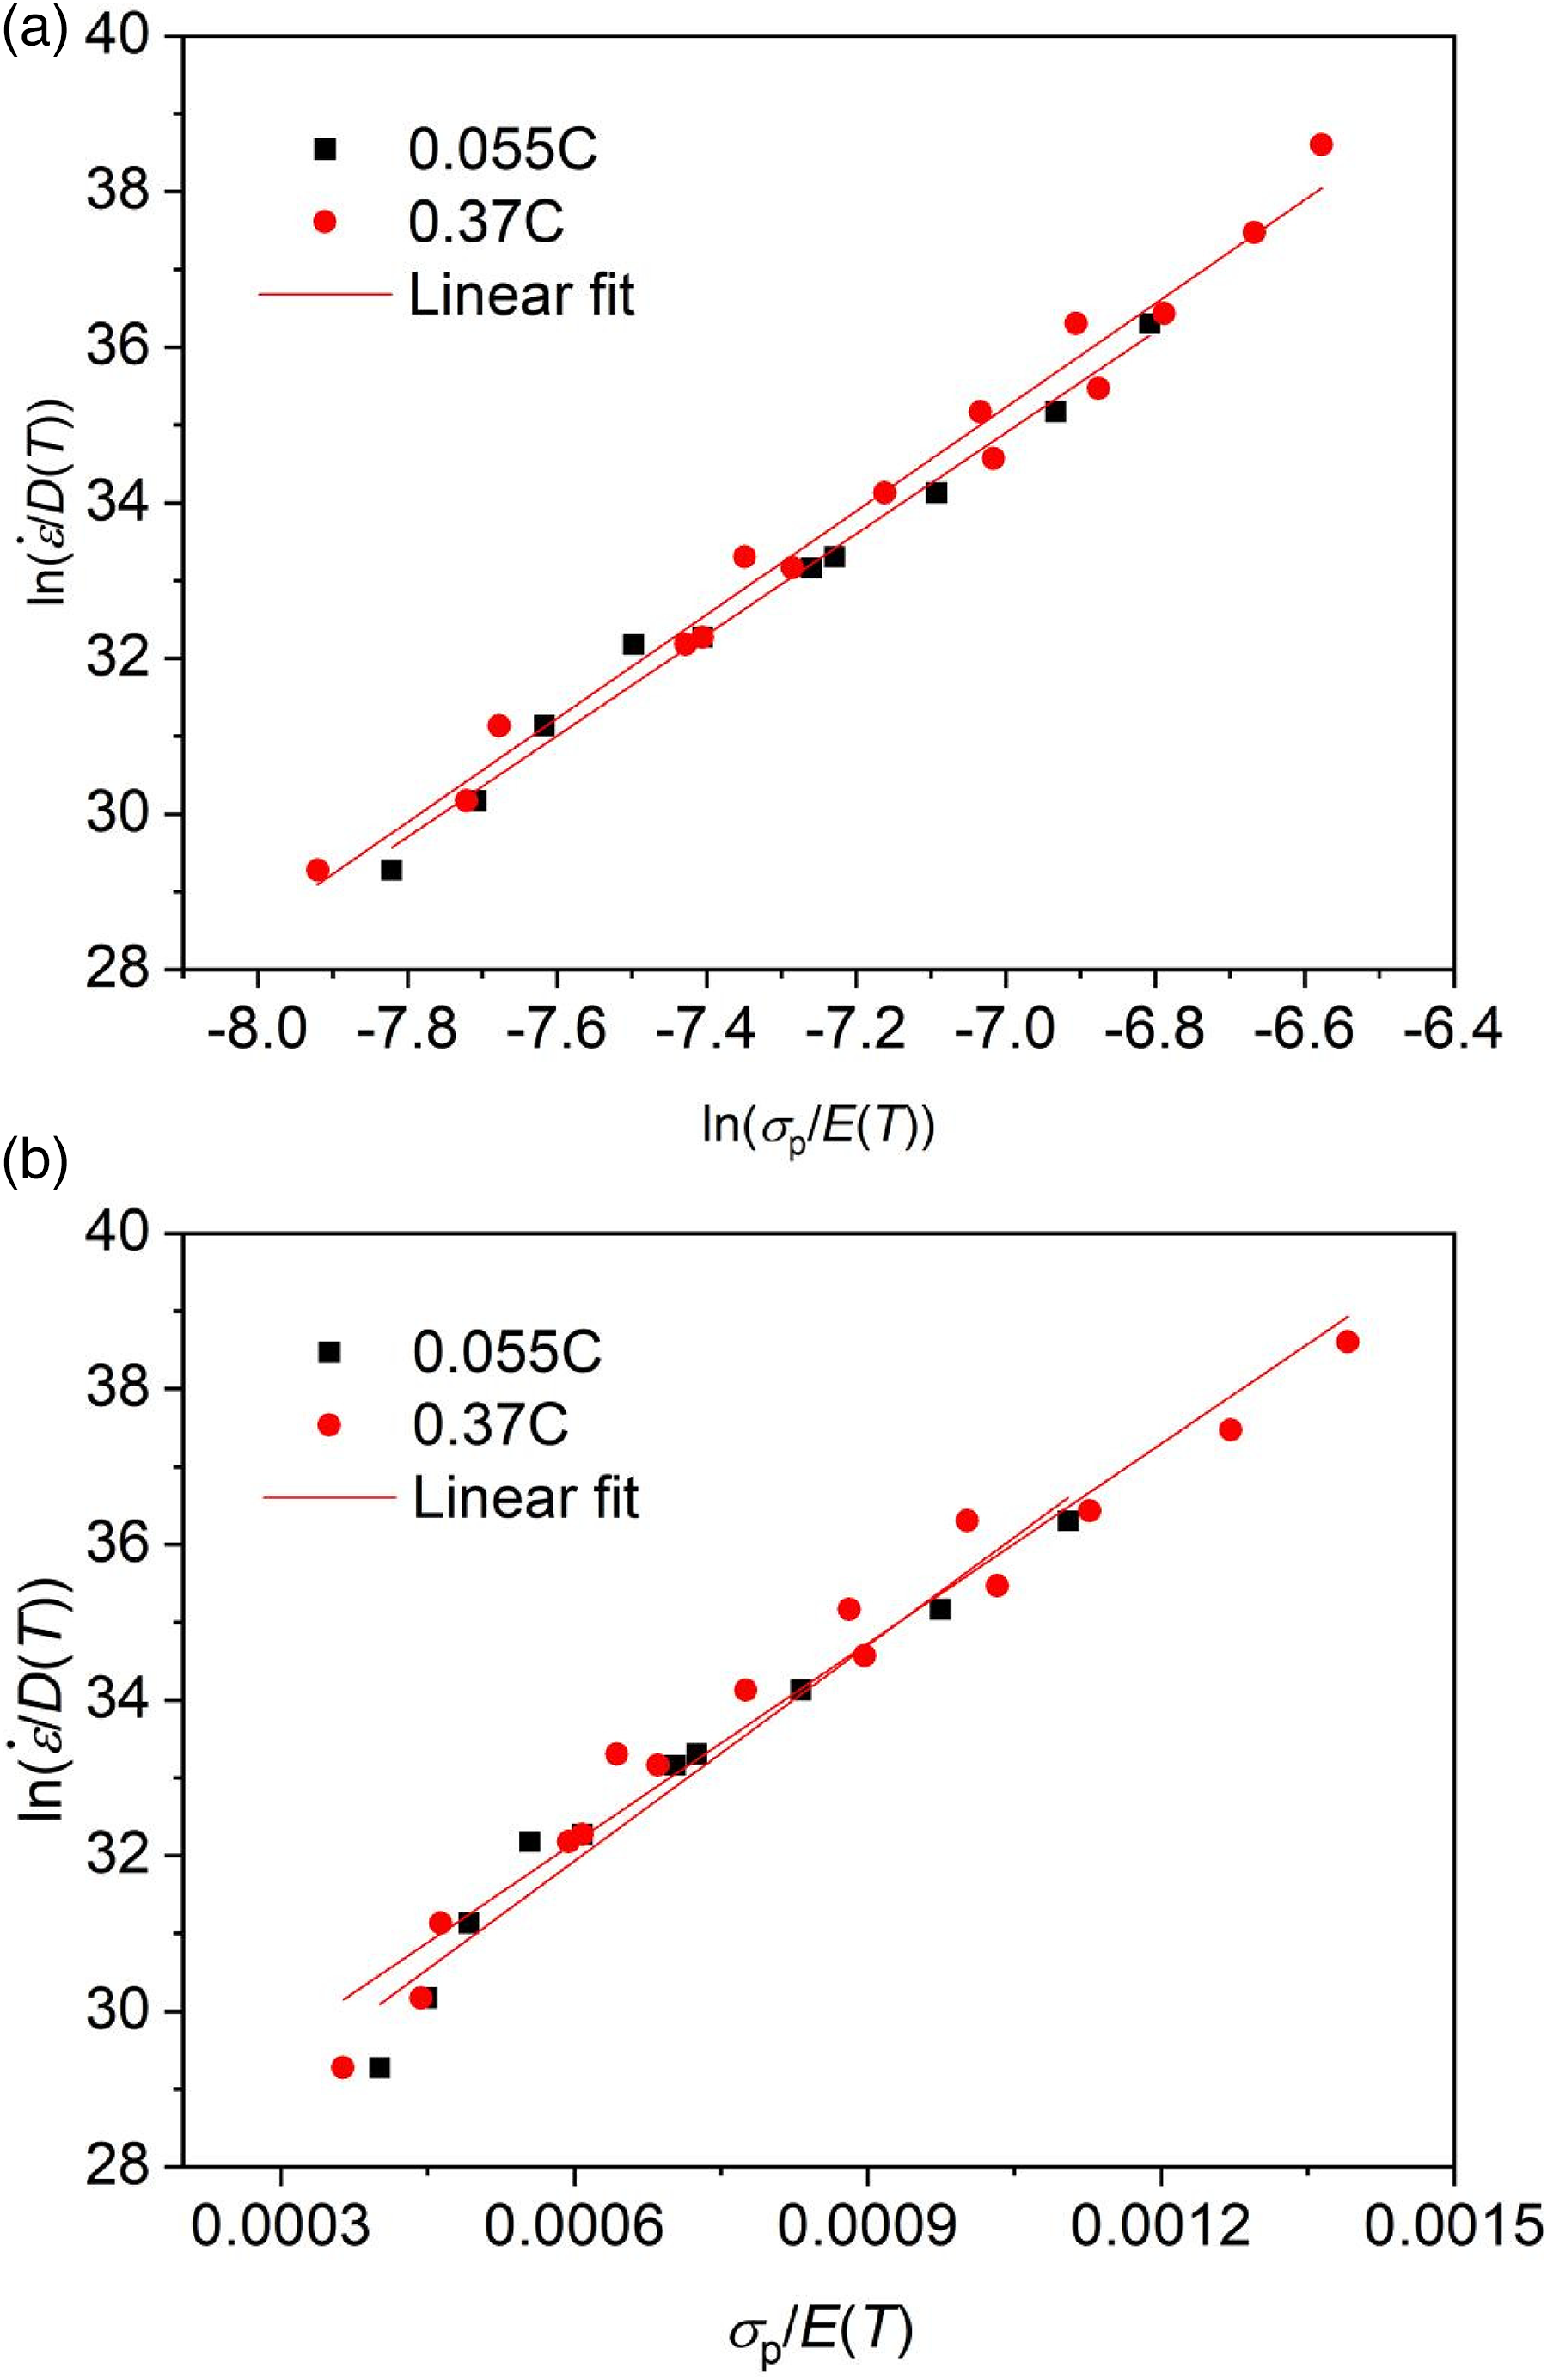
Experimental data and linear regression plots: (a)
Transform Equation (1) into
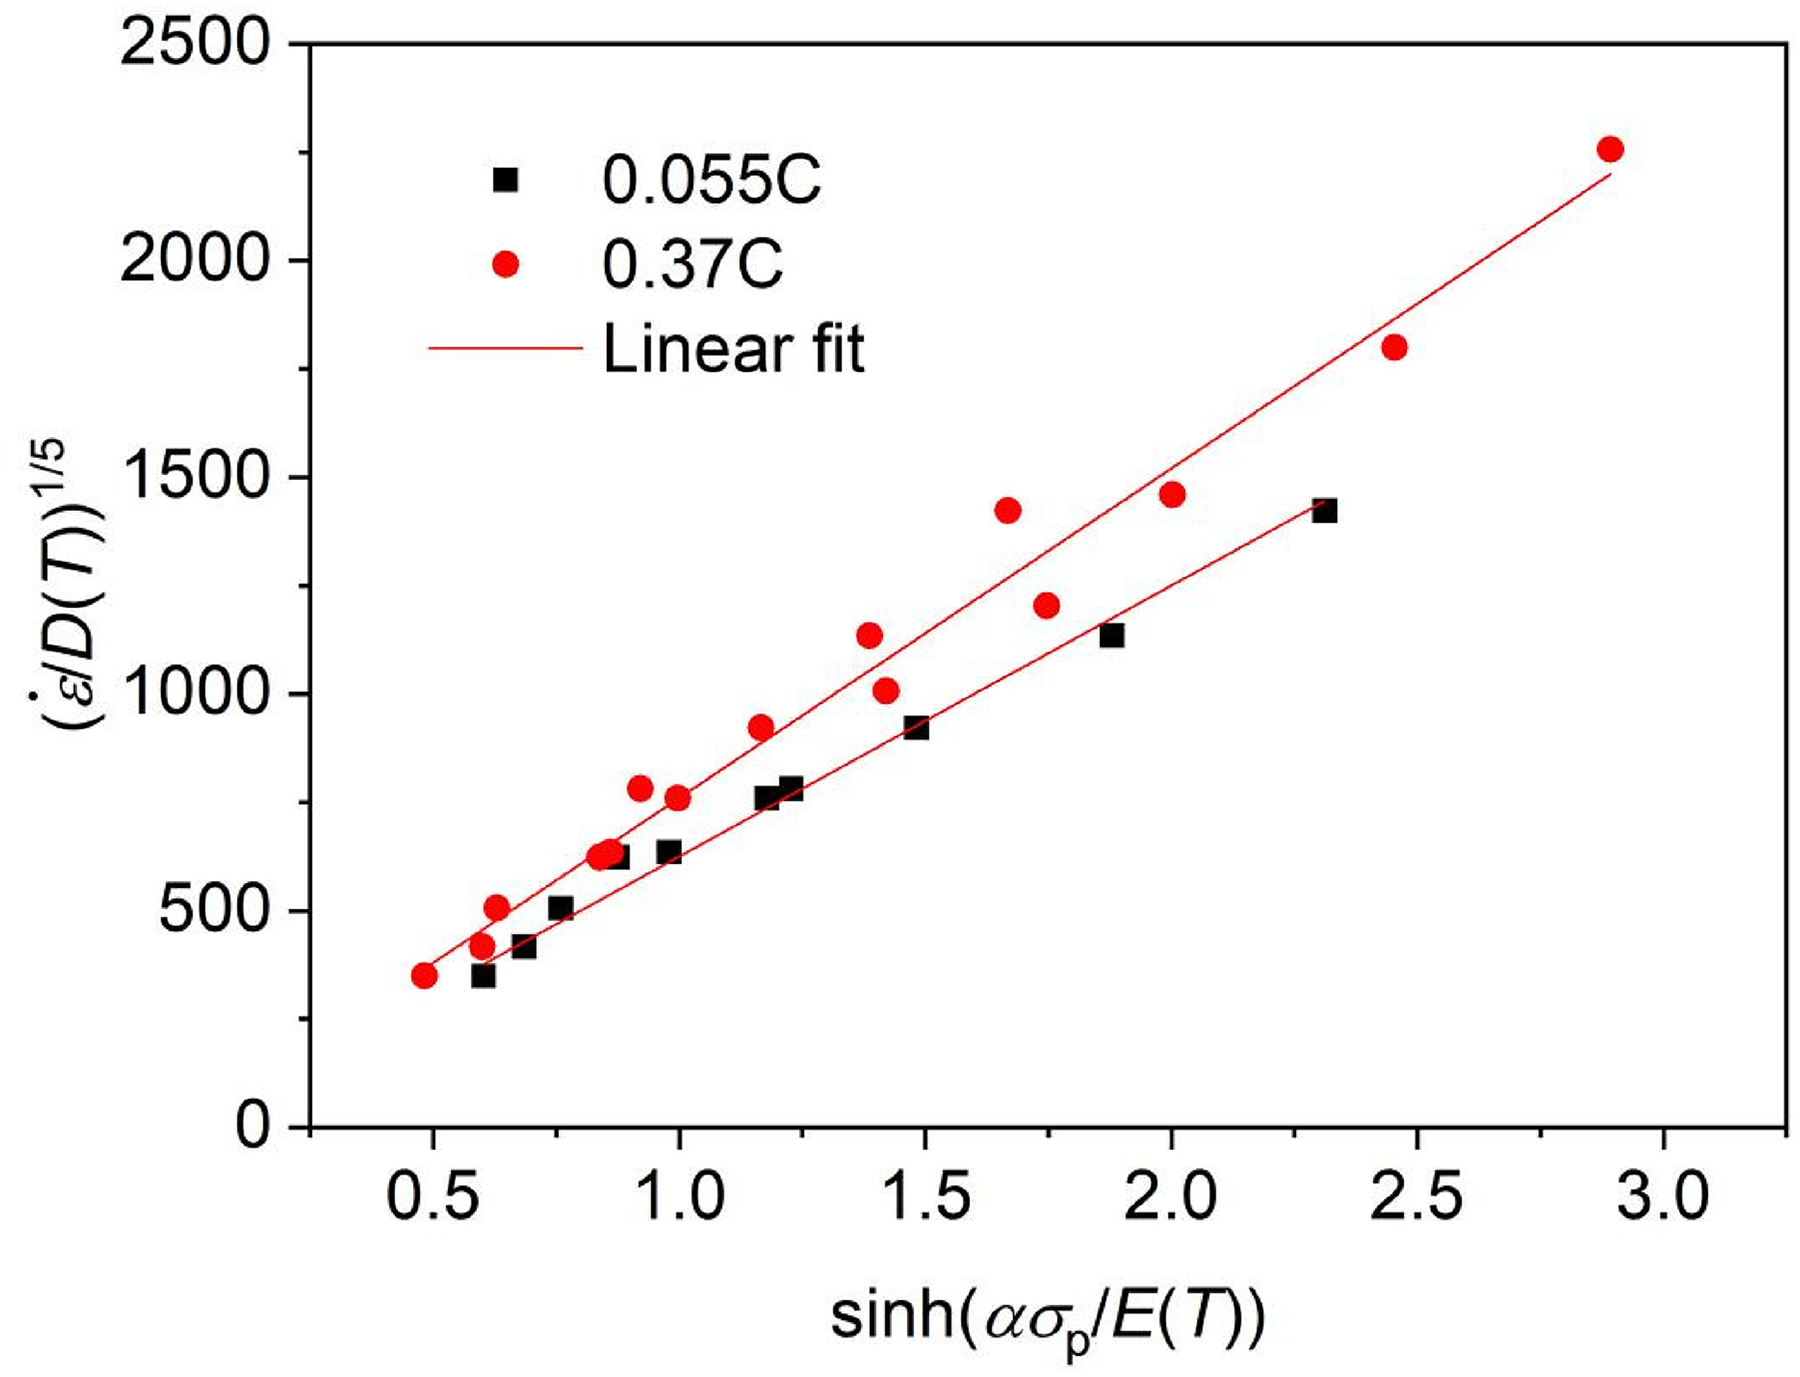
Experimental data and linear regression plots:
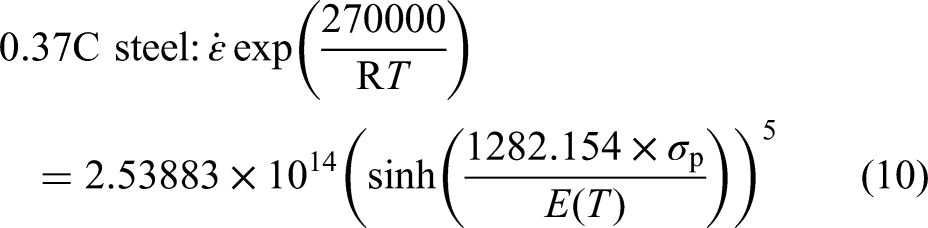
The peak stress constitutive equations of the experimental steels are as follows: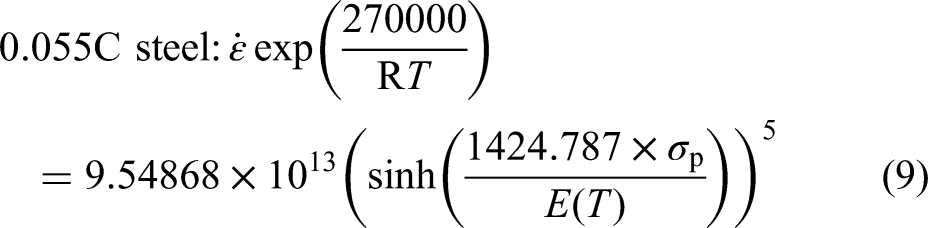
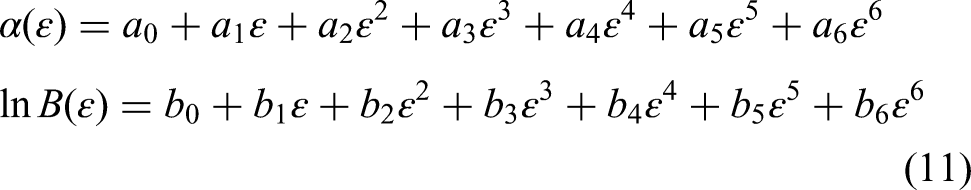
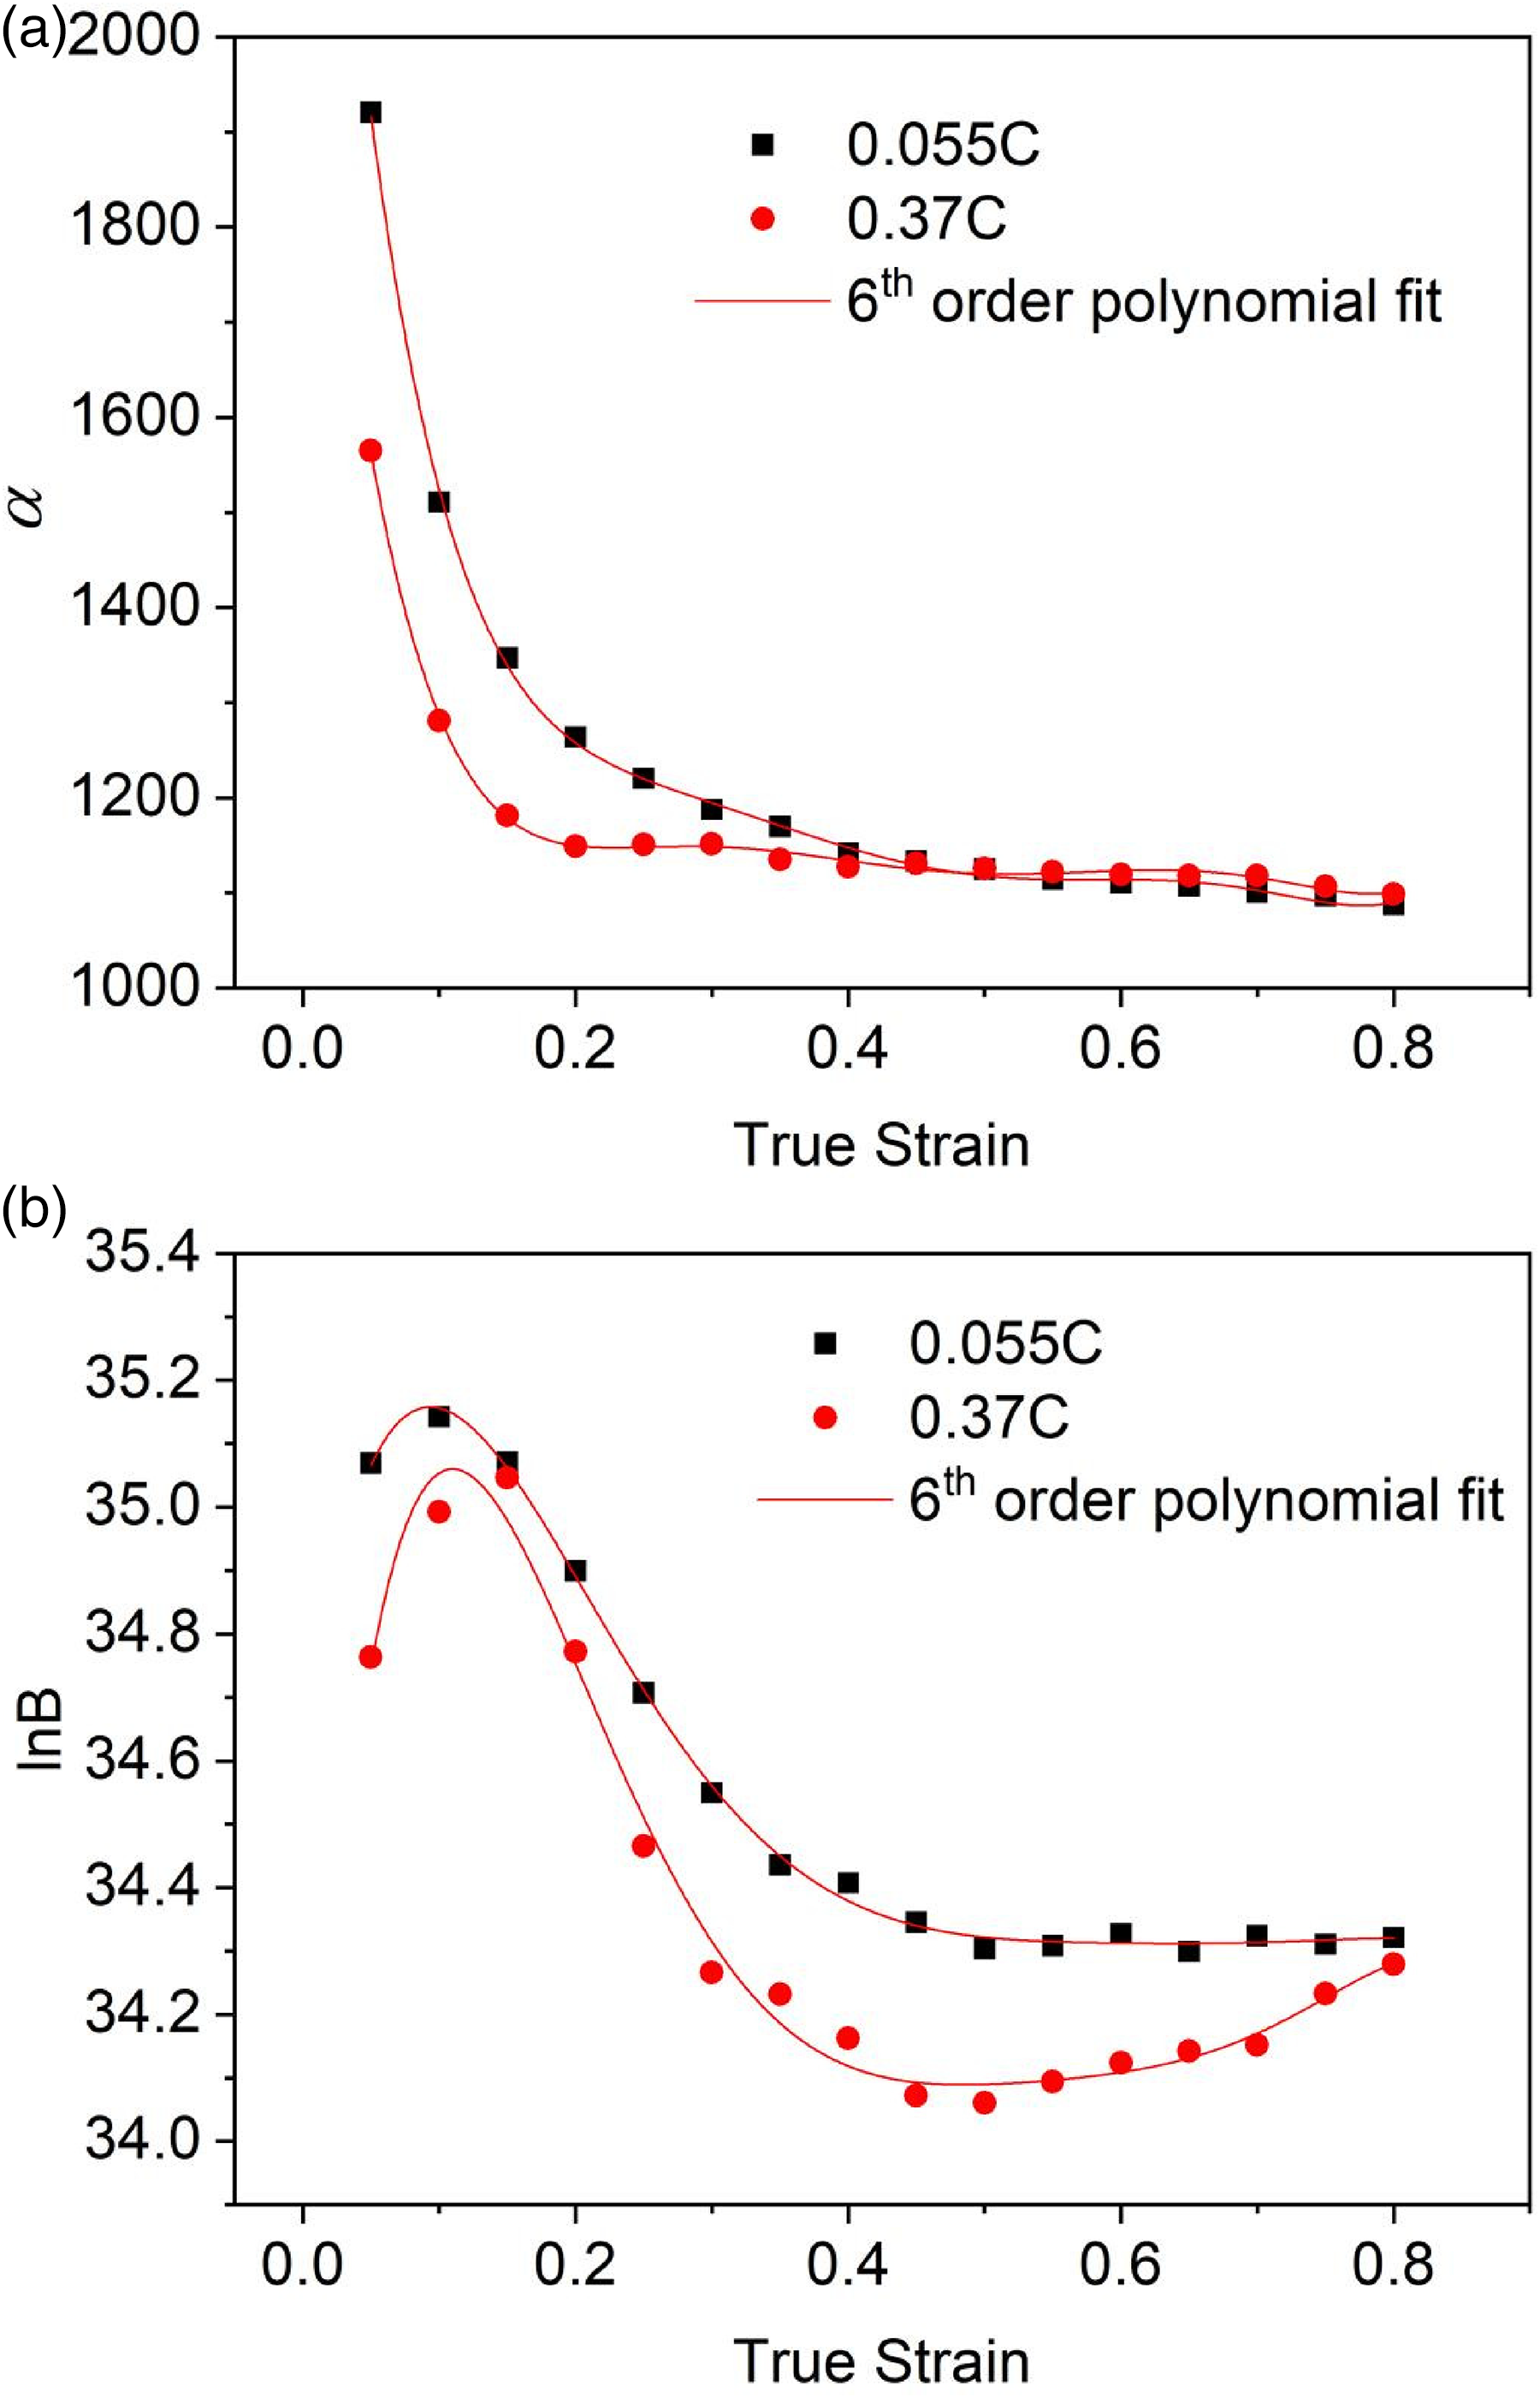
Sixth-order polynomial fitting of (a)α, (b) lnB and ε.
Obtained coefficients in Equation (11).
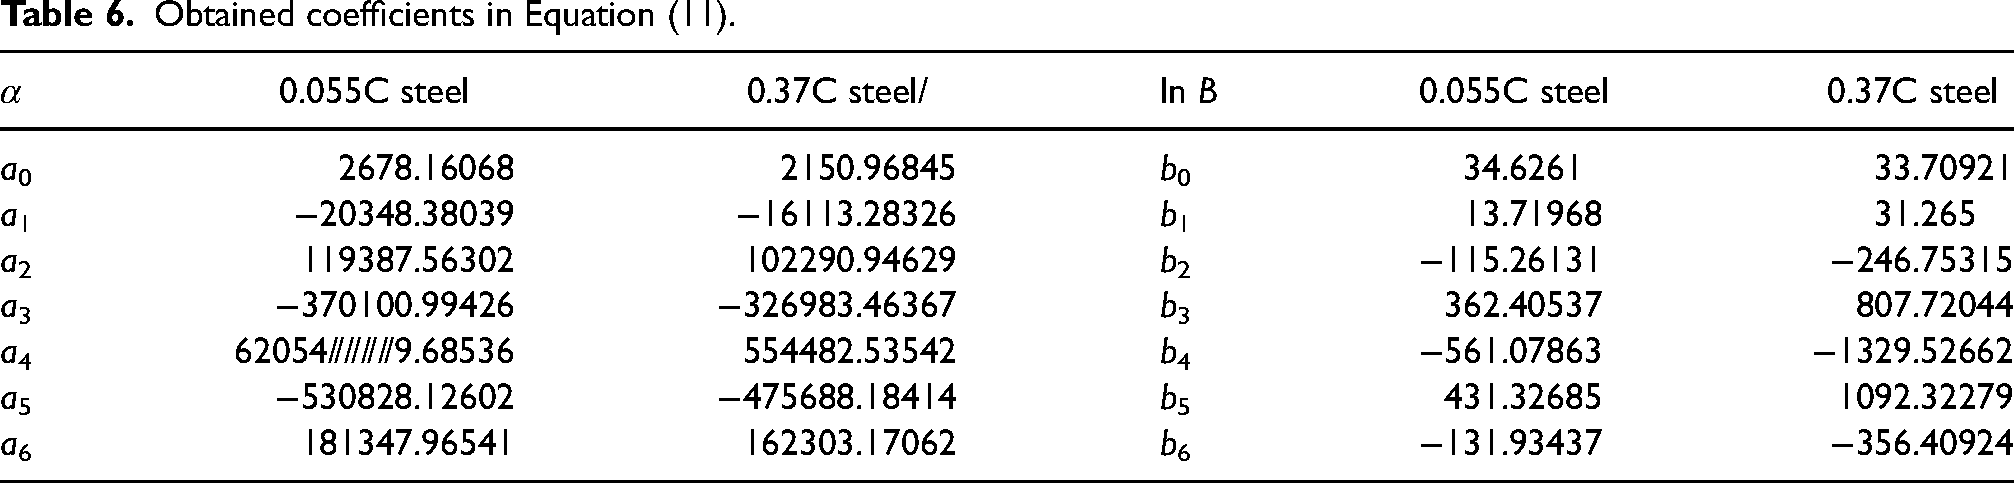
The physical constitutive equation of strain compensation is as follows: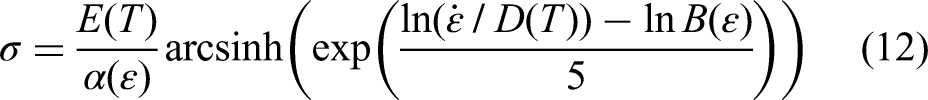
Physical constitutive model including exponential n
Since the physical constitutive equation including exponential 5 is only applicable to the case where the deformation mechanism is controlled by dislocation slide and climb,24,25 if exponential 5 is changed to be n, Equation (13) can be obtained for comparative analysis.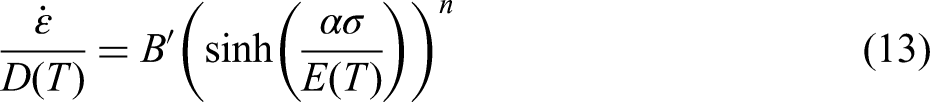
Equation (13) is transformed into
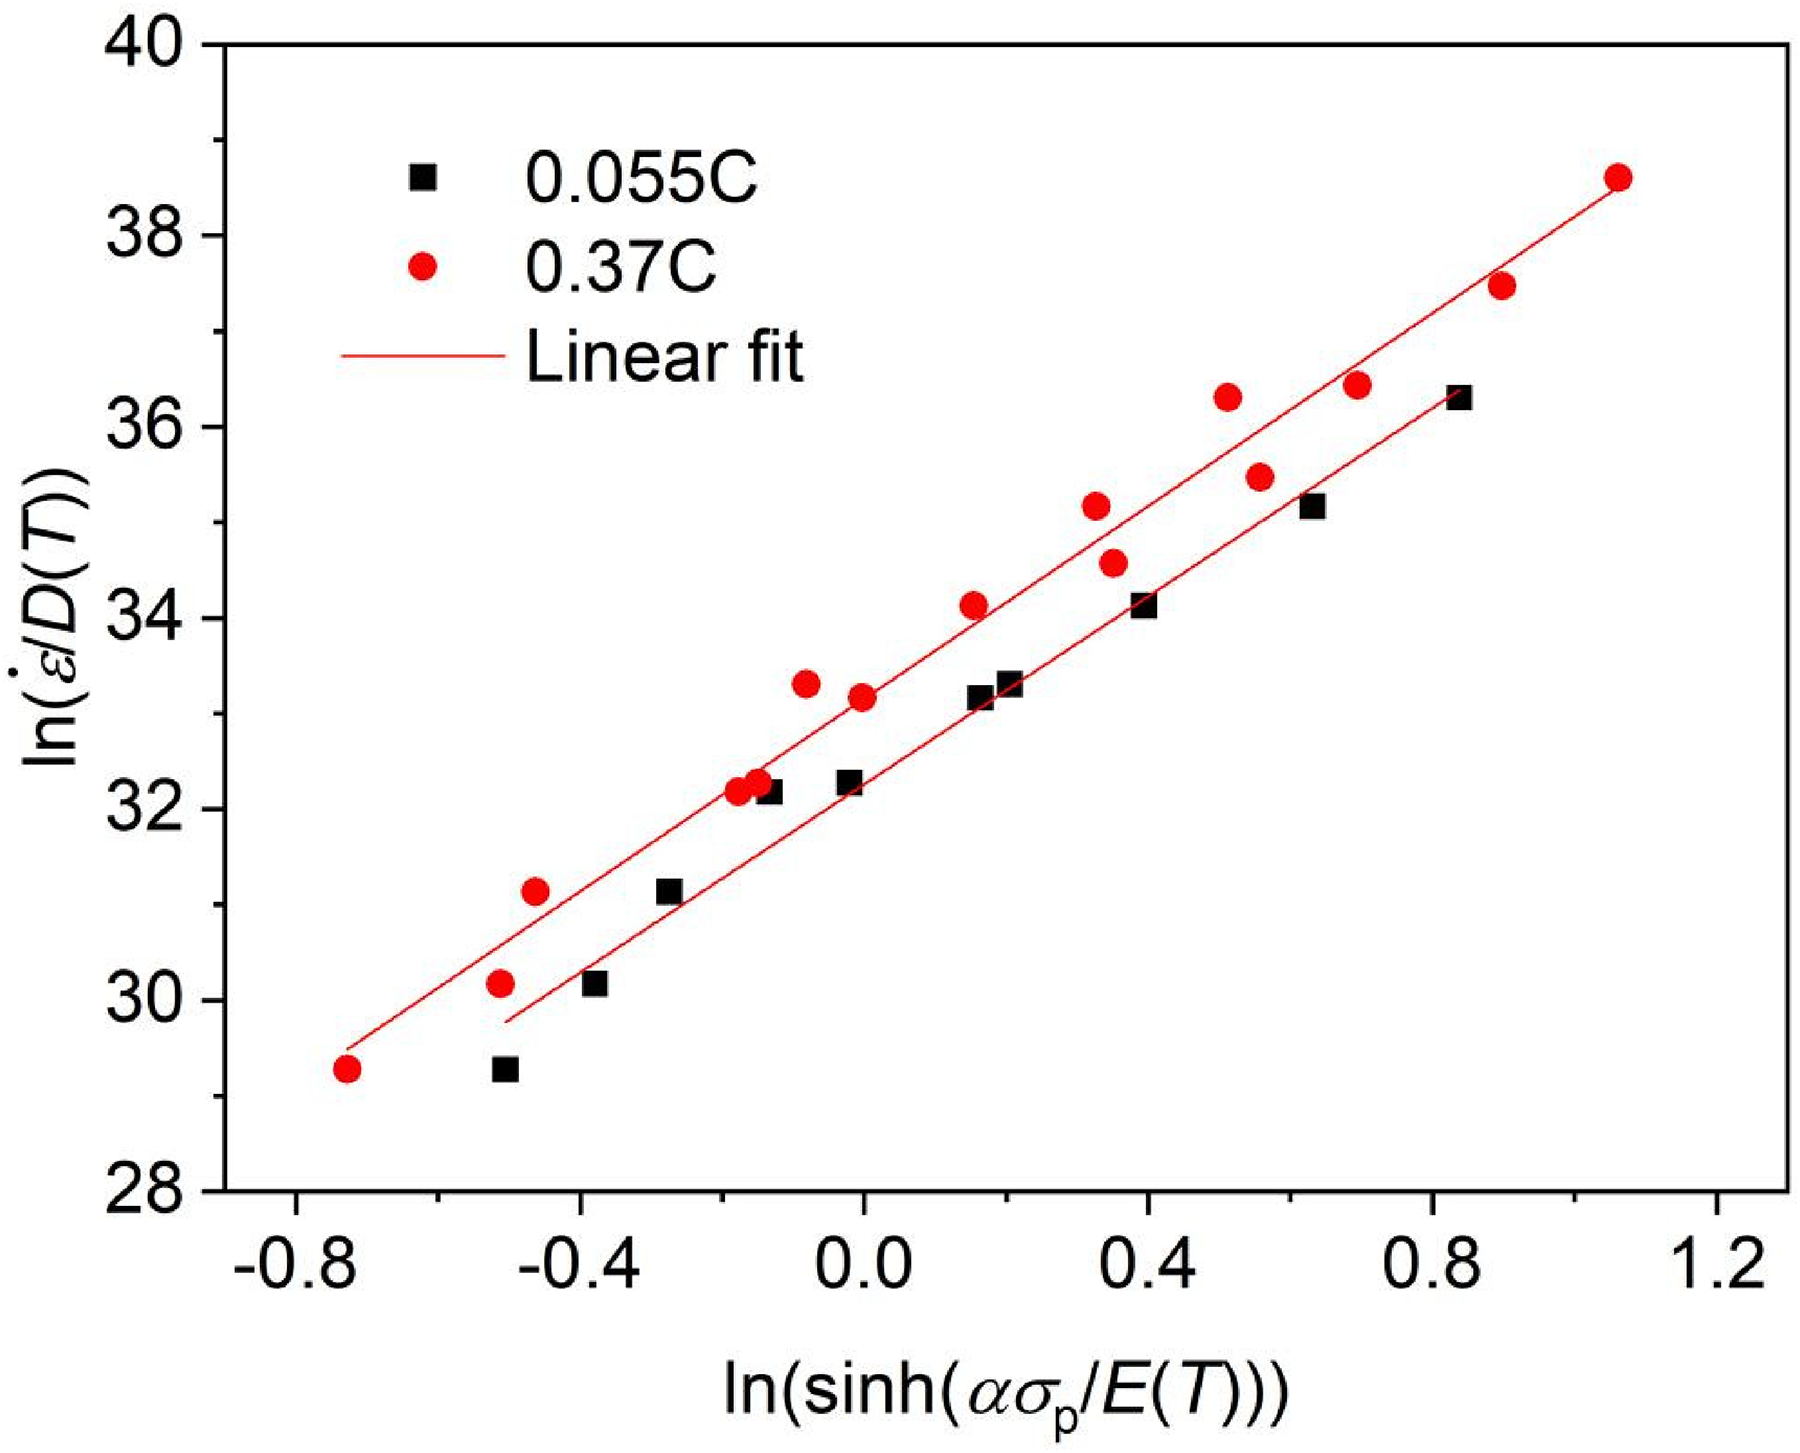
Experimental data and linear regression plots:
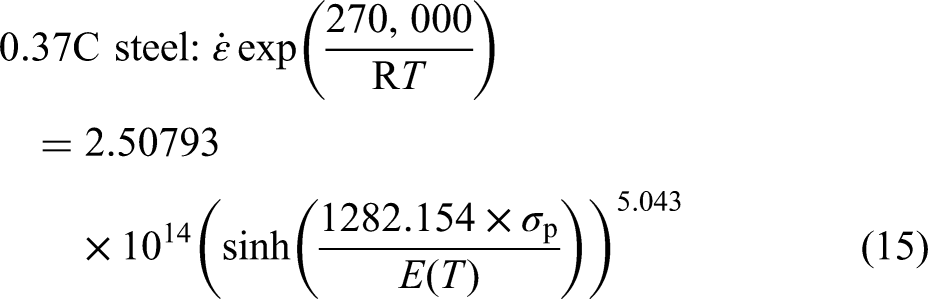
The peak stress constitutive equations of the steels are as follows: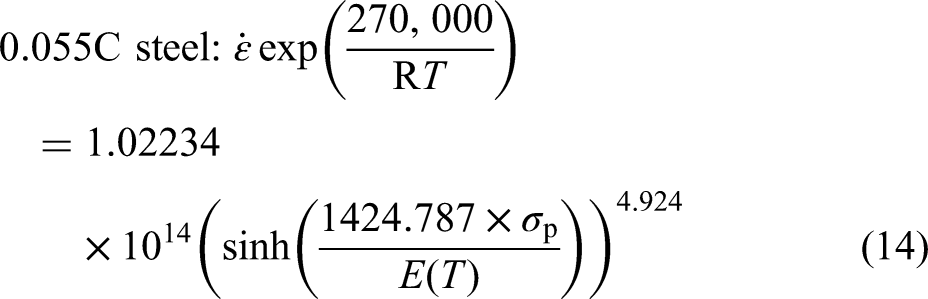
Similarly, the constitutive equation of strain compensation was established by referring to the method described above. The relationship between material parameters n, 
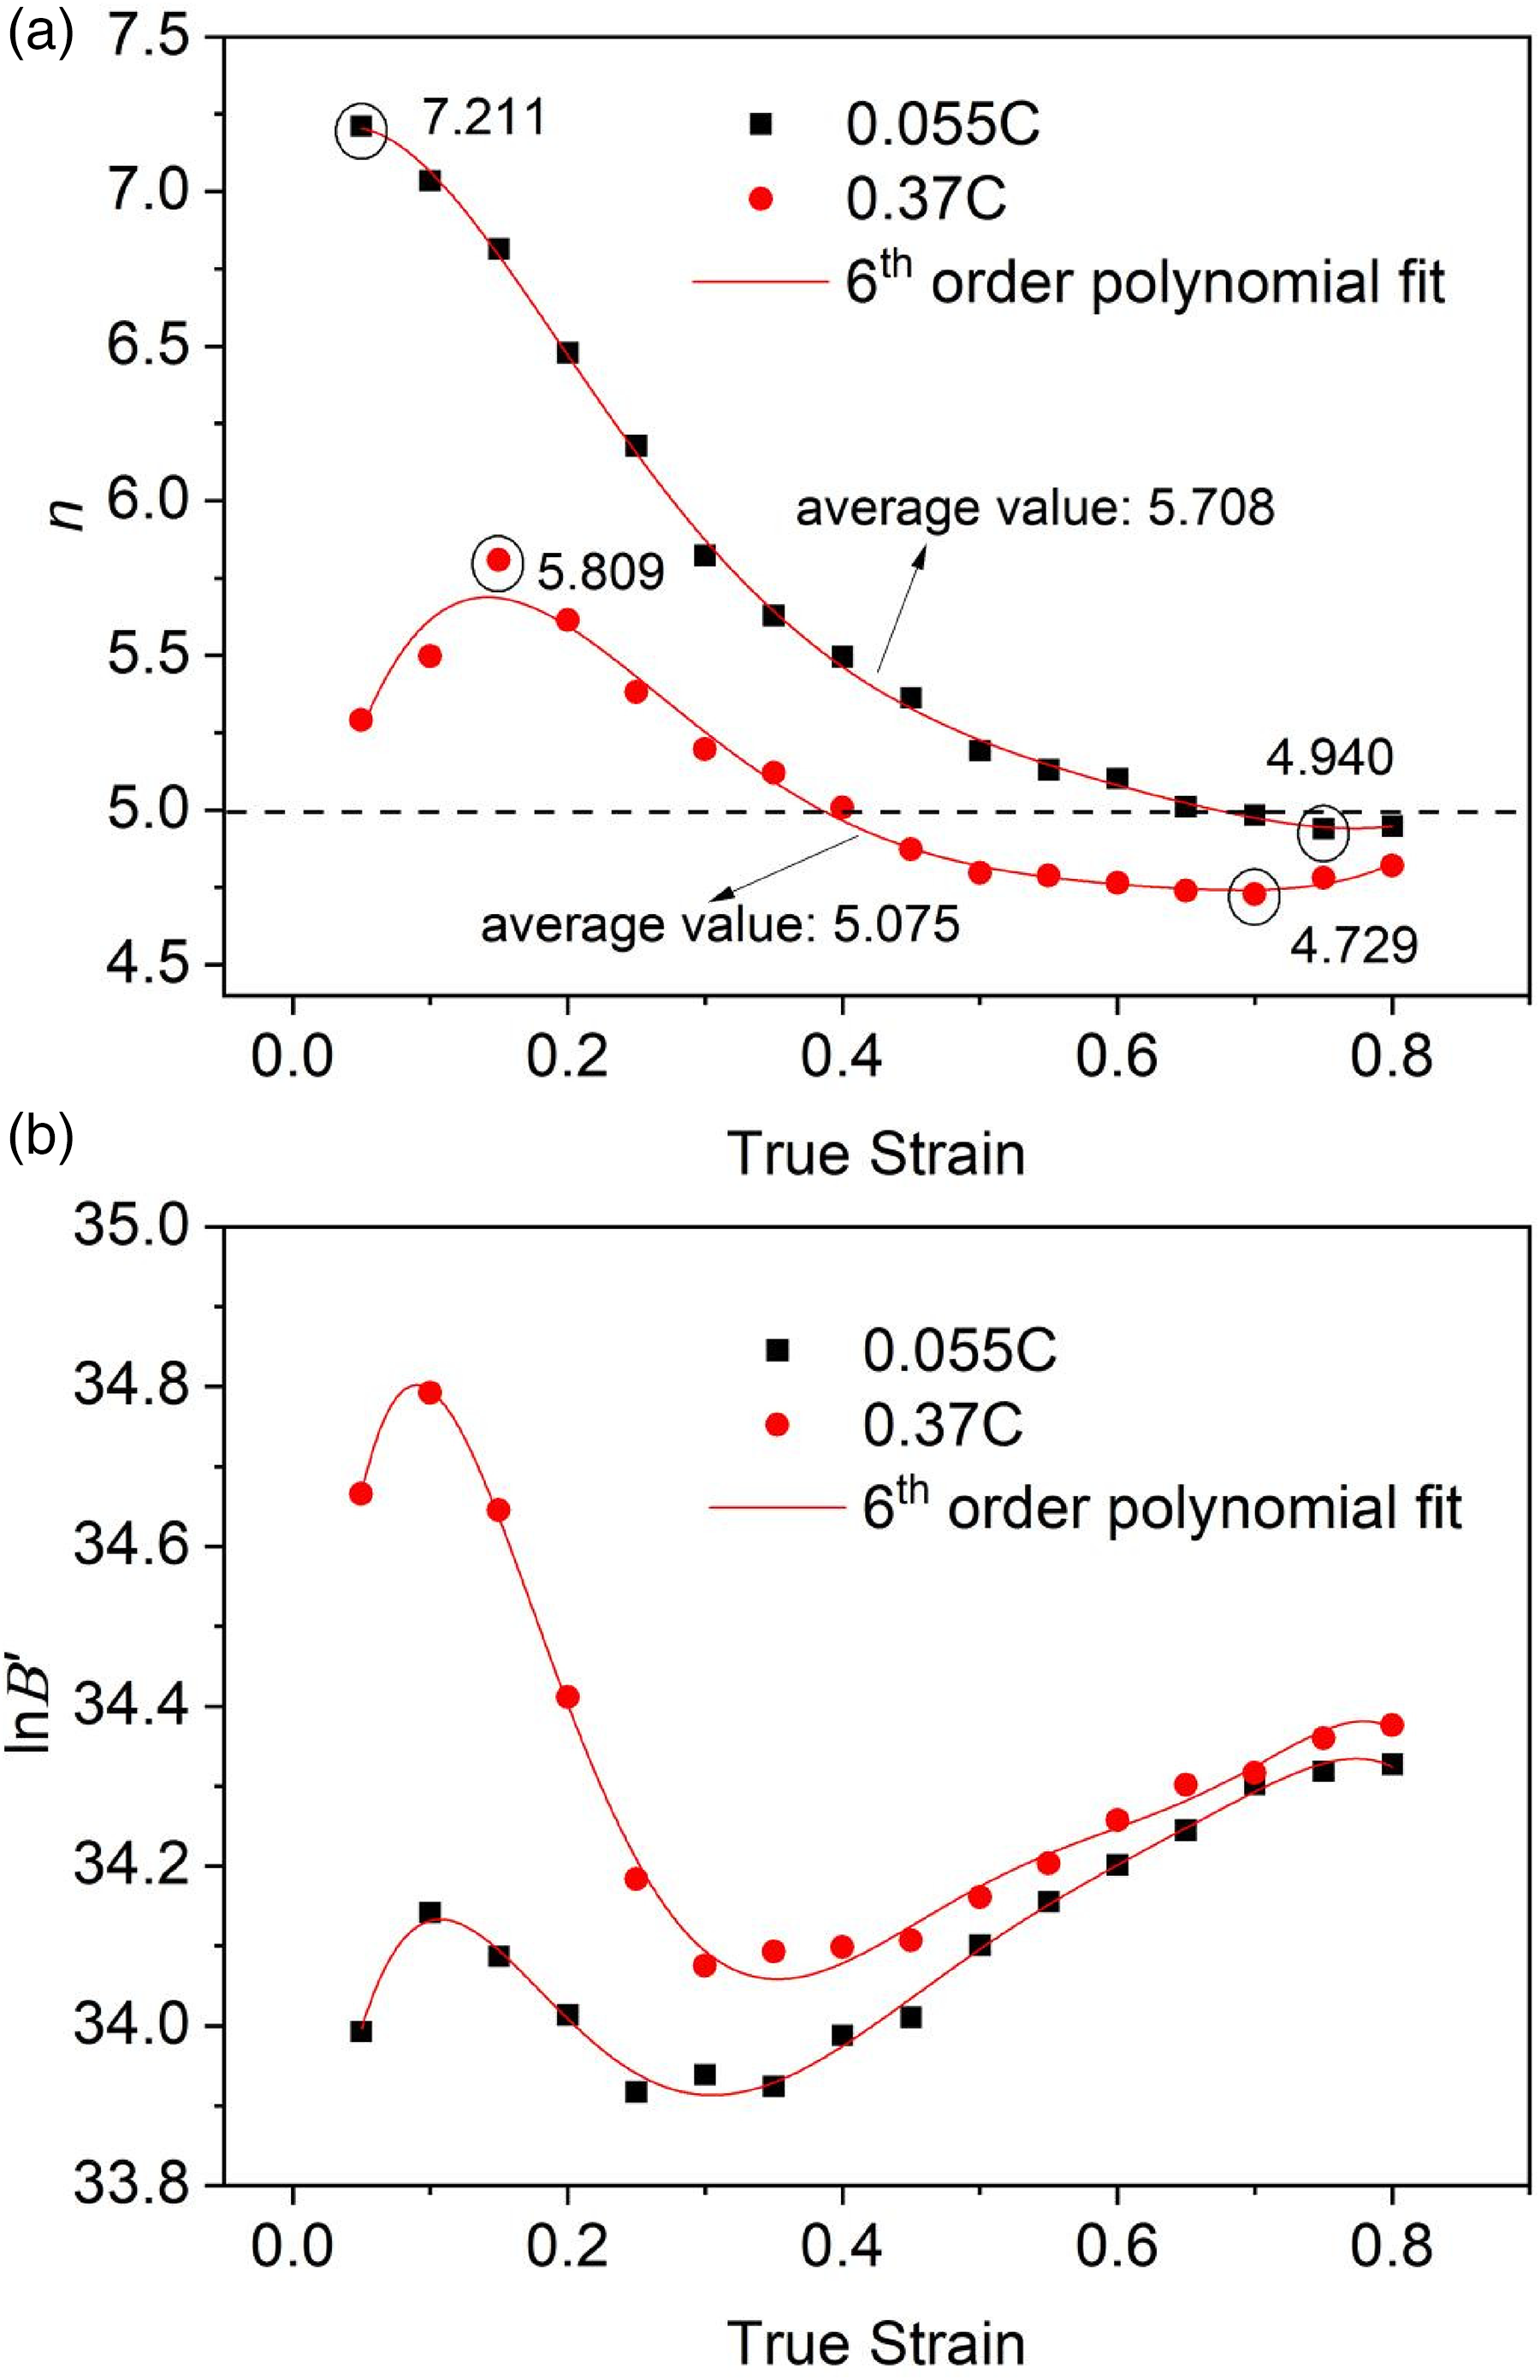
Sixth-order polynomial fitting of (a) n, (b) ln
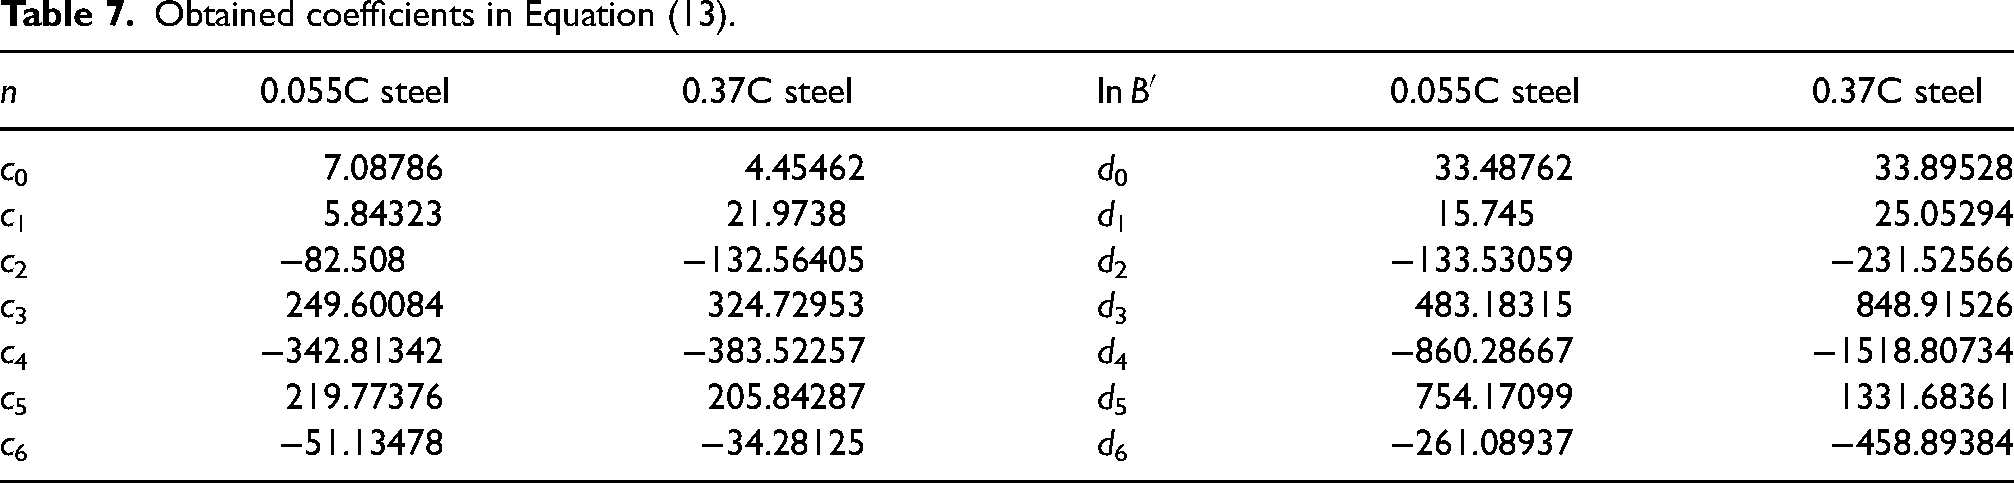
Obtained coefficients in Equation (13).
The physical constitutive equation of strain compensation is as follows: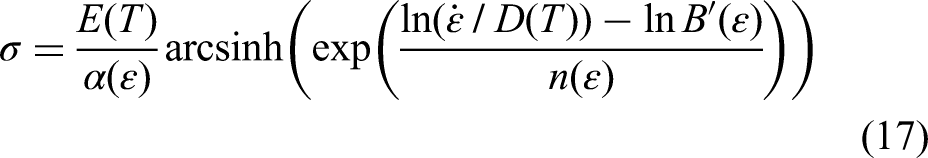
Discussion on deformation mechanism
It can be seen from Figure 6(a) that the variation trend of the stress exponential n with the strain of the two steels is different. The n value of 0.37C steel is relatively close to 5 from 4.729 to 5.809, and the average value is 5.075. It is shown that the constitutive equation including a creep exponential of 5 can describe the hot flow behaviour of 0.37C steel well. While the n value of 0.055C steel was significantly higher than 5 at lower strain, with the increase of strain, n gradually decreases from 7.211 to 4.94, with an average value of 5.708. The results show that the equation including exponential 5 is not suitable for 0.055C steel over all the strain range.
The fluctuation of n value is related to the movement of crystal defects during deformation, so n value reflects the corresponding deformation mechanism. Table 8 shows the stress exponential n values and the corresponding deformation mechanisms.41,42 The n value of 0.37C steel is close to 5, whereas the n value of 0.055C steel is higher seen from Figure 6(a), indicating that the main mechanism of 0.37C steel is dislocation climb. Generally, factors that increase the difficulty of deformation will lead to a higher value of n than the theoretical value of 5, the level of n value somehow reflects the difficulty of deformation. Some researchers have indicated that the softening mechanism of DRX can reduce the creep exponential n of some low SFE metals/alloys. 23 Combined with the stress–strain analysis of the experimental steels, the increase of carbon content promotes the occurrence of DRX and is conducive to thermal deformation, so the n value of 0.055C steel is higher. Moreover, the DRX volume fraction increases with the increase of strain, which indicates that the high DRX fraction contributes to the decrease of the exponential n value under large strain.
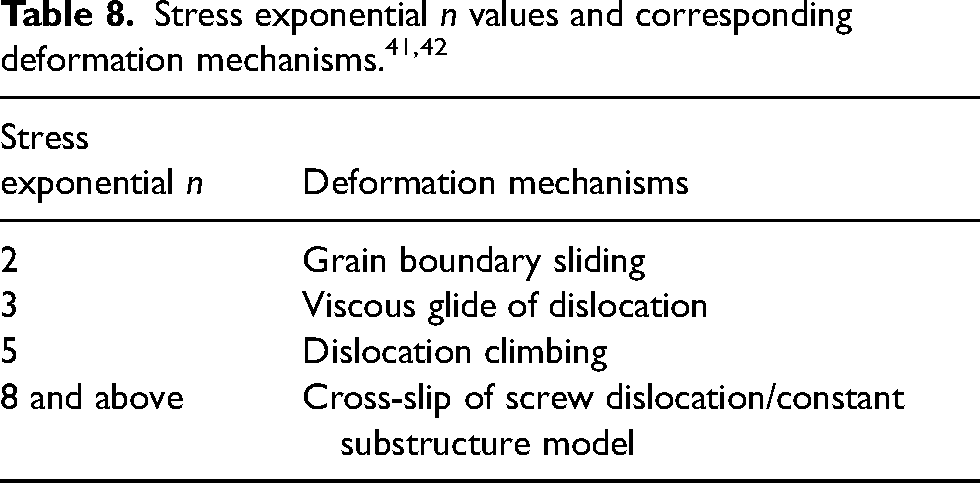
The higher value of n than the theoretical value of 5 may be caused by the following reasons. (1) The change of the thermal deformation mechanism. A more complex thermal deformation mechanism corresponds to a higher n value seen from Table 8. Studies15,43 have shown that there are different thermal deformation mechanisms in V-microalloyed steel, such as dislocation climb, dislocation cross slip or partial dislocation collapse. The n value of 0.055C steel exceeds 5 at lower strains, which indicates that other thermal deformation mechanism may appear in the steel besides dislocation climb. (2) The role of dynamic precipitates. Some studies attributed n > 5 to the pinning and inhibition effect of precipitation on dislocation.30–32,44 The deformation is most likely to be dominated by the joint mechanism of pinning and dislocation, and the source of pinning may be related to solute atoms and dynamic precipitates, so more energy is needed to activate dislocation motion. 44 At low deformation temperature, high volume fraction and fine precipitates can produce high strengthening effect and lead to n > 5. In addition, small precipitate can affect the creep rate, resulting in the creep rate control mechanism deviating from the climbing-controlled mechanism, thus increasing the creep exponential n. 30 It was found that the reason why the creep exponential was greater than 5 was related to the dynamic precipitates during thermal deformation of Al–Mg–Si alloy at low temperature, fine Si and AlMnFeSi particles hinder dislocation movement during deformation, resulting in a high creep exponential. 31 Zhang et al. 32 also indicated that n > 5 when the dislocation movement was limited by fine dynamic precipitates such as Mg2Si and AlMnFeSi in 6A02 aluminium alloy.
For V-microalloyed steel, the solution temperatures of the main precipitated phases VC and VN can be calculated by using the following equations.
45
The results show that the solution temperature of VC in 0.055C steel is 774 °C, and that in 0.37C steel is 885 °C, both lower than the experimental temperatures. The solution temperature of VN in 0.055C steel is 983 °C, which is very close to its solution temperature of 989 °C in 0.37C steel. So there is no precipitation of VC in the whole temperature range, and there may be precipitation of VN in the lower deformation temperature (900–950 °C). Therefore, it is inferred that the difference of carbon content has no influence on the precipitation behaviour of the experimental steels, and the higher n value of 0.055C steel is not caused by precipitation but may be due to other deformation mechanism, which needs further study.

Comparative analysis of prediction accuracy
Generally, the accuracy of the constitutive model in predicting flow stress is verified by calculating the correlation coefficient (R) and the average absolute relative error (AARE) between the experimental value and the predicted value. The calculation formulas of R and AARE can refer to the relevant literature. 19 Figure 7 shows the comparison of experimental values and predicted values. For 0.055C steel, the R value of Equation (12) including exponential 5 is 0.978 and AARE value is 9.96%, while the R value of Equation (17) including exponential n is increased to be 0.983 and AARE value is reduced to be 6.36%, indicating that Equation (17) has higher prediction accuracy than Equation (12). This is because other deformation mechanism may appear in 0.055C steel according to the above analysis, and the equation including exponential 5 is not suitable for 0.055C steel, so its accuracy is low. For 0.37C steel, the R value of Equation (12) is 0.985 and AARE value is 7.29%, while the R value of Equation (17) is 0.986 and AARE value is 6.41%. Therefore, the prediction accuracy of Equations (12) and (17) for the flow stress of 0.37C steel is similar. This is because the thermal deformation mechanism of 0.37C steel is inferred to be dislocation climb from the previous analysis, which conforms to the applicable conditions of the equation including exponential 5.
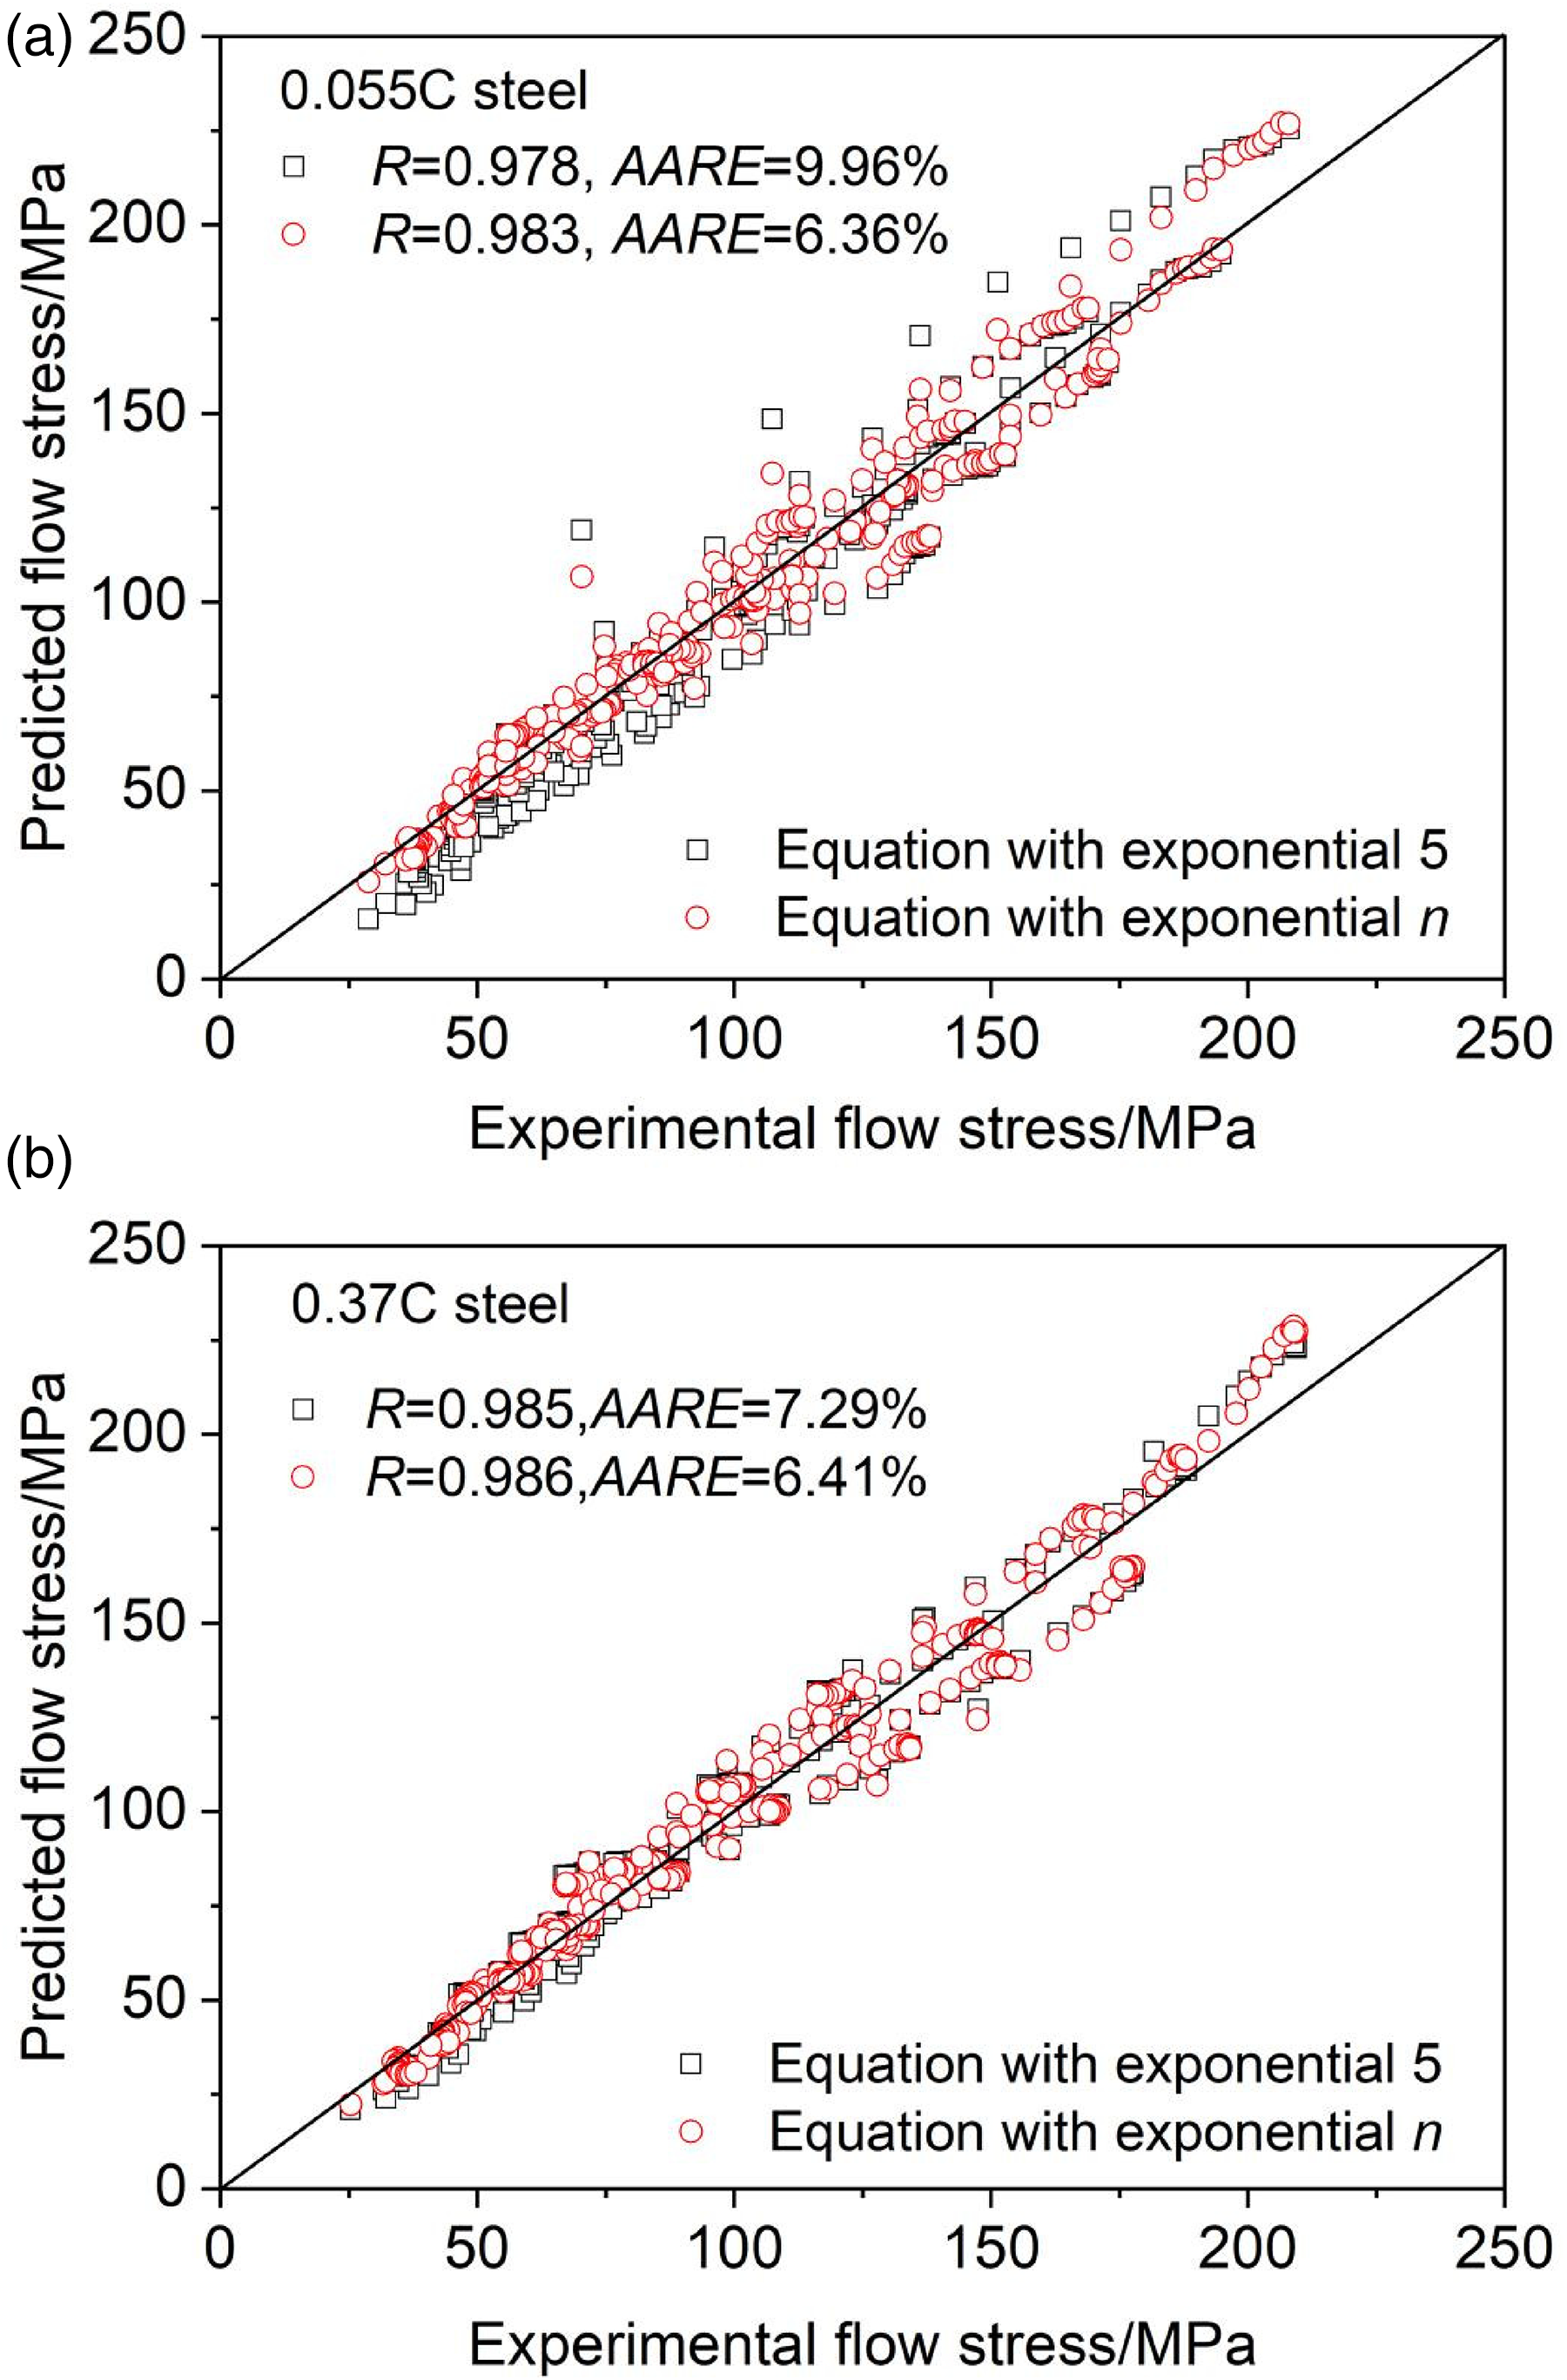
Correlation between the measured and predicted flow stress: (a) 0.055C steel; (b) 0.37C steel.
Modified constitutive model considering the coupling effect of lattice diffusion and grain boundary diffusion
The above two constitutive models are based on the lattice diffusion mechanism. Actually, the diffusion mechanism includes lattice diffusion and grain boundary diffusion. Lattice diffusion tends to occur at higher deformation temperatures, while grain boundary diffusion usually occurs at lower deformation temperatures.33,46 It is necessary to establish a modified constitutive model considering the coupling effect of the two diffusion mechanisms, as shown in Equation (20).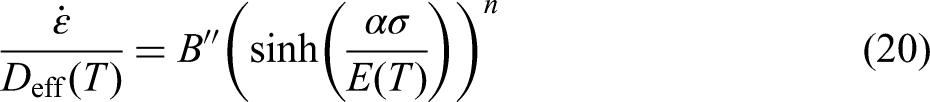

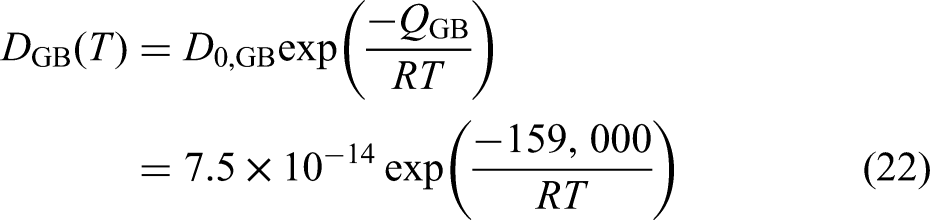
Equation (23) can be obtained according to Equations (20) and (21).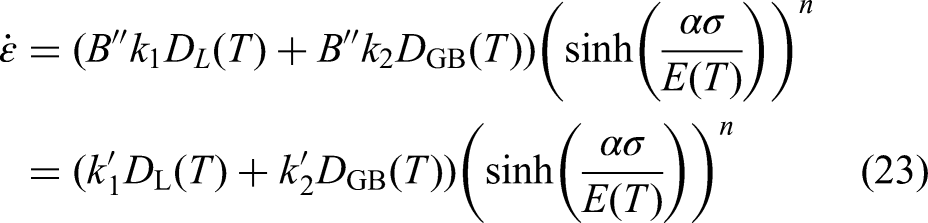
Discussion on diffusion mechanism
The values of α and n in Equation (23) are the same as those in Equation (13) according to previous researches,32,33,47 so only k1′ and k2′ need to be calculated. Taking the logarithm of Equation (23), we can obtain the equation
Experimental data and linear regression plots of ln
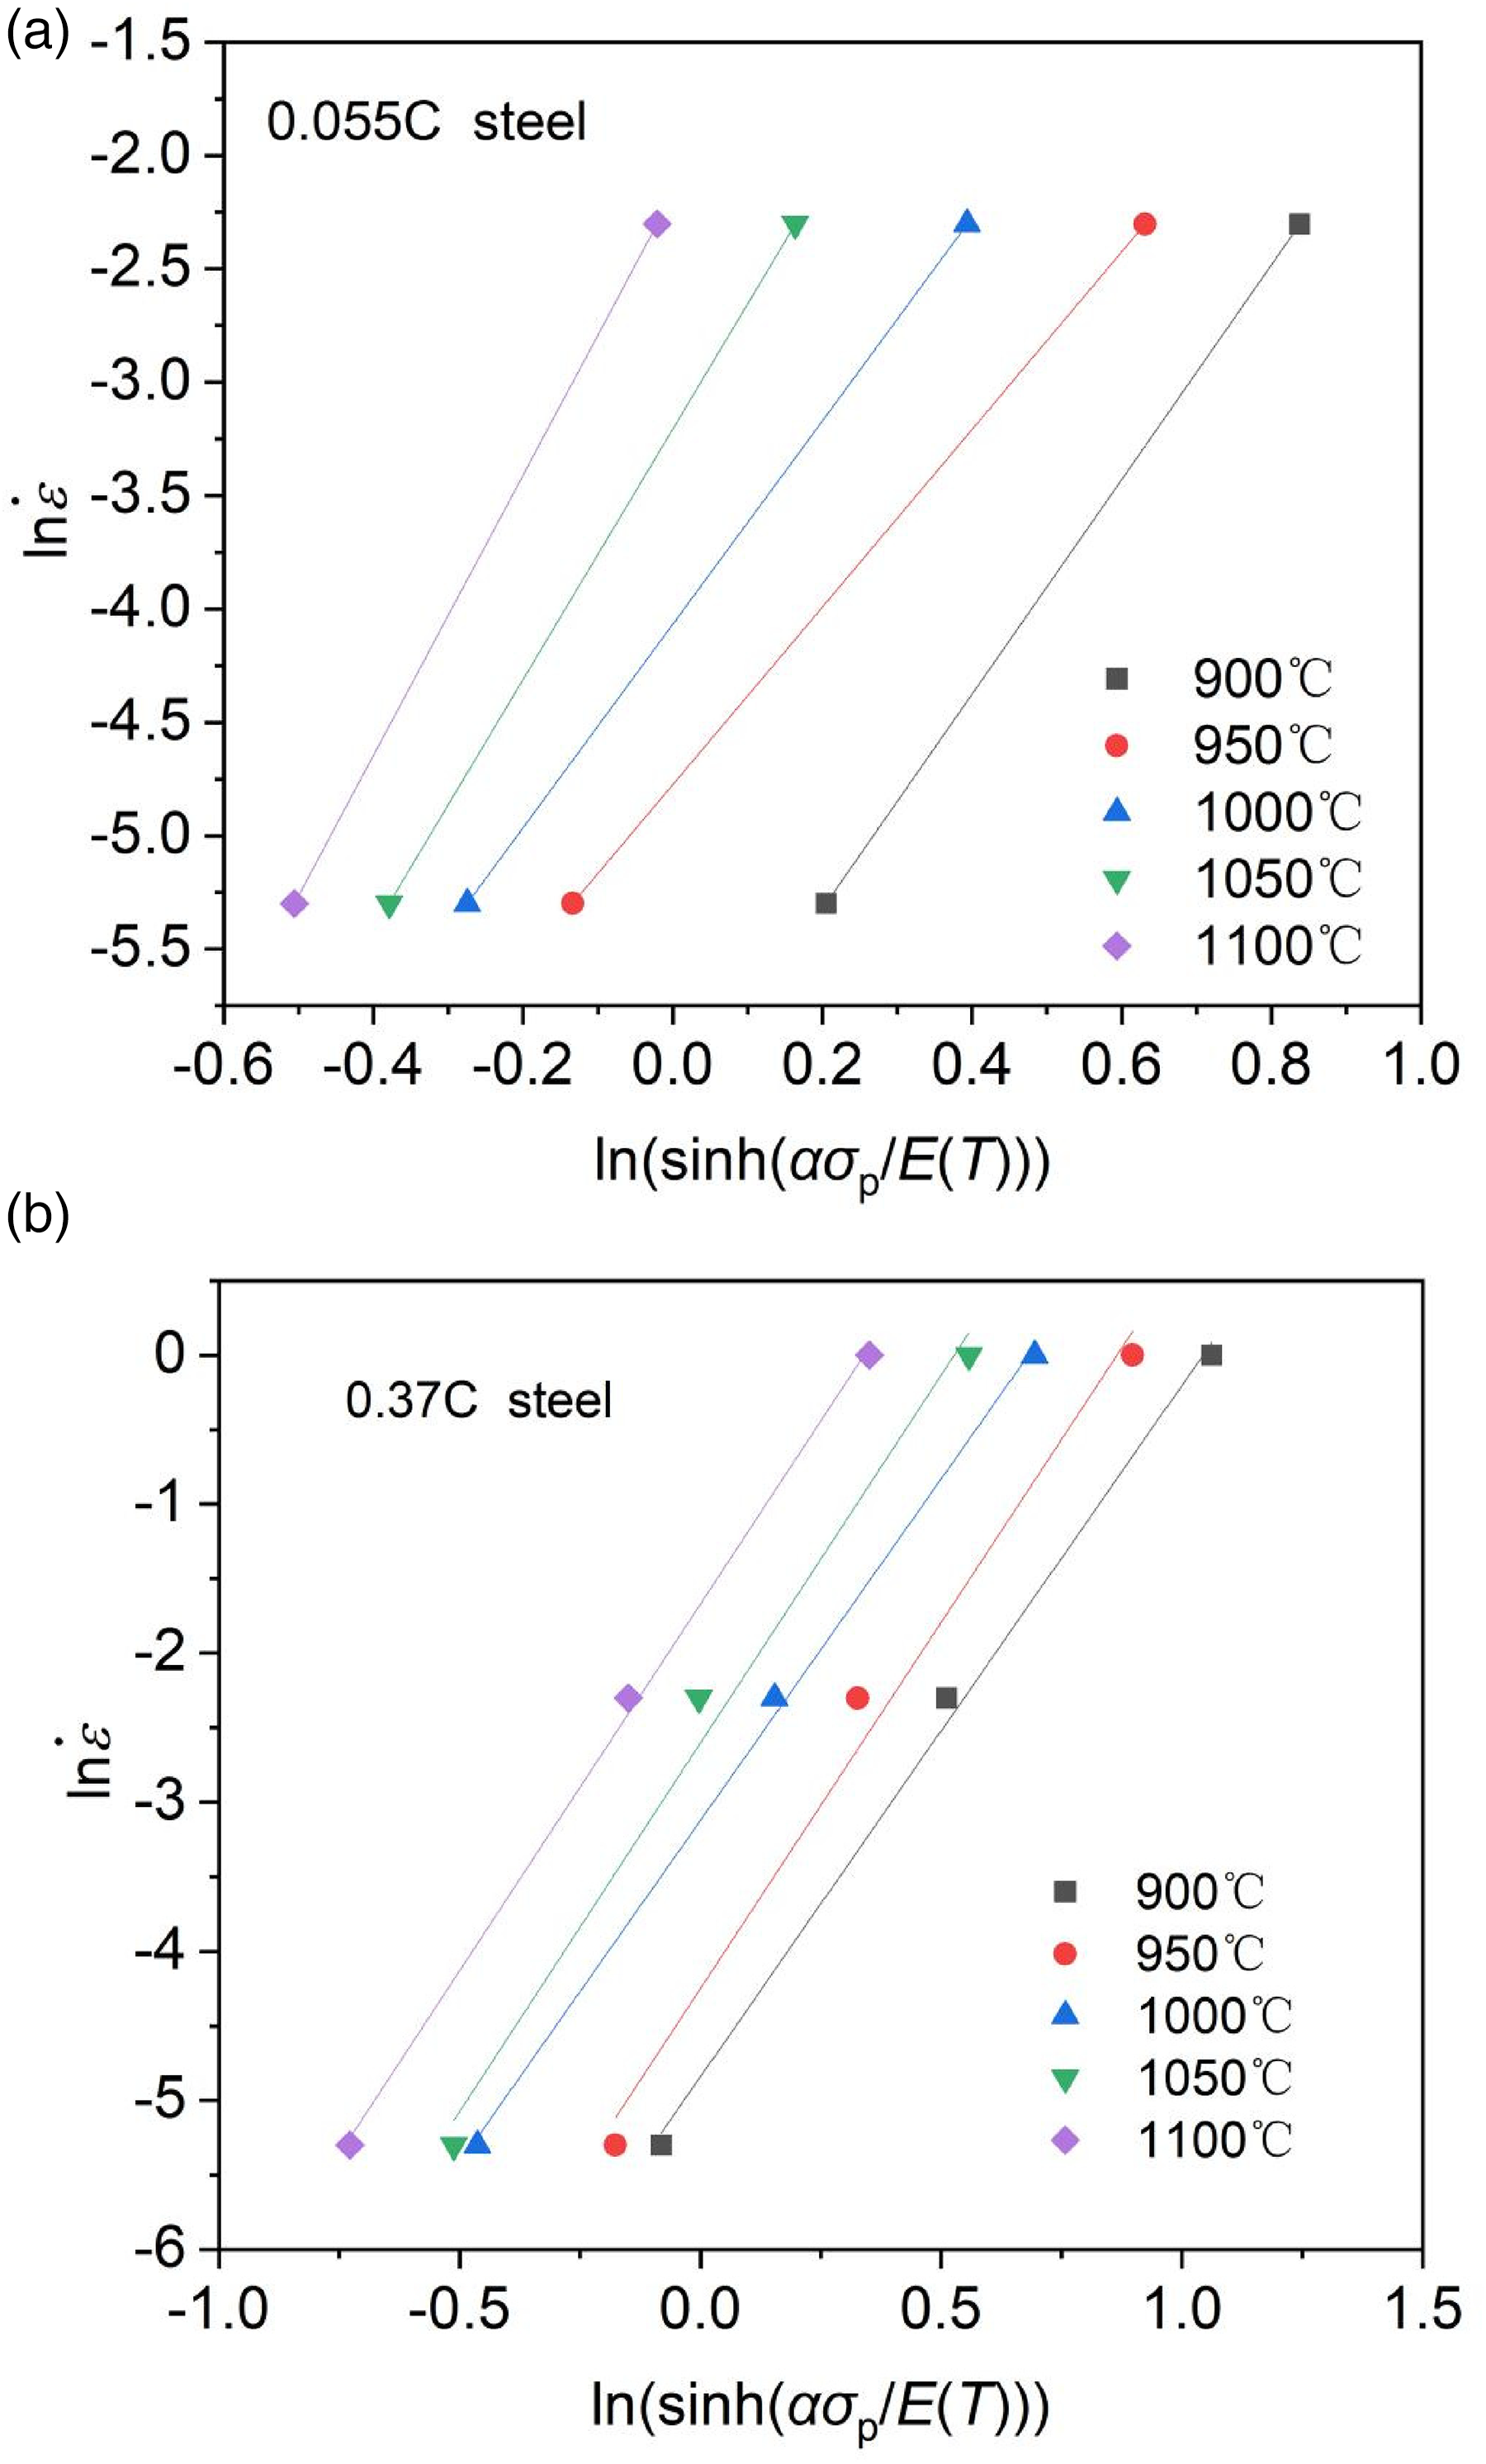
By comparing k1′DL(T) and k2′DGB(T), the model can provide information on the transition of the diffusion mechanism at different temperatures during deformation. When k1′DL(T) > k2′DGB(T), the dominant diffusion mechanism is lattice diffusion. When k1′DL(T) < k2′DGB(T), grain boundary diffusion plays a dominant role. When k1′DL(T) ≈ k2′DGB(T), the contribution of lattice diffusion and grain boundary diffusion is approximately equal.
The results show that for 0.055C steel, k2′ is negative, indicating that the diffusion mechanism of 0.055C steel is dominated by lattice diffusion. For 0.37C steel, the values of k1′DL(T) and k2′DGB(T) at different temperatures were calculated, as shown in Figure 9. It was found that at lower temperature (900–950 °C), the values of k1′DL(T) and k2′DGB(T) were relatively close, indicating that lattice diffusion and grain boundary diffusion work together. At higher temperature (1000–1100 °C), k1′DL(T) is greater than k2′DGB(T), and the higher the temperature, the greater the difference between them, indicating that the diffusion mechanism is dominated by lattice diffusion and grain boundary diffusion is supplemented. Therefore, the diffusion mechanism of 0.37C steel is a synergistic mechanism of lattice diffusion and grain boundary diffusion, and the higher the temperature, the greater the contribution of lattice diffusion.
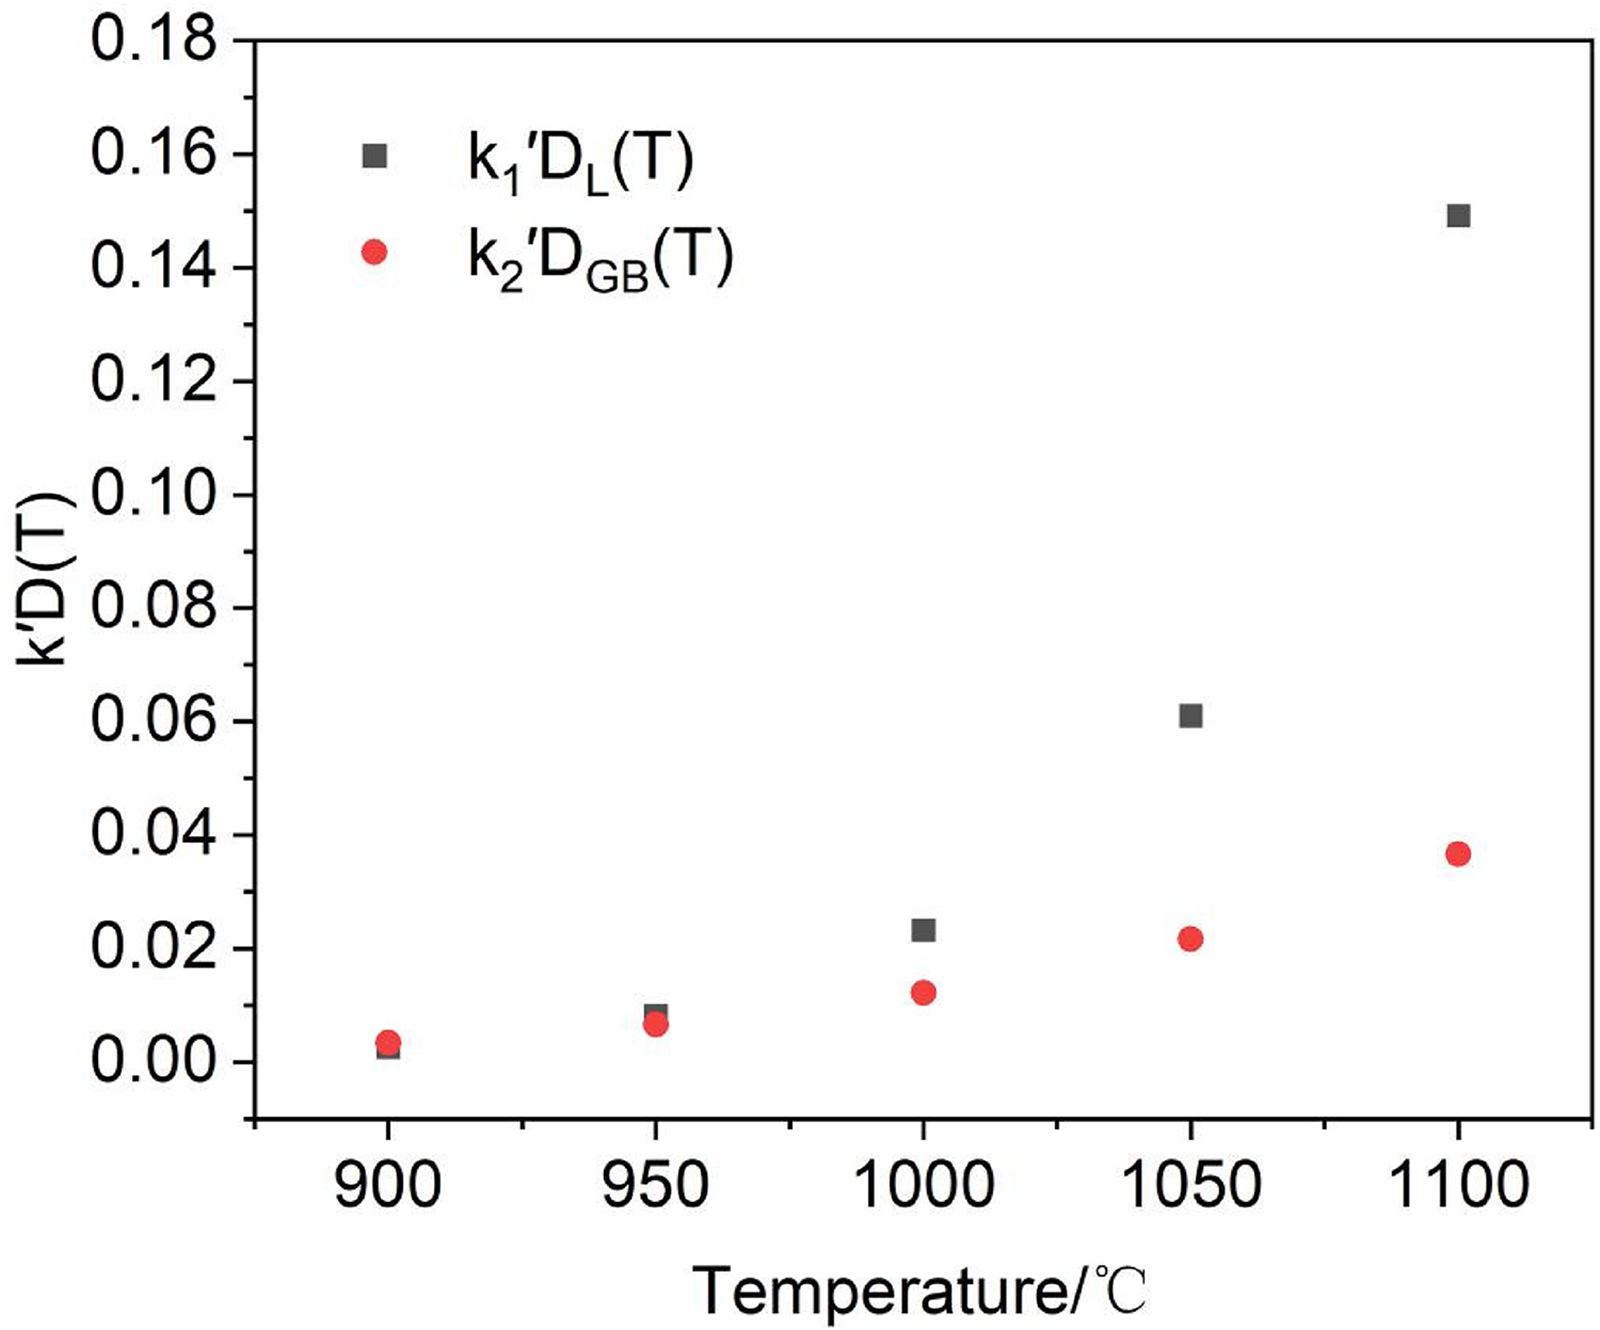
k1′dl(T) and k2′DGB(T) values of 0.37C steel at different temperatures.
According to the diffusion mechanism of 0.055C and 0.37C steel, it is inferred that the diffusion mechanism of steels changes with the increasing carbon content, from the lattice diffusion mechanism in low carbon steel to the synergistic mechanism of lattice diffusion and grain boundary diffusion in medium carbon steel. Therefore, increasing carbon content is not only beneficial to the diffusion process, but also contributes to the occurrence of grain boundary diffusion. The grain boundary diffusion is very fast and requires less activation energy than the lattice diffusion, which is conducive to the progress of plastic deformation.
Constitutive model of strain compensation
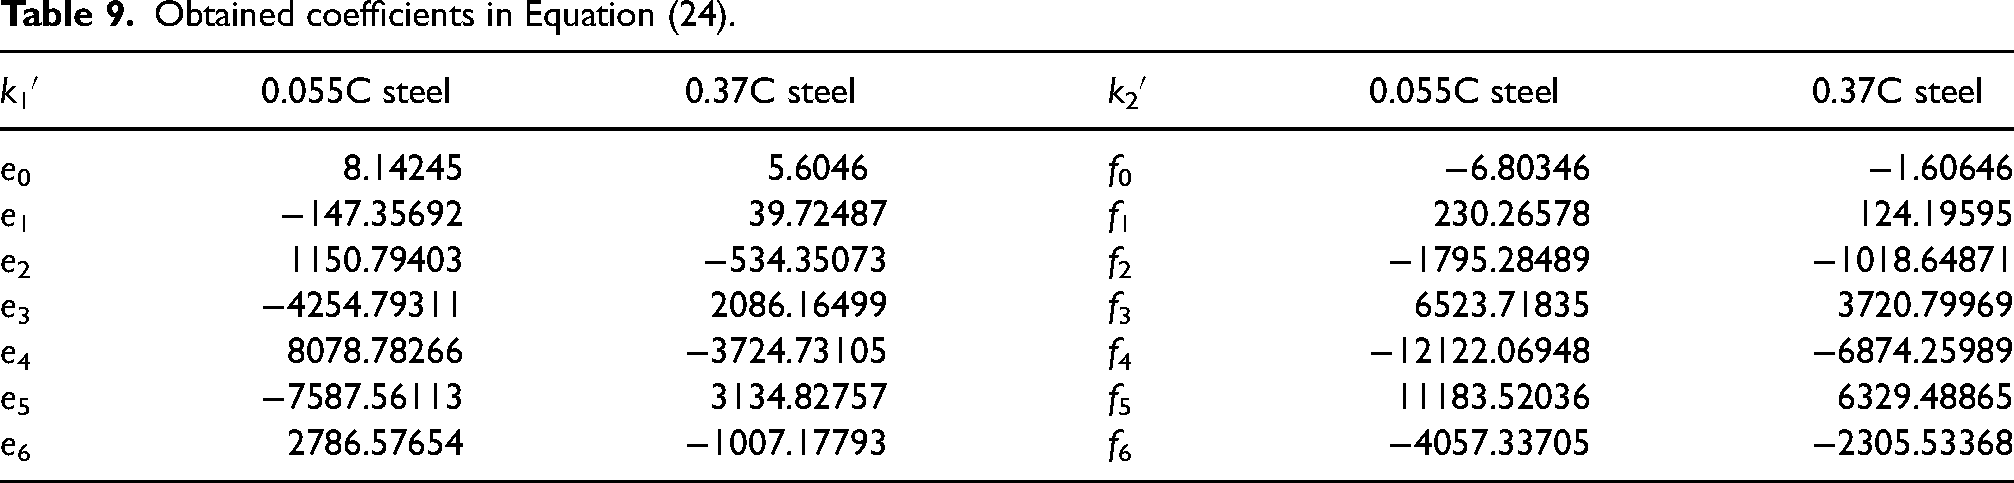
The k1′ and k2′ values under 16 different strains were obtained by referring to the method described above. The relationship between k1′, k2′, and ε can be accurately described by a sixth-order polynomial (Equation (24)), and the coefficients are shown in Table 9.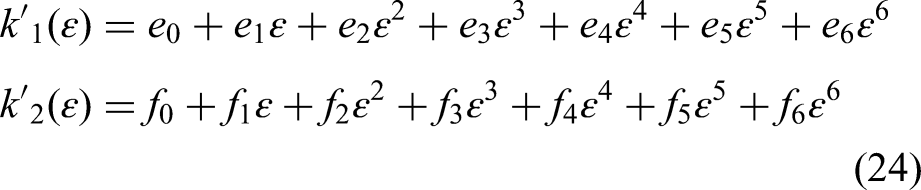
Obtained coefficients in Equation (24).
Then the constitutive model of strain compensation can be expressed as: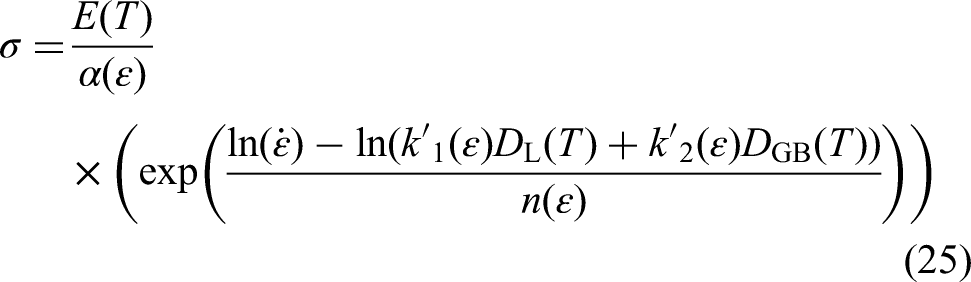
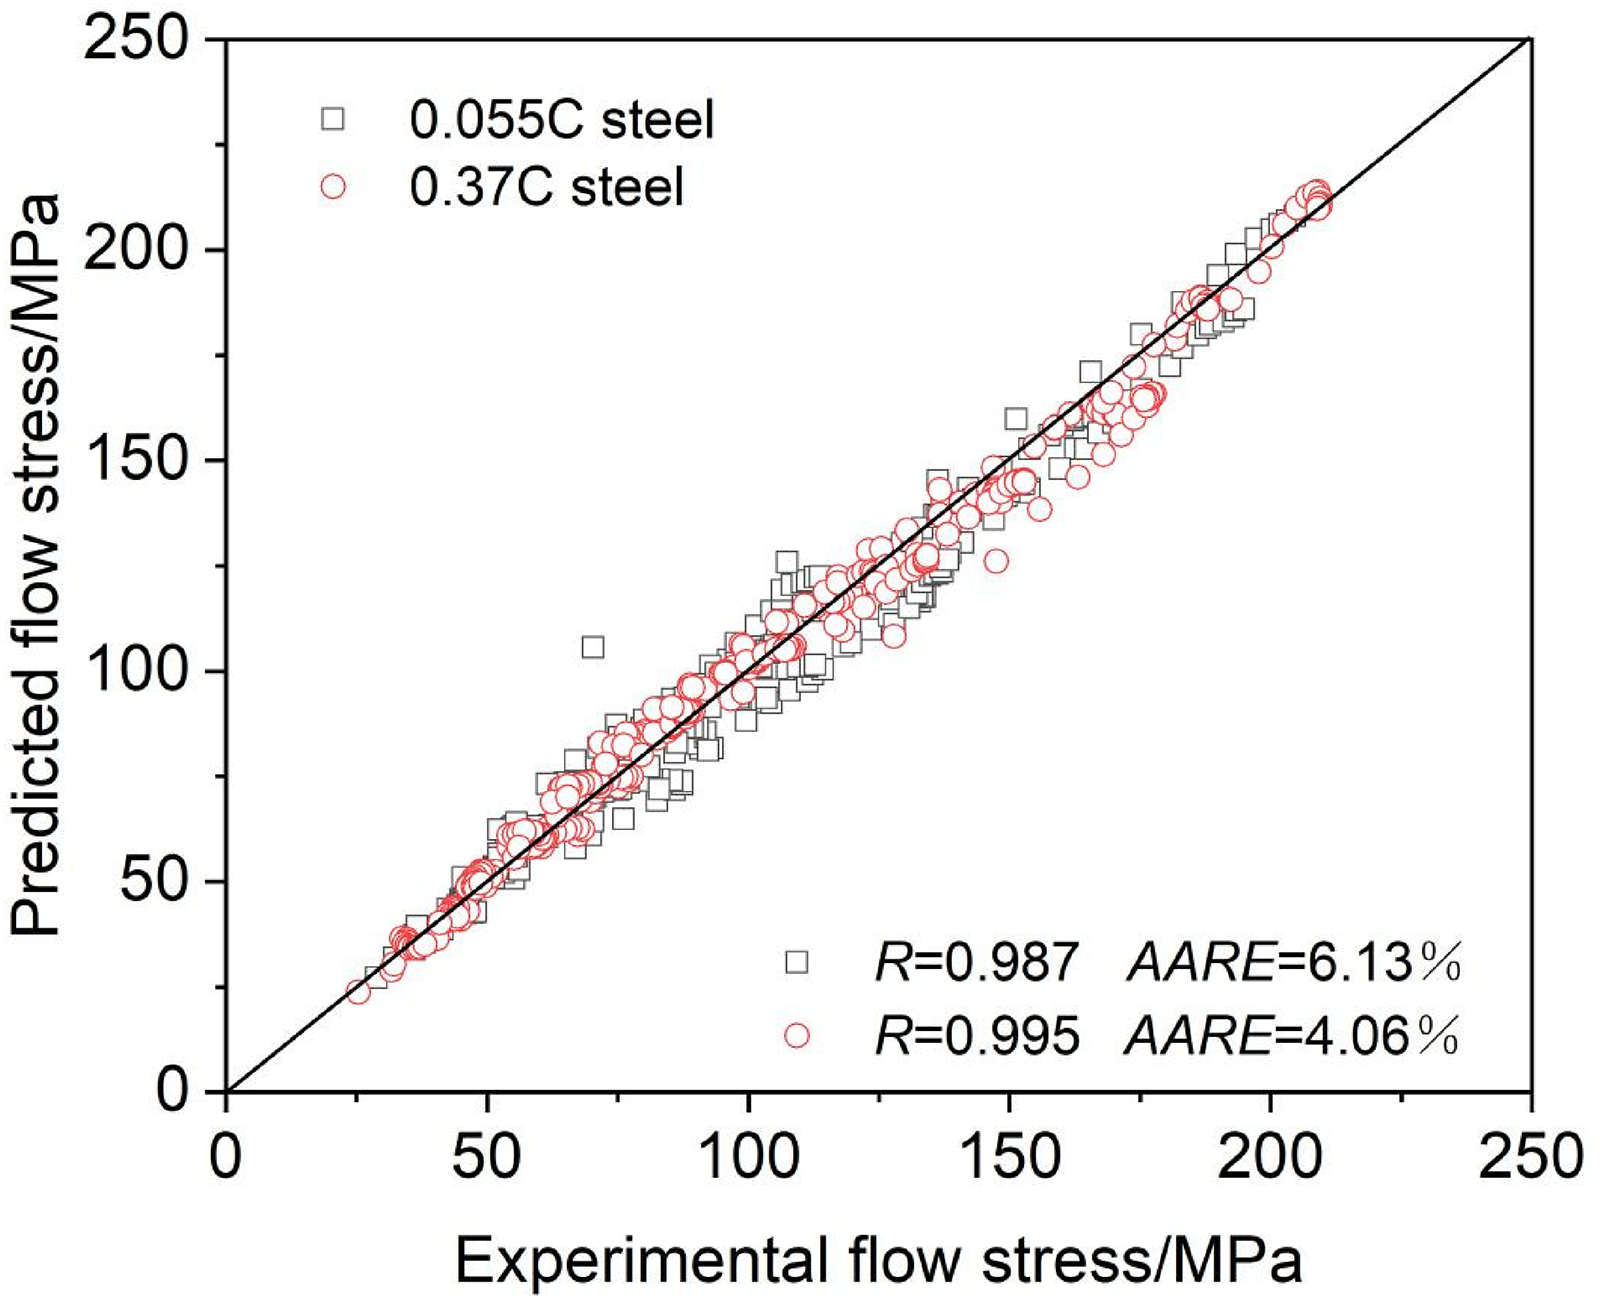
Correlation between the measured and predicted flow stress by Equation (25).
The comparison between the predicted results of the three physical constitutive models and the measured results is shown in Figures 11 and 12. For 0.055C steel, the predicted results of Equation (17) are very close to the measured values, while the predicted results of Equation (12) under certain deformation conditions are significantly different from the measured values, the accuracy of Equation (17) is higher than that of Equation (12). The predicted values of Equation (17) is close to that of Equation (25), the accuracy of the two models is similar. This is because the diffusion mechanism of 0.055C steel is mainly lattice diffusion, so the prediction accuracy of Equation (17) only considering lattice diffusion is not much different from that of Equation (25) considering lattice diffusion and grain boundary diffusion comprehensively. For 0.37C steel, there are obvious errors between the measured and predicted values of Equations (12) and (17) at lower temperatures (below 1000 °C). This may be due to the fact that these two models do not consider the grain boundary diffusion, which is more likely to occur at lower temperatures. Equation (25) takes into account the coupling effects of the two diffusion mechanisms, and has better prediction accuracy under various conditions. As mentioned before for 0.37C steel, lattice diffusion and grain boundary diffusion have the same contribution at lower temperatures, and lattice diffusion is dominant and grain boundary diffusion is secondary at higher temperatures.
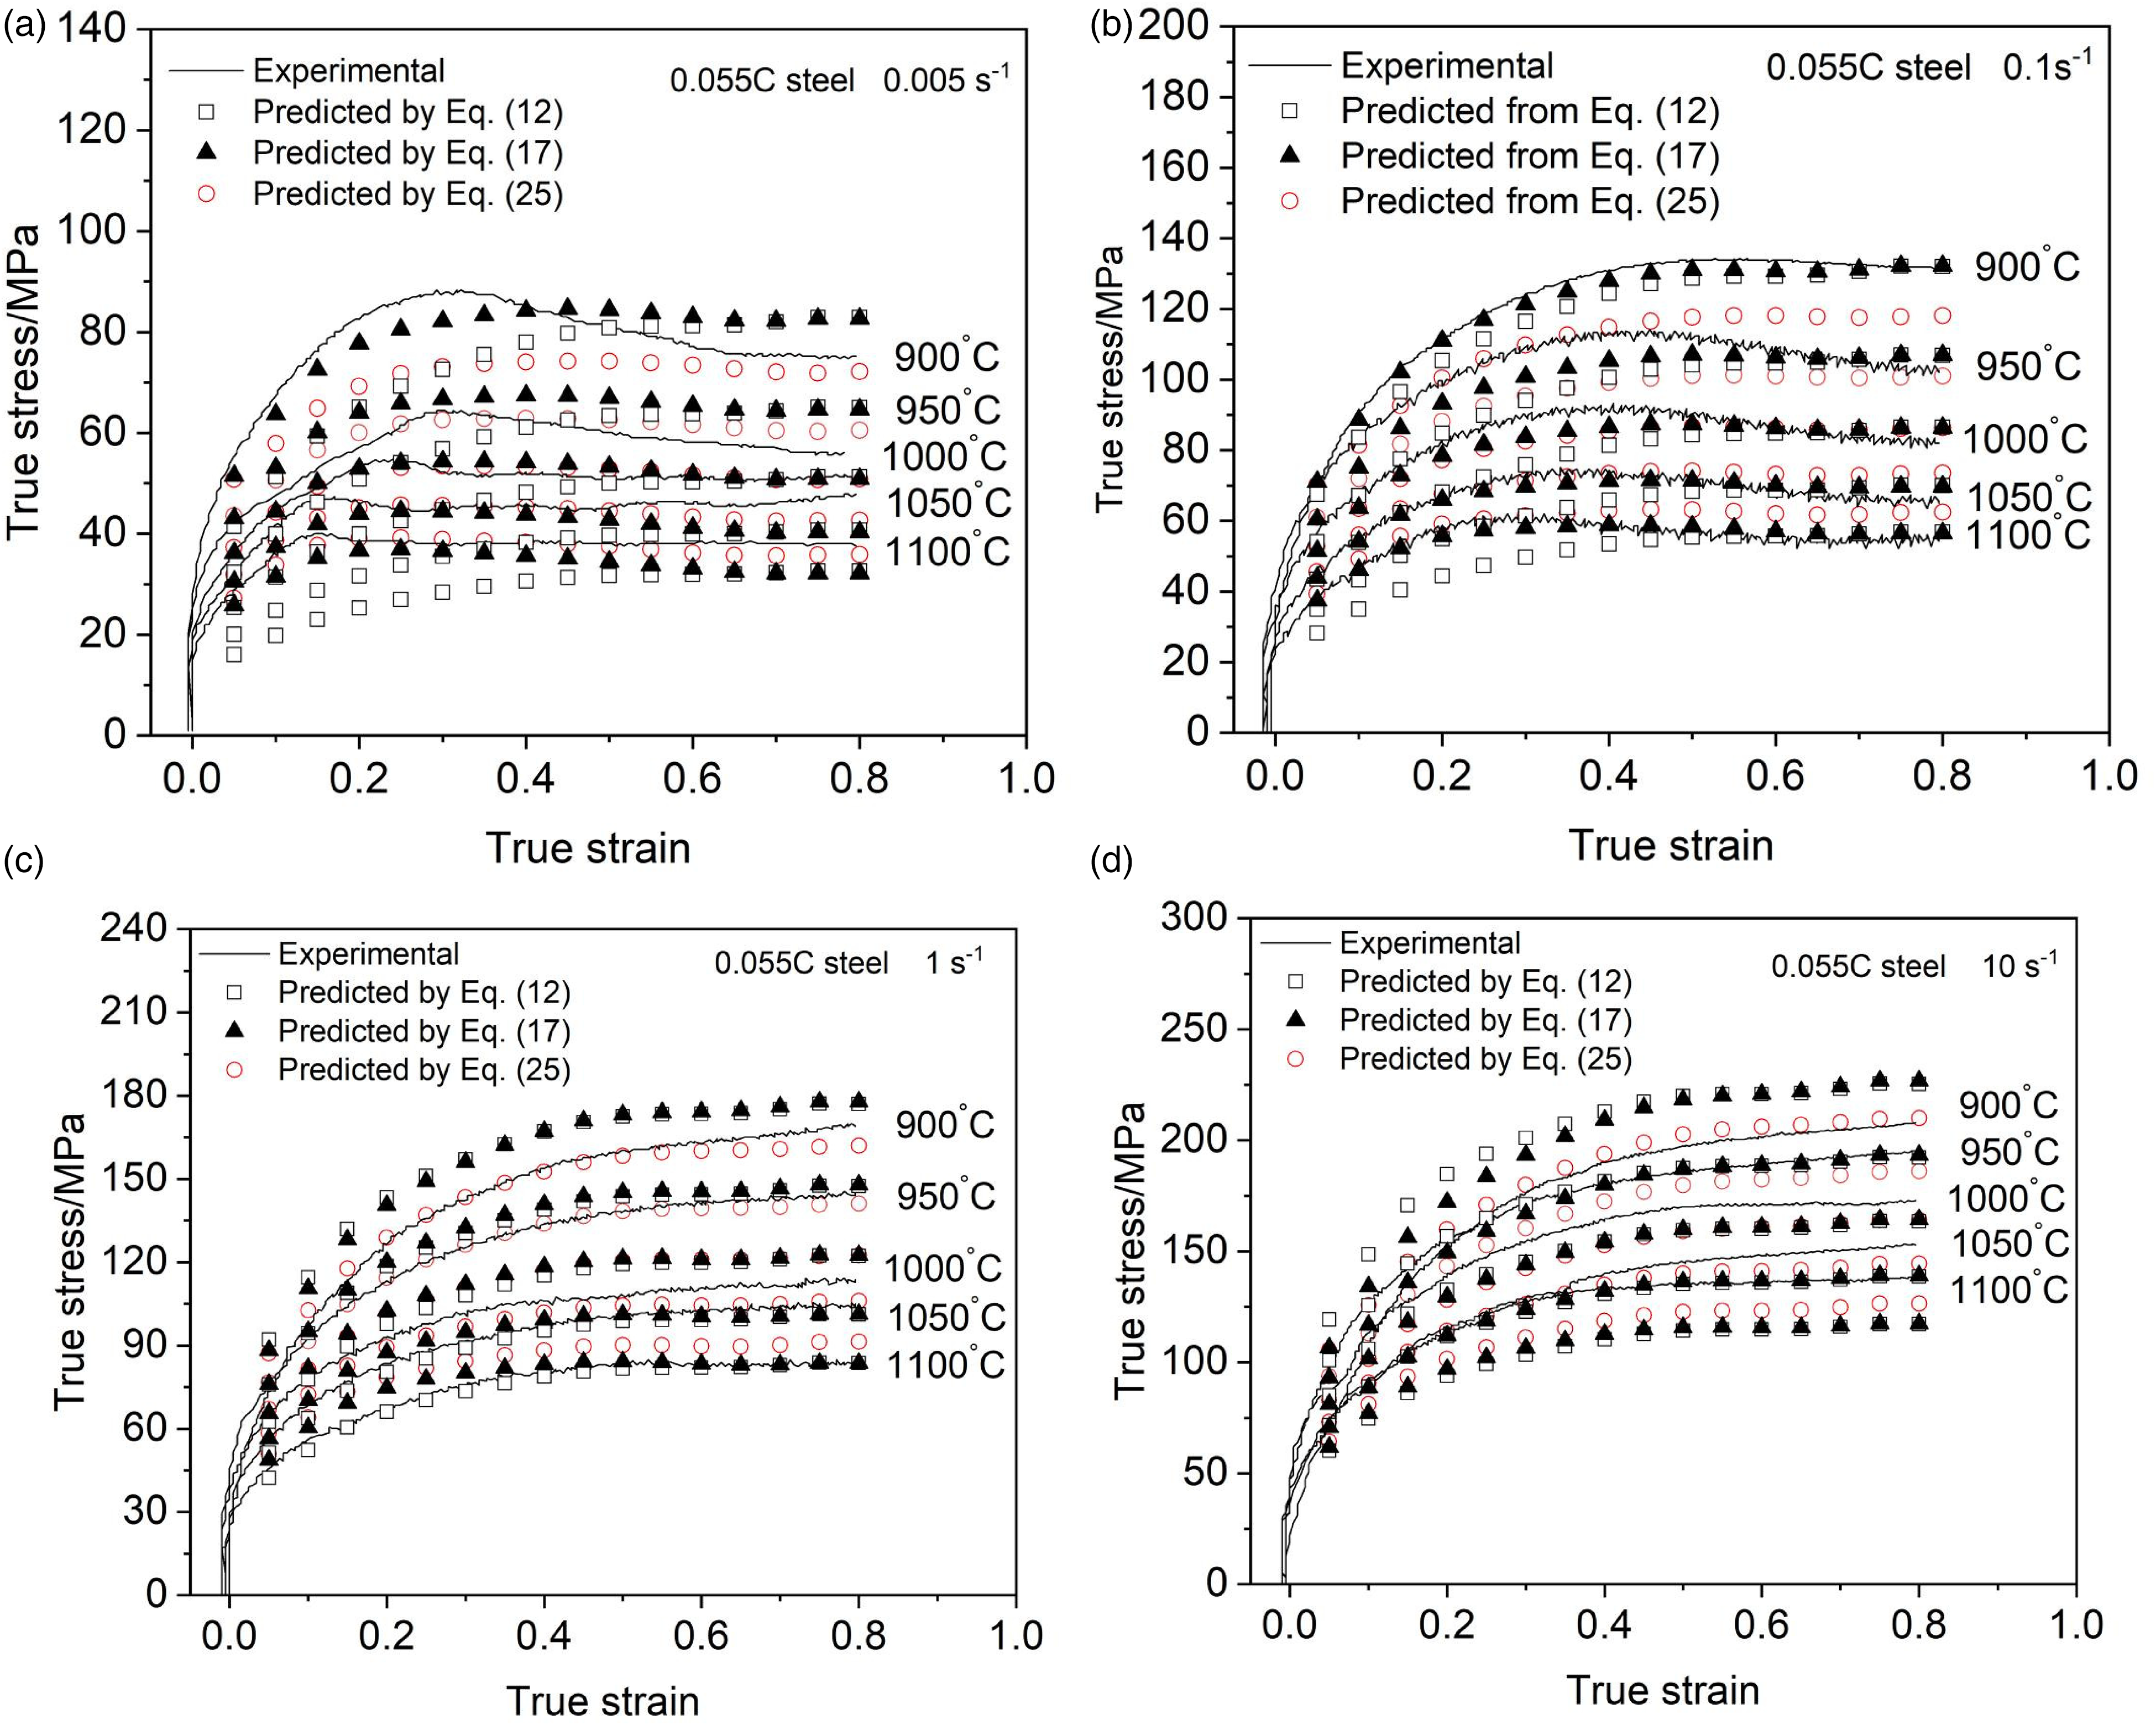
Comparisons between predicted and measured flow stress of 0.055C steel: (a) 0.005 s−1; (b) 0.1 s−1; (c) 1 s−1; (d) 10 s−1.
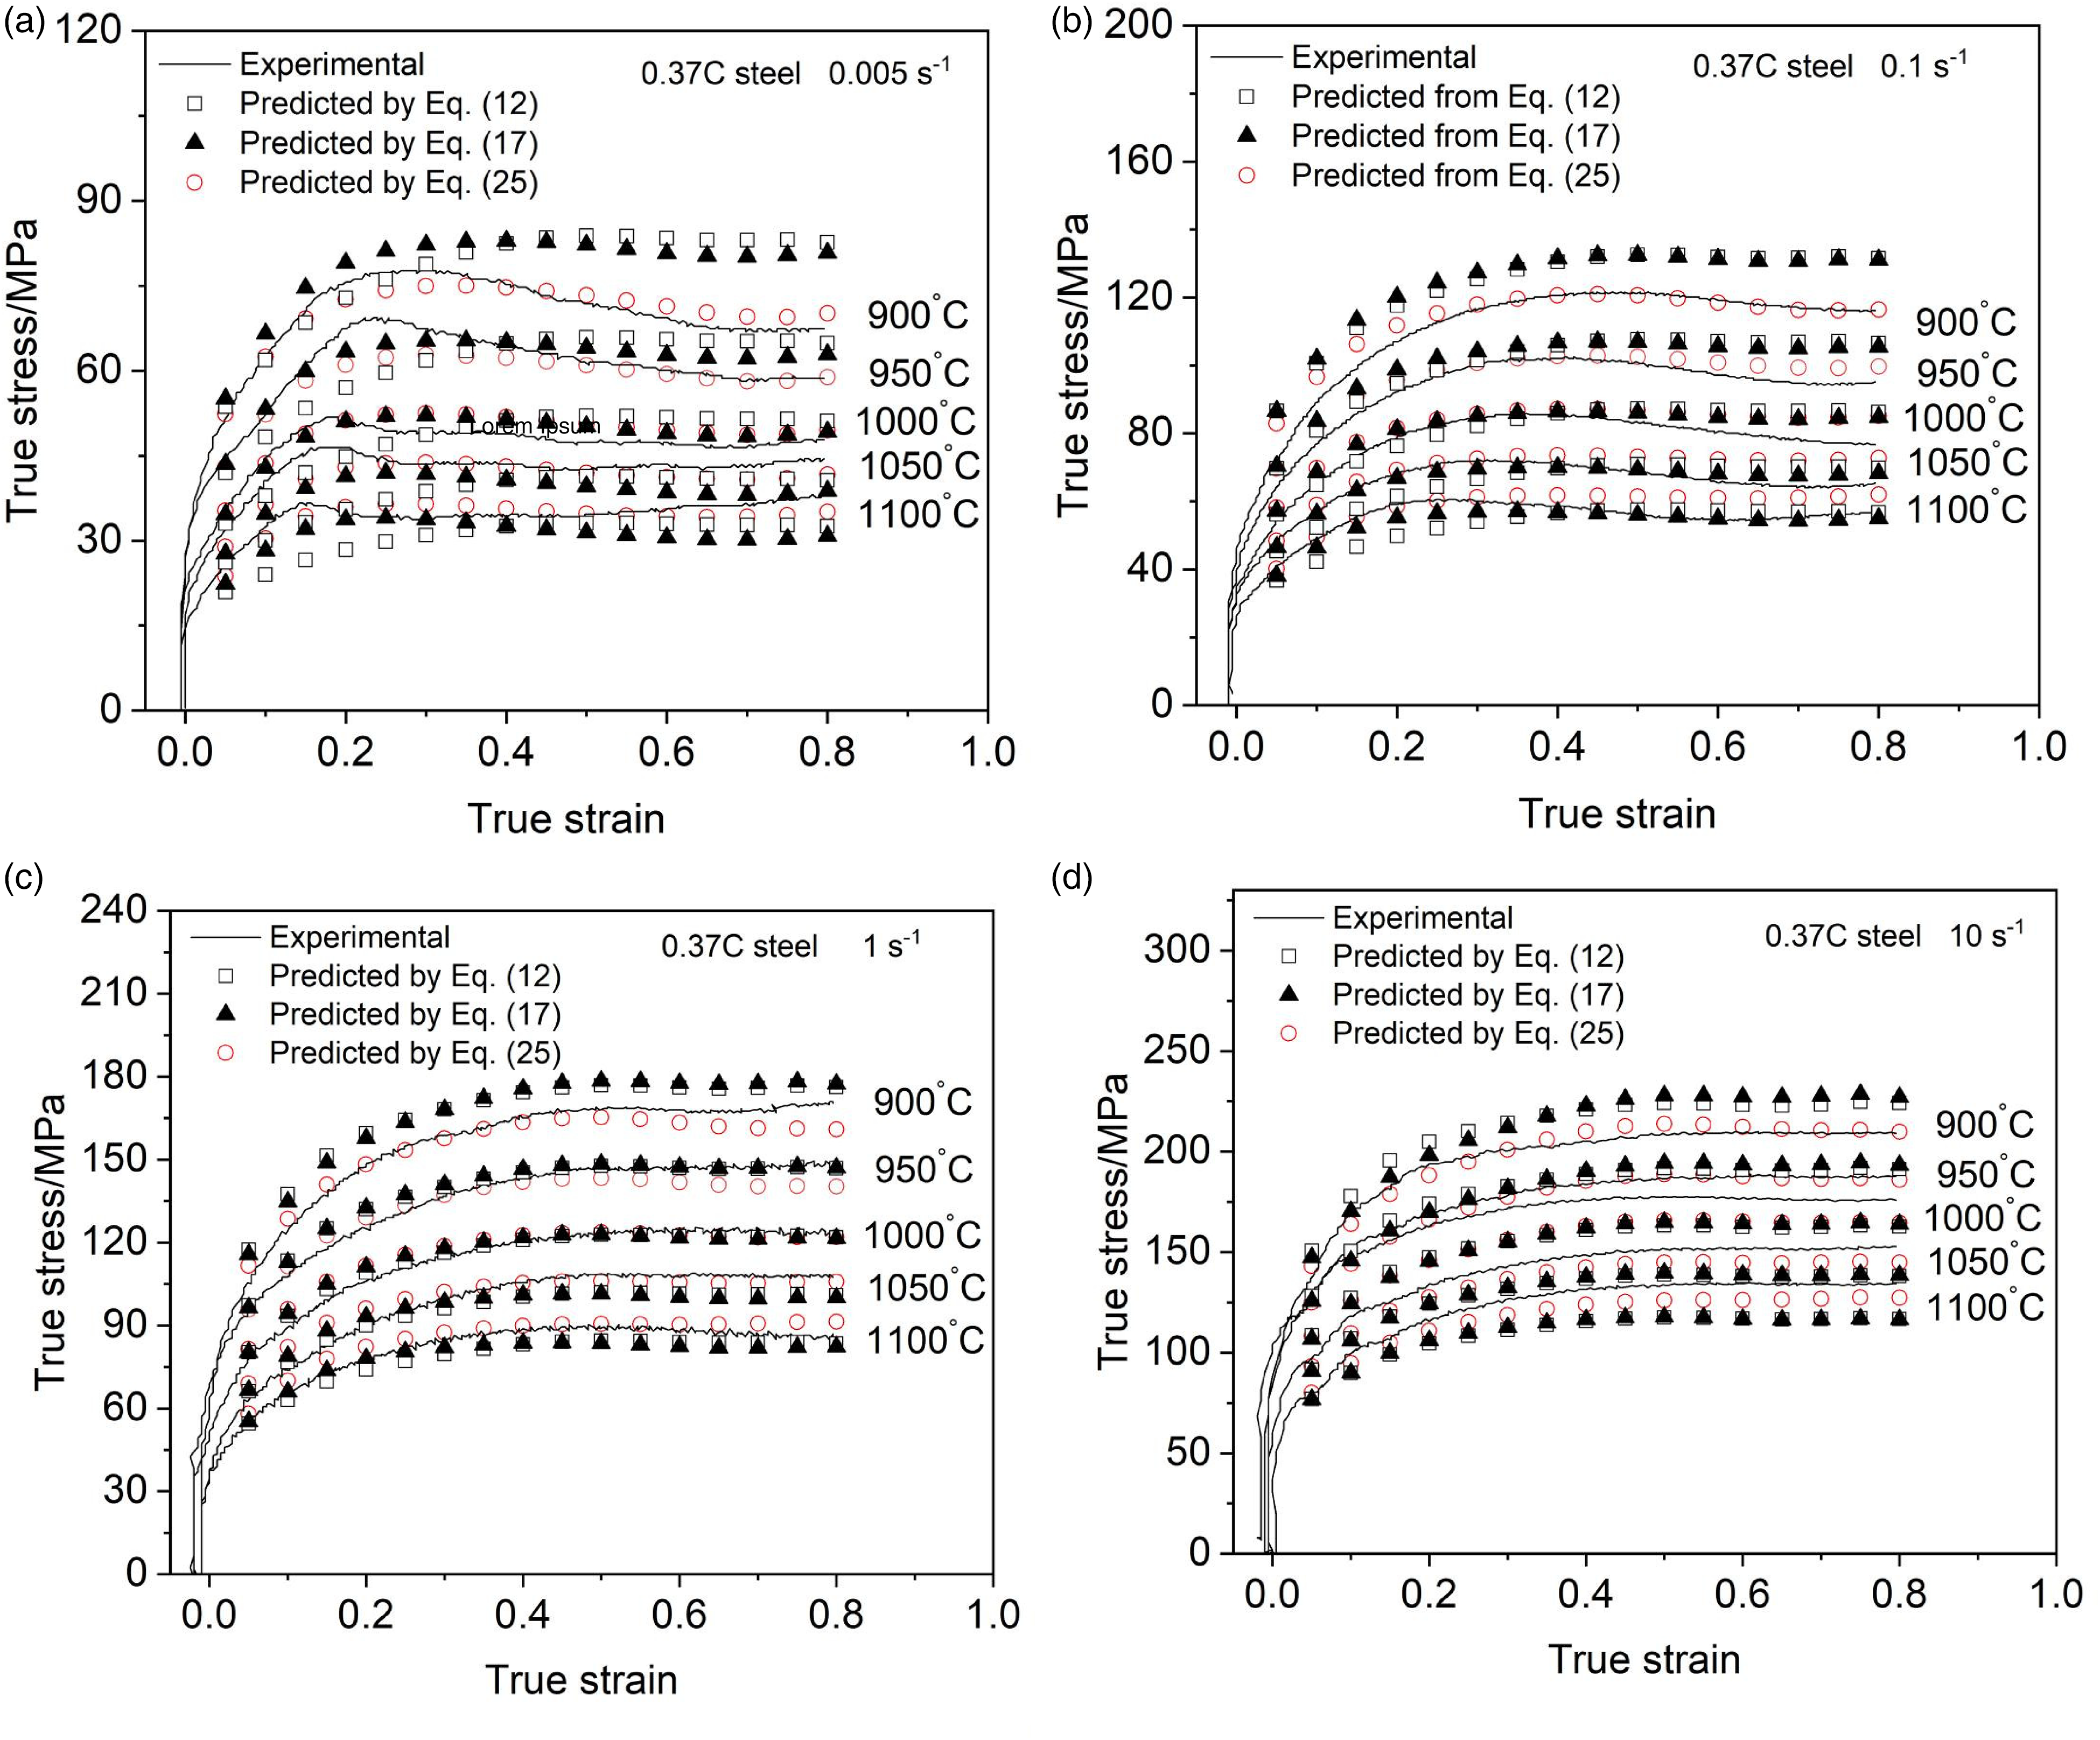
Comparisons between predicted and measured flow stress of 0.37C steel: (a) 0.005 s−1; (b) 0.1 s−1; (c) 1 s−1; (d) 10 s−1.
Conclusions
The influence of carbon on thermal deformation behaviour and deformation/diffusion mechanism of V-microalloyed steel was studied by physical constitutive analysis. The results are as follows:
Carbon has a softening effect at low strain rates, reducing flow stress and promoting the occurrence of DRX. And carbon has a hardening effect at high strain rates, increasing flow stress. The thermal deformation mechanism of 0.37C steel is dislocation climb, while other deformation mechanism may appear in 0.055C steel. For 0.055C steel, the R values of the models with exponential 5 and exponential n are 0.978 and 0.983, the AARE values are 9.96% and 6.36%, respectively. For 0.37C steel, the R values of the models are 0.985 and 0.986, the AARE values are 7.29% and 6.41%, respectively. The diffusion mechanism of 0.055C steel is mainly lattice diffusion, while that of 0.37C steel is a synergistic mechanism of lattice diffusion and grain boundary diffusion. For 0.055C steel, the accuracy of the modified model is R = 0.987, AARE = 6.13%. For 0.37C steel, the accuracy of the modified model is significantly improved with R = 0.995 and AARE = 4.06%.
Footnotes
List of symbols
Acknowledgements
This study was financially supported by the National Natural Science Foundation of China (51774006; U1860105), the Anhui Natural Science Foundation (2008085QE279; 1908085ME147) and Key Laboratory of Green Fabrication and Surface Technology of Advanced Metal Materials (GFST2022ZR05).
Declaration of conflicting interests
The authors declared no potential conflicts of interest with respect to the research, authorship, and/or publication of this article.
Funding
The authors disclosed receipt of the following financial support for the research, authorship, and/or publication of this article: The Anhui Natural Science Foundation (2008085QE279), Key Laboratory of Green Fabrication and Surface Technology of Advanced Metal Materials (GFST2022ZR05), the Anhui Natural Science Foundation (1908085ME147), National Natural Science Foundation of China (51774006; U1860105).