
Abstract
Objectives:
Estimating the mesiodistal dimensions of unerupted canines and premolars in early mixed dentition is a critical tool in space management. According to previous studies, tooth size varies by ethnicity which could affect diagnosis and treatment planning. The aim of the study was to know whether the Tanaka-Johnston method is valid for the North Karnataka population.
Materials and Methods:
A total of 4,600 school children (2,300 boys and 2,300 girls) (age 11-16 years) with no craniofacial skeletal abnormalities, with no history of orthodontic and orthopedic treatment or maxillofacial surgeries, from 2013 June to 2019 June were taken for mixed dentition analysis by the Tanaka-Johnston method. Pearson correlation test was used to identify the correlation between various variables.
Results:
The findings revealed a sexual dimorphism in the widths of canine and premolar widths in the maxillary and mandibular teeth. A statistically significant difference was found between the width of the sum of incisor widths and the actual widths of canine and premolars for maxillary and mandibular arches, regardless of gender.
Conclusion:
The Tanaka-Johnston analysis was not precise enough to be used for the North Karnataka population in its original form, so new regression equations were developed.
Introduction
The assessment of tooth size-arch length discrepancy has always been of utmost importance during orthodontic diagnosis and treatment planning among children. This aids mixed dentition analysis in determining the space necessary for the eruption of canines and premolars. Malocclusion usually starts during mixed dentition and addressing them as early as possible will widen the treatment options and make them more effective.
The decisions in the orthodontic treatment plan during mixed dentition regarding the applicability of serial extraction, eruption guidance, space maintenance, or regaining are influenced by the clinical picture given by the mixed dentition analysis. This requires almost a near-perfect estimation of the space required for the erupting teeth using the available resources.
There have been various methods for estimating the widths of permanent canines and premolars in literature which are mainly of three types.
Radiographic measurements Estimation using the dimensions of erupted permanent teeth using equations or prediction charts A combination of these
Two regularly used methods for estimation of mesiodistal width of erupting teeth are Moyers mixed dentition analysis and Tanaka-Johnston analysis.1,2 Most of the available methods of mixed dentition analysis predict the space required for the unerupted canines and premolars from measurements of teeth already erupted in the arch or other radiographic measurements. The simplest and commonly used method is Tanaka-Johnston mixed dentition analysis which uses the dimensions of the erupted mandibular incisors. Out of all the methods, the analysis given by Tanaka and Johnston is the simplest and least time-consuming in a clinical scenario.
Tanaka-Johnston analysis for mixed dentition is based purely on data that had been derived from a population of Northern European descent; therefore, the accuracy of this prediction method will be questionable when used to study populations of distinct racial origins. Also, the reliability of using the single method of calculation for male and female populations, instead of considering them separately, has been questioned. Furthermore, there has been some evidence of secular trends in shifting tooth size, which may necessitate gradual modifications to mixed dentition analyses for various populations.3
Estimation error of the method and biological and environmental factors associated with the impact of the various sociocultural customs inevitably decreases the authenticity of theoretical Tanaka-Johnston prediction methods.4,5 Studies have been conducted to compare prediction methods and actual results in different populations, to determine if the methods work.6
Some of these studies suggest that the Tanaka-Johnston method underestimates/overestimates actual tooth size.4,6 Hence, it is necessary to evaluate the applicability of the method used to predict the unerupted dental width. There have not been any previous studies assessing the applicability of Tanaka-Johnston equations in the North Karnataka population.
In light of the foregoing, the current study was created with the following goals and objectives in mind. (a) In the North Karnataka population, determine the relationship between the widths of the mandibular permanent incisor and the combined widths of the permanent canines and premolars. (b) To see if the Tanaka-Johnston method of prediction is accurate in the North Karnataka population.
Materials and Methods
The present study was conducted retrospectively among children aged between 11 and 16 years who reported to the Department of Orthodontics, for a period of 6 years from 2013 June to 2019 June. In this study, 4,600 participants were involved. With the help of the following formula, the sample size was chosen using power analysis with a confidence level of 95% and a margin of error of ±5%.
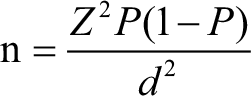
Here,
Z represent statistics at a 5% level of significance,
d represent margin of error,
P represents the anticipated prevalence rate.
Samples were divided into 2 groups (2,300 girls and 2,300 boys). Ethical approval for this long-term study was taken which was provided by the institutional ethical committee (ARDCH/IEC/13-14/26). Inclusion criteria included (a) age range of 11 to 16 years, (b) children with at least 1 previous generation of North Karnataka descent, (c) the permanent teeth (excluding third molars) must have fully erupted with intact proximal surfaces, marginal ridges, incisal edges, and contact points, and (d) relationship between a canine and a molar in Class I.
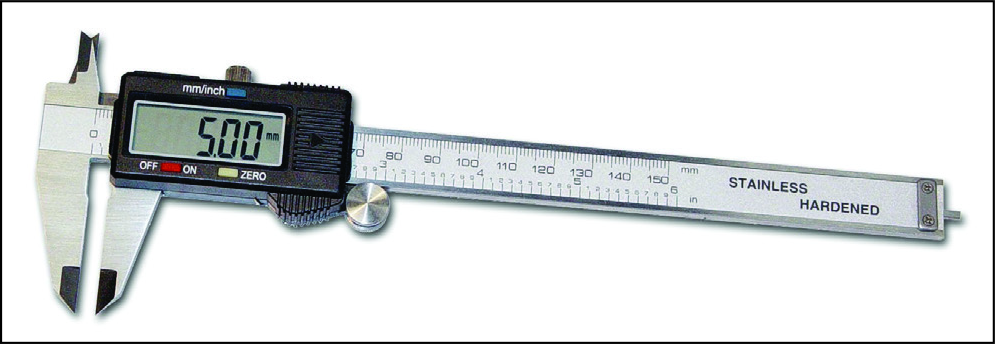
Children with abnormal tooth numbers, forms, sizes, or structures, visible tooth substance loss due to attrition or trauma, significant caries or artificial crowns on teeth, transverse discrepancies such as a crossbite, or any history of orthodontic treatment were excluded from the study. The measurements were done on the dental casts with the help of a digital caliper (Aerospace Digimatic Vernier Caliper, range: 0-150 mm) with precision up to 0.01 mm (Figures 1 and 2).
Digital Caliper (Aerospace).
Measurement of Tooth Widths Using the Caliper.
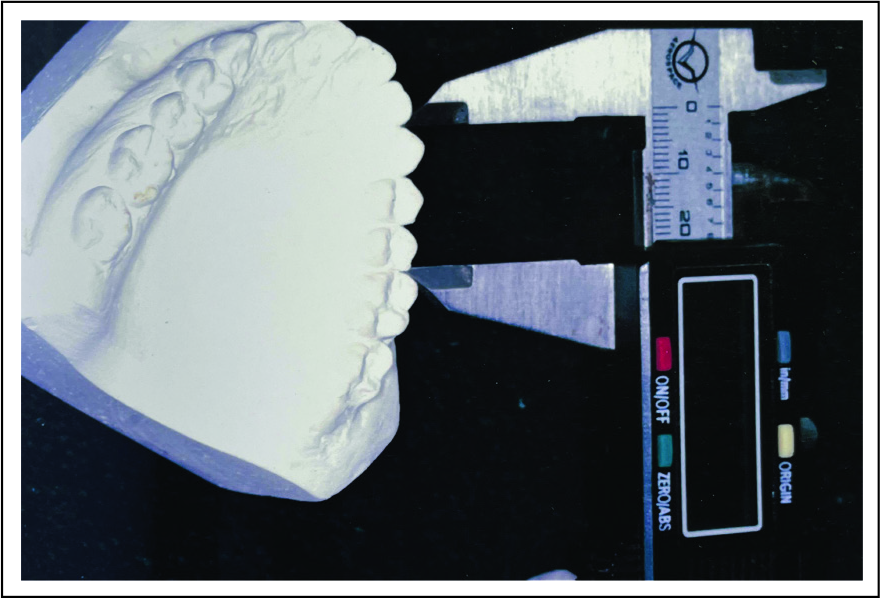
The mesiodistal widths of the canine and the first and second premolars were measured from anatomical mesial and distal contact points for each tooth. The caliper was held at the tooth’s greatest mesiodistal diameter, parallel to the occlusal surface, and perpendicular to the long axis of the tooth and all the measurements were made according to the technique of Jensen et al,7 with the beaks entering the interproximal area from either of the buccal side (Figure 3).
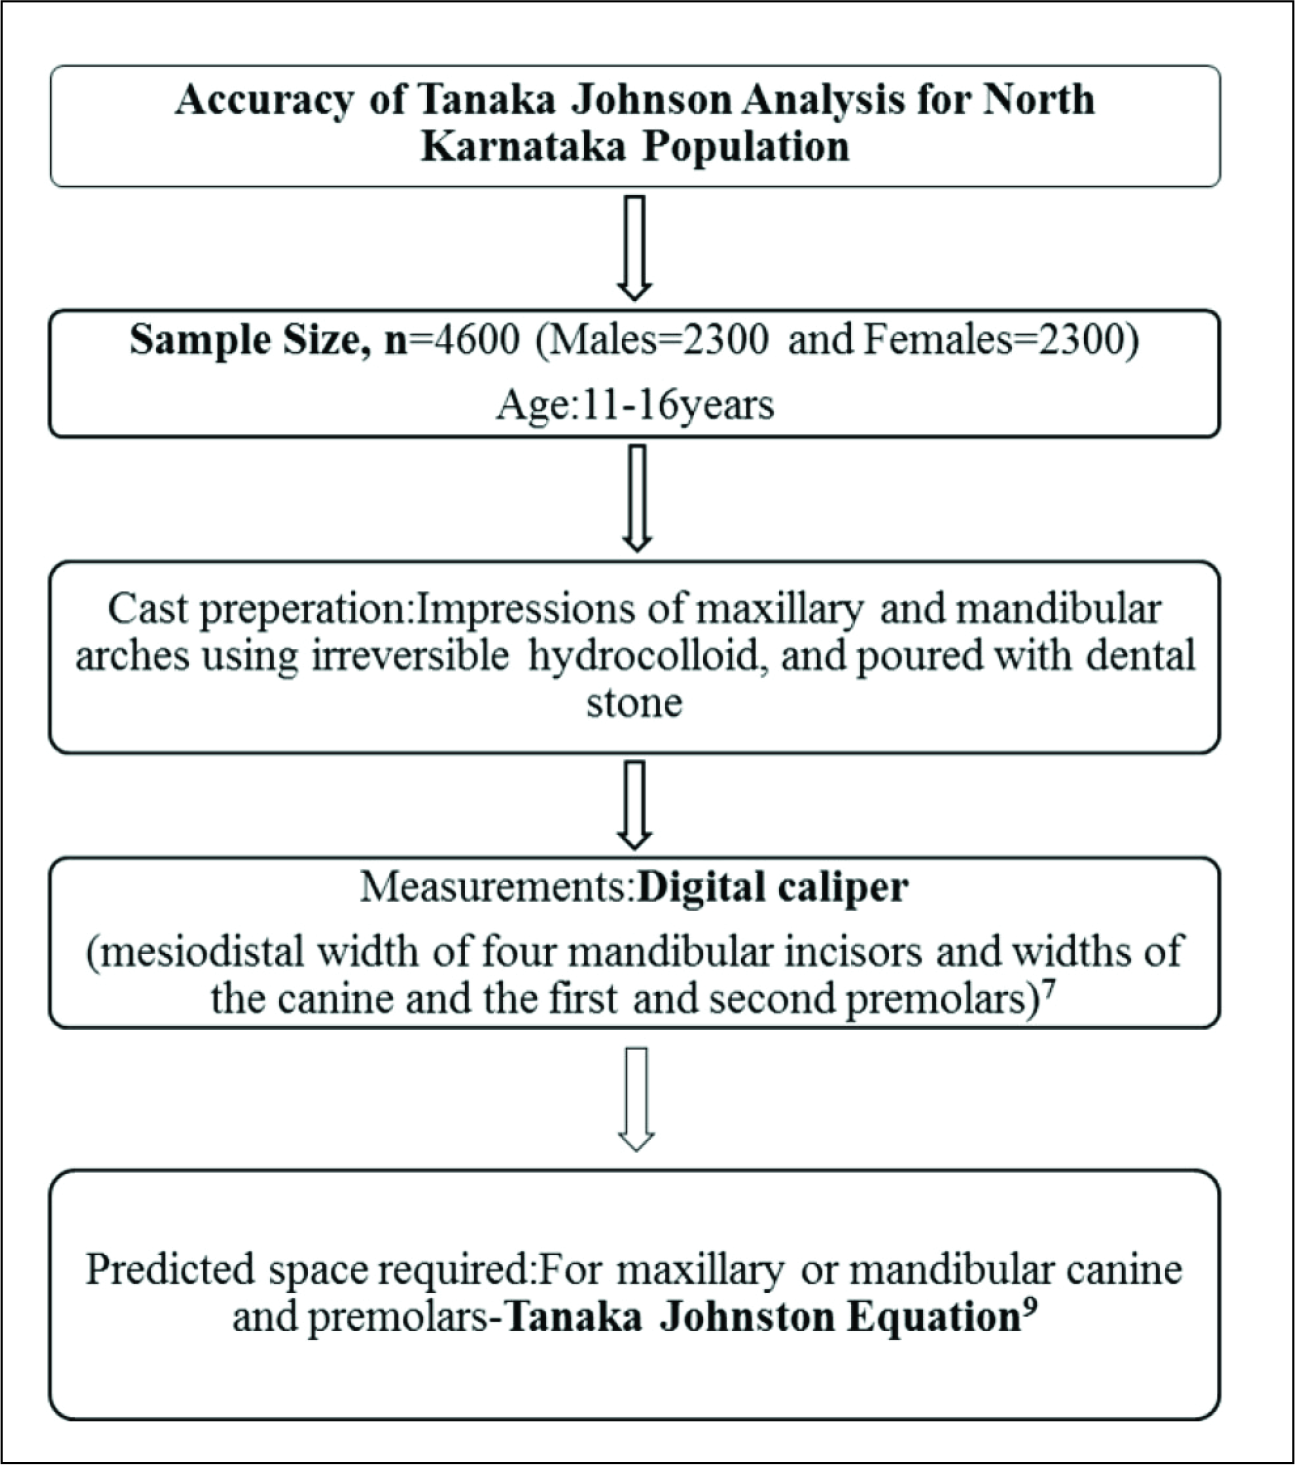
Flow Diagram Explaining the Method of Doing Tanaka-Johnson Analysis.
All the readings were taken thrice, and their mean was calculated and used for the precision of further statistical analysis. To avoid interoperator errors, all measurements were taken by a single operator. Bishara et al8 advised that interexaminer and intraexaminer reliability be set at 0.2 mm. Investigator’s 2 measurements were compared, and if there was less than a 0.2-mm difference, the values were averaged. The teeth were remeasured if the difference was greater than 0.2 mm, and the nearest 3 measurements were averaged.
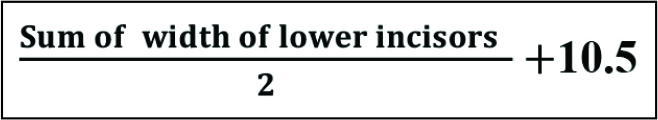
Tanaka-Johnston Equation2
Predicted space required for maxillary canine and premolars in 1 quadrant
Predicted space required for mandibular canine and premolars in 1 quadrant
Statistical Analysis
Data analysis was carried out using statistical software by IBM SPSS Statistics (Version 22). Descriptive data were presented in the form of mean and standard deviation. In the data summaries and diagrammatic display of categorical data, numbers and percentages were used. An unpaired t-test was used to test the difference of the means of analysis variables between 2 independent groups. The strength and direction of relationships between the interval levels of variables were tested using Pearson’s correlation test. Linear regression was used for predictive analysis.
Results
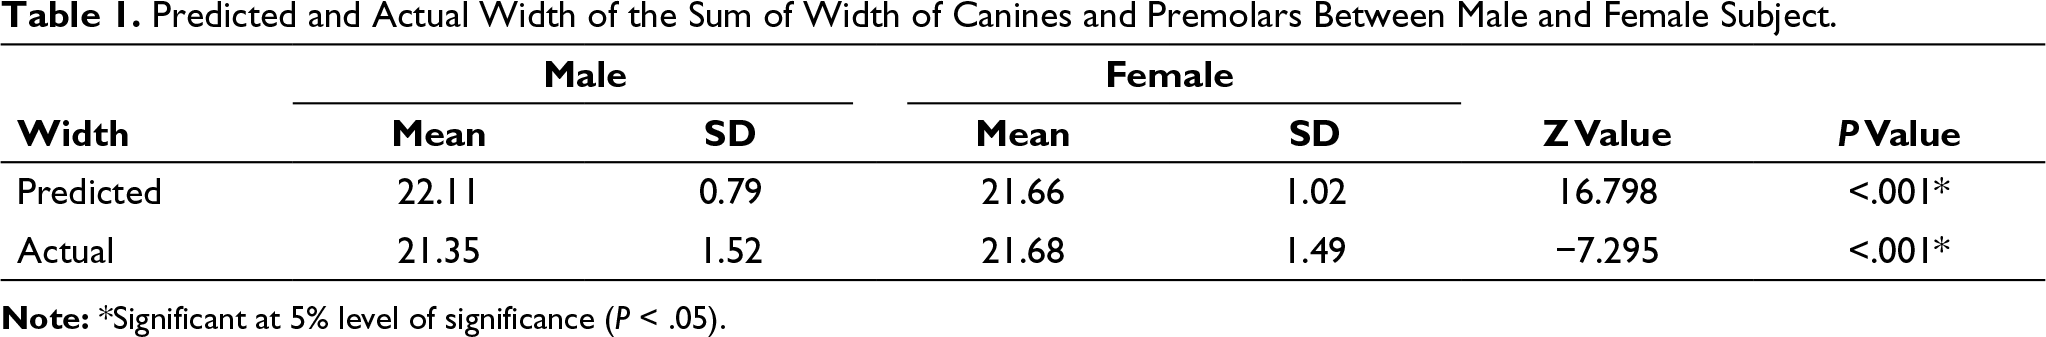
Predicted and Actual Width of the Sum of Width of Canines and Premolars Between Male and Female Subject.
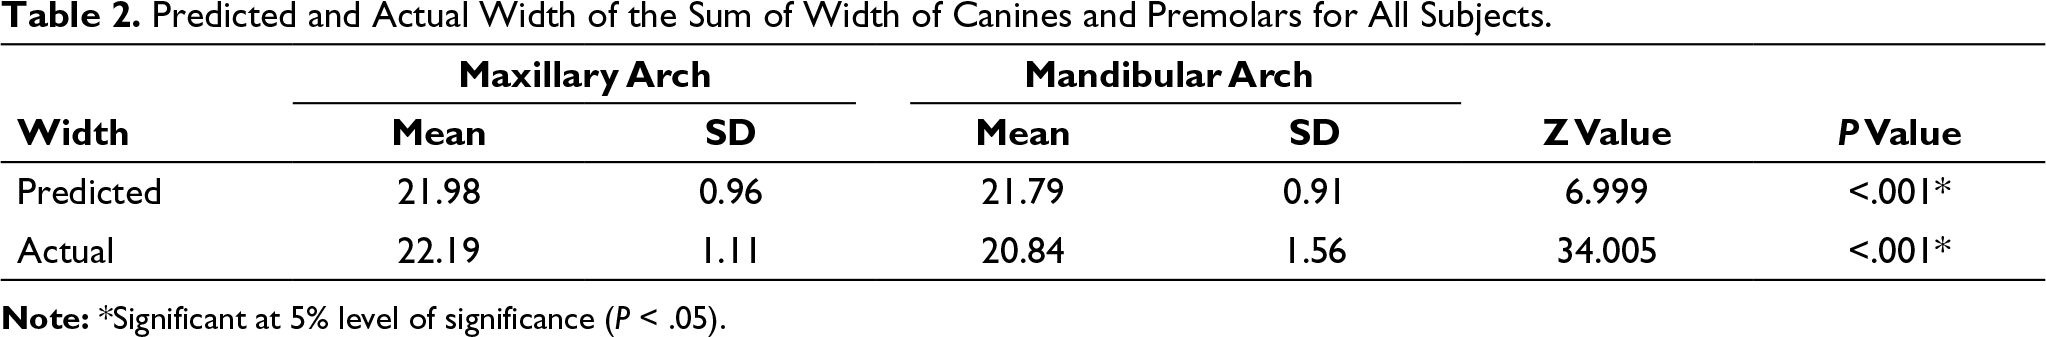
Predicted and Actual Width of the Sum of Width of Canines and Premolars for All Subjects.
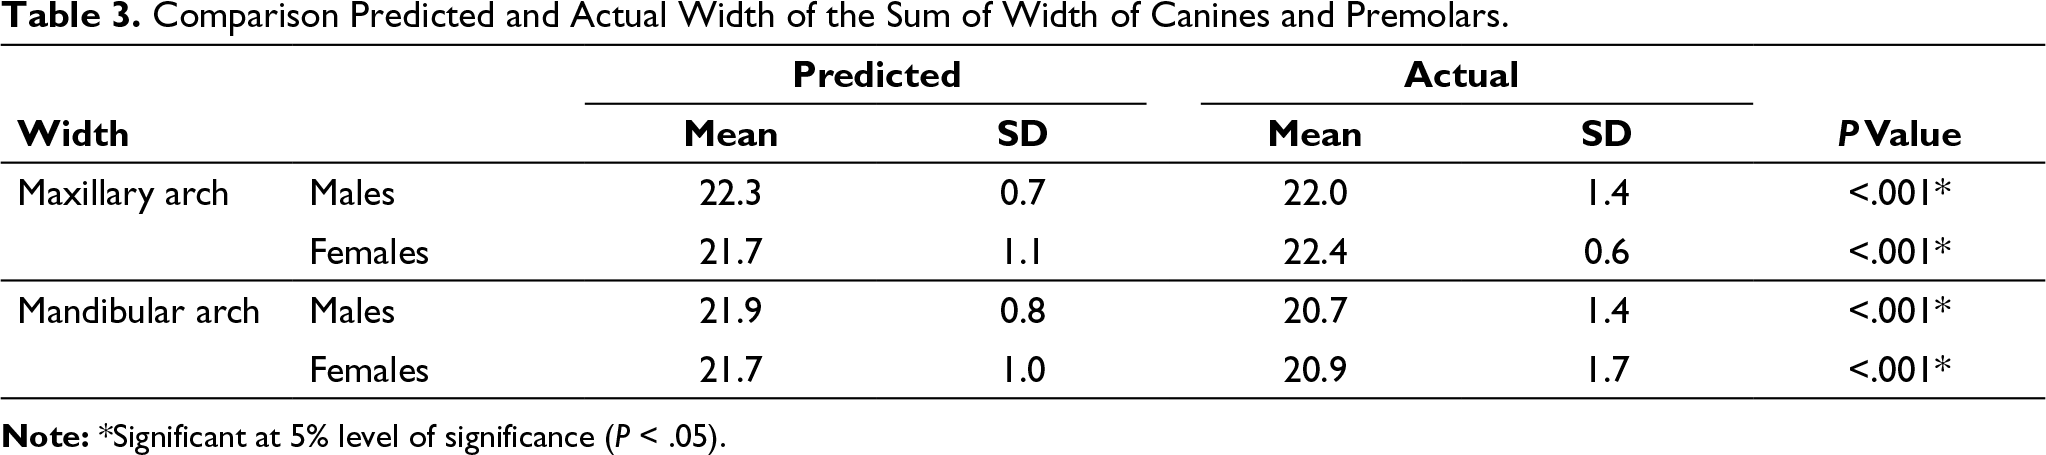
Comparison Predicted and Actual Width of the Sum of Width of Canines and Premolars.
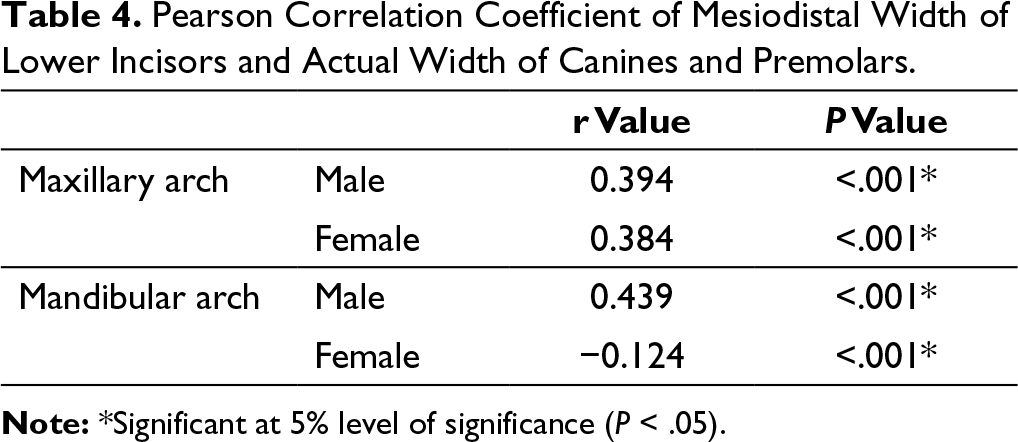
Pearson Correlation Coefficient of Mesiodistal Width of Lower Incisors and Actual Width of Canines and Premolars.
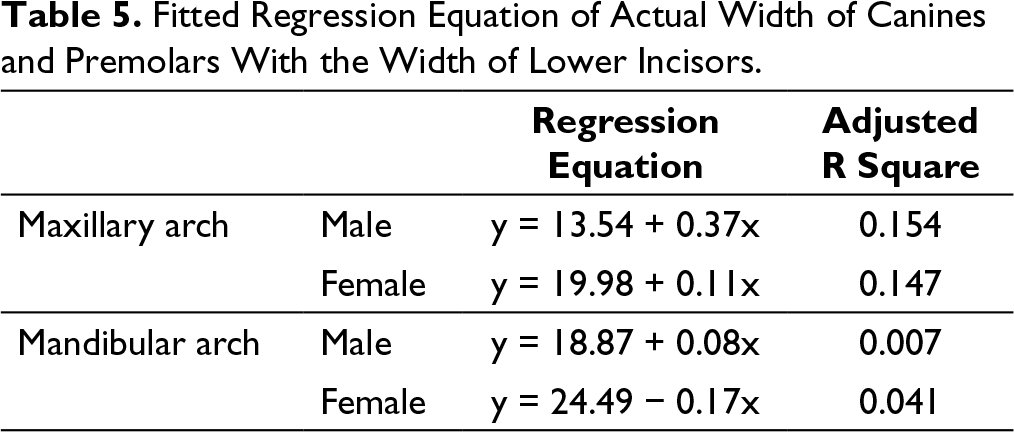
Fitted Regression Equation of Actual Width of Canines and Premolars With the Width of Lower Incisors.
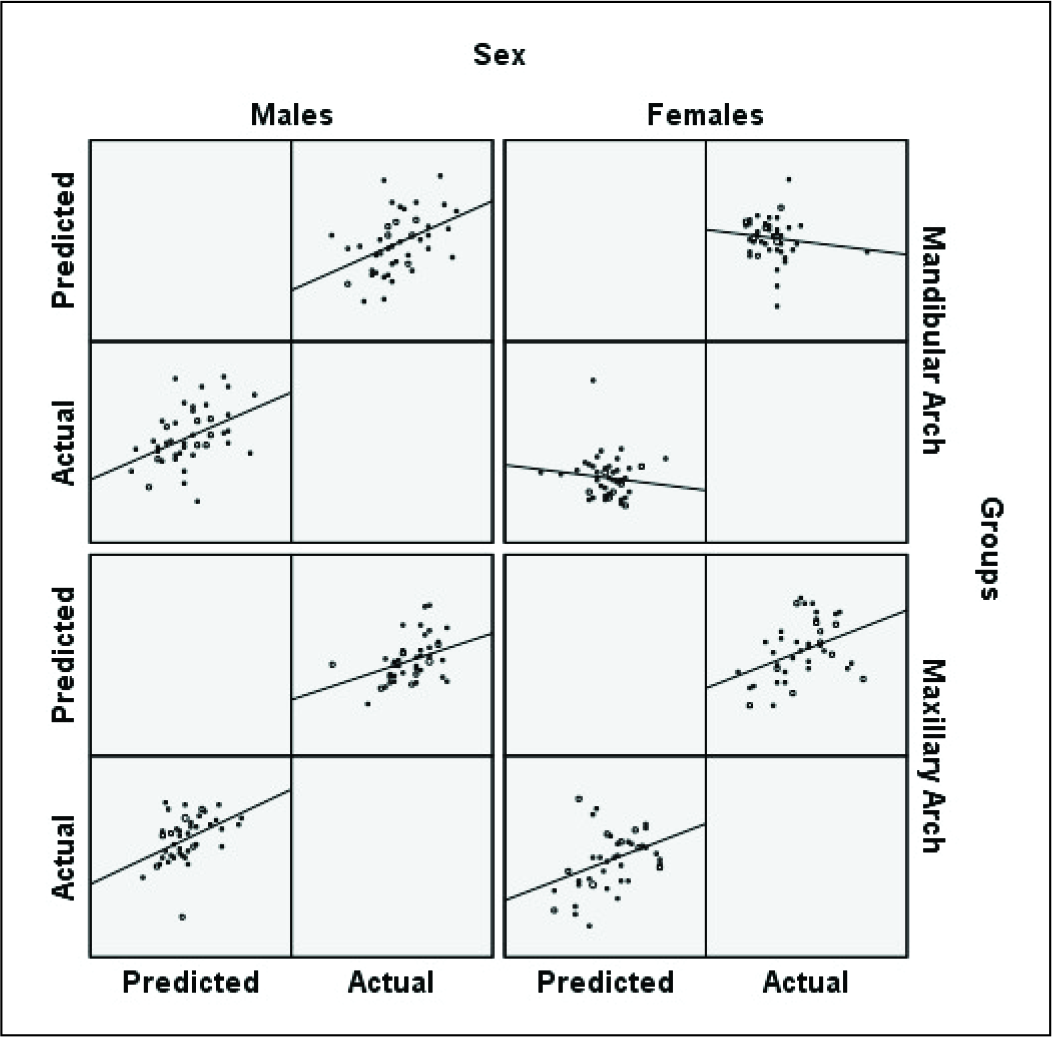
Scatter Matrix Diagram for the Fitted Regression Equation.
Discussion
In this study, the aim was to find out the width of canines and premolars and to know the accuracy of the Tanaka-Johnston equation when applied to the North Karnataka population. The ability to predict the mesiodistal dimensions of unerupted permanent canines and premolars during the mixed dentition is crucial for diagnostic and treatment planning.
However, because the dental arch perimeter may alter over time, it is vital to avoid relying on figures to forecast tooth size. Furthermore, it is self-evident that the erupted antimere in the same patient is the best predictor tooth and that the best estimate comes from radiography.9
Various factors influence tooth size, such as heredity, race, sex, and other extrinsic factors like caries, attrition, measuring methods, cast preparation, the material used for cast preparation, an instrument used for measurement of tooth size, and method of analysis of error.10
According to previous studies, mandibular incisors are ideal for mixed dentition analysis.11,12 Main advantages of using mandibular incisors includes early eruption, ease of measurement, least susceptibility for caries, and anomalies.13,14
The present study showed that the differences between estimated and measured canine and premolar widths were statistically significant. Tanaka-Johnston’s study exaggerated the mesiodistal lengths of canines and premolars in both males and females from North Karnataka. The present study showed a result similar to the study done by Chandna et al,15 and Sonawane and Bettigiri.16 Tanaka and Johnston’s analysis misinterpreted the actual mesiodistal widths of canines and premolars in different ethnicity.17,18
The present study showed that the differences between actual and predicted width of canine and premolars in maxillary and mandibular arch among both genders were significant. The predicted mean width was significantly higher for both the genders in the lower arch. But for the upper arch, it was significant only in males, whereas in the female the values were lower. This is in concordance with the studies of Lee-Chan et al,19 Meibodi et al,20 and Arslan et al,19 which also showed a similar result.
According to our study, the actual and predicted widths of canines and premolars between males and females showed a significant difference. The results suggest the presence of sexual dimorphism in the tooth widths of both genders for central incisors, canines, and premolars. This is following the studies of de Paula et al,21 Jaroontham and Godfrey,22 and Motokawa et al,14 that showed similar sexual dimorphism between various populations.
The reliability of Tanaka-Johnston mixed dentition analysis on every ethnic group is in question because of diversity. So, we are required to draw new regression equations for the North Karnataka people, making it more accurate for the prediction of space required for unerupted canines and premolars.
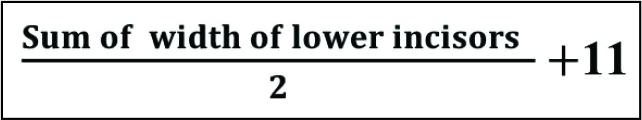
Based on our results, new regression equations and constants suiting the North Karnataka population were formulated that is Y = a + bX, where Y is the sum of widths of canine and premolars, X is the sum of widths of lower incisors, a is constant, and b is the regression coefficient.
To acquire more representative data, more research with bigger sample size is needed, taking into account the ethnic diversity of the Indian people. A more constructive and acceptable approach would be to conduct a second assessment of the predicted values, to the lower incisors prediction error.
Conclusion
The Tanaka-Johnston Mixed Dentition analysis equation in its original form cannot be applied for North Karnataka ethnicity.
The new regression equations which can be applied to the North Karnataka population were derived for upper and lower arches, respectively.
Data demonstrate that the widths of canine and premolar widths in the upper and lower arch were different in both genders.
Footnotes
Declaration of Conflicting Interests
The authors declared no potential conflicts of interest with respect to the research, authorship, and/or publication of this article.
Funding
The authors received no financial support for the research, authorship, and/or publication of this article.
Statement of Informed Consent and Ethical Approval
Necessary ethical clearances and informed consent was received and obtained respectively before initiating the study from all participants.