
Abstract
Background:
Concerns about the accuracy and reliability of soft tissue landmarks using two-dimensional (2D) and three-dimensional (3D) imaging.
Objective:
The aim of the systematic review is to estimate accuracy and reliability of soft tissue landmarks with 2D imaging and 3D imaging for orthodontic diagnosis planning and treatment planning purposes.
Data Sources:
Electronic database search was performed in MEDLINE via PubMed, Embase via embase.com, and the Cochrane library website.
Selection Criteria:
The data were extracted according to two protocols based on Centre for Evidence-Based Medicine (CEBM) critical appraisal tools. Next, levels of evidence were categorized into three groups: low, medium, and high.
Data Synthesis:
Fifty-five publications were found through database search strategies. A total of nine publications were included in this review.
Conclusion
According to the available literature, 3D imaging modalities were more accurate and reliable as compared to 2D modalities. Cone beam computed tomography (CBCT) was considered the most reliable imaging tool for soft tissues.
Introduction
Orthodontic diagnosis and treatment planning have been based upon hard-tissue relationships and on the Angle paradigm 1 that considers ideal dental occlusion “nature’s intended ideal form.” However, there has been a paradigm shift from the consideration of hard tissue to that of soft tissues, and the traditional emphasis on diagnosis and treatment planning has also been modified.
Orthodontists treat dental and skeletal problems by applying three-dimensional (3D) forces. The two-dimensional (2D) radiographs that have been used in orthodontics routinely for years are periapical and panoramic radiographs, anteroposterior and lateral cephalograms. Despite being highly useful in evaluating dental and skeletal relations, in certain cases, these 2D radiographs fails to provide sufficient information.
Limitations of 2D research and/or clinical records have been overcome by the development of 3D surface imaging technologies of soft tissues. The human face is captured in the three dimensions of space with these imaging modalities, thus allowing us to capture and collect enough information to analyze all the facial components. Among the existing surface imaging systems, the photogrammetry and laser scanners are the most widely used. 2
Recently, orthodontists have begun to use 3D cone beam computed tomography (CBCT) images to overcome the inadequacies of 2D radiographic records.
CBCT was primarily used to evaluate hard-tissue structures and was less considered in evaluating soft-tissue structures. The purpose of the systematic review is to compare the reliability and accuracy of soft-tissue landmarks in CBCT and other 3D tools in comparison to conventional 2D radiographs.
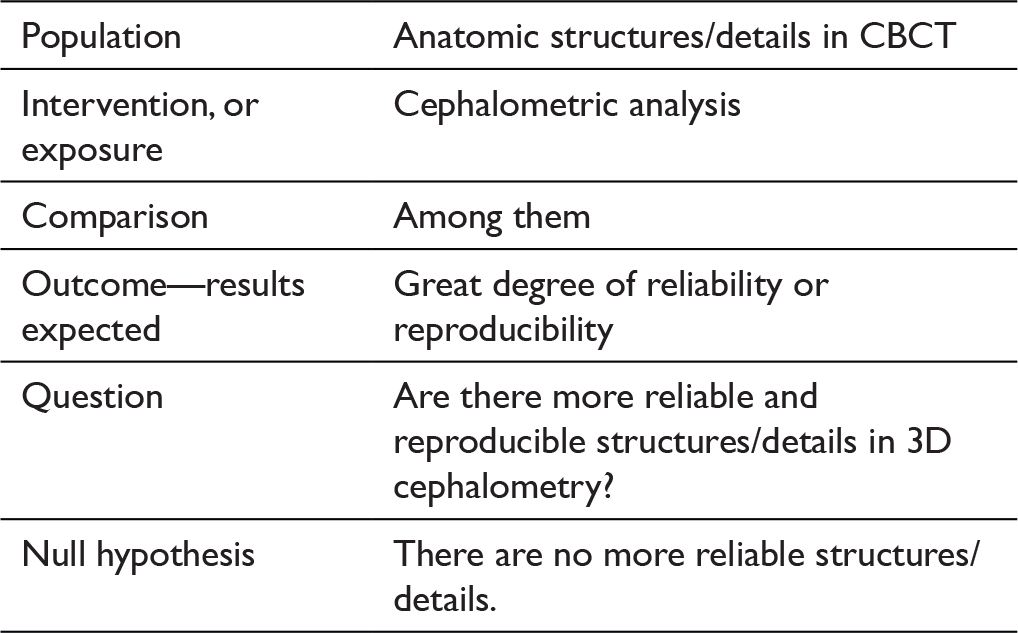
Research Question
Are 3D tools more reliable in assessing and evaluating soft-tissue landmarks than 2D cephalometry?
Methods
Search Strategy
A comprehensive electronic database search was performed in Embase via embase.com, MEDLINE via PubMed, and the Cochrane library website. No restrictions were imposed regarding time period or types of study design (ie, case-controlled trials, randomized controlled trials).
The manual search of reference lists of the publications that were found to be relevant in the first step was done in the second step. Titles of the articles contained keywords such as: “cephalometry,” “cephalometric,” “cone-beam computed tomography,” “CBCT,” “computed tomography,” “CT,” “three-dimensional,” and “3D.”
Inclusion Criteria
The following studies were included in the systematic review:
Studies including points comprising soft tissue analysis; Studies using CBCT and cephalograms; and Studies in humans only.
Exclusion Criteria
The following studies were excluded from the review:
Case reports; Epidemiologic studies; Narrative reviews; Author opinion articles; Studies in animals; Studies done in a language other than English; and Gray literature if full texts were not available.
The processes of article selection, screening according to title and abstract and then full text, data extraction, and quality assessment were undertaken independently by a single author under the guidance of a senior authority.
Studies that fulfilled the exclusion and inclusion criteria were collected and combined for data extraction. For each included study, quantitative and qualitative information was extracted, including the year of publication, author’s name, study design, sample size, method of assessment of soft tissue, software used, and the outcome of interest.
The quality of evidence was measured using the Centre for Evidence-Based Medicine (CEBM) test of diagnostic accuracy of studies. 3
The following Medical Subject Headings (MeSH) 5 were used when searching the literature: imaging, cephalometry; tomography, spiral computed; cone beam computed tomography; three-dimensional; and orthodontics.
Results
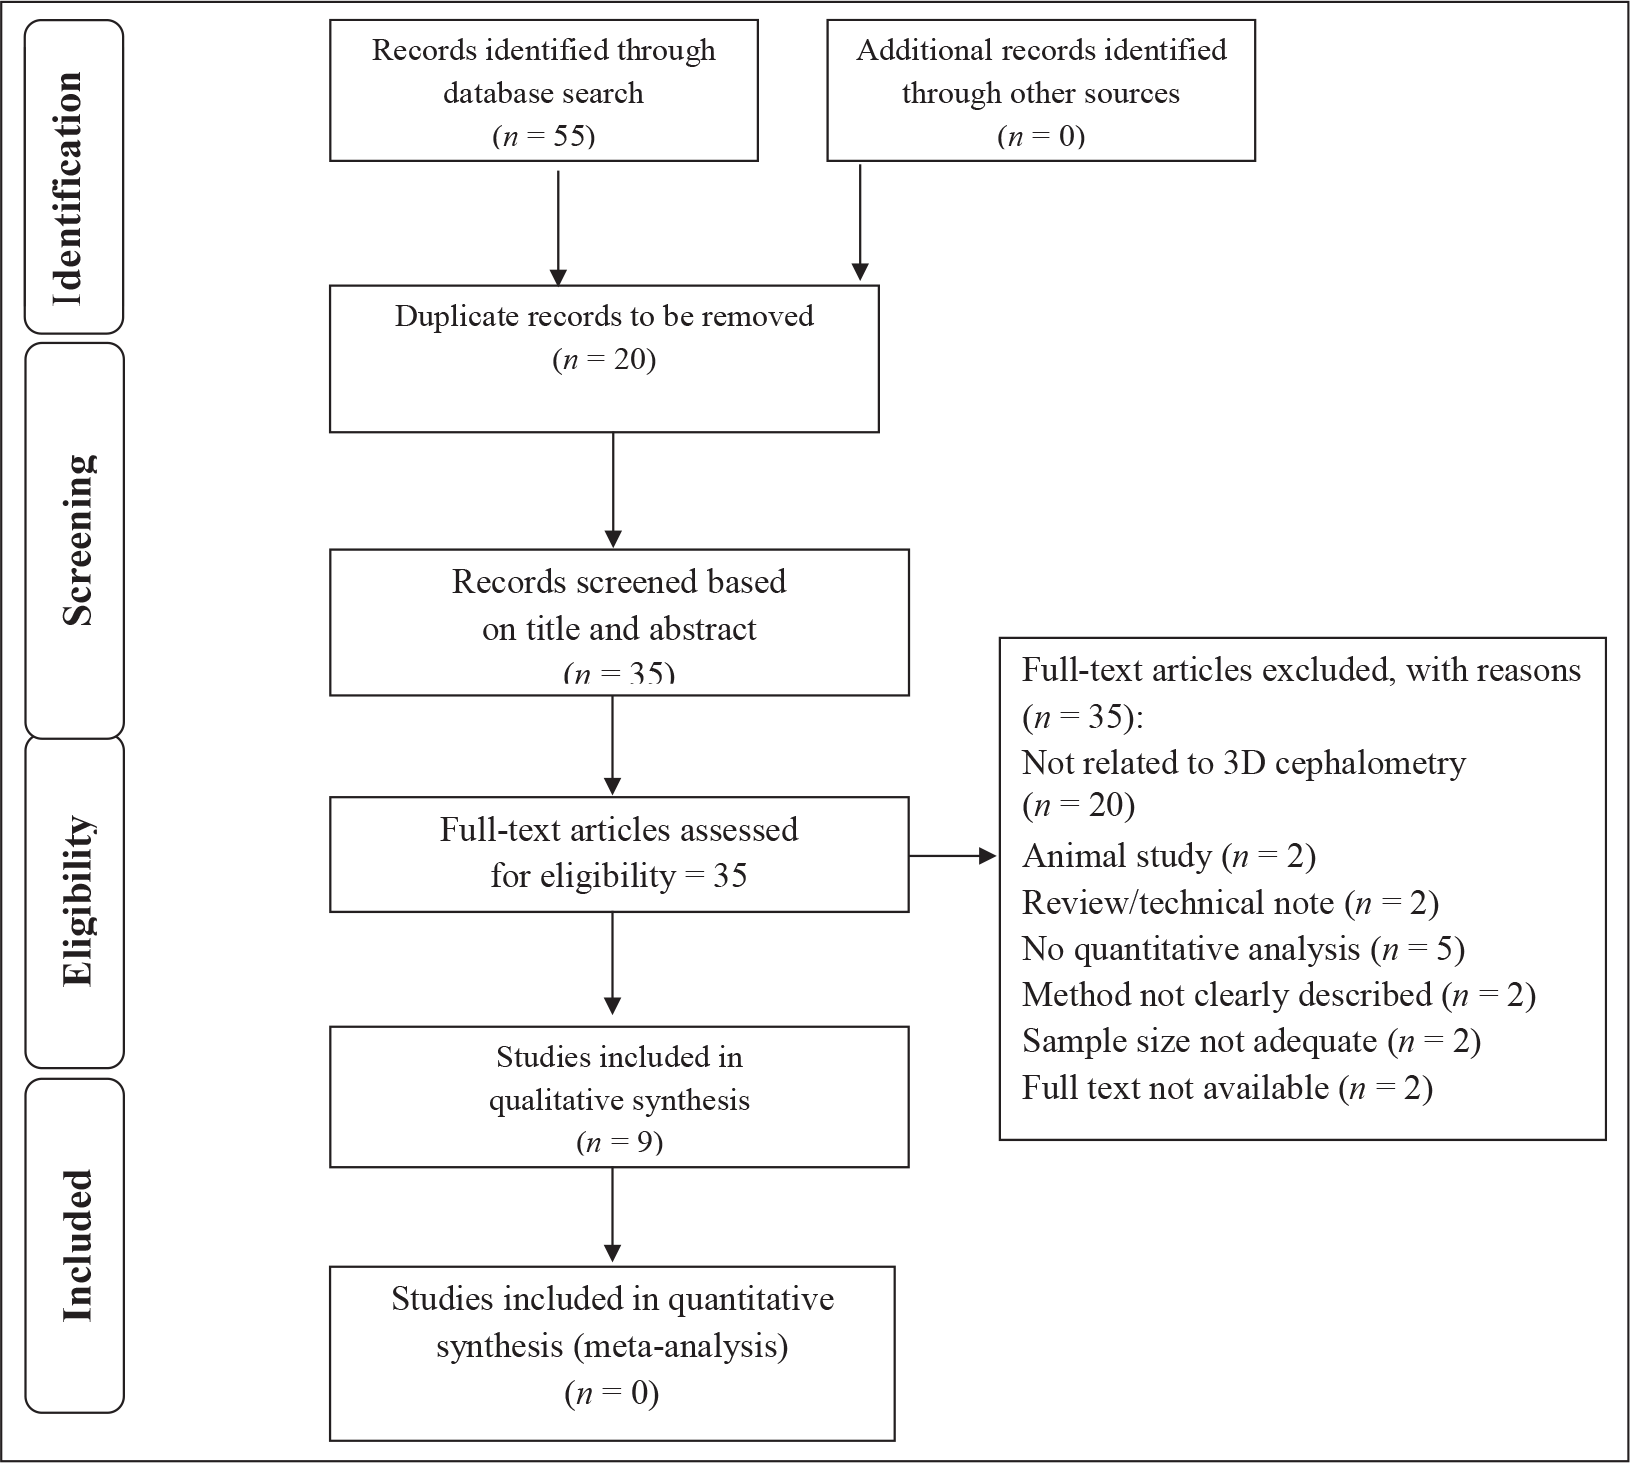
The searches of the literature revealed 55 unique citations. After the removal of 20 duplicate records, 35 were obtained on the basis of title and abstracts. These 35 records were studied, and 10 records not related to 3D cephalometry, 3 animal studies, 11 records that did not meet the inclusion criteria, and 2 records whose full texts were not found were omitted. As a result, only nine studies were included. Figure 1 shows the PRISMA 6 flowchart of the literature selection process.
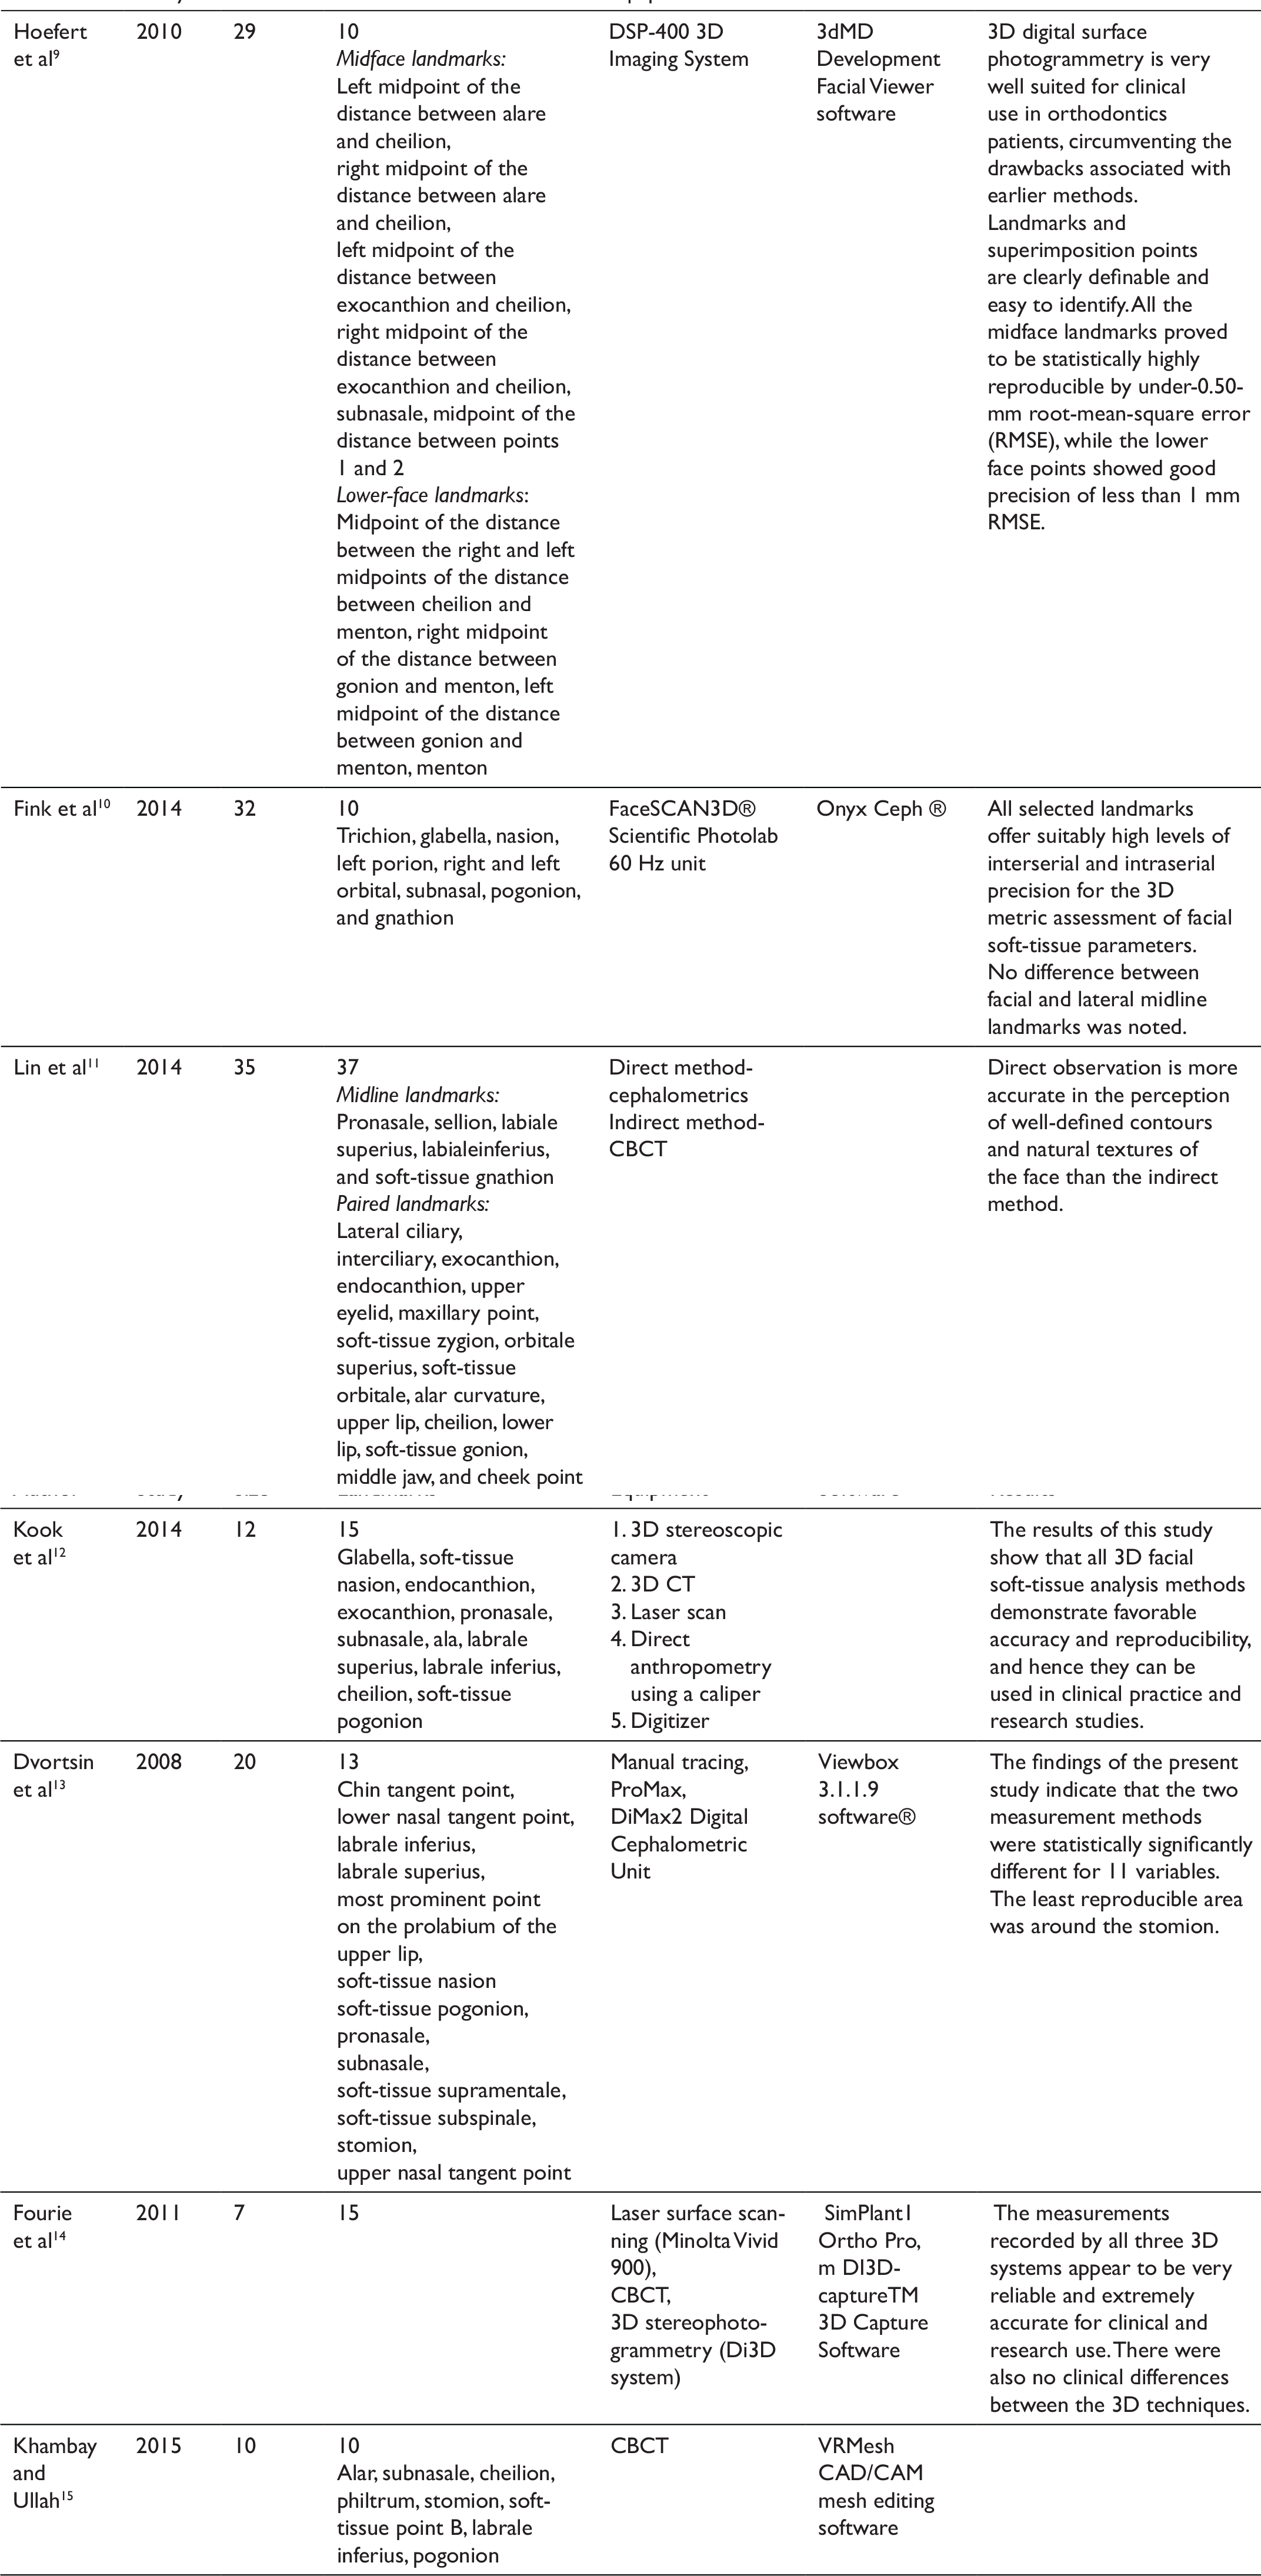
This systematic review included studies till February 2016, with sample size ranging from 7 to 35. In all the studies, soft tissue is assessed two-dimensionally or three-dimensionally, though the methods varied. Soft tissue was analyzed using conventional 2D cephalometry in one study, 7 whereas 3D assessment tools were used in the rest of the studies. Soft tissue analysis was done using CBCT in 2 studies,8,15 digital surface photogrammetry in one study, 9 structured light scanner in one study, 10 and both 2D cephalometry and CBCT in two studies.11,13 Two studies compared 3D assessment tools, one used five tools—3D stereoscopic camera, 3D computed tomography (CT), laser scan, direct anthropometry using a caliper, and a digitizer 12 —and another used three tools—laser surface scanning, CBCT, and 3D stereo-photogrammetry. 14 Table 1 provides a summary of the studies, including the sample size, equipment used, and the outcome as related to this review.
PRISMA Flow Diagram Summarizing the Literature Search
Summary of Included Studies
Summary of Level of Evidence
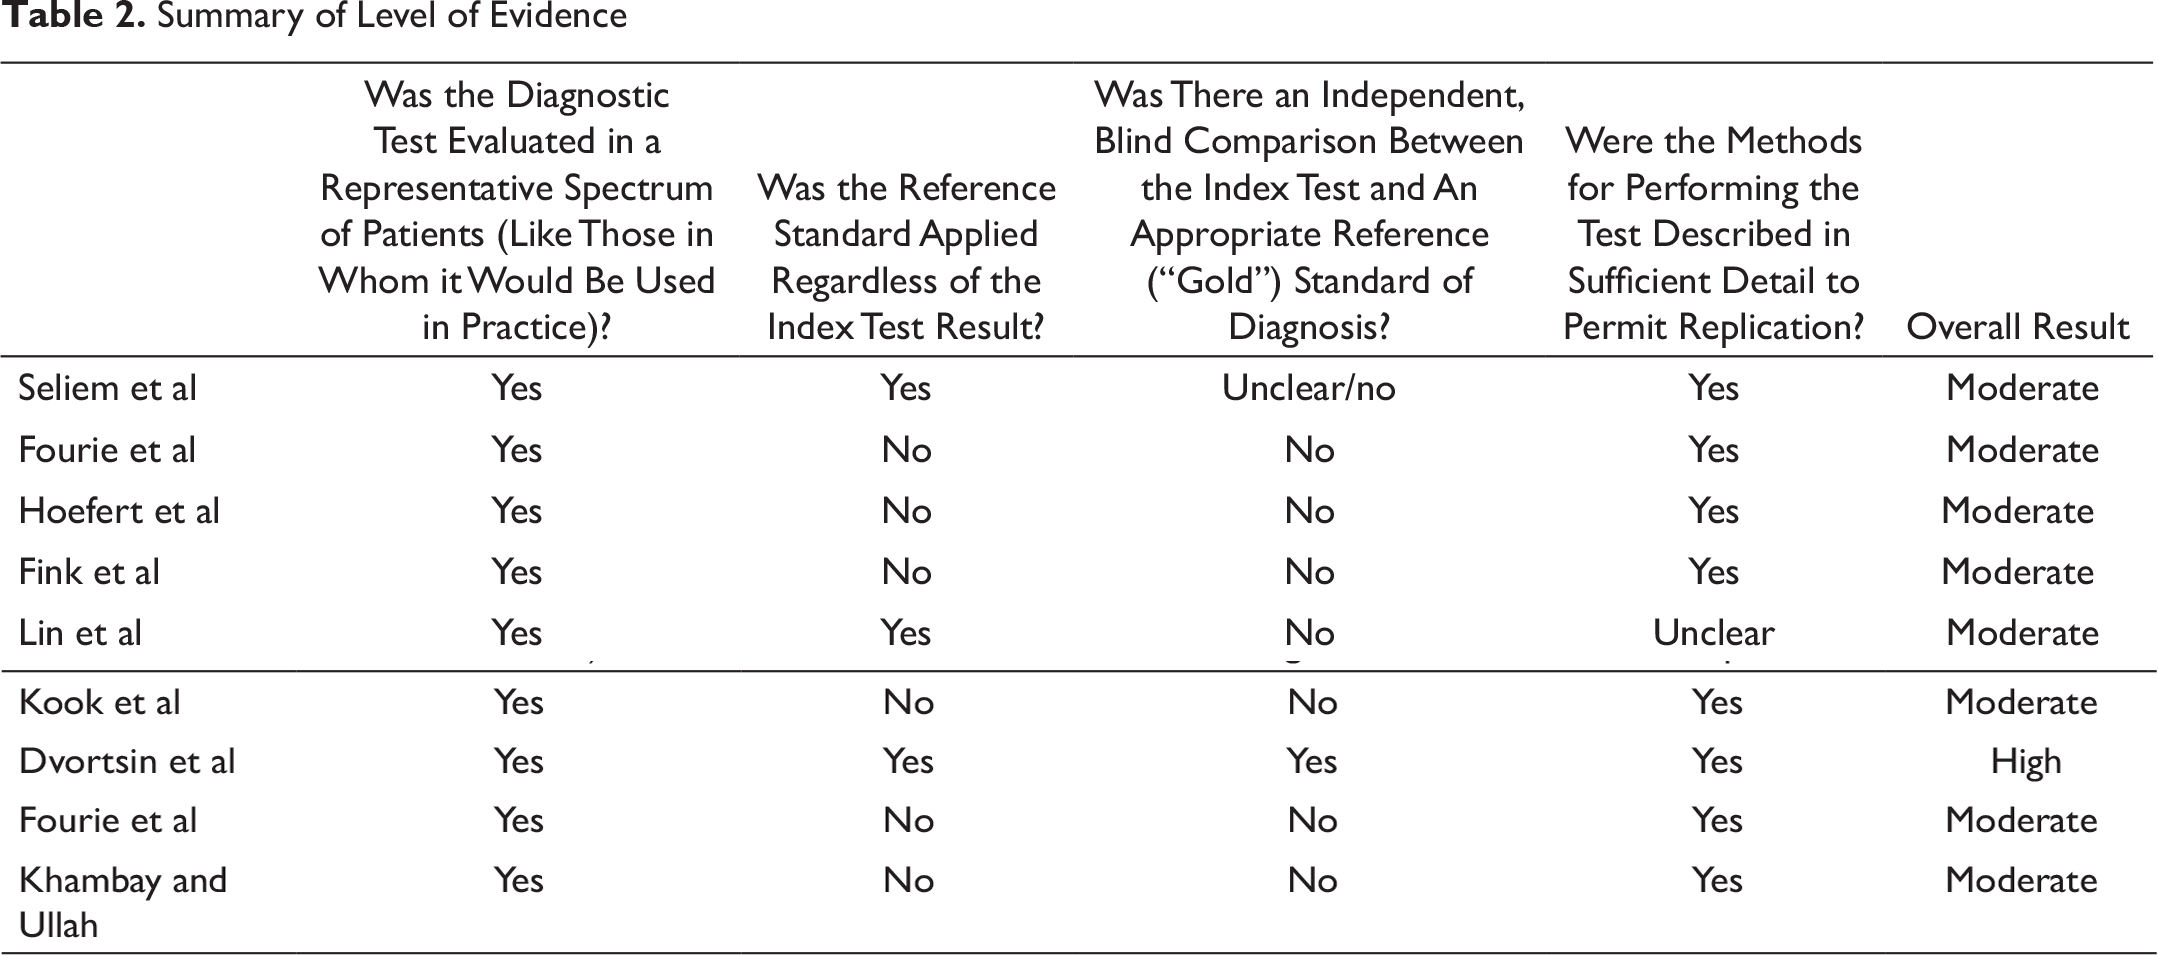
The quality of evidence was assessed using the CEBM test of diagnostic accuracy of studies. It was found that only one study 13 had evidence of a high level, as it compared the 3D assessment tool with gold-standard conventional 2D cephalometry in human subjects, which could be reproduced in clinical studies as well. The rest of the studies7–15 did not show direct comparison between 2D and 3D methods, but the results are reproducible and show a moderate level of evidence. The summary of levels of evidence of the studies is presented in Table 2.
Mostafa et al 7 estimate the accuracy of cephalometric soft-tissue linear measurements obtained from conventionally traced cephalograms by comparing them with those taken directly on patients. The study was conducted on 11 patients and assessed five landmarks. Fourie et al 8 and Khambay and Ullah 15 both used CBCT for 3D assessment. Fourie et al 14 conducted the study on cadavers’ head and compared it with physical measurements. Statistical analysis for reliability was done by means of the interclass coefficient, and accuracy was determined by means of the absolute error (AE) and absolute percentage error (APE) measures. Khambay and Ullah 15 conducted their study on patients who had undergone surgery and assessed the limitations by comparing the predicted 3D soft-tissue image with the postoperative soft-tissue image.
Hoefert et al 9 presented a superimposition and measurement model for 3D analysis of sagittal changes in facial soft tissue by using digital surface photogrammetry. Before and after the examination, two 3D photographs of subjects were taken and were superimposed and compared. Measurement error for each landmark was identified using the root-mean-square error (RMSE).
Fink et al 10 used a structured light scanner. Accuracy and reliability was measured by pacing the landmarks twice within a 2-week interval. All measurements were corrected for mean values per patient and analyzed for intraserial and interserial errors by Model II ANOVA (analysis of variance).
Two studies used 2D and 3D assessment of soft tissues. Lin et al 11 investigated 37 landmarks in 35 patients who underwent cephalometric analysis by using direct and indirect placement methods. In the direct method, 37 small reflective markers were located by inspection and/or palpation and affixed onto the cutaneous surface; these were captured by infrared cameras and computed. In the indirect method, CT images were obtained and data were imported and reconstructed into a 3D model by an interactive image analysis system. Landmarks were designed on the 3D surface model. Paired t-tests were used to examine significant differences in the average landmark placement errors between observers and between the two placement methods for each observer. Another study was conducted by Dvortsin et al 13 to compare and analyze the reproducibility of manual cephalometric tracings with on-screen digitization using a soft-tissue analysis. They selected 20 lateral cephalometric radiographs in the natural head posture. These cephalograms were digitized, and manual tracing on a 1:1 printout of the image was carried out twice in different sessions 1 week apart. Differences were analyzed using a repeated measurement of analysis of variance with method, session, and method–session interaction. The differences were expressed as an absolute percentage of the overall mean.
Two studies used multiple 3D tools, and comparison was done between them. Kook et al 12 marked 15 landmarks in the facial area of 12 mannequin heads. The facial soft-tissue measurements were performed using five methods: laser scan, 3D stereoscopic camera, 3D CT, direct anthropometry using a caliper, and a digitizer. With these measurement methods, 10 measurement values representing the facial depth, height, and width were determined twice by one examiner within an interval of 1 week. Another study done by Fourie et al 14 in 2011 evaluated the accuracy and reliability of standard anthropometric linear measurements made using three different 3D scanning systems—laser surface scanning, CBCT, and 3D stereo-photogrammetry—and compared them to physical linear measurements. They conducted the study on seven cadaver heads, and 21 linear measurements were obtained using 15 landmarks. Reliability was measured by means of intraclass correlation coefficients (ICCs). Accuracy was determined by means of AE and APE by comparing the 3D measurements with the physical anthropometrical measurements.
Discussion
It is widely accepted that 3D tools like CBCT, 3D stereoscopic camera, 3D CT, laser scan, etc, provide accurate and reliable results as compared to 2D imaging. 16 This systematic review included studies till year 2016, with the sample size ranging from 7 to 35.
The included studies investigated the reliability and accuracy of 3D tools in assessing soft tissues over 2D imaging.
Mostafa 7 tested the accuracy of 3D tools by comparing the linear measurements obtained on cephalograms with those taken directly from the same patients’ face. They found that the soft-tissue linear measurements obtained from a lateral cephalometric radiograph do not represent the true values found in a particular patient. Also, they concluded that a single magnification factor can be applied for soft-tissue lateral cephalometric measurements neither in all patients nor within the same patient.
Fourie et al 8 and Khambay and Ullah 15 used CBCT to assess the accuracy and reliability of CBCT. Fourie et al 8 conducted their study on cadaver heads and confirmed that CBCT is a reliable and accurate tool to extract soft-tissue measurements. Further, they recommended a 0.3 mm voxel size scan for collecting finer and more accurate data. They also conducted another study in 2011 wherein they compared various 3D techniques with direct caliper measurements and found that linear measurements on a 3D soft-tissue surface model taken using the Minolta Vivid 900 laser scanner, Di3D stereo photogrammetry system, and KaVo 3D exam CBCT scanner were more accurate than the direct caliper measurements. Therefore, the measurements recorded by all three 3D systems appeared to be extremely accurate and very reliable for research and clinical use.
Khambay and Ullah 14 compared the predicted soft-tissue image with the postoperative soft-tissue image of the patients who received only a Le Fort I osteotomy with minimal vertical movements and no associated mandibular surgery.
Hoefert et al 9 presented a measurement and superimposition model for 3D analysis of therapy-induced sagittal changes in facial soft tissue using 3D digital surface photogrammetry. Analysis was done on the cleft lip and palate and cleft palate of class III individuals and healthy control individuals. The results of the study landmarks and superimposition points were clearly definable and easy to identify. All the midface landmarks proved to be statistically highly reproducible, with RMSE less than 0.50 mm, while the lower face points showed good precision, with RMSE less than 1 mm. Hoefert et al concluded that the DSP 400 3D Imaging System was practical and easy to use, accurate, noninvasive, millisecond-fast, safe, nonionizing, and ad infinitum repeatable.
Fink et al 10 used a structured light scanner to investigate the suitability of 10 soft-tissue facial landmarks (trichion, nasion, glabella, gnathion, subnasal, right and left porion, pogonion, and right and left orbital) as reference points for metric facial analysis by analyzing their intraserial and interserial precision in all three dimensions. They observed no significant difference between the landmarks along the facial midline and bilateral landmarks. Thus, structured light scanning meets the vital requirement for facial soft-tissue measurement in a well-detailed and dimensionally accurate manner.
Lin et al 11 and Dvortsin et al 13 used both 2D and 3D assessing techniques. Lin et al compared direct and indirect 3D facial evaluation methods and classified the 37 soft-tissue landmarks into four precise grades according to their landmark placement error values. They found that direct observation is more accurate for the perception of well-defined contours and natural textures of the face than the indirect method. The direct placement method had significantly less errors than the indirect method for repeatedly placing markers. Meanwhile, similar reliability in evaluating midline-related structures was found with the two approaches. Dvortsin et al analyzed and compared the reproducibility of manual cephalometric tracings with on-screen digitization using a soft-tissue analysis. They concluded that the two measurement methods were statistically significantly different for 11 variables (landmarks). The area around the stomion was the least reproducible. The mean differences between methods and between sessions were less than 1 mm or 1 degree. More variables were reproducible on-screen than with the manual technique.
Kook et al 12 evaluated five different 3D systems: direct anthropometry, digitizer, 3D CT, 3D scanner, and DI3D. All the methods demonstrated good accuracy and had a high coefficient of reliability (>0.92) and low technical error (<0.9 mm).
Conclusion
From the available literature, the following is shown:
There is a shortage of well-designed and reported randomized controlled trials on this topic. There is predominantly moderate-to-high evidence available regarding the reliability and accuracy of 3D tools in the assessment of soft tissues. 3D imaging tools in assessing soft tissues were more reliable and accurate as compared to the 2D tools. Standardization of analytical procedures was difficult in 2D tools. Among all the 3D imaging tools, CBCT was considered as the most efficient and reliable imaging tool for the assessment of soft tissues.
Footnotes
Declaration of Conflicting Interests
The authors declared no potential conflicts of interest with respect to the research, authorship, and/or publication of this article.
Funding
The authors received no financial support for the research, authorship, and/or publication of this article.