
Abstract
The aim of this article is to assess the lip position using five different reference lines in individuals with a pleasing profile.
A cross-sectional study was conducted with a sample size of 200 subjects chosen from the local North Indian population. Non-growing subjects, between the age group of 18 years and 25 years with a pleasing facial profile were screened for the study via a questionnaire-based method to confirm their North Indian ancestry (history of past two generations from North India). All subjects included in the study gave their due consent to be a part of the study.
The following conclusions were derived:
Norms for the horizontal lip position were derived for the North Indian population. Upper lip position in relation to S1 (Steiner’s) line and Ricketts’ E line showed females having protrusive lips, while S2 (Sushner’s) line showed protrusive upper lip in males. S1 (Steiner’s) line, showing protrusive lower lip in females. The norms derived in this study showed statistically significant difference with retrusive upper and lower lips when compared to normative values of Ricketts’ E plane and retrusive lower lip when compared to normative values of Sushner’s line. Sushner’s S2 line showed the maximum stability and consistency; hence, it is the line of choice to judge the sagittal lip positions in profile analysis.
Introduction
The soft tissue analysis has always been an integral part of the diagnosis and treatment planning. The nose, chin, and lip are the major components of the soft tissue profile. Among this, the position of lips profoundly alters the choice of treatment. Moreover, orthodontic treatment plan can also alter lip position. Therefore, lip position has become one of the most important soft tissue analyses, as it influences the occlusion, tooth stability and facial esthetics. 1 For a long time, orthodontists have focused on the horizontal lip position as the most important feature in determining beauty. 2 Several authors such as Steiner 3 , Rickett 4 , Burstone 1 , Merrifield 5 and Holdaway 6 have described analyses using different lines and planes to assess the anteroposterior position of the upper and lower lips in relation to an aesthetic facial profile. They have also reported normative cephalometric values for these analyses based on studies carried out on the Caucasian samples of the European–American ancestry. 7
Among studies that focused on lip profiles in Asian countries, Nakahara et al, 8 concluded that esthetic Japanese females’ soft tissue characteristics included retracted upper and lower lips. Ioi et al 9 demonstrated that the Japanese raters tended to prefer more retruded lip positions as the facial convexity decreased and slightly more protruded lip position as the facial convexity increased. A more retrusive lip position was also preferred for various Asian populations, including those from Singapore and China.8, 10
Every race has its own nose and chin characteristics. 2 Sushner developed his norms for the Black population, whereas Ricketts’ norms were applied to Caucasians. Thus, using soft tissue norms of one population would be unreliable in the diagnosis and treatment planning for another population. It would be helpful to assess reliability of these reference lines in the North Indian adult population. This would serve as the baseline data for orthodontic diagnosis and treatment planning.
The following questions were addressed in this study—what are the most desirable lip positions in individuals with pleasing profiles? Does gender influence the preferred lip positions in the profiles?
Also, with so many esthetic lines, the following question needs to be asked—which line provides a good determination of lip position in terms of the esthetic profile?
Considering this, the aim of the present study is to assess the lip position, using five different reference lines in individuals with pleasing profile.
Objectives of the Study
To assess the position of the upper and lower lips in relation to different reference lines, that is, E-line, H-line, S1 (Steiner’s) line, S2 (Sushner’s) line, and B-line on lateral facial photographs.
To establish norms for the upper and lower lip position in relation to different reference lines.
To assess the possible gender differences for the upper lip and lower lip position in relation to different esthetic lines.
To compare the derived norms with the previously set norms for the Caucasian population.
To assess the most reliable esthetic reference line.
Methodology
A cross-sectional study was conducted with a sample size of 200 subjects chosen from the local North Indian population. Non-growing subjects, between the age group of 18years and 25 years with a pleasing facial profile were screened for the study via a questionnaire-based method to confirm their North Indian ancestry (history of past two generations from North India). All subjects included in the study gave their due consent to be a part of the study. Subjects who had previously undergone orthodontic treatment or had gross facial asymmetry or any vertical or sagittal discrepancy were excluded from the study.
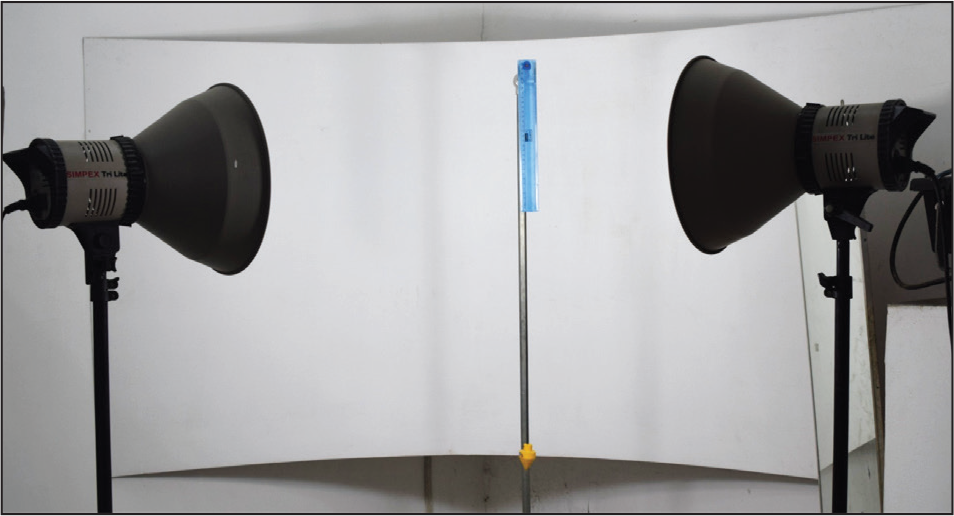
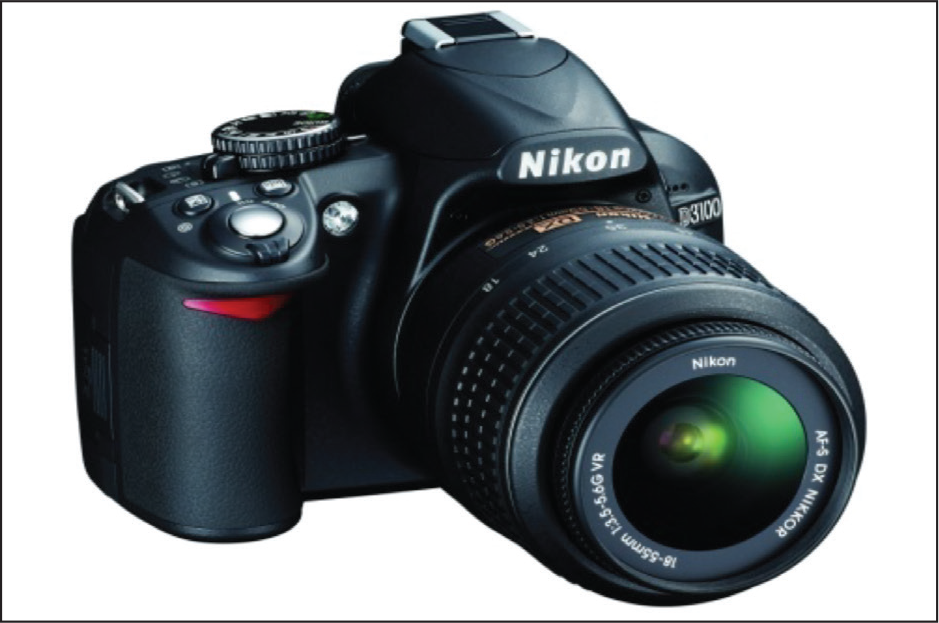
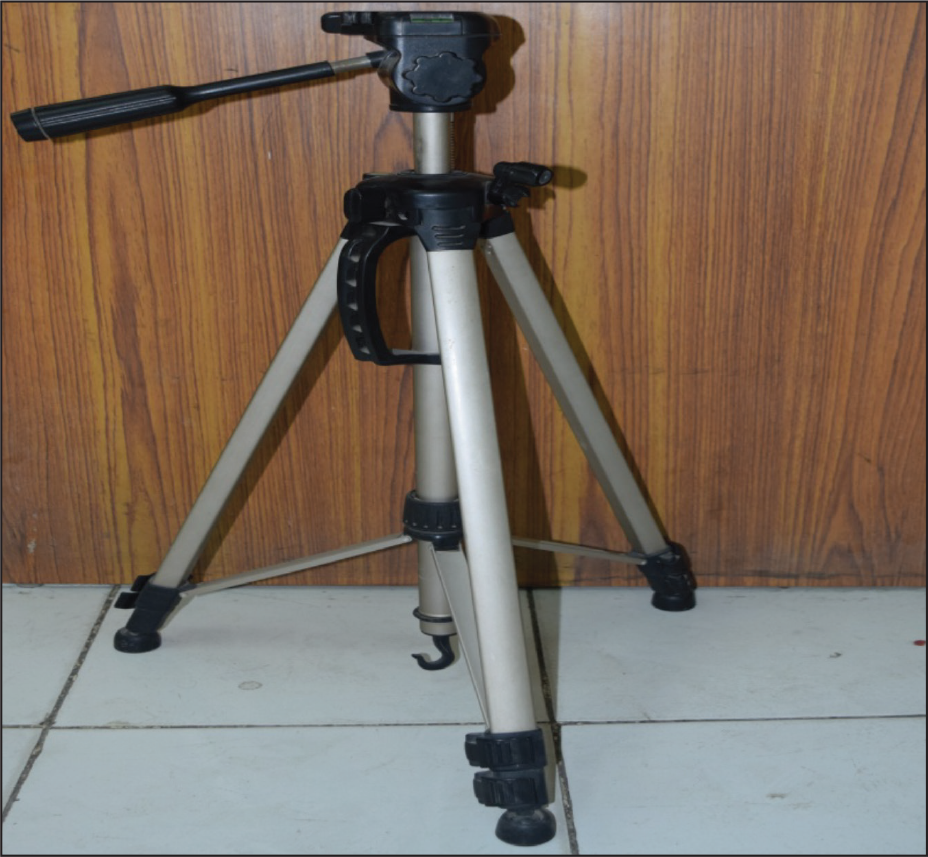
Once screened on the basis of the questionnaire, profile photographs of the subjects were taken using a (Nikon, model D3300 18-55 mm; Thailand) camera in its auto focus position, the shutter speed was 1/200/sec, and the opening of the diaphragm was f/3.5-5.6. The camera was stabilized on a tripod stand (CA 16 Tripod Stand Kolkata, West Bengal, India. Maximum height of 1,455 mm with platinum finish), and to eliminate “red-eye effect” and shadow in the background, a primary and another secondary flash were used, respectively (Figures 1–3).
Photography Room With White Background, Lights, Plumb Line and Millimeter Scale
Tripod (Profile 355)

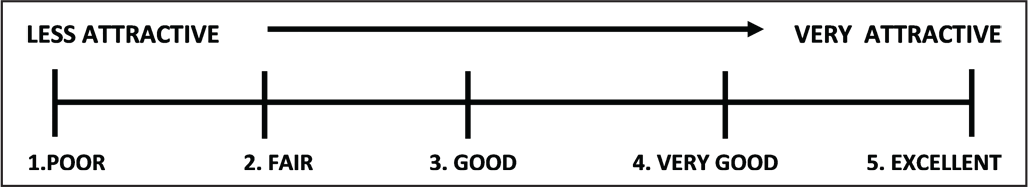
Visual Analog Scale Used to Evaluate Esthetic Value of Rating Photographs
The subjects were positioned in natural head position and a plumb line was suspended with a thick black thread, indicating the true vertical line (TVL)d to allow 1:1 life-size measurements. Prior to photography of subjects, they were instructed to remove glasses, and the operator ensured that the forehead, ears, and neck of the subjects beings photographed were clearly visible. The best of the 3 photographs was selected and standardized using Adobe Photoshop CS version 7.0 software of size 5 inches x 7 inches (Figure 4).
An initial sample size of 200 volunteers would constitute the primary selection. Out of 200 subjects, 100 subjects (50 males and 50 females), depending on the scores by the panel of judges, constituted the core sample for our study.
A visual analog scale score sheet was created according to the attractiveness rating of Lundstorm et al and Johnson et al with a grading scale (Figure 5). Visual analog scale was used to evaluate esthetic value of profile photographs. Profile photographs of the group were subjected through a selection process by a panel of judges (professionals from different fields) comprising an orthodontist, a layman, an oral surgeon, a professional photographer, and a beautician with an emphasis to focus on the balance in facial parts, disregarding individual highlights (beautiful eyes, hairs, etc). Scores were given out of 5 to individual subjects on separate pages by the judges. The scoring was one way blind as the evaluators were unaware of the sequencing of the photographs.
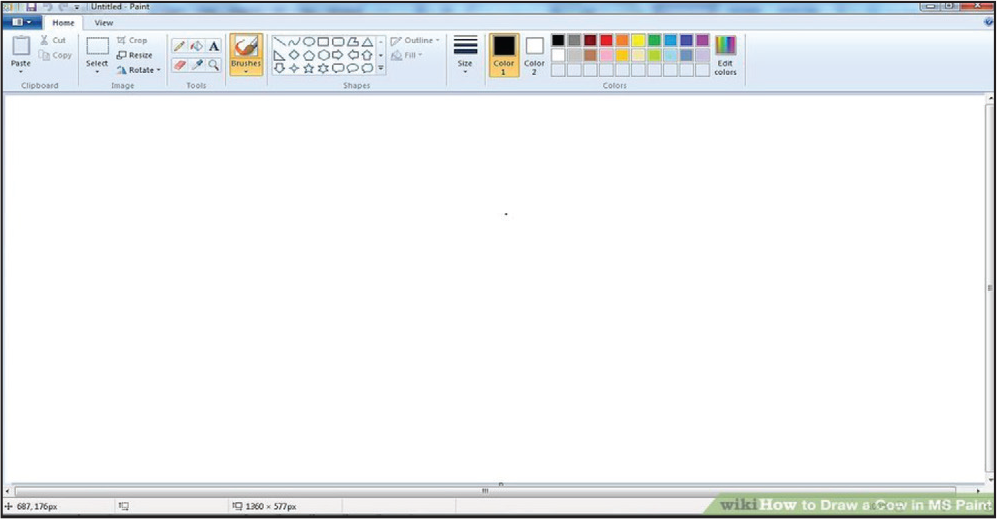
Out of the screened faces, the 100 best scored faces (50 males and 50 females) were selected for the evaluation of average parameters that define the soft tissue facial profile of individuals with pleasing faces. The photographs were digitalized and uploaded onto the Microsoft Paint software (Microsoft Paint version 6.1; Build 7600) (Figure 6).
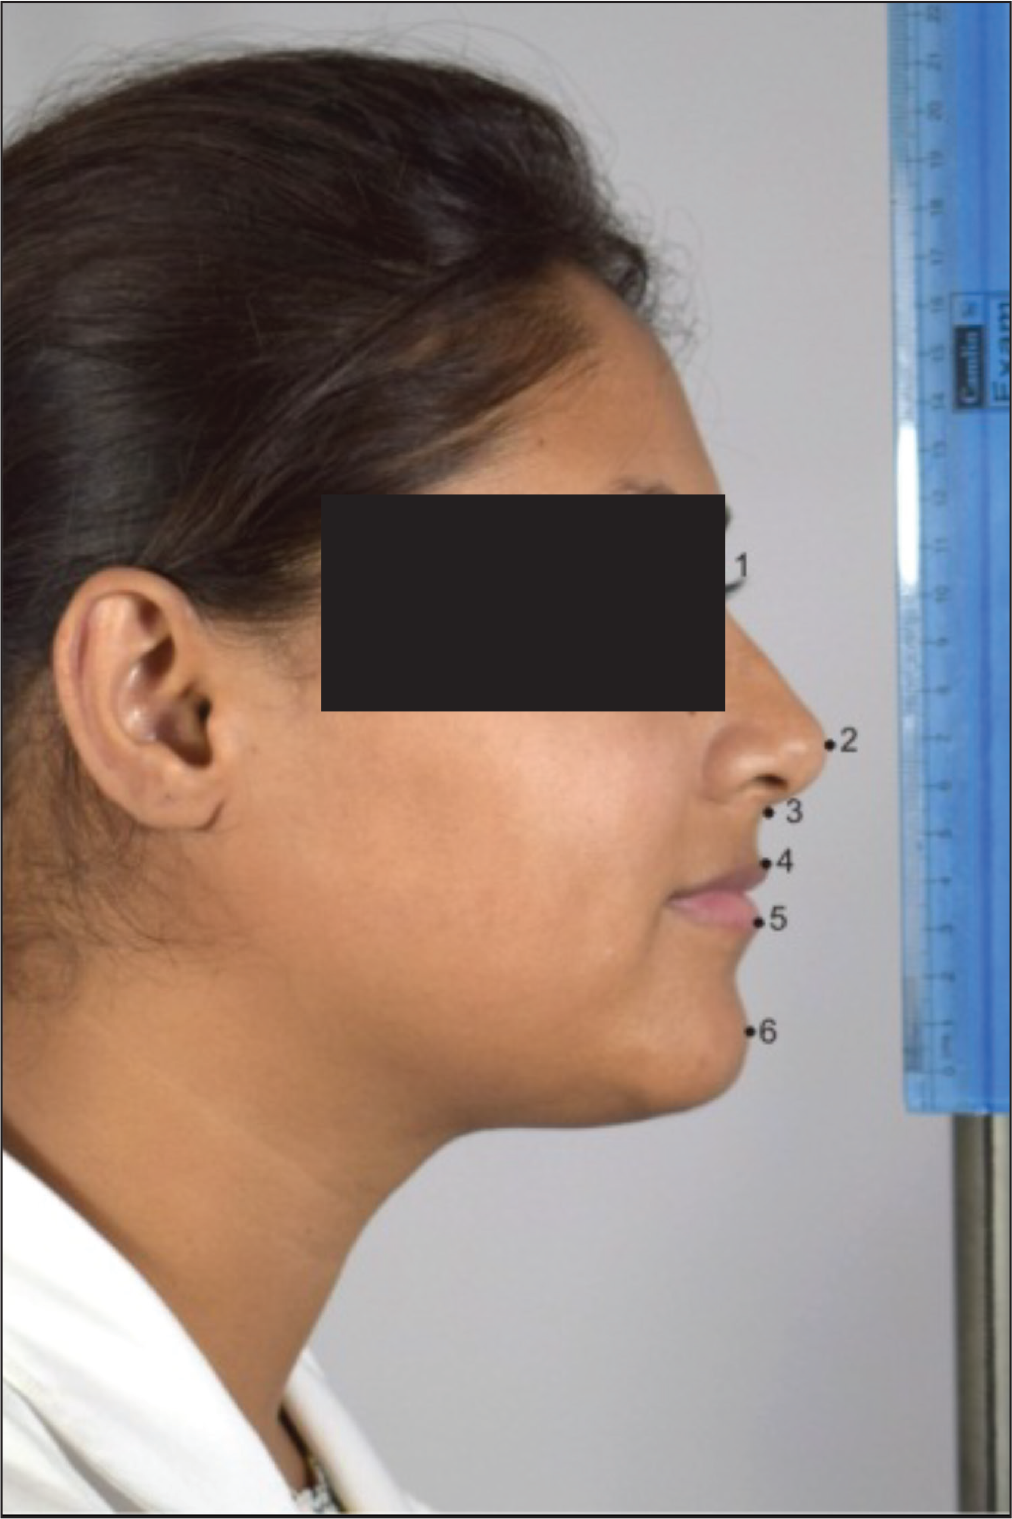
Landmarks Located on the Photographs (Figure 7)
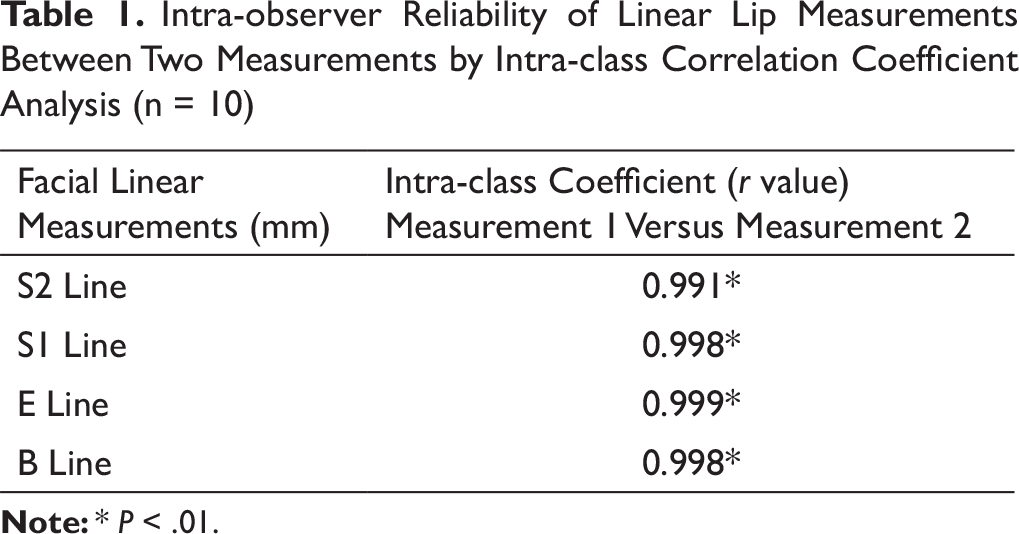
Intra-observer Reliability of Linear Lip Measurements Between Two Measurements by Intra-class Correlation Coefficient Analysis (n = 10)
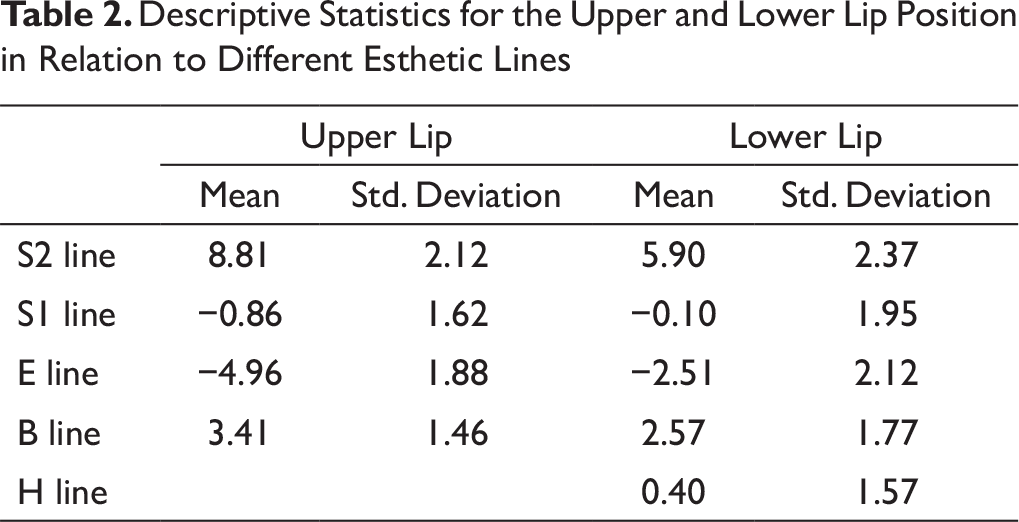
Descriptive Statistics for the Upper and Lower Lip Position in Relation to Different Esthetic Lines
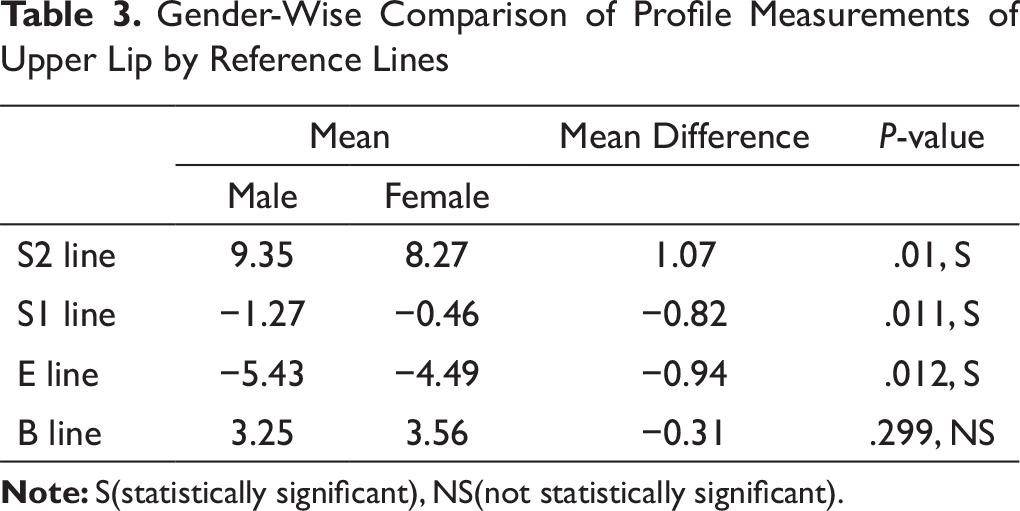
Gender-Wise Comparison of Profile Measurements of Upper Lip by Reference Lines
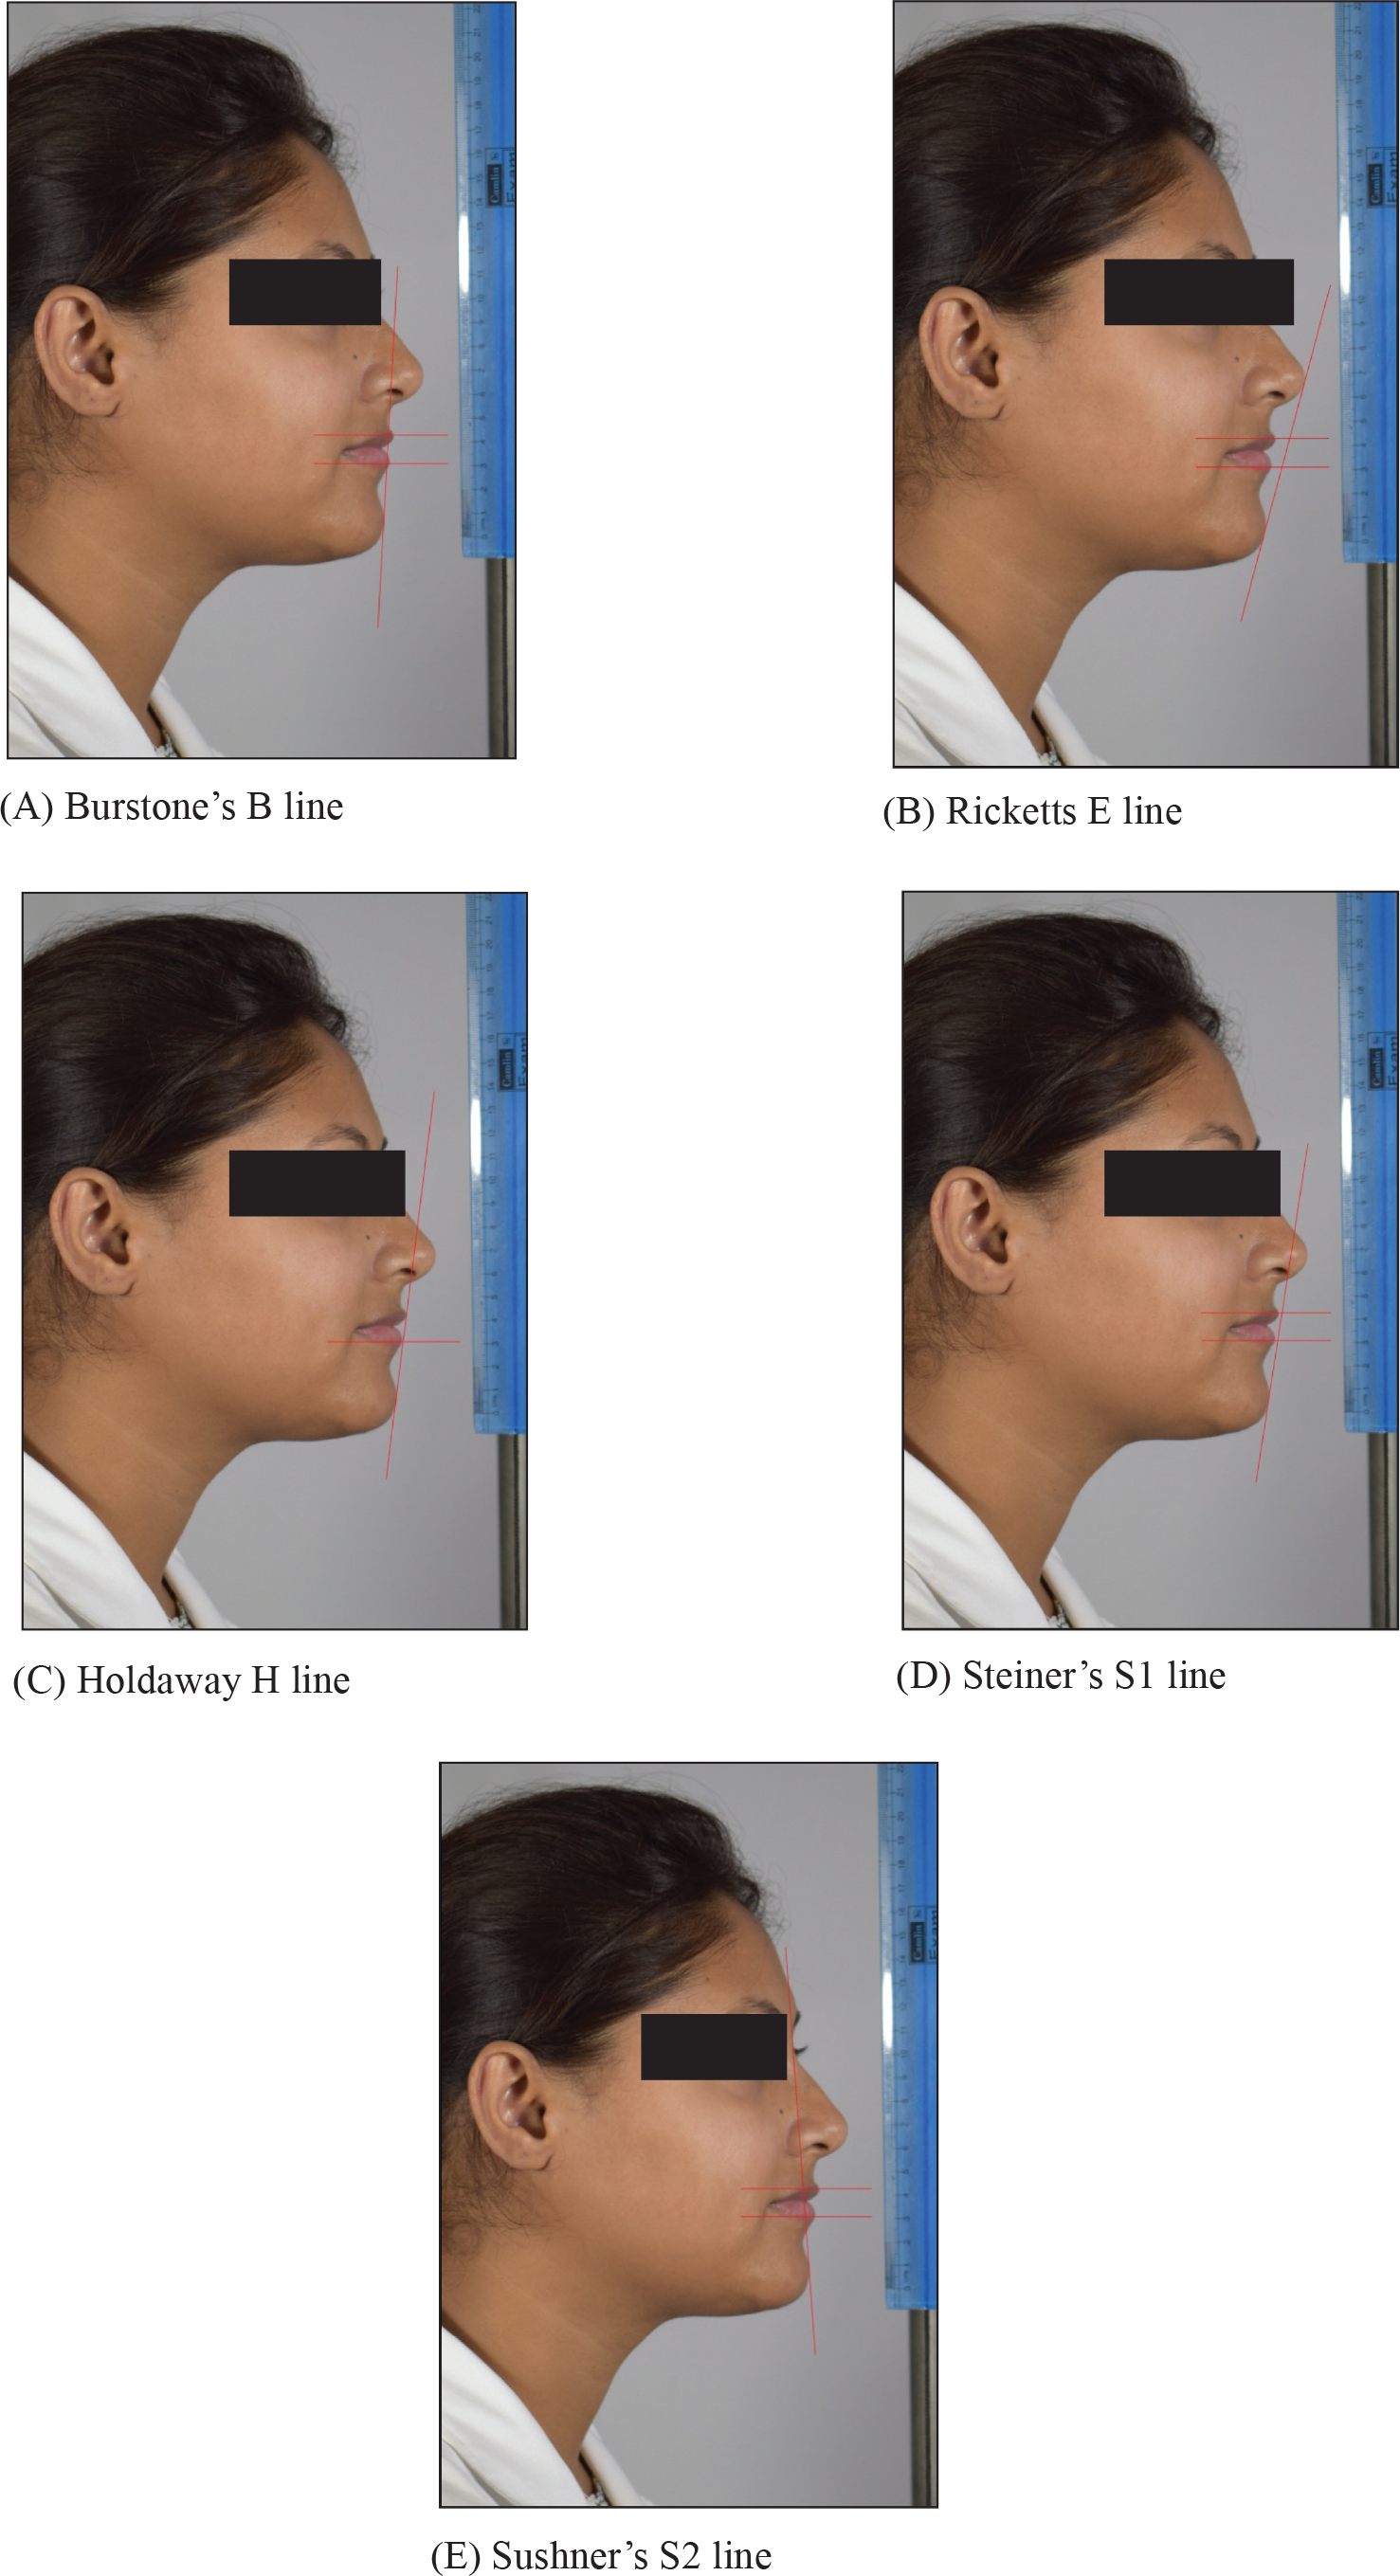
Reference Lines Used in the Study (Constructed Using the Microsoft Paint Software version 6.1; Build 7600) (Figure 8)
Two horizontal lines were drawn, which pass from the labrale superius and labrale inferius for each of the reference lines. After all landmarks and reference planes were marked, the images were saved and uploaded in JPEG format on Nemoceph software (Nemoceph 6.0 “copyright©1998-2005”- software Nemotec SL) (Figure 9).
The linear horizontal lip position from the shortest distance between the tips of the lips and to these five reference lines were calculated using Nemoceph software. The measurements thus obtained were subjected to a statistical analysis using the SPSS software. Mean, standard deviation, and range for the linear measurements were calculated for the whole samples and for males and females separately.
The Intra-class correlation coefficient (ICC) showed a significant (P < .01) and high positive correlation (.991-.999), indicating high reliability of the facial linear measurements (Table 1).
Results
Soft Tissue Linear Measurements
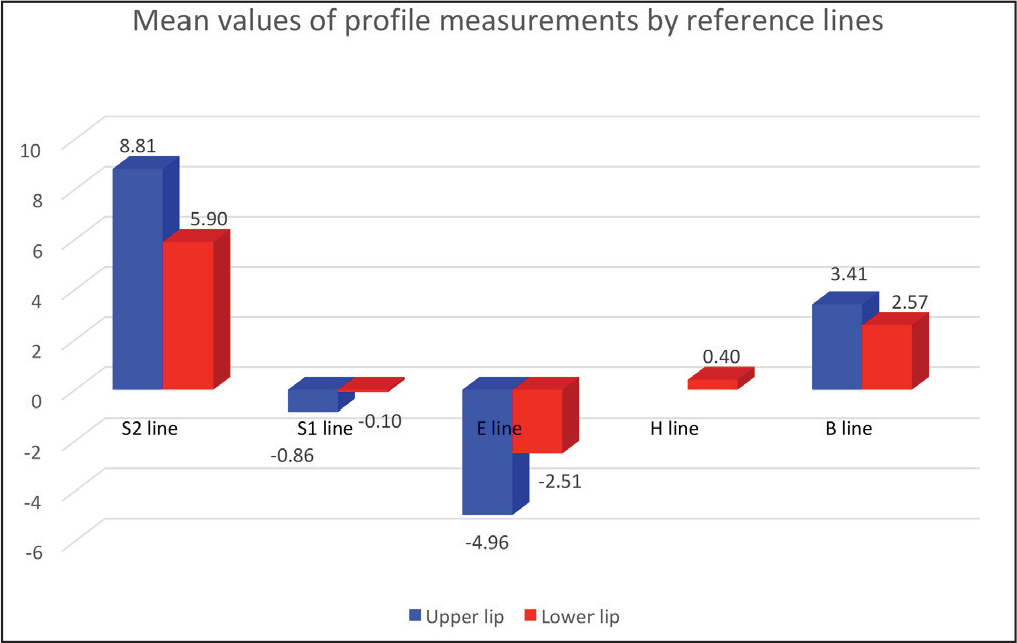
Soft tissue linear measurements for pleasing profile in young local population (both male and female) were analyzed. The mean and standard deviation (SD) of the upper and lower lip positions, using different soft tissue lines for the whole samples, were calculated. For the upper and lower lips, S2 line showed the maximum lip prominence (UL = 8.81, LL = 5.90), whereas E line depicted minimum lip prominence (UL = −4.96, LL = −2.51) (Table 2 and Figure 10).
Reference Lines Used in the Study

Descriptive Statistics for the Upper and Lower Lip Position in Relation to Different Esthetic Lines
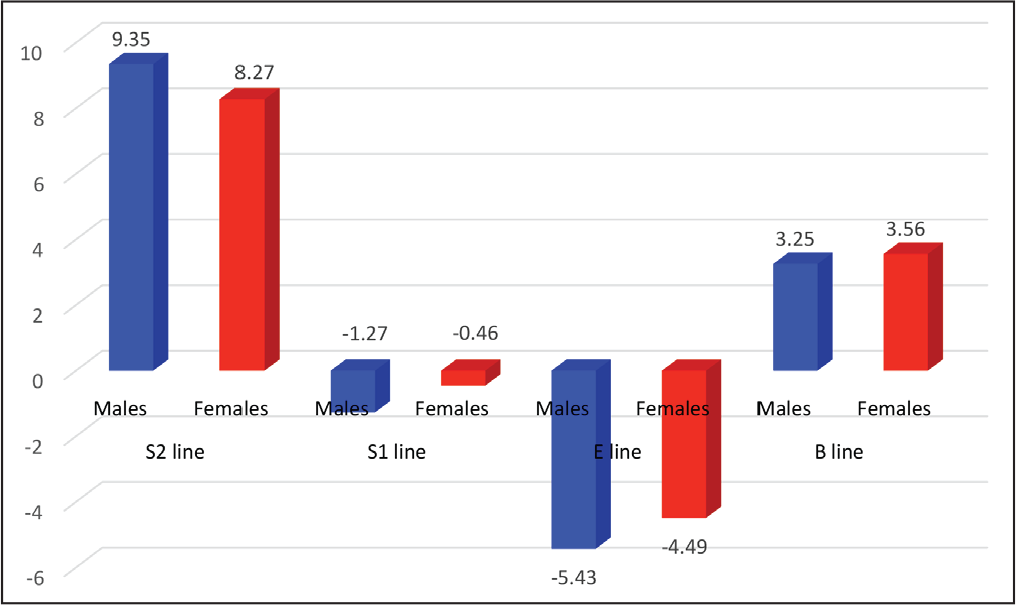
Gender-Wise Comparison of Profile Measurements of Upper Lip by Reference Lines
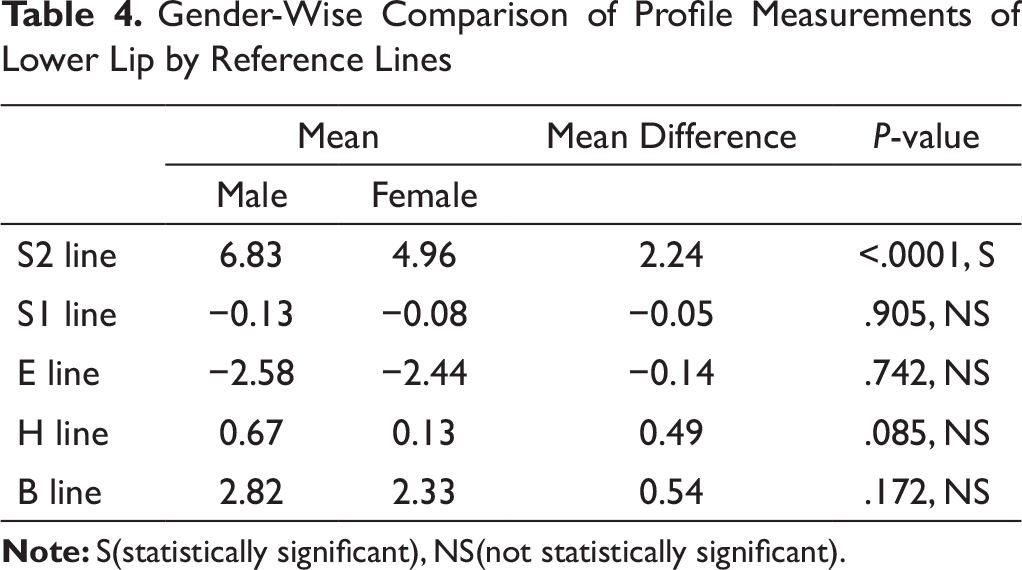
Gender-Wise Comparison of Profile Measurements of Lower Lip by Reference Lines
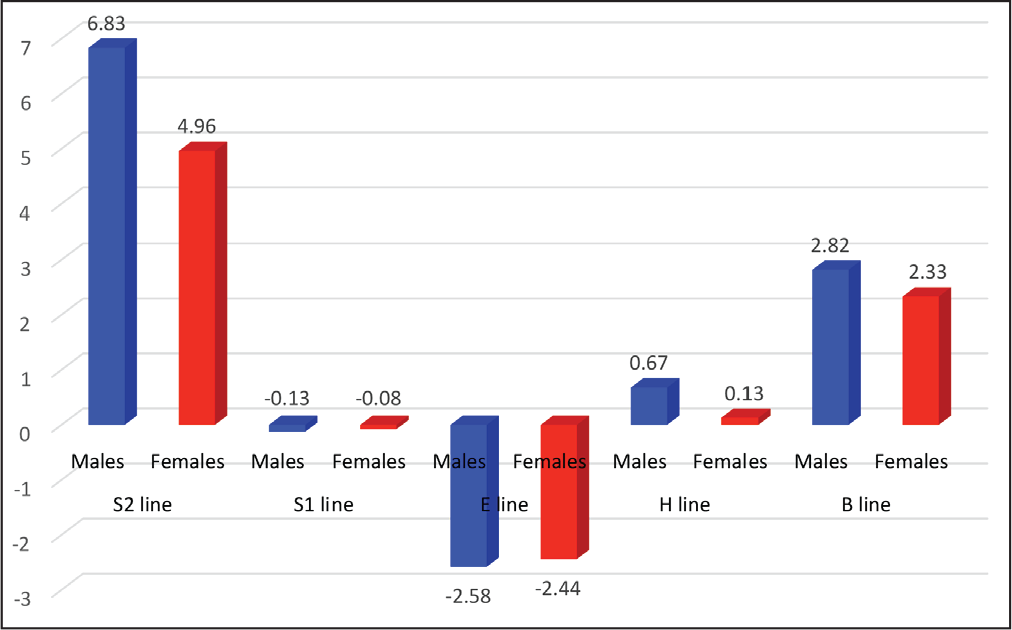
Gender-Wise Comparison of Profile Measurements of Lower Lip by Reference Lines
Upper Lip
On analyzing the gender differences, there was a statistically significant difference (P < .01) with males showing more prominent upper lip as compared to females for all the reference lines (S2 line, S1 line, E line), except for the B line where the difference was not statistically significant (P value = .299). maximum difference (1.07) was observed for S2 line (Table 3, Figure 11).
Lower Lip
No statistically significant difference was observed for the lower lip prominence for all the reference lines, except for the S2 line, where there was a difference of 2.24 mm, which was statistically significant (Table 4, Figure 12).
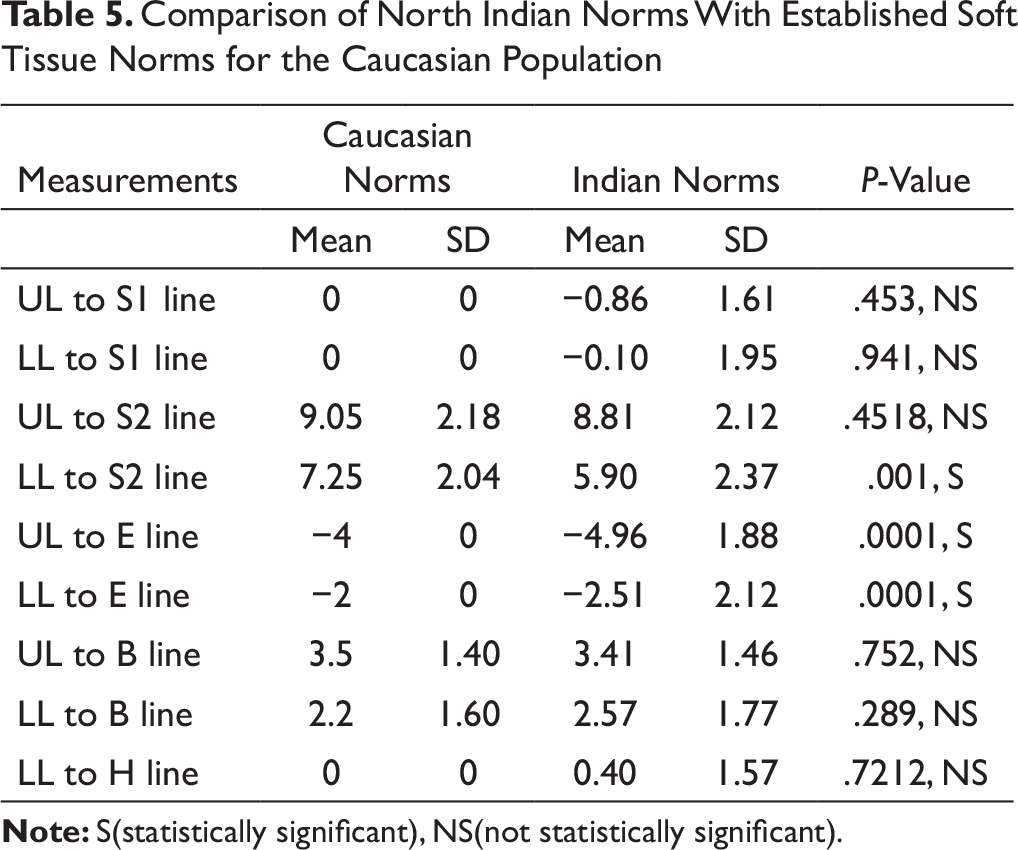
Comparison of North Indian Norms With Established Soft Tissue Norms for the Caucasian Population
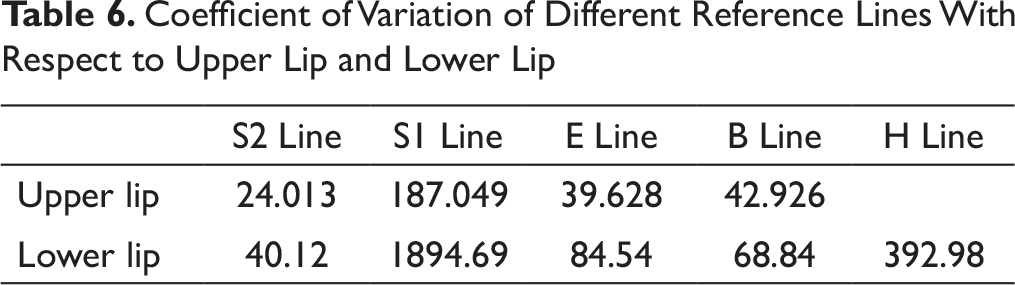
Coefficient of Variation of Different Reference Lines With Respect to Upper Lip and Lower Lip
S2 line showed statistically significant differences between the norms for only the lower lip (.001, S), whereas E line showed highly statistically significant difference between the norms for both upper and lower lips (.0001, S) (Table 5).
The coefficient of variation was derived to assess the consistency of different reference lines for both lips. It was observed that S1 line showed maximum coefficient of variance—COV (187.0) for the upper lip, whereas S2 line showed minimum COV (24.01) for the upper lip (Table 6).
In case of lower lip, S2 line showed minimum COV (40.12), whereas S1 line showed maximum COV (1894.69) followed by H line (392.98) (Table 6).
Since, with respect to both the upper lip and the lower lip, S2 line showed the smallest COV, it provided the narrowest dispersion and the best consistency in terms of judging facial profiles.
Discussion
Various methods have been used to evaluate the facial characteristics such as anthropometry, 11 photogrammetry,12, 13 computer imaging, and cephalometry.14, 15 Among these methods, two-dimensional photogrammetry has the advantages of being a basic, non-invasive, cost-effective, and quick method that requires minimal time and equipment in the assessment of soft tissue. 16
Photographs, on the other hand, provide a more conventional documentation of soft tissues of the face. Soh et al 17 found that the perception of the male esthetics by dental students and laypersons was not significantly correlated with that of dental professionals (orthodontists and oral surgeons). Our study, therefore, involved a panel of judges (professionals from different field) comprising an orthodontist, a layman, an oral surgeon, a professional photographer, and a beautician with an emphasis to focus on the balance in facial parts, disregarding individual highlights (beautiful eyes, hairs, etc).
Statistically significant differences between genders were observed with more protrusive upper lip in females for S1 and E line, whereas males showed protrusive upper lip for S2 line (P < .001). However, B line showed no statistically significant difference between genders. Similarly, females showed more protrusion in lower lip in relation to S1 line, which was statistically significant. E line also showed protrusive lower lip in females though it was statistically not significant. Males showed prominent lower lipin relation to (i.r.t.) S2, B, and H line though the difference was statistically not significant.
It has been documented in many studies that the reference line passing through the nose (S1, E) showed more protrusion in females as males have increased nasal prominence, which contributes to reduced prominence of the lips. 18 The reason S2 line showed more protrusion in the males could be because of increased thickness of the upper lip in males as compared to females, and this comes in agreement with the reports of Arnett et al, 19 Kalba et al, 20 and Lalitha et al. 21
The significant difference for Sushner’s S2 line for lower lip when compared to Caucasians could be due to posteriorly positioned forehead and nasion in Indians as compared to Caucasians. 22 Also the mandibular anteriors were more upright in the North Indian population as observed in a study done by Patil et al. 23 The findings of Umale et al 24 revealed that in a North Indian sample of pleasing profile of both upper and lower lips were more retrusive than the normative values of Steiner’s, Ricketts’, Burston’s and Sushner’s. The result was statistically not significant for most of the reference lines, except for Ricket’s E plane, and lower lip to Sushner’s S2 line.
The retrusive lip profile in our study could be attributed to the retrognathic maxillary and mandibular base found in the Indian population when compare to their Caucasian counterparts.
Erbay et al 2 reported similar findings to our study, that the upper and lower lips of a population of Anatolian Turkish adults were more retrusive than the normative values of Steiner and Rickett, while they were still within the normal range of Burstone’s B line. These findings were attributed to the prominent chin and nasal prominence in the sample studied.
The upper and lower lip values for B line fell within range when compared to the normative values by Burstone. Bergman 25 reported that the distance from the lower lip to the B line should be about 1 mm less than the upper lip to B line, and this finding is consistent with the upper and the lower lip protrusion values (3.5 mm and 2.2 mm, respectively) reported by Burstone.
Many authors have reported that the normative values for a certain population differ from one another. Ethnic and racial differences have been reported in evaluating the horizontal position of the lips in relation to the chin and the nose. 2 Park et al 26 reported that the upper and lower lips were more protrusive in Koreans than in Whites according to Steiner’s and Ricketts’ esthetic lines because of a small nose and lack of chin prominence. Yuen and Hiranaka 27 and Cooke and Wei 28 found that, according to Ricketts’ esthetic lines, the upper and lower lips were more protrusive in Chinese than in Whites and Blacks because the chin was located downward and backward in these populations.
In our study, the upper lip was found to be more protrusive than the lower lip, which was similar to the findings reported by Erbay et al, 2 whereas the lower lip was relatively protrusive than the upper lip in the Nigerian population.
India is a unique country with great diversity in ethnic groups, race, and religion. Therefore, many studies have been carried out to define soft tissue norms in different part of the country. A study carried out on the Maratha population found retrusive upper and lower lips when compared to Caucasian males and females.
Similar to our study, a study carried out on the North Indian population reported upper and lower lips within the range as defined by Burstone. 29 Also, our findings were similar to the studies carried out by Jain and Kalra’s 30 , involving the North Indian population as well as the South Indian and Kerala population. South Indian and Kerala population were also reported to have midfacial prominence, when compared to Caucasians. Bilateral protrusion observed in the South Indian population could be due to the bimaxillary protrusion usually found in the Dravidian ethnicity.
A similar study was carried out on the Lucknow population, evaluating lip protrusion with reference to H line. The study reported protrusive lower lip when compared with Holdaway’s Caucasian norms, 31 which was collaborated in our study, though the difference was not significant. The decreased upper lip thickness as compared to Caucasians could be a contributing factor to protrusive lower lip as reported by Prabu et al. 32
Coefficient of Variation
In the present study, it was found that S2 line had the least COV (upper lip: 24.013% and lower lip: 40.12%) and provided the narrowest dispersion for both the lips. Hence, they can be considered to be the best reference lines in terms of judging the horizontal position of the lips in profile analysis. This is similar to the findings of the Taiwanese population (COV: upper lip—22.2% and lower lip—26.9%) by Hsu 33 and a mixed Indian population (COV: upper lip—17.544% and lower lip—21.9897%) by Naidu et al. 34
S1 line had the largest coefficient of variation for both the upper and lower lips (COV: upper lip—187.049% and lower lip—1894.69%) followed by the H line for lower lip (COV—392.98%). Therefore, S1line and H line can be considered as less reliable to assess the horizontal lip position. The less consistency of S1 line and H line may be because these lines pass through the nose and the upper lip, respectively. 35
As many of the reference lines used for facial analysis pass through the nose and chin, growth and morphology of the nose and the chin would greatly affect the lip position. Ricketts’ E plane should be read in relation to the nose and chin. Ricketts’ E plane is influenced by the growth of the nose, whereas Steiner’s S1 line eliminates half of the changes in integument profile due to the growth of the nose. Nasal growth was eliminated in H line, B line, and Sushner S2 line. The relation of the lip with the B line and the H line depended on the thickness of the upper lip and correct position of the lips.
Both chin and nasal position influence the horizontal lip position. 35 Therefore, Sushner’s S2 line, which passes through a relatively stable anatomical landmark nasion, is found to be more consistent and reliable as it has been collaborated by studies carried out on different populations.
Therefore, as clinicians, we have to keep in mind the role of S2 line in analyzing the soft tissue lateral facial profile because of its stable and consistent position.
Conclusion
The following conclusions were derived from this study:
Norms for the horizontal lip position in relation to different reference lines, that is, S1 (Steiner’s) line, S2 (Sushner’s) line, E plane, H line, and B- line were derived for the North Indian population. Upper lip position in relation to S1 (Steiner’s) line and Ricketts’ E line showed statistically significant difference between genders with females having protrusive lips, while S2 (Sushner’s) line showed statistically significant protrusive upper lip in males when compared to females. None of the reference lines showed any statistically significant difference for the lower lip position between genders, except for S1 (Steiner’s) line, showing protrusive lower lip in females. The norms derived in this study showed statistically significant difference with retrusive upper and lower lips when compared to normative values of Ricketts’ E plane and retrusive lower lip when compared to normative values of Sushner’s line. Sushner’s S2 line showed the maximum stability and consistency; hence, it is the line of choice to judge the sagittal lip positions in profile analysis.
Footnotes
Declaration of Conflicting Interests
Funding
The authors received no financial support for the research, authorship, and/or publication of this article.
Statement of Informed Consent and Ethical Approval
Necessary ethical clearances obtained from institution 641617/ORTHO/E; informed consent was taken before initiating the study from all participants.