
Abstract
High-frequency vibrations from manual exploration of natural surfaces are crucial for differentiating materials. These signals depend not only on the spatial structure of materials’ surfaces but also on exploration speed. How we achieve speed constant material perception, even in passive perception in which the texture is moved across the finger, is an open question. Here, we systematically varied exploration speed and recorded vibratory signals from human explorations of 74 material samples. We report that natural materials’ power spectra can be described by the 1/fs function, with the exponent s differentiating between materials. Crucially, s is speed constant and can explain human correct and mistaken material classifications. Furthermore, s correlates with the highest layer of a speed constant neural network trained to classify natural materials and can be computed from the ratio of tactile afferents’ (RA to PC) activation. We propose that s is a biologically plausible solution of speed constancy.
Introduction
We are extremely good at recognizing which material an object is made of by touch. For instance, we can distinguish silk from satin, or even real from fake wood, though visually such a distinction might be difficult. Identification of an object's material is crucial to interacting with it. We need to be more careful with a glass made of glass than the one made of plastic. Haptic perception of materials is based on the dynamic contact between the hand and the material's surface, as we usually slide the hand across the object's surface to understand what material it is made of (Lederman & Klatzky, 1987). During the contact between the skin and the material, the spatial structure of its surface elicits vibrations on the skin. Such temporal signals are highly texture-specific and the base of haptic material perception (Manfredi et al., 2014; Metzger & Toscani, 2022; Weber et al., 2013), mediated mostly by the responses of the RA (rapidly adapting) and PC (Pacinian) afferents (Weber et al., 2013). However, the same material could give rise to dramatically different vibratory signals when exploration speed changes (Greenspon et al., 2020), which implies changed afferent responses (Lieber & Bensmaia, 2020). Nevertheless, we can recognize materials across different exploration speeds, even when the material is moved across a static finger, and speed has to be estimated from the same signal (BensmaÏa & Hollins, 2003; Boundy-Singer et al., 2017), suggesting that haptic perception of materials is speed constant. How speed constancy is achieved is yet an open question.
Constancy or invariance is a general goal for perceptual systems (Fleming, 2017). For instance, color perception depends on how spectral lights differentially excite three classes of cone cells in our retinae, but the light reflected by an object depends both on its surface reflectance and on the illumination. Based on a single light, it is not possible to disentangle an object's reflectance from the illumination, but complex stimuli may provide enough information for the visual system to help us recognize objects by their spectral reflectance properties. Similarly, if we would haptically explore sinusoidal gratings, the frequency of vibrations elicited on our skin will be proportional to the exploration speed—afferent responses to a low spatial-frequency grating could be matched to the responses to a higher frequency grating by increasing the exploration speed. However, real materials have a complex 3D surface. The vibratory signals they elicit when we explore them include multiple frequencies with different amplitudes depending on the material and on speed. Such complexity may, in principle, be used by our haptic system to achieve speed constancy.
Some degree of speed constancy was found in responses to material-elicited vibrations in populations of neurons in the somatosensory cortex, while responses of other neurons were more affected by exploration speed (Lieber & Bensmaia, 2020), indicating that speed constancy computations are performed at some processing stage in our brain. While different mechanisms have been proposed, such as spatial and temporal differentiation operators (Connor & Johnson, 1992), or the extraction of harmonics potentially related to auditory timbre constancy (Boundy-Singer et al., 2017), it is not yet clear what computations the human brain is actually applying to achieve speed constancy. In principle, speed constancy could also be achieved by normalizing neural responses by movement speed, but not when textures are passively scanned across the finger (BensmaÏa & Hollins, 2003; Boundy-Singer et al., 2017).
The frequency composition of natural textures follows a 1/fs function in the Fourier amplitude spectrum, with s being the slope characterizing this relationship in log-log space (Toscani & Metzger, 2022). We showed that s systematically varies between material categories and correlates with human perceptual judgements. This parameter is a measure of relative spectral composition: steep s indicates dominance of low-spatial frequency; shallow s indicates dominance of high-spatial frequencies. Being a relative measure, this parameter may exhibit a certain degree of speed constancy, therefore, being a natural candidate for human speed constancy. However, in our previous research, exploratory speed was not systematically varied.
Here, we asked participants to explore 74 different natural material samples from seven categories (wood, stone, fabric, paper, plastic, animal, and metal—examples in Figure 1a) using a pen with a steel tip (Figure 1b), which restricts the sensory input mostly to vibrations. We previously have shown that the perceptual representation of materials from such indirect exploration is very similar to the one obtained from bare hand exploration (Baumgartner et al., 2013; Metzger & Toscani, 2022). To capture the input signals for the haptic perceptual system, we recorded vibratory signals during the exploration of material samples using an accelerometer mounted on the pen. After the exploration, participants reported how each material felt according to seven adjective pairs (e.g., rough vs. smooth or hard vs. soft), and how much each material felt like each of the seven material categories. Crucially, participants were instructed to explore materials at different controlled, trained speeds (slow, medium, and fast) and freely. Speed constancy corresponds to how much perceptual judgements do not change as a function of exploratory speed. We showed that speed constancy is proportionally related to how much s changes between different exploratory speeds for different materials. We then trained a deep neural network to classify materials based on the recorded vibratory signals across speeds, implicitly training for speed constancy. We found a similar level of speed constancy in the responses of higher-level DNN units. We propose that perceptual representations are based on s and its speed constancy can explain perceptual speed constancy.
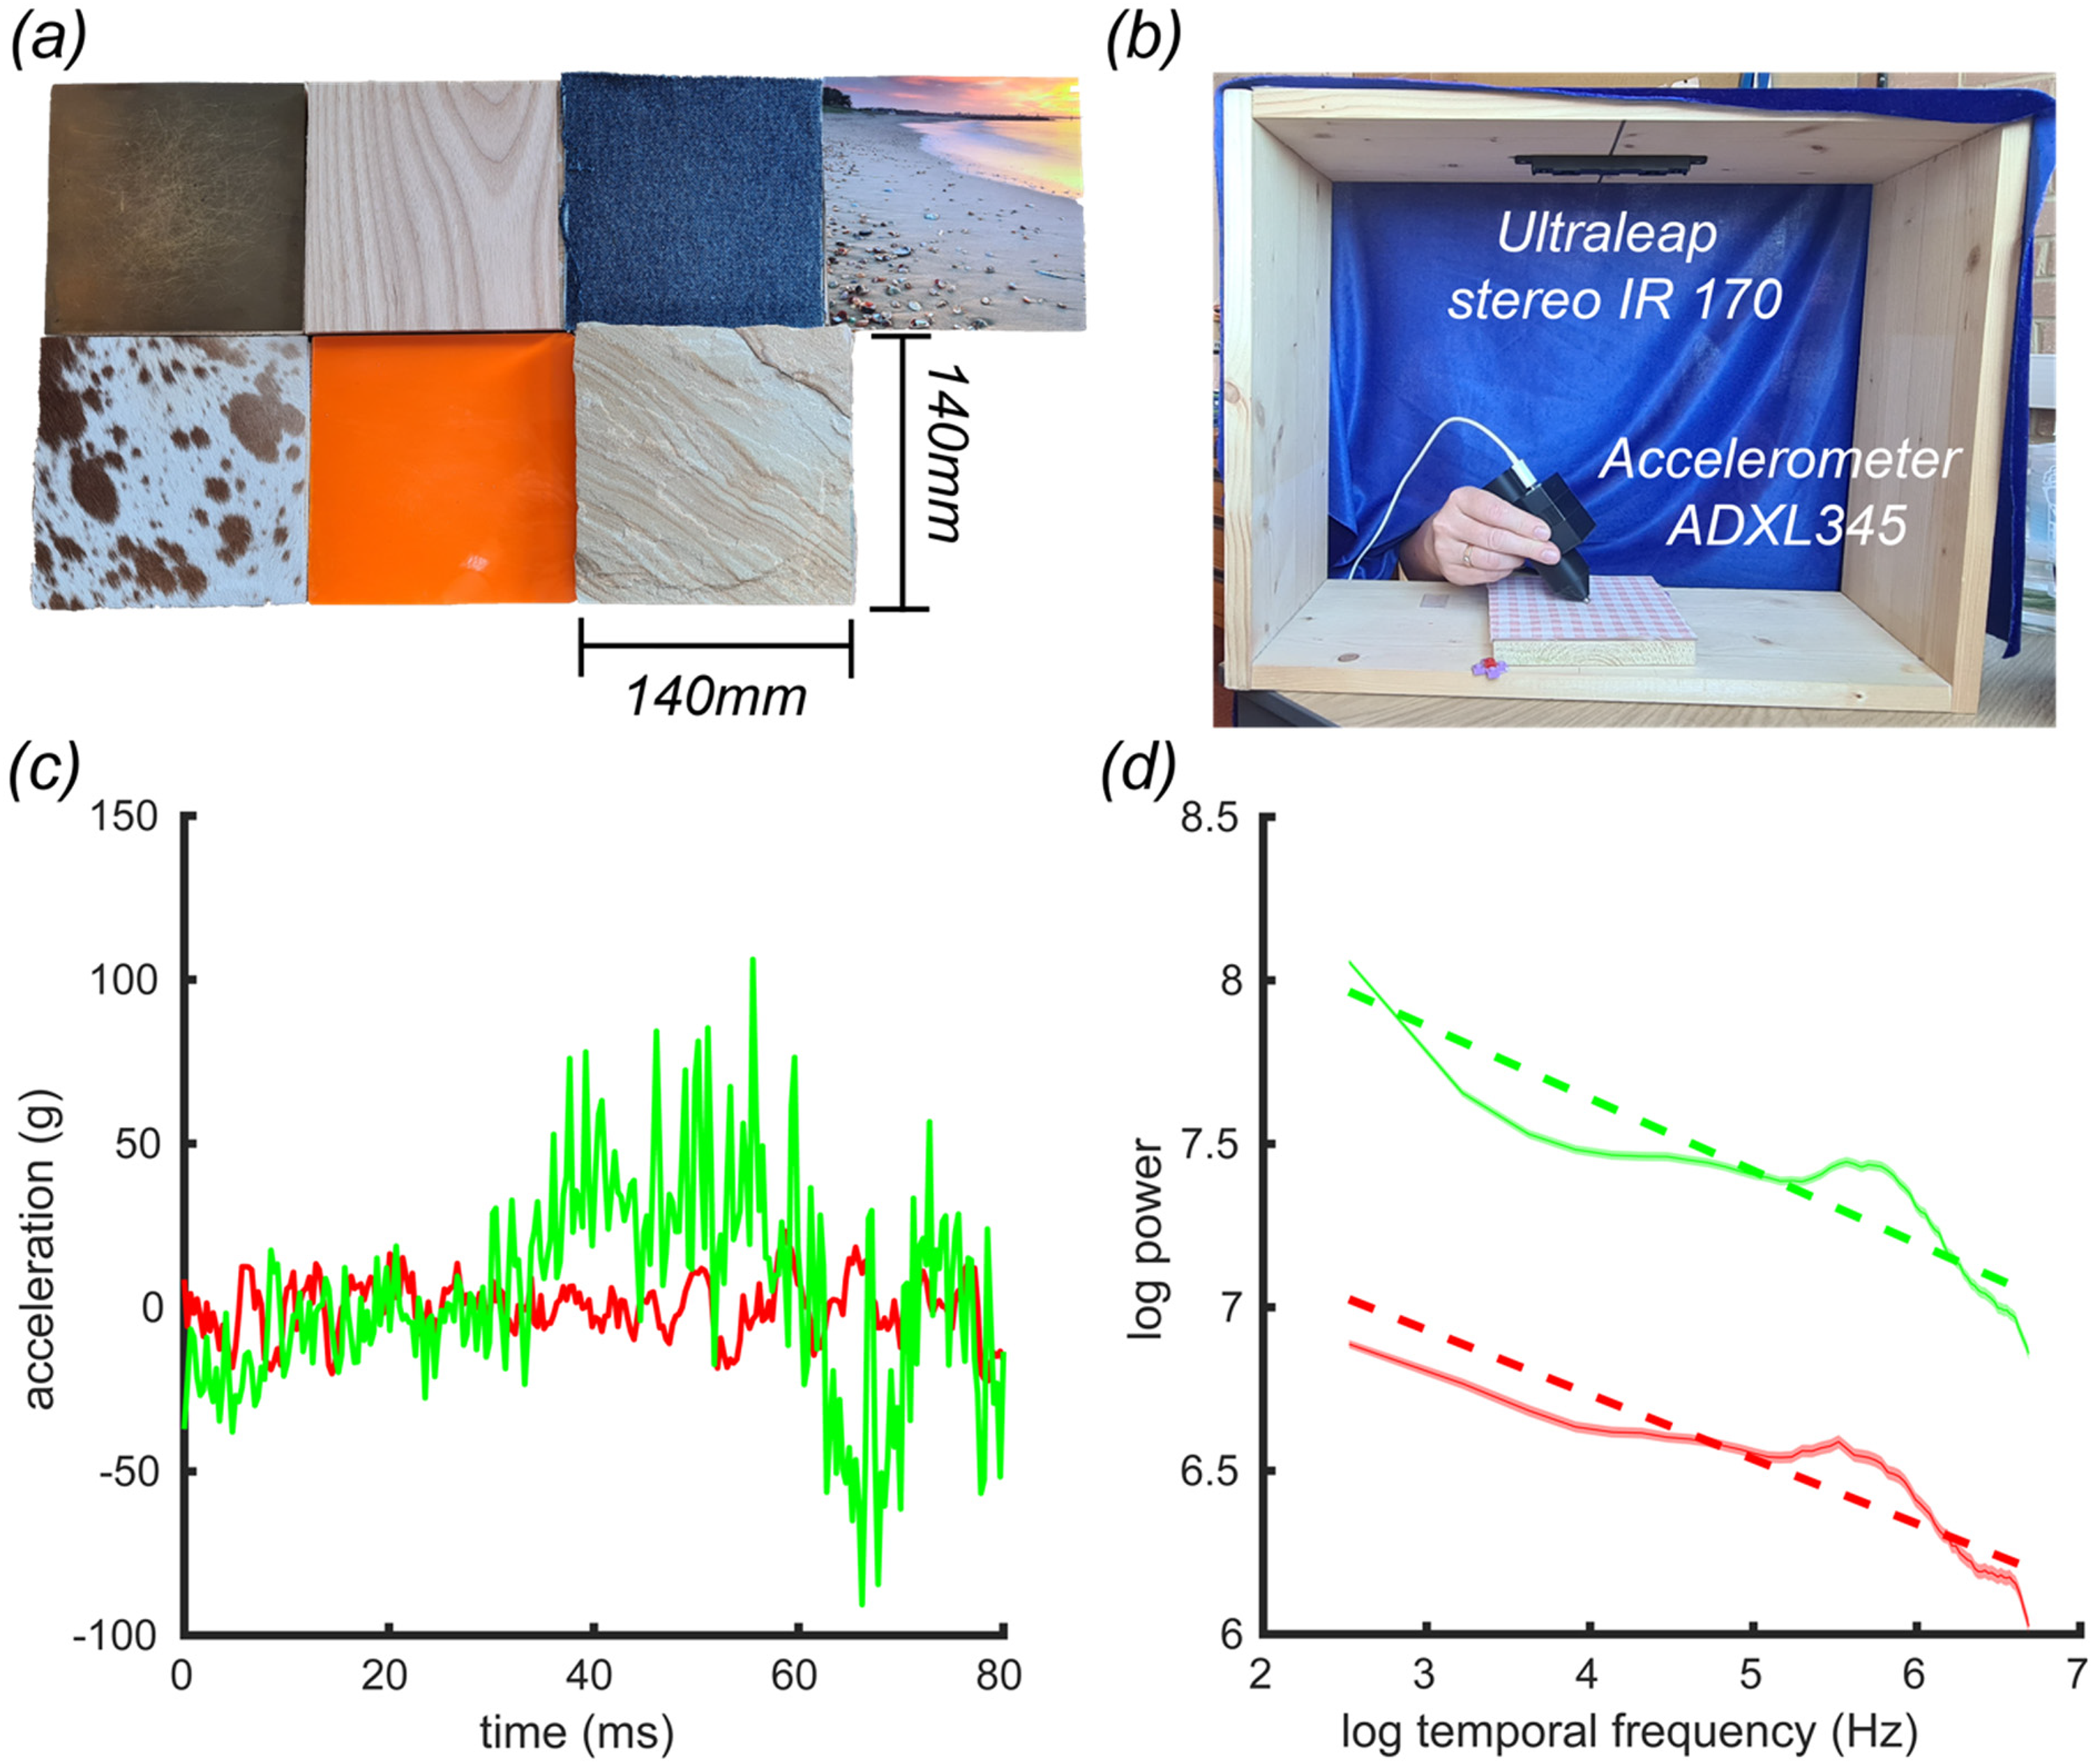
(a) Examples of experimental stimuli—metal, wood, fabric, paper, animal, plastic, and stone, from left to right and top to bottom. (b) Experimental setup from the experimenter's view. (c) A vibratory signal was explored at slow (red/dark grey) and fast (green/light grey) speeds. (d) Average spectral composition across all materials for the slow (red/dark grey) and fast (green/light grey) exploration speeds.
Methods
Participants
Four Bournemouth University students (all females, mean age 21 years, age range 18–25 years) volunteered to participate in the experiment. While this number is small by the standards of participant-level inferential statistics, it is not a primary limitation of the present study. Our main analyses focus on samples (i.e., recorded exploratory trials) rather than on participants as the unit of observation. This approach is appropriate here because exploration speed was experimentally controlled and highly consistent across participants, and because the structure of interest resides in the recorded signals themselves rather than in between-participant variability.
From a practical perspective, the experimental protocol was extremely demanding: each participant completed ∼ 6 hr of testing across three sessions. Given the duration, complexity, and physical demands of the task, a sample of four participants represents a reasonable and efficient use of resources while still yielding a large and statistically informative dataset at the level of recorded samples.
All participants were female. We have no reason to expect that participant sex would systematically affect the recorded accelerometer signals or the pattern of results reported here.
The experiment was in line with the Declaration of Helsinki and approved by the Ethics Committee of Bournemouth University.
Stimuli
We prepared 74 material samples from seven different material categories—fabric, metal, animal, wood, paper, stone, and plastic, in order to cover a wide range of materials that we come in contact with daily (Figure 1a). 14 × 14 mm material samples were glued on 12 mm thick wooden supports of the same length and width. For very thin material, an acrylic sheet was added between the material and the wooden support to prevent that the wood structure of the support could be felt.
Setup
We used a wooden frame 50 × 50 cm and 30 cm in depth to present the materials (Figure 1b). The side facing the participant was covered with a curtain to prevent view of the stimuli. Four plastic blocks affixed to the bottom of the frame kept the stimuli in place. At the ceiling of the frame, an ultra-leap stereo IR 170 motion tracking camera was mounted to record movement speed. Participants kept their right hand in the frame, holding a 3D printed pen with a mounted accelerometer (ADXL345) as in (Metzger & Toscani, 2022) and moved it laterally across the material surface. White noise played during the exploration via headphones covered any auditory signals. Participants used a mouse to provide their responses and the keyboard to control the experiment. Vibratory signals were recorded at 3,200 Hz, and movement of the palm midpoint was recorded at 90 Hz. The experimental program was written in Python.
Procedure
In each trial, the experimenter placed a material sample (Figure 1a) into the frame and pressed the space bar to start the trial (Figure 1b). Participants were instructed which speed to use (slow, medium, or fast – 50, 100, 150 mm/s, or free exploration). Such values are chosen within the natural range of free-exploration movements, which typically varies between 10 and 160 mm/s (Callier et al., 2014; Gamzu & Ahissar, 2001; Libouton et al., 2010; Morley et al., 1983; Smith et al., 2002; Tanaka et al., 2014). They moved in the air above the stimulus until their speed was in the range closer to the target for the trial than to the other speed levels (visualized as the green middle part of a besides red horizontal bar). No feedback was provided for the free speed condition. Once the desired speed was achieved, participants moved down onto the stimulus and pressed the space bar with the other hand to initiate the recording of vibrations, which started with 2 s delay and lasted for 10 s. Participants continued to explore for 2 more seconds, then we signaled to stop and use the mouse to rate the explored material according to seven adjective pairs (hard vs. soft, high friction vs. slippery, orderly vs. chaotic, rough vs. smooth, textured/patterned vs. homogeneous/uniform, elastic vs. not elastic, and warm vs. cold) and to how much it felt like each material category. Rating questions and the response scales were presented on a computer monitor. Participants adjusted an on-screen slider. Moving the slider corresponded to numerical values displayed on the screen, ranging from 0 (far left) to 100 (far right). The experiment was conducted in three sessions, each lasting for 2 hr.
Analysis
Vibratory signals were processed as in Toscani and Metzger (2022). For each participant, material, and condition, we computed s by fitting a line in log-log space of the temporal spectrum.
We performed two complementary analyses to assess the effects of material category and exploration speed on s. First, a repeated-measures ANOVA was conducted at the participant level to test for main effects and interactions. We aggregated samples per category for the ANOVA to limit the number of levels to seven instead of 74 and to make interpretation easier. This approach is justified because separate ANOVAs for each participant (with speed and category as factors) consistently showed a significant main effect of category (all p < .001), with no effect of speed and no interaction between speed and category. Thus, variance between categories is larger than variance within categories, and aggregation does not affect the results. Second, we implemented a sample-based classification analysis to assess discriminability directly at the level of individual samples. In this approach, participants are treated as data-acquisition devices rather than the primary unit of analysis. For this, we pooled all trials across participants and performed a linear classification analysis at the level of individual material samples. To avoid overfitting, we used a leave-one-material-out cross-validation scheme, in which one material (e.g., one of the wooden samples) was excluded from training and used for testing, iteratively across all material samples.
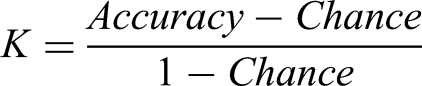
Classification analysis was run separately for material category (wood, plastic, stone, animal, paper, metal, and fabric) and exploration speed (free, slow, medium, and fast). To be able to compare accuracies despite the different number of classes (7 and 4), raw accuracies were corrected for chance using a Cohen's κ-like (K) normalization:
Uncertainty was quantified using bootstrap resampling with replacement (1000 repetitions), which allowed us to compute (1) bootstrapped confidence intervals for the classification accuracies and (2) confidence intervals for the differences between accuracies.
We trained a deep neural network in a supervised manner to classify materials from vibratory signals across different exploration speeds, explicitly encouraging the network to develop speed constant representations, and we assessed whether these representations reflected the same speed constant feature observed in humans.
We used the LSTM (long short-term memory) network as it is particularly well-suited for time series classification (Karim et al., 2018). Each input sample consists of 256 time-steps, corresponding to an 80-millisecond window of acceleration data. The network processes these sequences using a BiLSTM layer with 120 hidden units, enabling it to analyze temporal dependencies in both forward and backward directions, effectively with 120 feedforward and 120 backward units. The network extracts a representation of the 80 ms signal, which is passed through a dense layer that maps it to seven output values (Figure 2), corresponding to distinct signal classes. A softmax function is then applied to produce the final classification
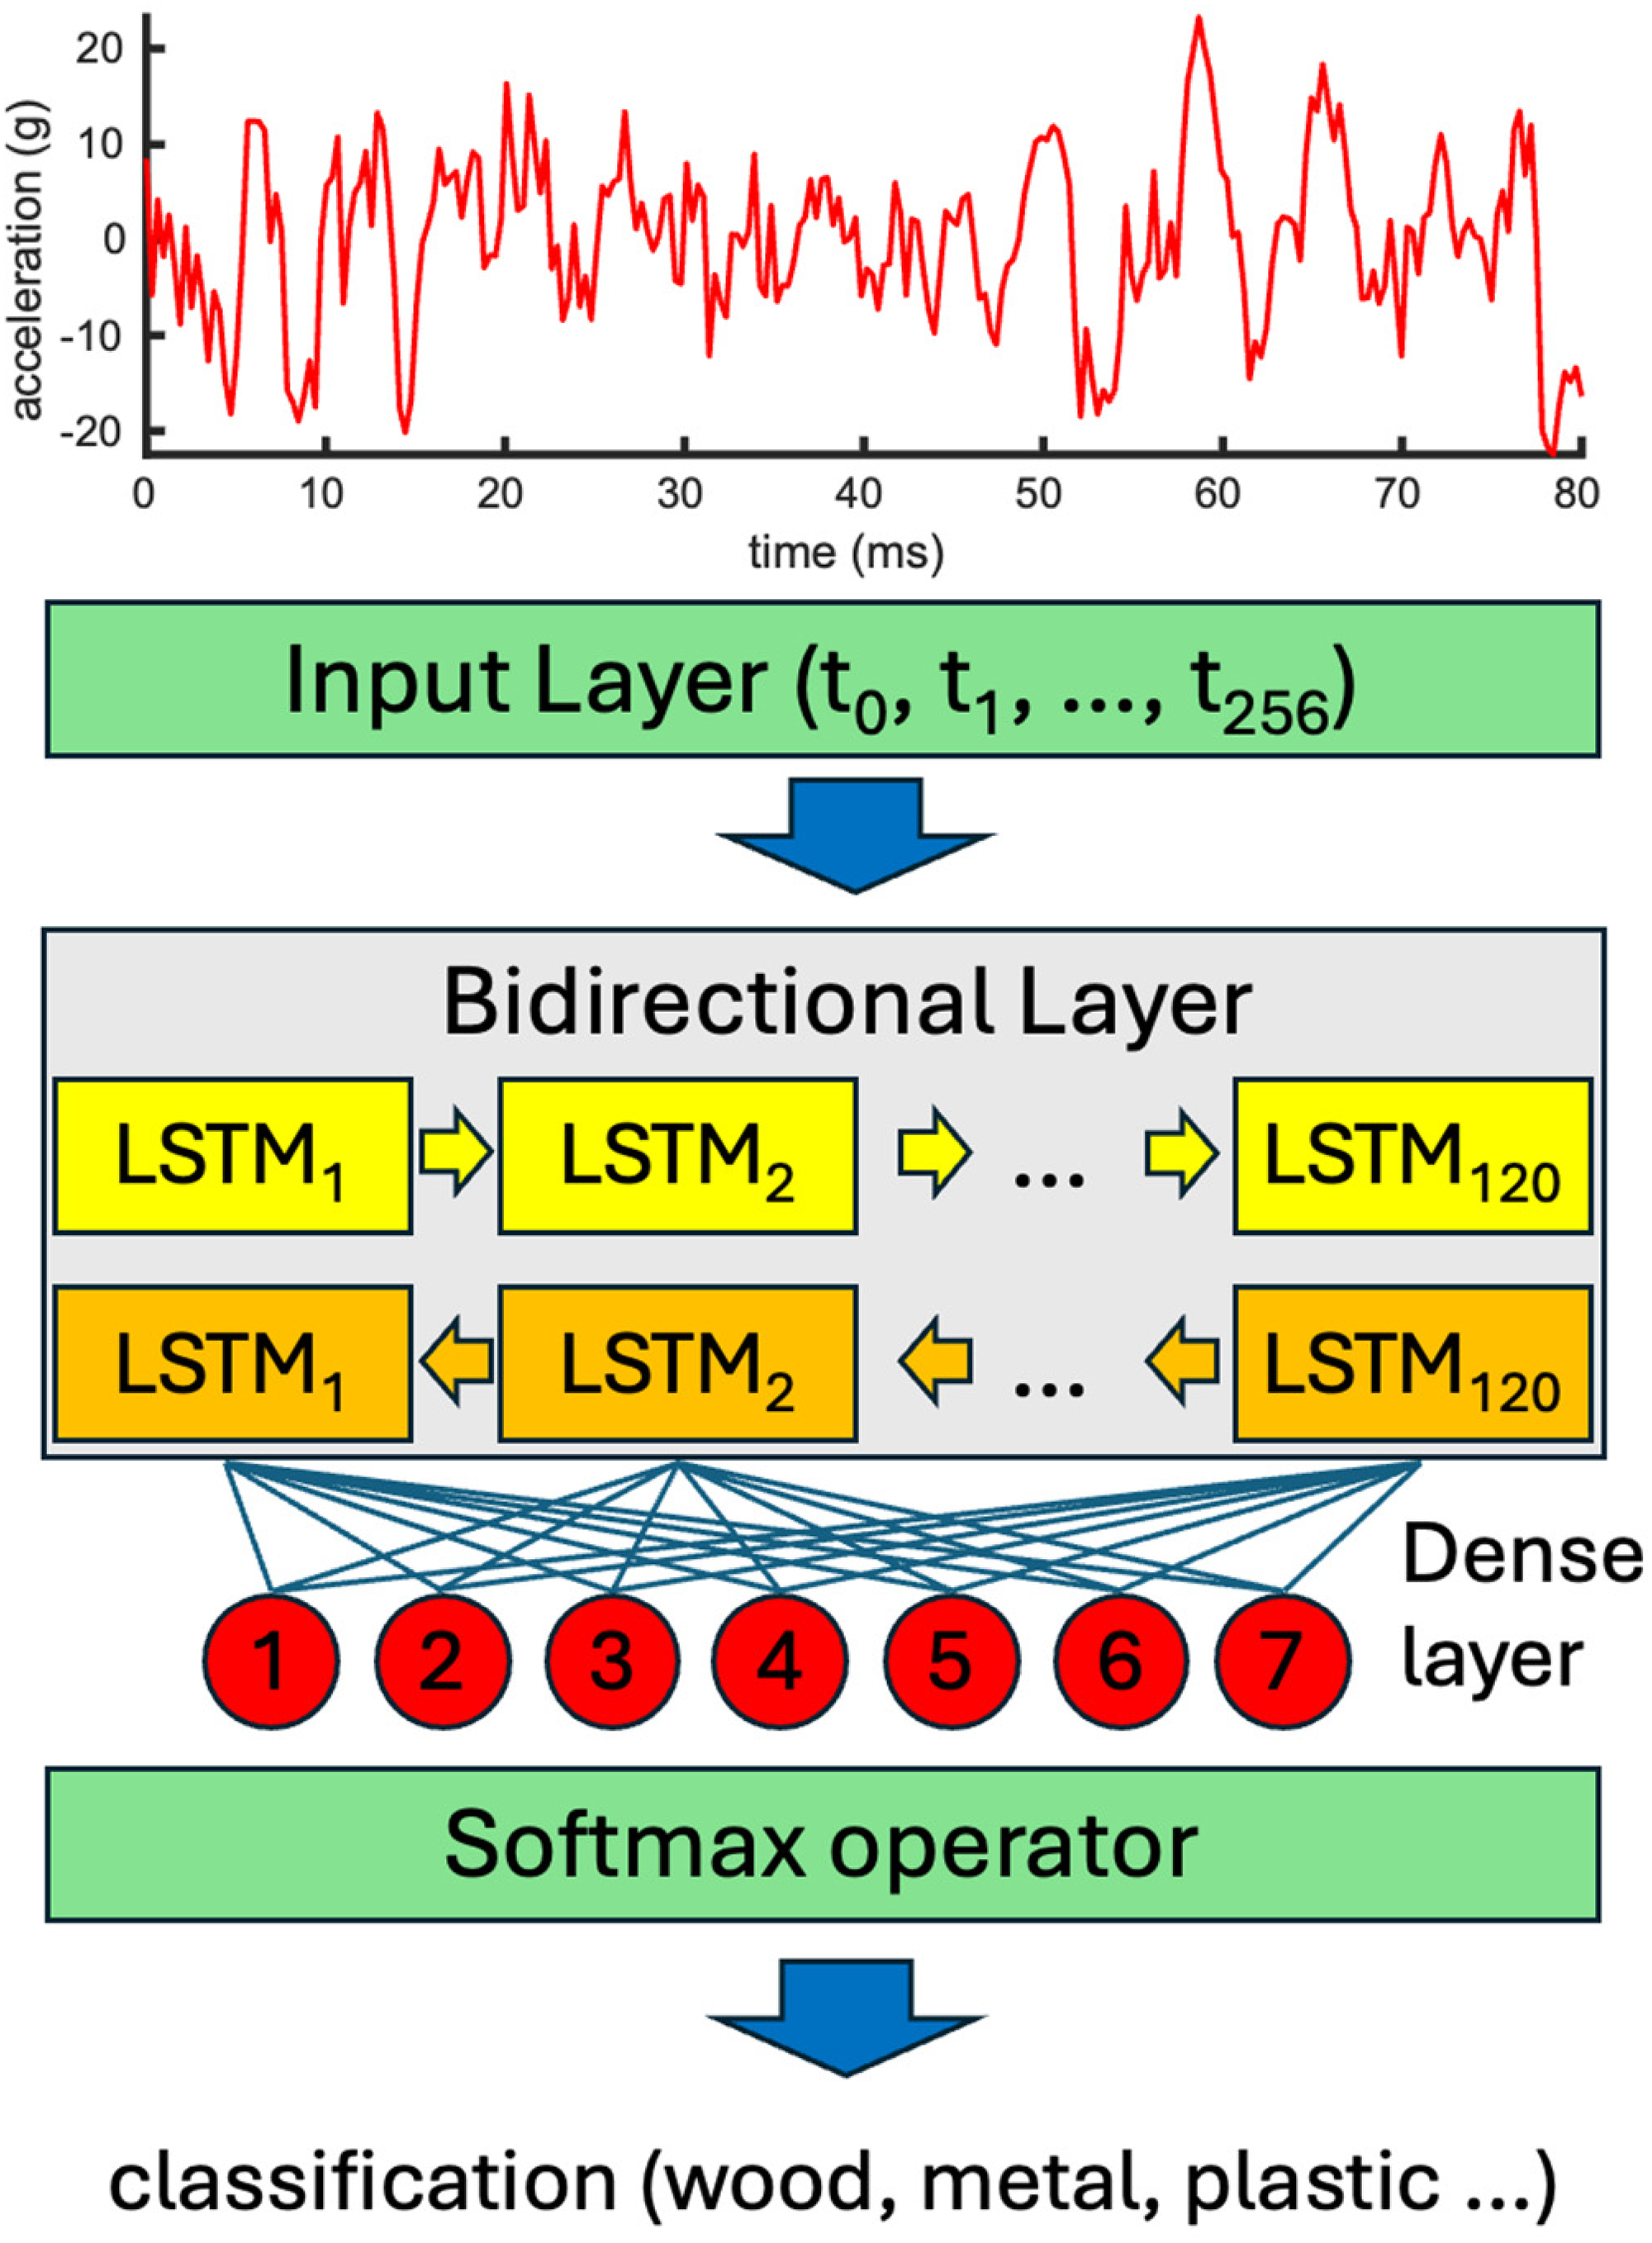
Network architecture. The 256 samples time sequence enters the input layer and is processed by a bidirectional architecture where a (blue) forward-facing stream and a (yellow) backward-facing stream each utilize 120 hidden units to analyze temporal dependencies. The extracted representations converge into a dense layer, which reduces the data to seven distinct output nodes. Finally, a softmax operator converts these values into a material classification.
Results
As expected, the vibratory signals for the same material systematically differed across exploration speed (example in Figure 1c), while slope s was rather constant (Figure 1d).
To quantify the goodness of fit of the spectral slope model, we computed R2 for the linear fits in log–log space. Across the full dataset (31,164 samples), the slope and intercept together explained on average ∼38% of the variance in the power spectra, in close agreement with our previous findings (Toscani & Metzger, 2022). This level of explained variance is notable given that each spectrum comprises many frequency bins and is summarized by only two parameters.
However, R2 has an important limitation in the present context. Our analyses focus on differences in slope between samples, and part of the discriminative power of the slope arises precisely because some spectra are much flatter than others. In these cases, spectra can be very well approximated by a nearly horizontal line yet yield low R2 values because the fitted model performs similarly to a constant-mean predictor. As a result, R2 may underestimate the quality of the linear approximation for spectra with small slopes, and systematically vary between categories, reflecting systematic differences in s (Figure 3a).
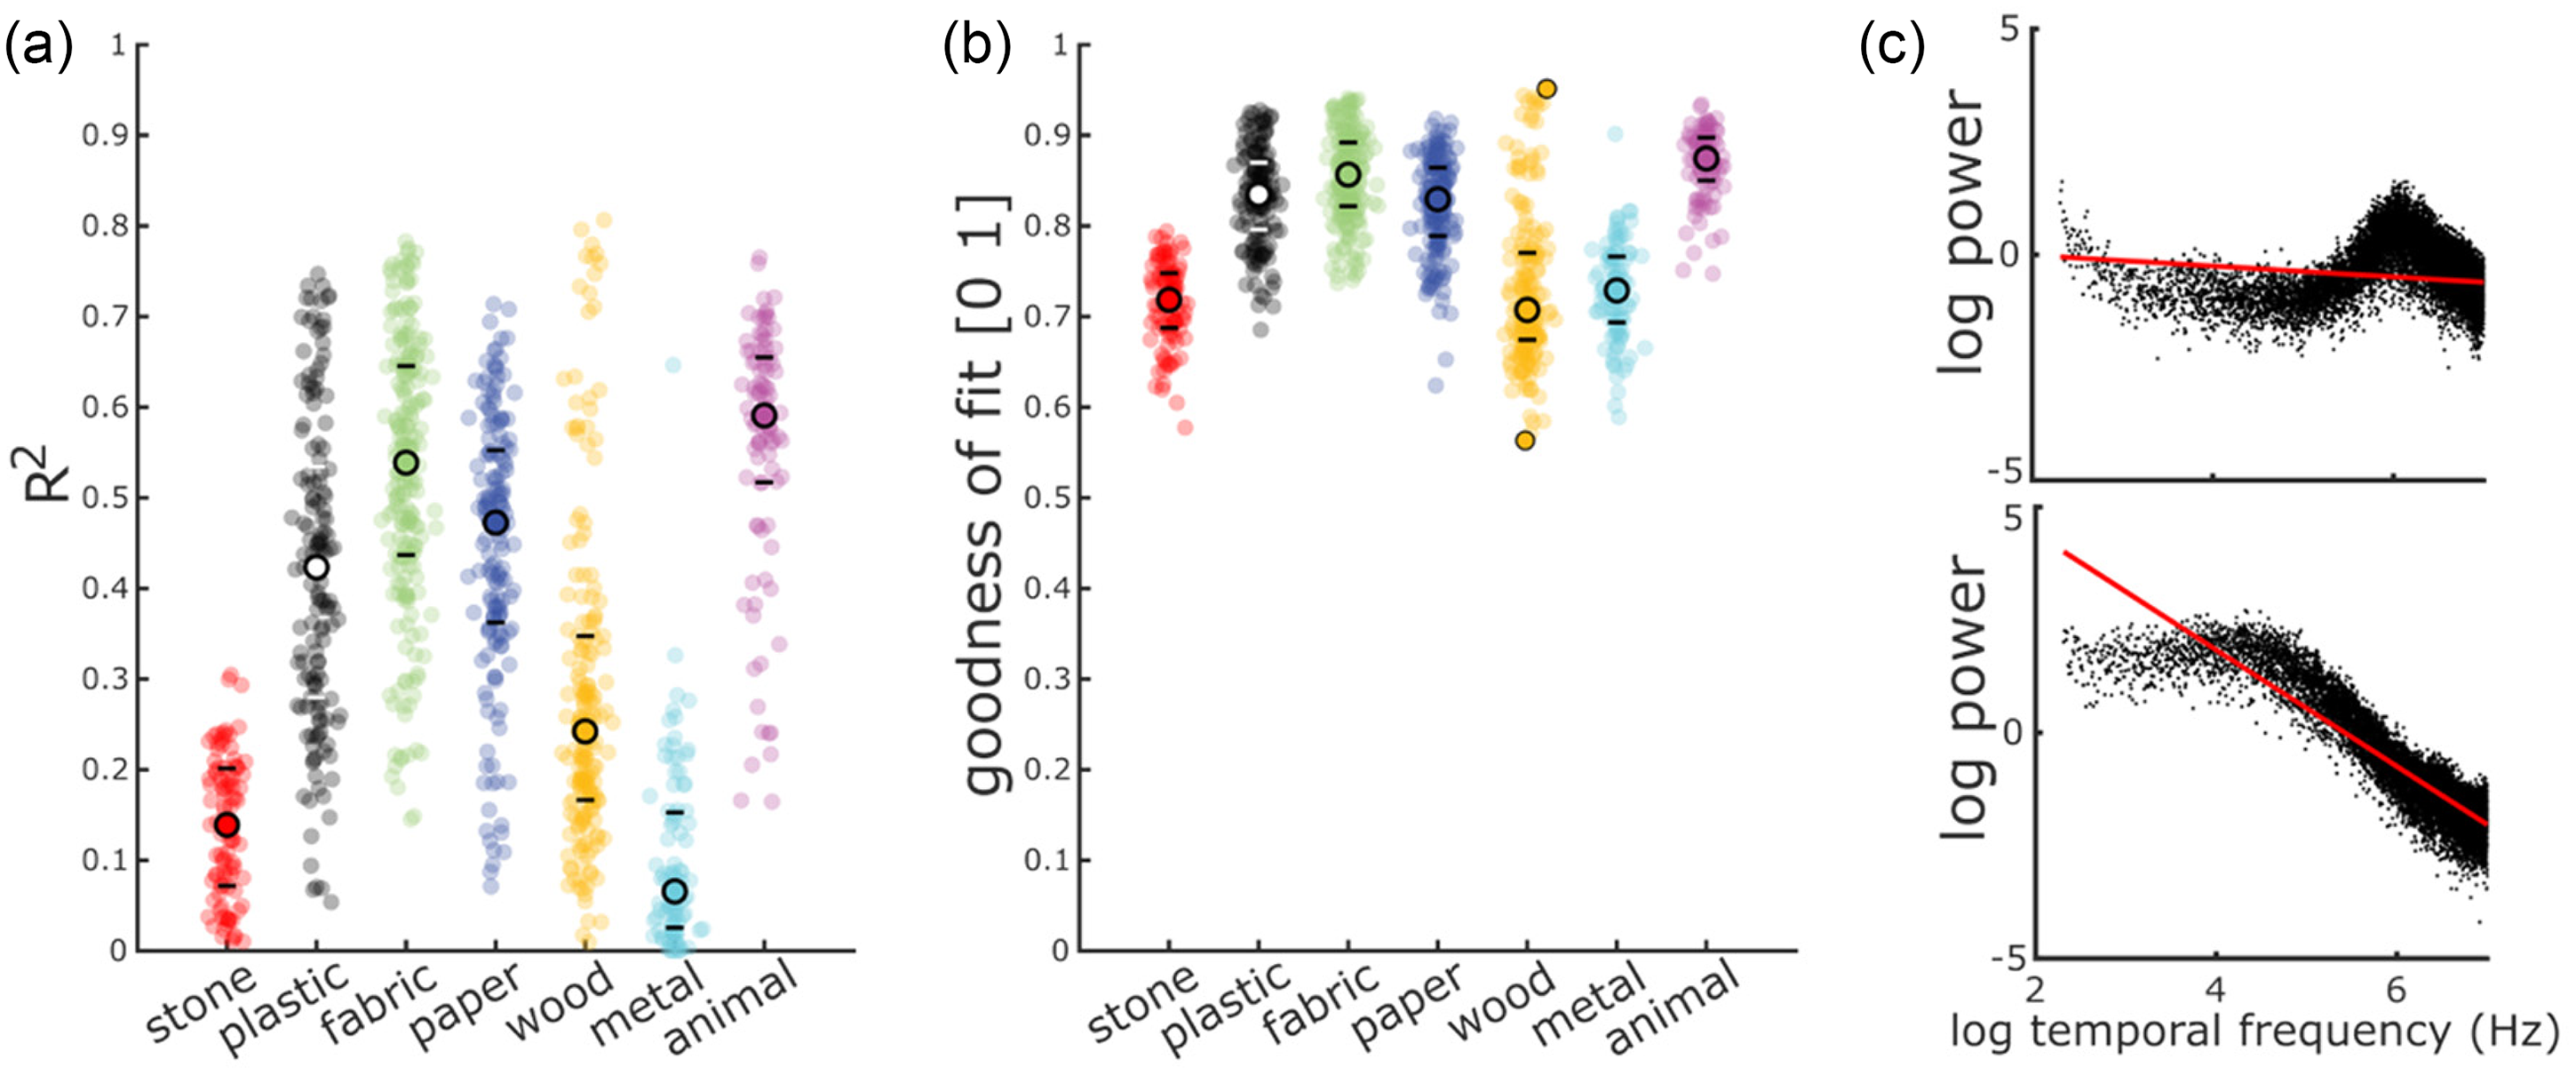
(a) R2 for each sample on the y-axis, as a function of material category, on the x-axis. (b) Goodness of fit for each sample on the y-axis, as a function of material category, on the x-axis. Different colors represent different categories, as indicated by the labels on the x-axis. Empty circles represent the mean R2 for each category, and the horizontal bars below and above the mean represent the 25th and the 75th percentiles, respectively. Filled circles indicate individual samples. (c) Examples of a bad fit (top) and a good fit (bottom). Signals are taken from the wood category, as it exhibits the broadest range of goodness of fit; they represent the extreme values of this range, as highlighted by black circular frames around the data points in (b).
To address this limitation, we additionally report a slope-independent goodness-of-fit index that quantifies how tightly the data points cluster around the fitted line. This index is defined as the fraction of total variance captured along the fitted line direction, normalized by the sum of variance along and orthogonal to the line. Values close to one indicate that the spectrum is well described by a linear relationship in log–log space, regardless of slope magnitude. Using this measure, we observed consistently high goodness-of-fit values across all stimulus categories (Figure 3b), confirming that the power-law approximation provides an excellent description of the spectra even when slopes are shallow.
As can be seen in Figure 4a and as revealed by a repeated-measures ANOVA, slope s didn’t significantly differ across exploration speeds, F(1.11, 3.32) = 2.89, p = .181, η2=.01. Crucially, it significantly varied across material categories, F(6, 18) = 136.26, p < .001, η2=.9. While there was a significant interaction between material category and speed, F(18, 54) = 8.89, p < .001, η2=.04, its effect size was very small.
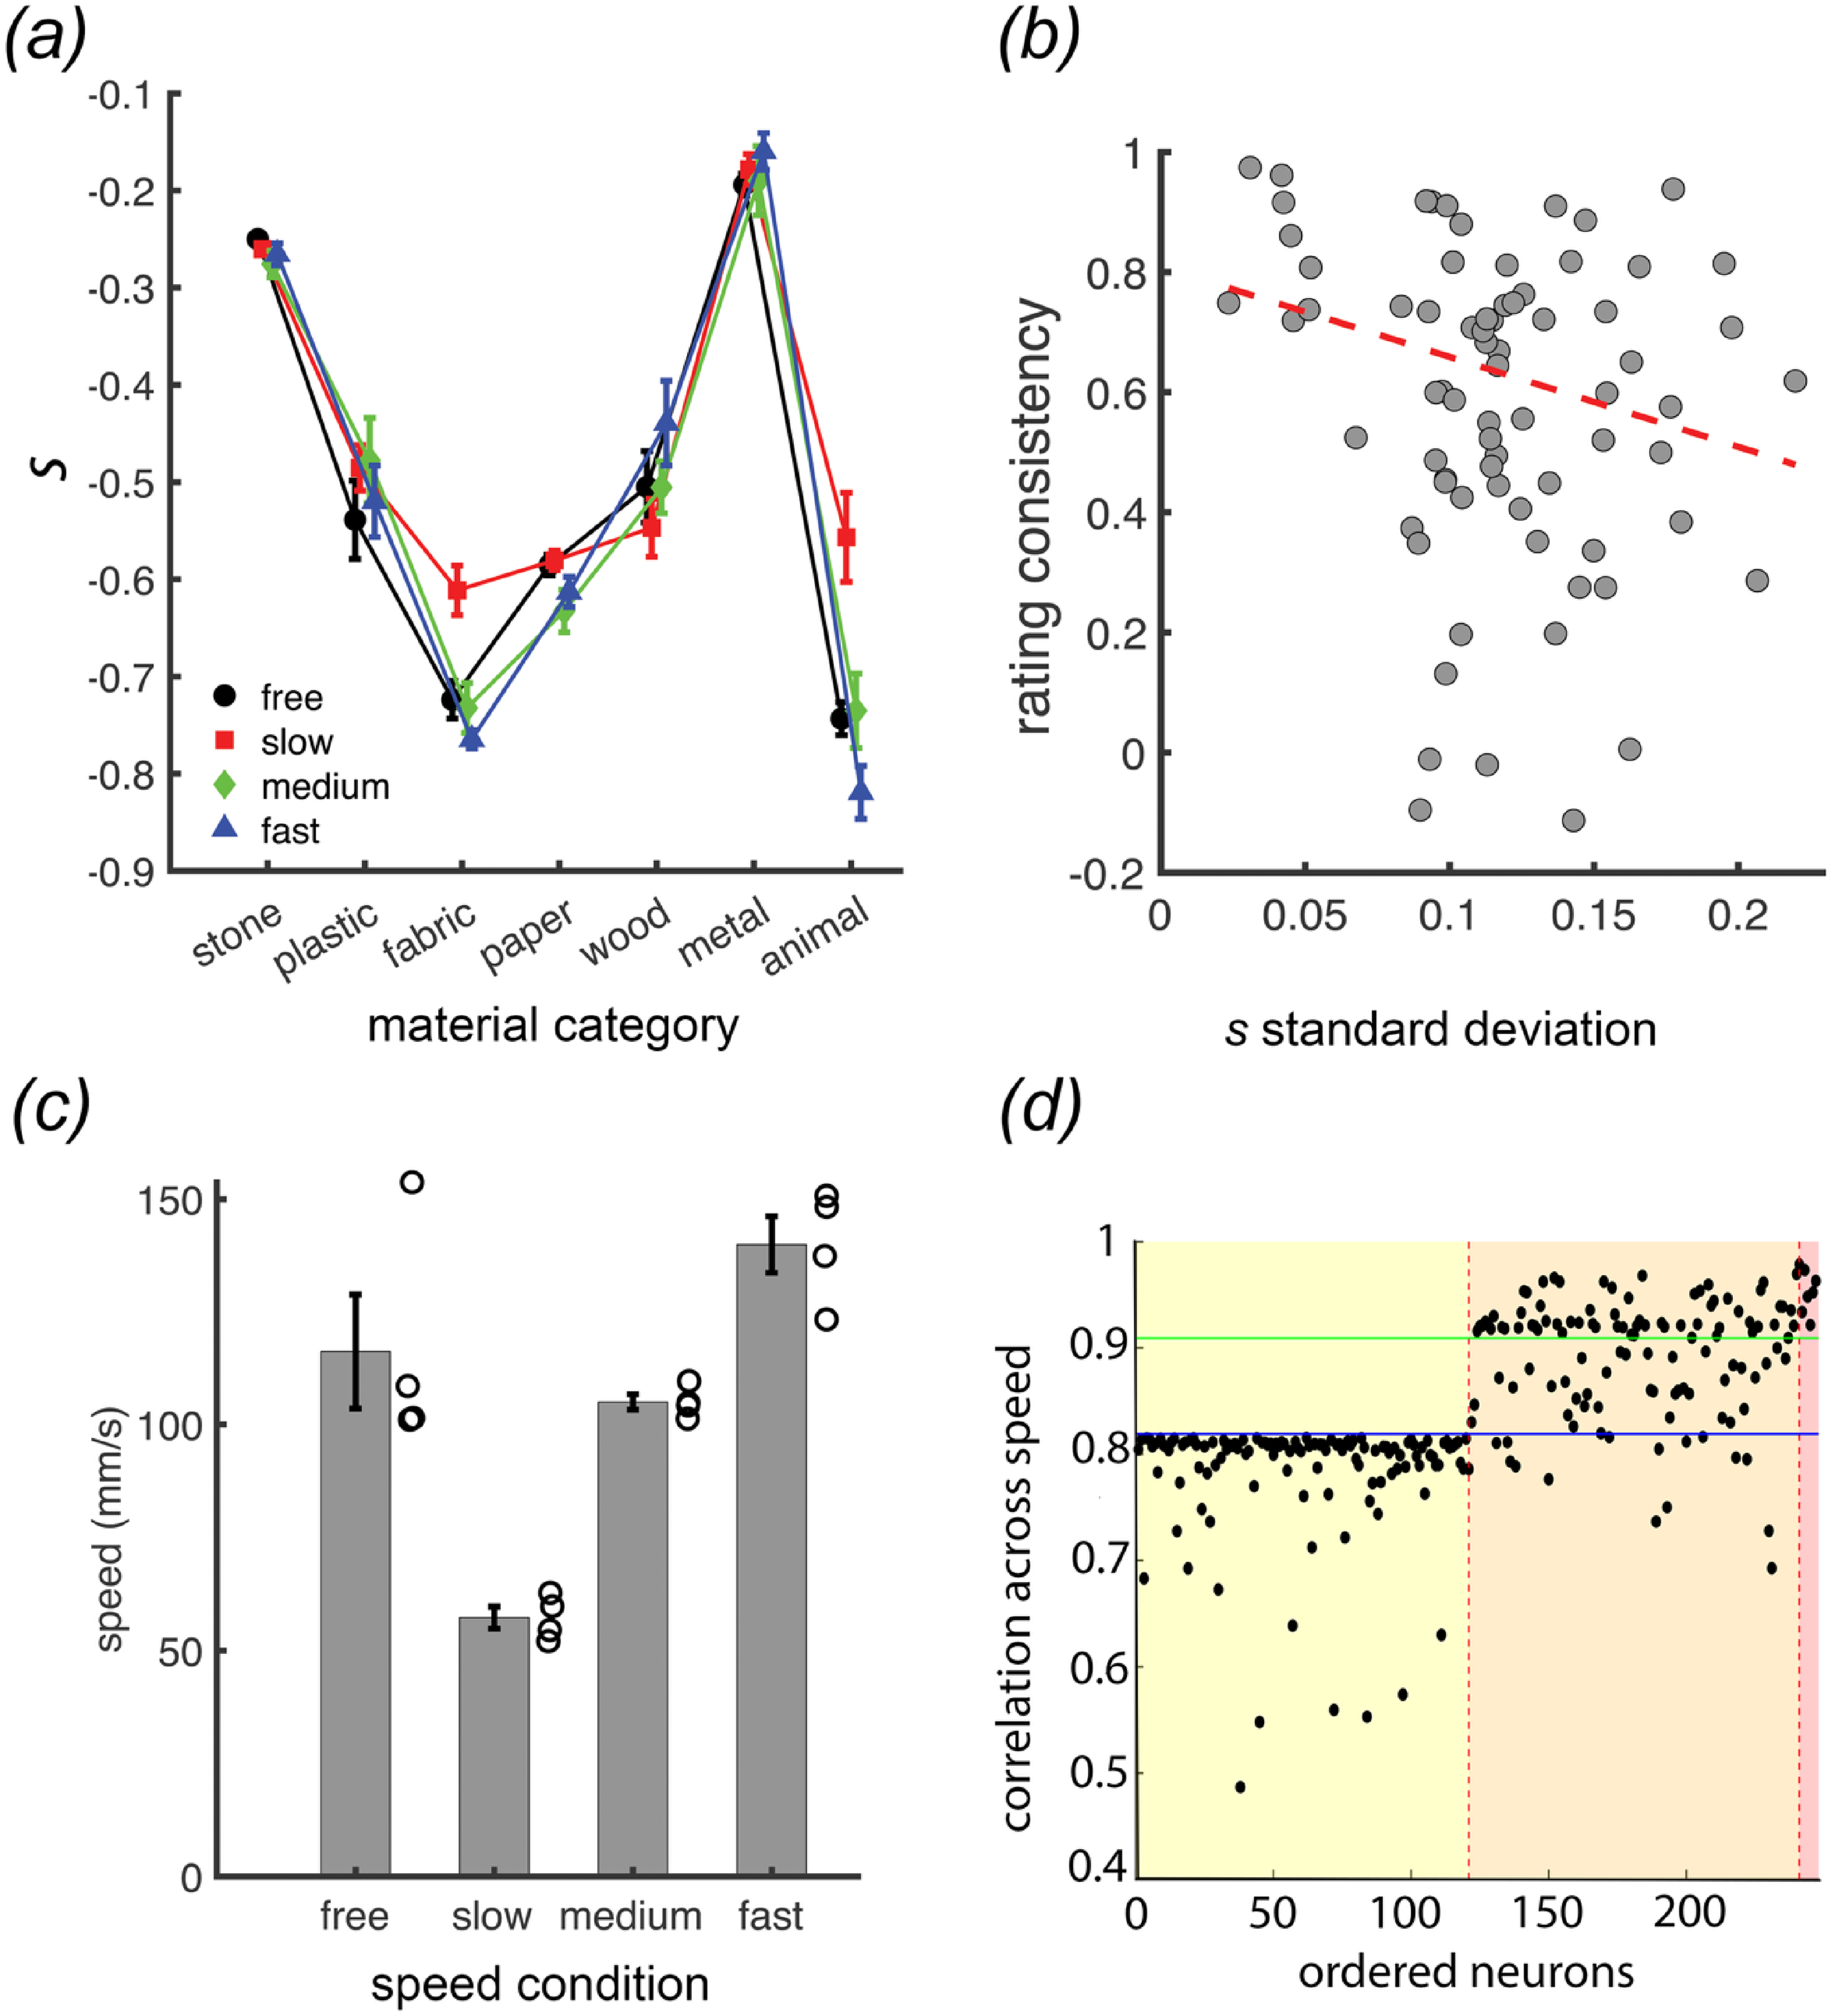
(a) Average slope s for each material category and speed level. (b) Rating consistency as a function of s standard deviation. (c) Average exploration speed as a function of instructed speed level. (d) Correlation of neuron activation in the LSTM network across speed. The yellow area (first section) represents the feedforward neurons, the orange (second section) the feedback neurons, and the red (last section) the dense layer neurons. Each point represents the correlation for one neuron. The horizontal green (upper) line represents the correlation for s, the blue (lower) line for the Fourier spectrum.
The classification analysis confirms that speed level classification is close to chance and significantly lower than material category classification. Material category classification was reliably above chance (raw accuracy = 22.8%, chance = 14.29%; corrected accuracy K = 0.10, 95% CI [0.095, 0.218]), whereas exploration speed classification was not (raw accuracy = 25.5%, chance = 25%; corrected accuracy K = 0.007, 95% CI [−0.045, 0.061]). The confidence intervals for the two corrected accuracies did not overlap, and a bootstrap test of the difference yielded a 95% CI of [0.064, 0.227], confirming a statistically significant difference. These results converge with the ANOVA findings and reinforce the conclusion that material category, but not exploration speed, is robustly reflected in the s statistic.
We performed an additional analysis to test whether perceptual speed constancy is driven by slope. The rationale was that, if perception is driven by slope, then greater variability in slope across speeds (as indeed occurs to some extent) should lead to greater variability in perceptual ratings, that is, lower correlation across speed levels. For each material and participant, we therefore computed the consistency of perceptual ratings across speeds. Specifically, we considered all pairs of controlled speeds (the three combinations of slow, medium, and high) and computed the correlation across rating scales for each pair. These correlations were then averaged across participants to obtain a single rating-consistency measure per sample.
For each sample, we also computed the standard deviation of slope across the three speed levels and the four participants. Finally, we correlated rating consistency with slope standard deviation.
Here, participants are treated as independent judges rather than as statistical observations, and the analysis is conducted with material samples as the units of observation. This approach assumes that ratings are consistent across participants. We verified this assumption by computing the intraclass correlation coefficient (ICC) to assess between-participant consistency (Shrout & Fleiss, 1979). With ICC = 0.91, we could conclude that the reliability of the ratings across participants was excellent (Koo & Li, 2016), indicating that averaging across participants yields stable material ratings.
Correlation analysis indicated that rating consistency was significantly correlated with slope standard deviation for each material sample and averaged across participants t(72) = −2.01, p < .05 (Figure 4b)—for materials for which slope changes less (as indicated by a small standard deviation of s across speed levels), participants exhibited higher speed constancy (rating consistency) and lower speed constancy for the ones for which slope changes more.
A repeated-measures ANOVA showed a significant difference in speed between experimental speed manipulations, F(2, 6) = 173.741, p < .001, η2 = .9. Post hoc multiple comparisons with Bonferroni correction showed that all differences are significant (all p-values < .001), confirming that participants did implement different exploration speeds: slow, medium, and fast (Figure 4c). Noteworthy, the free exploration speed lies close to the midpoint of the chosen values, which supports our selection of faster and slower speeds within the range motivated by previous research (Callier et al., 2014; Gamzu & Ahissar, 2001; Libouton et al., 2010; Morley et al., 1983; Smith et al., 2002; Tanaka et al., 2014).
After training the LSTM network for speed constant material classification, we correlated the activation of each unit (neuron) with itself across speed-levels by considering all combinations of the three speeds—the more speed constant, the higher the correlation. We repeated the correlation analysis with s and with the Fourier Spectrum. For the latter, we computed the correlations for the three combinations of speed for each of the bands of the frequency spectrum, then averaged. The correlation analysis with the Fourier spectrum is intended solely as a measure of how much each Fourier band varies across different speeds. This serves as a baseline to assess the extent to which the raw signals are speed constant.
The correlation for s (r = .91) was higher than the one for the Fourier spectrum (r = .82) (green/upper and blue/lower lines in Figure 4d, respectively). Crucially, the correlations for the feed-forward units (M = 0.78, SD = 0.09) were significantly lower than for the feedback units, t(238) = 12.18, p < .0001, and lower than for the dense layer units, t(125) = 5.46, p < .0001 (Figure 4d). Interestingly, the correlations for the feed-forward units were remarkably close to the one we obtained for the Fourier spectrum. Conversely, the correlation for the feedback units (M = 0.89, SD = 0.06) and for the dense layer units (M = 0.95, SD = 0.02), representing later stages of processing, were very similar to the one obtained for s. These results suggest that while the feedforward units primarily captured low-level properties of the signals and failed to develop a more speed constant representation, the feedback and dense layer units could do so. Moreover, the representations they captured are as speed constant as our s statistics.
Discussion
Vibratory signals from the exploration of materials constitute natural scenes for the haptic perceptual system (Manfredi et al., 2014). Similar to natural scenes in vision, they can be characterized by the slope s in the temporal frequency domain, which correlates with perceptual ratings (Toscani & Metzger, 2022). Here we show that being a measure of relative frequency composition, s is mostly constant across natural exploration speed and explains higher perceptual variability where it is less constant. Additionally, a neural network trained for speed constant material classification achieves a similarly high level of speed constancy as the s statistics at later stages of processing, suggesting computing s a plausible mechanism for speed constancy.
Speed constancy can, in principle, be achieved by estimating the scanning speed from the global shift of the spectral distribution and adjusting each spectral component accordingly. However, this implementation relies on a reliable estimate of speed, which poses a chicken-and-egg problem: estimating speed may require prior knowledge or assumptions about the surface properties. Moreover, empirical data show that human participants are generally poor at estimating the speed of sliding over fine textures (Dépeault et al., 2008).
Alternatively, it has been proposed that speed constancy is achieved through a mechanism similar to how the auditory system maintains timbre invariance. Although changes in scanning speed shift the frequency content of neural responses to textures, the underlying harmonic structure remains largely stable (Manfredi et al., 2014). It is possible that the brain extracts this stable harmonic pattern in a way that does not depend on speed, thereby enabling speed constant texture representation (Saal et al., 2016; Yau et al., 2009). Crucially, the spectral slope has been proposed as one of the physical correlates of perceived timbre, alongside other measures of relative spectral composition—such as the ratio of the fundamental frequency of a tone to the centroid of the spectral distribution (McAdams, 2019). Furthermore, multisensory interaction effects such as the Parchment-Skin Illusion demonstrate that the frequency content of acoustic stimulation can influence tactile perception (Jousmäki & Hari, 1998). Additionally, auditory cortical neurons have been shown to respond to somatosensory stimulation (Fu et al., 2003), providing evidence for shared processing mechanisms between the two sensory systems. Interestingly, similar to our result, the spectral distributions of natural sounds follow the 1/fs shape (Attias & Schreiner, 1996), thus the spectral slope serves as an efficient measure of spectral structure for both acoustic and vibrotactile signals. Computing s provides an efficient and straightforward heuristic to infer the frequency composition that characterizes natural surfaces, without requiring an explicit estimate of speed. This approach aligns with theories and empirical evidence from vision research suggesting that rather than explicitly estimating all contributing factors to sensory input, the visual system relies on heuristics based on the statistical regularities of the natural environment to estimate relevant properties (Fleming, 2014), such as object lightness (Toscani et al., 2013, 2017, 2019) and surface gloss (Fleming et al., 2003).
Computation of s seems also a biologically plausible solution for speed constant material perception. In fact, RA afferents responds to relatively low temporal frequencies, whereas PC afferents responds to higher temporal frequencies. Crucially, the ratio between the RA and PC afferents' responses to our vibratory signals, simulated using the TouchSim toolbox (Saal et al., 2017), highly correlates with s (Toscani & Metzger, 2022).
Furthermore, we showed that the perceptual representation of haptically explored natural materials may be achieved by efficient encoding of the vibratory signals (Metzger & Toscani, 2022). Strikingly, efficient encoding produces a space that explains human material classification and resembles the activities of the RA and the PC afferents (Toscani & Metzger, 2022). In this compressed perceptual space, the different material categories mostly are scattered around a straight line, hence their position in the space can be characterized by the differential activity of these two afferents, providing information about the composition of the power spectrum of the tactile input. Crucially, while we analyze raw acceleration signals, we acknowledge that the sensory input is influenced by mechanic properties of the skin (e.g., Saal et al., 2017). In fact, the skin can be considered one operator in the transformation from the physical stimulus to higher-level representations. However, we do not attempt to model all such transformations. Our claim is that a simple statistic computed directly from the physical signal can provide a speed constant representation of material properties. We do not make any claims about how this representation is computed by the perceptual system, or about whether and how the skin contributes to this computation.
In the last decade, deep learning has become a framework for explaining how sensory input is transformed from simple, input-like features into more complex, perceptually relevant ones by learning to perform ecologically relevant tasks. Networks trained on object recognition exhibit properties similar to neuronal receptive fields, with early layers encoding simple features like edges, and later layers representing increasingly complex patterns related to object parts and shapes (Agrawal et al., 2014; Zeiler & Fergus, 2014). Similarly, the first layer of a network trained for object classification learned color-responsive features resembling the tuning of color-responsive cells in the primate thalamus, with chromatic and achromatic information were segregated in early layers (Flachot & Gegenfurtner, 2018), while deeper features exhibited sensitivity to hue, chroma, and color categories (de Vries et al., 2022; Flachot & Gegenfurtner, 2021).
We trained a network to recognize materials from vibrotactile signals, independently of varying exploratory speeds. In the early layers, the representations learned by the network exhibited the same degree of speed constancy as the Fourier spectrum. The learned representations in the later layers (the dense layer, the backward units, which emphasize structural or relative features in the signal) and are more speed constant, with a degree of speed constancy, strikingly similar to that exhibited by our s statistic. Recent work by Iskarous (2025) developed neuromorphic algorithms that transform tactile sensor readings into spike-based representations that are also invariant to scanning speed. In contrast, our study does not build biologically inspired spiking encodings or aim to mimic neural processing; rather, we showed that a network trained to recognize materials across different speeds naturally develops a representation consistent with the speed constant statistic s, we propose. This suggests that slope s is a feasible candidate for speed constancy and that a similar representation, or at least one with similar speed constancy, can be learned through material recognition.
Our results show that the spectral slope of the frequency distribution of vibrotactile signals is largely speed constant. It can differentiate material categories and correlates with the speed constancy observed in perceptual ratings. Furthermore, the degree of speed constancy exhibited by the spectral slope can be learned by a network trained to classify natural materials based on vibrotactile signals, independent of exploratory speed.
As shown by Lieber and Bensmaia (2020), many neurons in the somatosensory cortex exhibit clear modulation by scanning speed, while others show substantially greater invariance. This heterogeneity strongly suggests that speed-invariant representations are not inherited directly from the periphery, but instead emerge through population-level computations or transformations at later processing stages. Our results are consistent with this view: the raw vibratory signals and their absolute spectral components are speed dependent, yet a relative statistic—the spectral slope—remains largely stable across speeds for natural materials. Such a summary statistic of relative spectral composition can be computed from speed-dependent signals. In this sense, speed invariance does not require eliminating speed effects from neural responses, but instead exploiting regularities in how speed affects different frequency components. Changes in scanning speed largely induce a global shift of the spectral distribution, while preserving its relative shape for natural textures. Neurons sensitive to different temporal frequency bands (e.g., RA and PC afferents, and their cortical targets) will therefore remain speed modulated, yet their relative activation can remain stable. Our proposal is that perceptual constancy arises from such relative coding.
We speculate that the haptic system, rather than estimating and discounting speed, computes the spectral slope as the ratio of the responses of the RA and PC afferents and uses it as a speed-invariant representation of natural materials. Such a hypothesis aligns with recent theories (Fleming, 2017; Fleming & Storrs, 2019) proposing that perceptual systems do not need to explicitly estimate all factors contributing to sensory input; rather, perception operates heuristically based on statistical regularities in the physical environment.
Footnotes
Acknowledgments
We thank Bergeeta Naeem for collecting the data in the scope of her MSc thesis project.
Funding
The author(s) disclosed receipt of the following financial support for the research, authorship, and/or publication of this article: The research was supported by the British Academy's BA/Leverhulme Small Research Grants Programme (grant number SRG2324\240793).
Author Contribution(s)
Declaration of Conflicting Interests
The authors declared no potential conflicts of interest with respect to the research, authorship, and/or publication of this article.