
Abstract
Most familiar odours are complex mixtures of volatile molecules, which the olfactory system synthesizes into a perceptual whole. However, odours are rarely encountered in isolation and thus, the brain must also separate distinct odour objects from complex backgrounds. While in vision, individual differences in scene analysis have been widely reported, to date, little attention has been paid to the cognitive processes underlying this olfactory ability. The aim of the present study was to determine whether local processing performance in visual tasks predicts participants’ ability to identify component odours in multicomponent mixtures. Fifty-nine participants (F = 39), aged 16–55, completed two visual perception tasks, (Navon and Block Design), an odour-mixture task designed to test participants’ ability to identify multi-component odour objects in binary/ternary mixtures and the Autism Quotient (AQ) Questionnaire, which measures autistic traits in the general population. While performance indices on neither visual task, nor scores on the AQ, were associated with odour mixture task performance, there was moderate evidence to support an association between reaction time on the Navon task and binary odour mixture task performance. These results provide insight into the cognitive processes underpinning olfactory scene analysis and support previous reports that faster processing speed is associated with superior selective attention.
Introduction
Olfactory perception plays a significant role in human behaviour, contributing, for example, to flavour quality and supporting avoidance of potential dangers, such as smoke from a fire, or consumption of rotten foods (Boesveldt & Parma, 2021). Whilst olfactory research focusses largely on perception of mono-molecular odourants (Livermore & Laing, 1998; Luckett et al., 2020; Thomas-Danguin et al., 2014), real-world odours, such as the aroma of roasted coffee (Grosch, 2001) or red wine (Aznar et al., 2003), are complex mixtures of dozens, or even hundreds of different mono-molecules which the olfactory system synthesises into perceptual wholes, known as odour objects (Gottfried, 2010; Thomas-Danguin et al., 2014; Yeshurun & Sobel, 2010).
In olfactory processing, perception of an odour mixture is not simply an average of its components but results from interactions between odourants influenced by their individual quality and intensity (Laing et al., 1984). For example, odour blending can occur, where a composite scent has a quality that is distinct from its individual components (Atanasova et al., 2005; Laing & Willcox, 1983; Le Berre et al., 2010), while odour masking occurs when a dominant or stronger odour suppresses the perception of a weaker odour (Kay et al., 2005; Laing & Glemarec, 1992; Stevenson et al., 2007), and odour synergy describes a phenomena where the perceived quality of one odourant is enhanced by the presence of another (Miyazawa et al., 2008; Thomas-Danguin et al., 2014). As such, humans have difficulty identifying individual odours contained within the simplest of mixtures; performance declines rapidly with mixtures of more than three components (Laing & Francis, 1989; Le Berre et al., 2007) even in those with extensive training and experience (Livermore & Laing, 1996). This may reflect the notion that it is physiologically impossible for humans to process information from more than four odourants simultaneously (Laing & Francis, 1989) as competitive mechanisms result in an inhibition of olfactory receptors (Jinks & Laing, 1999) meaning odourants lose their typical character and instead, new combinatorial sensations are produced (Jinks & Laing 2001; Laing et al., 1994).
Humans’ inability to perceive the constitutive complexity of an odour object forms the basis of the prevailing belief that olfaction is a configural sense, in which mixtures of odourants are perceived as a unified (global) whole (Rokni & Murthy, 2014). While configural processing may play a crucial role in odour-object recognition, analytical (local) processing is required to segregate an odour of interest from a complex odourous background (Thomas-Danguin et al., 2014). This process relies on the brain's ability to extract fine-grained information about the structure and olfactory profiles of different odours (Stevenson & Attuquayefio, 2013) and is influenced by temporal dynamics as well as cognitive processes such as memory, attention and, emotion (Carlson et al., 2018).
Like olfactory scenes, visual scenes comprise global structures (e.g., a forest) made up of local parts (e.g., trees) (Gerlach & Poirel, 2018). While perception of global order involves a visual processing style attending to large regions of the visual field, perception of local order requires processing restricted to smaller, component structures that can be processed in isolation (Gerlach & Poirel, 2018; Neufeld et al., 2019; Van Der Hallen et al., 2015). For instance, when completing a wordsearch puzzle, individuals will adopt a local processing style in order to focus on the individual letters within the grid, rather than the grid as a whole. Typically, a significant global processing bias is seen in the general population, known as the ‘global precedence effect’ where, for example, people are faster to identify global than local features of hierarchical visual stimuli (Navon, 1977). However, this global bias isn’t universally observed and both state and trait factors have been shown to influence processing of visual objects and scenes (de Groot et al., 2015; Gasper & Clore 2002; Neufeld et al., 2019). For example, changes in affective state can influence processing style, with negative affect associated with enhanced local (Fredrickson & Branigan, 2005; Gasper, 2004; Gasper & Clore, 2002) and positive affect with enhanced global processing (de Groot et al., 2015). Additionally, a stable bias for local visual processing has frequently been observed in autistic individuals and those with a higher level of autistic traits (Happé & Booth, 2008; Koldewyn et al., 2013; Neufeld et al., 2019).
The distinction between processing of global and local features of a scene is consistent across sensory modalities (Bouvet et al., 2011) and it has been argued that common perceptual and psychological mechanisms underpin them (Bouvet et al., 2011; Ivry & Robertson, 1998). Global processing biases have been observed in audition too (Bouvet et al., 2011; Ouimet et al., 2012; Schiavetto et al., 1999) with, for example, faster identification of differences in pitch pattern when they were reflected in the global melody rather than the local, triplet structure (Ouimet et al., 2012). Similarly, global/local processing biases have been identified in the tactile domain, with faster recognition of large configurations than small details (Heller & Clyburn, 1993; Puspitawati et al., 2013). Direct evidence that domain general processes underpin these effects comes from a study reporting a correlation between individual global-local processing styles in visual and auditory tasks (Bouvet et al., 2011). Additionally, neuropsychological studies of patients indicate damage to the left or right hemisphere is associated with impairment in the identification of global or local forms respectively. A dissociation which is observed in both visual (Lamb et al., 1990) and auditory tasks (Peretz et al., 1990), indicative of overlapping neural mechanisms across modalities. Furthermore, cross-modal carry-over effects have been reported with the processing style in one sensory domain induced by instruction to attend to either the local or global features of stimuli presented in another domain (Lewis et al., 2009; Mirams et al., 2016). For example, instruction to focus on the local features of vibro-tactile stimuli result in reduced global precedence during subsequent performance of a NAVON task (Mirams et al., 2016). Meanwhile, participants’ ability to accurately identify a previously tasted wine from among three options, a task which primarily relies on comparison of their aromas, declined following completion of a NAVON task where attention was focused on local in comparison to global detail (Lewis et al., 2009). This finding was interpreted as reflecting a shift from configural processing of the wine's aroma at encoding to analytical processing at the recognition phase which impaired task performance.
Consistent with reports in visual and auditory tasks, autistic children, and adults with high levels of autistic traits, have been reported to show superior ability at detecting odour objects within a complex mixture (Walker et al., 2020), indicative of superior local processing. However, it is unclear whether the perceptual processes required to dissembed odour objects from complex odour backgrounds are domain general and overlap with more widely used tasks of visual perception. Thus, the aim of the current study was to obtain further insight into the cognitive processes underlying olfactory scene analysis by determining whether ability to identify odour objects against a complex background is predicted by a visual perceptual style. Factor analyses have determined that different visual measures of local-global processing tap slightly differing constructs (Milne & Szczerbinski, 2009). Therefore, for the purposes of this study, the Block Design and NAVON task were included as measures dissembedding and global bias respectively (Milne & Szczerbinski, 2009). It is hypothesised that individuals who display superior local level processing on visual tasks will be better at identifying multicomponent odour objects in both binary and ternary mixtures. Further, consistent with previous literature (Plaisted et al., 1999; Shah & Frith, 1993; Walker et al., 2020), it is expected that higher levels of self-reported autistic traits will be associated with superior local processing in both visual and olfactory tasks.
Materials and Methods
Participants
Fifty-nine participants (39 Female) aged 16–55 (M = 26.07, SD = 8.48) took part in the study. They were recruited from the student population at Liverpool John Moores University. Additionally, the Psychology Research Participant Panel was used to recruit participants from the wider public. Individuals were excluded from participating if they had a cold, respiratory infection, or any known olfactory dysfunction. All participants had normal or corrected-to-normal vision. The experimental protocol was approved by the Ethics Committee at Liverpool John Moores University (18/NSP/049). Participants received a £10 shopping voucher to thank them for their time.
Power analysis conducted using G-power version 3.1.9.7 (Faul et al., 2007) showed that a sample size of 59 is sufficient to detect a medium effect size (Cohen's 1988 criteria), with an alpha of 0.05 and power = 0.75 using bivariate correlation analysis to test a one-tailed hypothesis.
Design
A correlational design was utilised to assess the association between:
Performance on the two Visual Tasks (Navon, Block Design) and Odour Task performance (Identification, Binary and Ternary mixtures). Scores on the Autism Quotient (AQ) and performance on the two Visual Tasks (Navon, Block Design) and Odour Task performance (Identification, Binary and Ternary mixtures).
Materials
The Navon task
A timed letter identification task in which large letters constructed from a number of smaller letters are presented (Figure 1) – the global (large) and the local (small) letters were either Congruent (e.g., global S, local Ss or global H, local Hs) or Incongruent (e.g., global H, local Ss or global S, local Hs). During a given block, participants were instructed to respond to either the large (global trials) or small letters (local trials) while ignoring the other type.
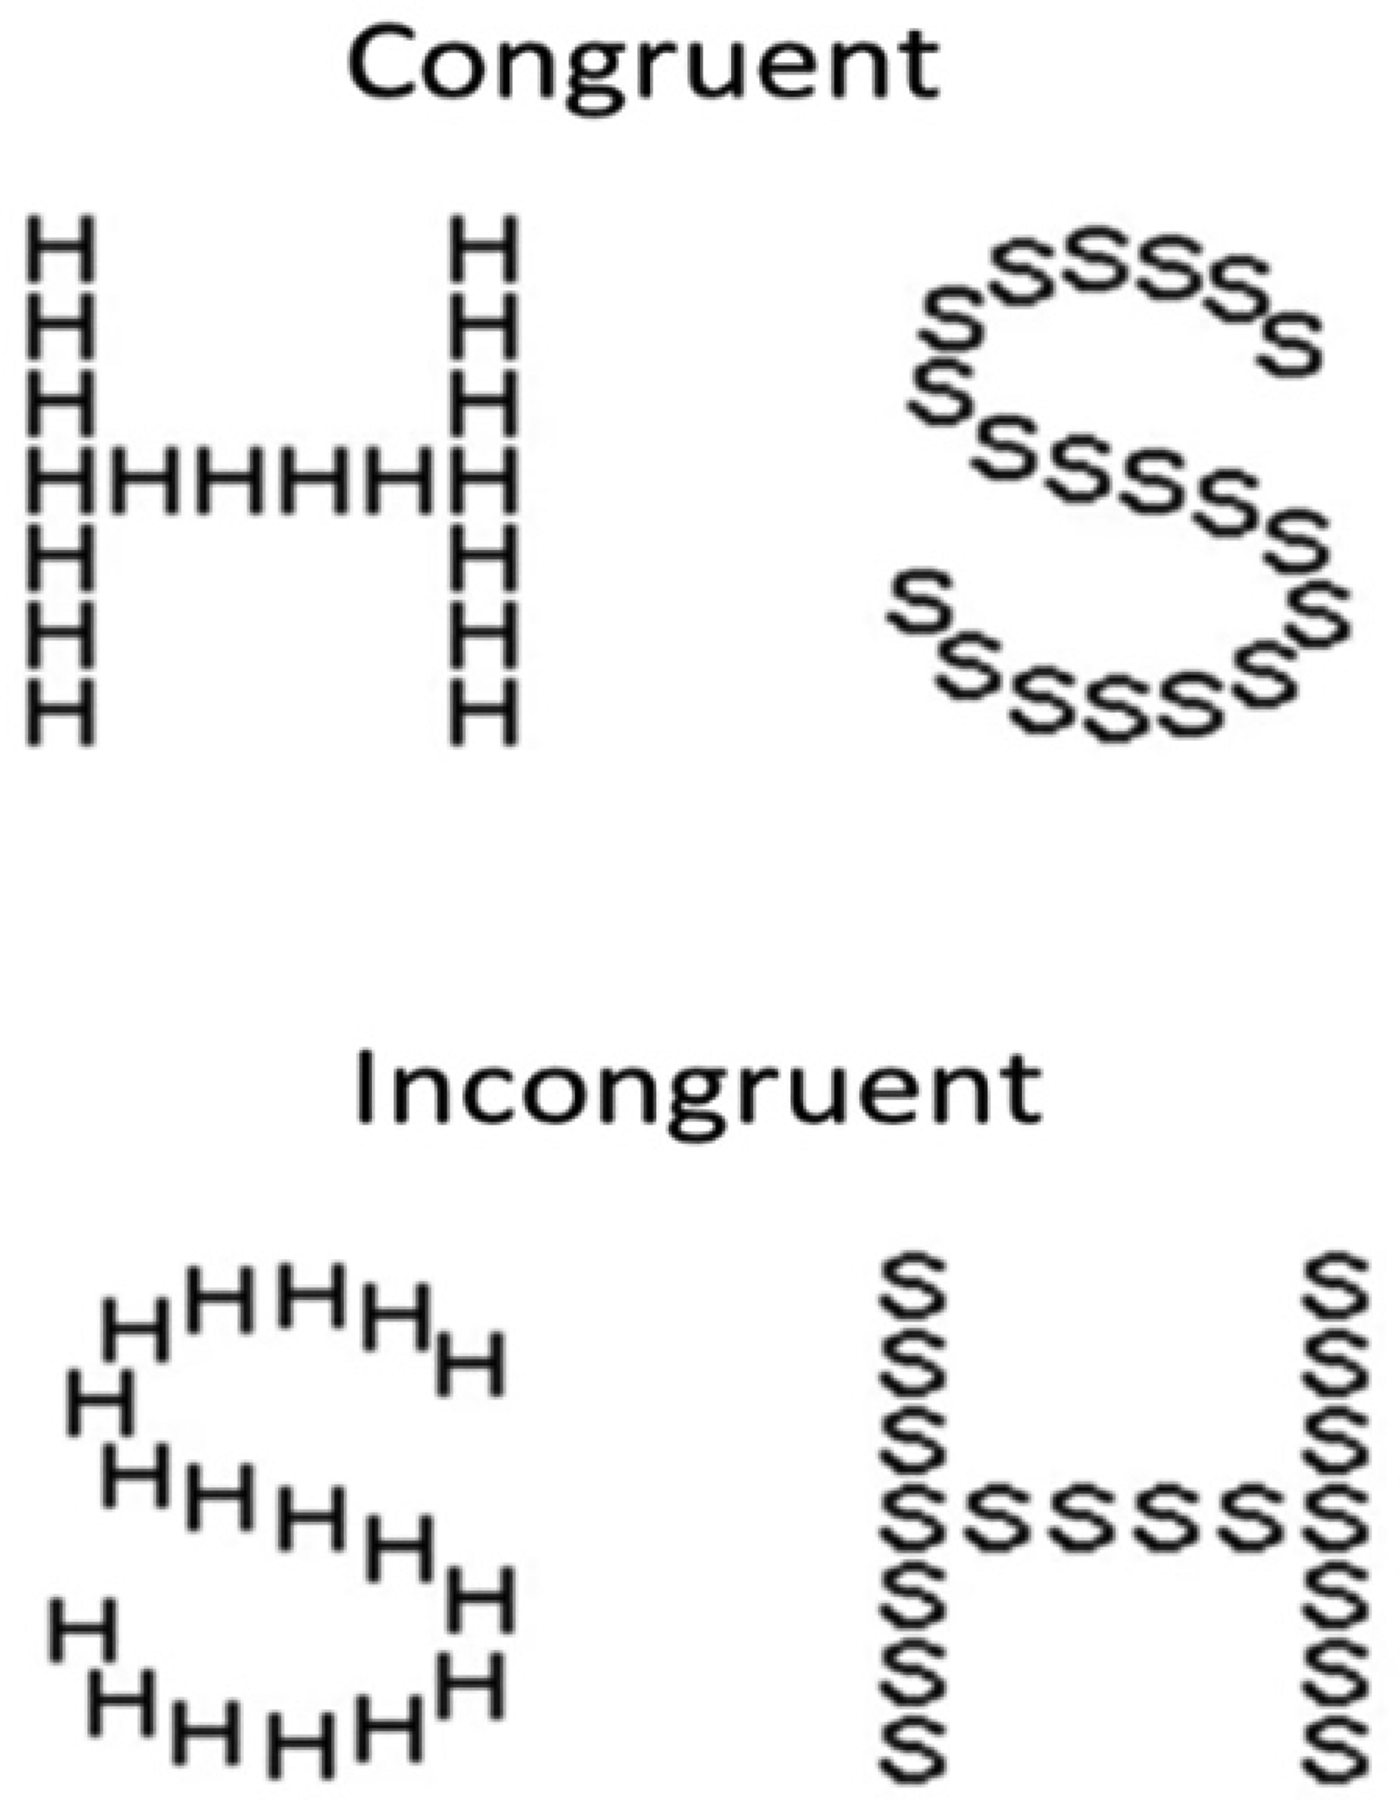
Illustration of the four stimulus types from the Navon task. Trials are equally split into global (identify the large letter) and local (identify the small letter) trials, with equal presentations of Congruent and Incongruent stimuli.
Participants completed eight blocks of 16 trials, with four blocks requiring the identification of the local letter and four blocks requiring identification of the global letter. Presentation of blocks was randomised to avoid any order effects, and each block consisted of eight congruent stimuli (where there was no interference) and eight incongruent stimuli (where the H was presented at one level and the S at the other).
Participants were informed that they would be presented with a series of large letters composed of small letters and on successive blocks, they were instructed to identify either the large or small letter presented during that block. As shown in Figure 2, each trial started with a fixation cross, presented in the centre of the screen for 500 ms, followed by a stimulus screen presented for 40 ms, and then a mask screen, which remained on the screen until participants made a response using the S or H keys on a keyboard. Following their response there was a 300 ms intertrial interval. Prior to starting the task, participants were instructed ‘please respond as quickly and as accurately as possible on each trial, using the S or H keys on a keyboard to identify the target letter’.
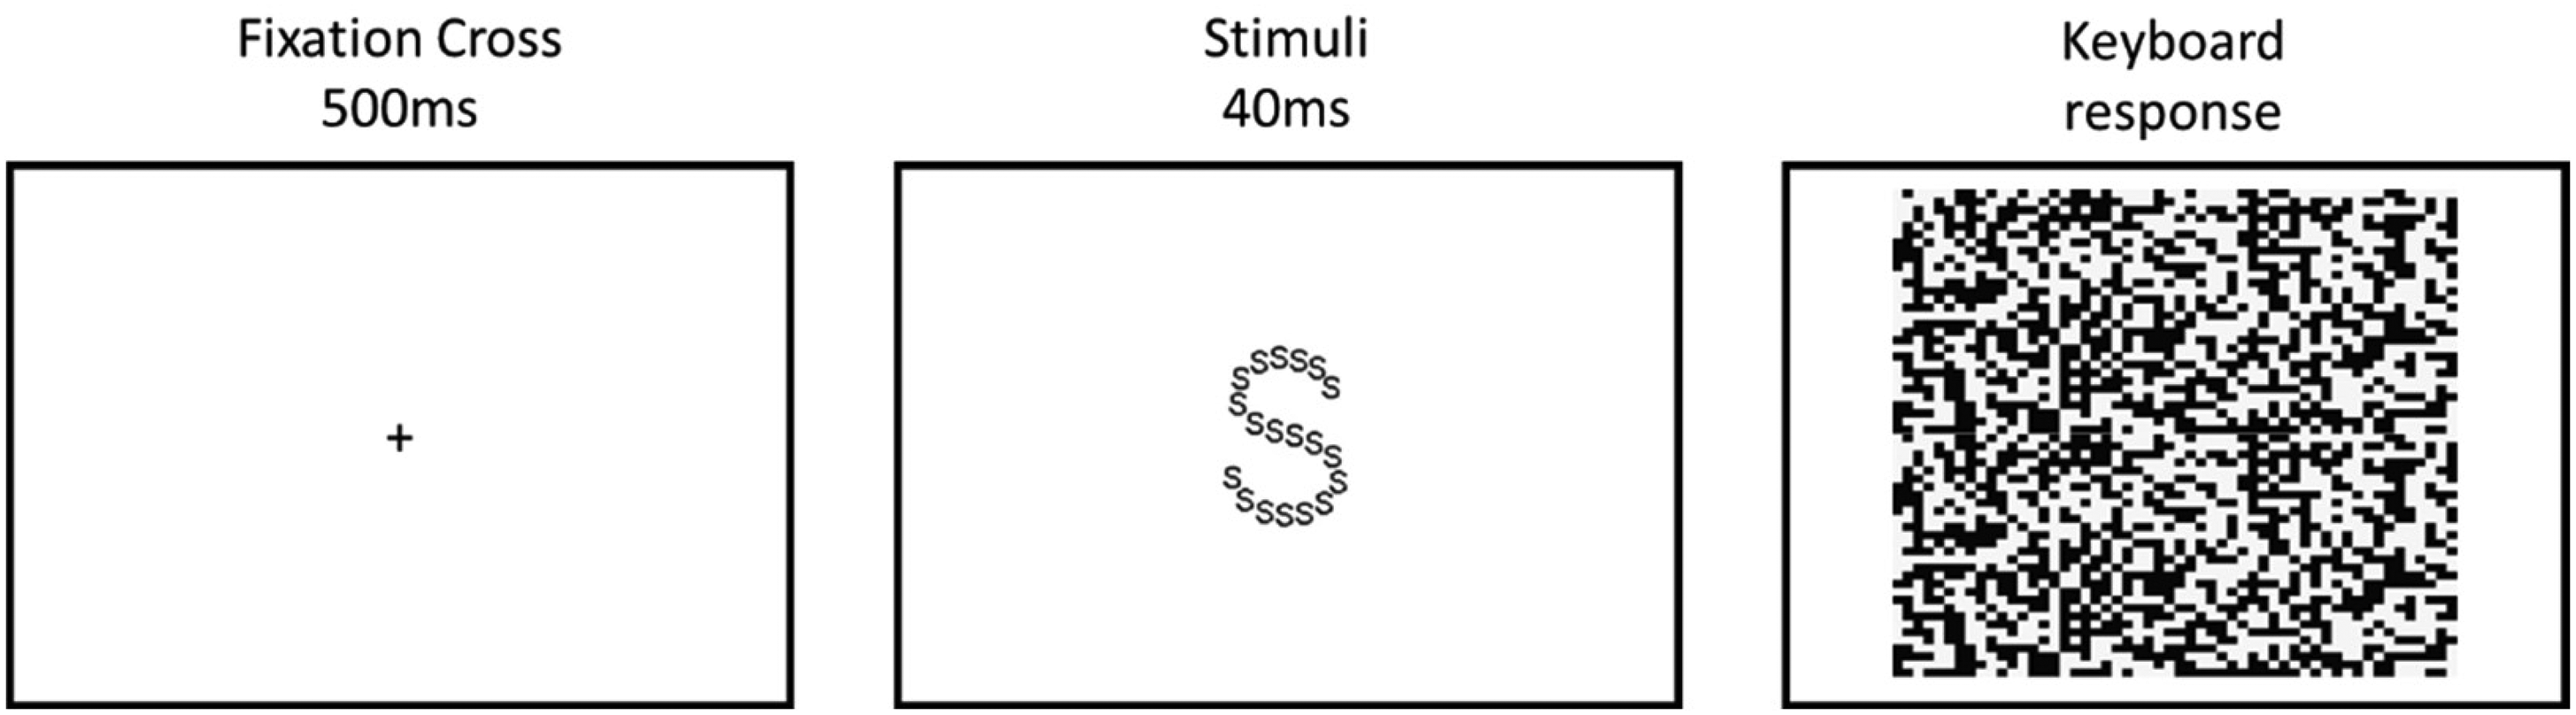
An example trial from the Navon task, in which participants are presented with a fixation cross, a stimulus screen and a mask screen.
Visual perception depends on the integration of local elements of a visual scene into a global frame, with two indices being widely measured; the Global Precedence Effect, which reflects faster processing of Global compared with Local trials, and the Global Interference Effect which reflects greater interference of global information on local trials.
Block Design Task
A subtest from the Wechsler Adult Intelligence Scale-Third Edition (WAIS-III) or Wechsler Adult Intelligence Scale-Revised (WAIS-R) is a cognitive assessment tool often used to measure spatial intelligence and local attentional abilities (Kohs, 1920). This task requires the replication of presented red and white designs using three-dimensional coloured blocks. Participants are presented with a set of identical cubes, each of which has two red, two white and two diagonally striped faces (Figure 3). There are 9 block designs to complete in the test. On each trial, participants are presented with an image of a 2D design, which they are asked to replicate using the cubes. The number of cubes required to recreate the design increases incrementally as trials progress, from either 4 or 9. Participants are given 60 s to complete each of the designs 1–4, which use four blocks, and 120 s for designs 5–9, which use nine blocks. Scoring is based on both accuracy and speed, with points being awarded for each correctly completed design, and additional points given for faster completion within the specified time frame. The task scoring method follows the age-based norms established by Wechsler, which standardise scores from raw scores according to performance.
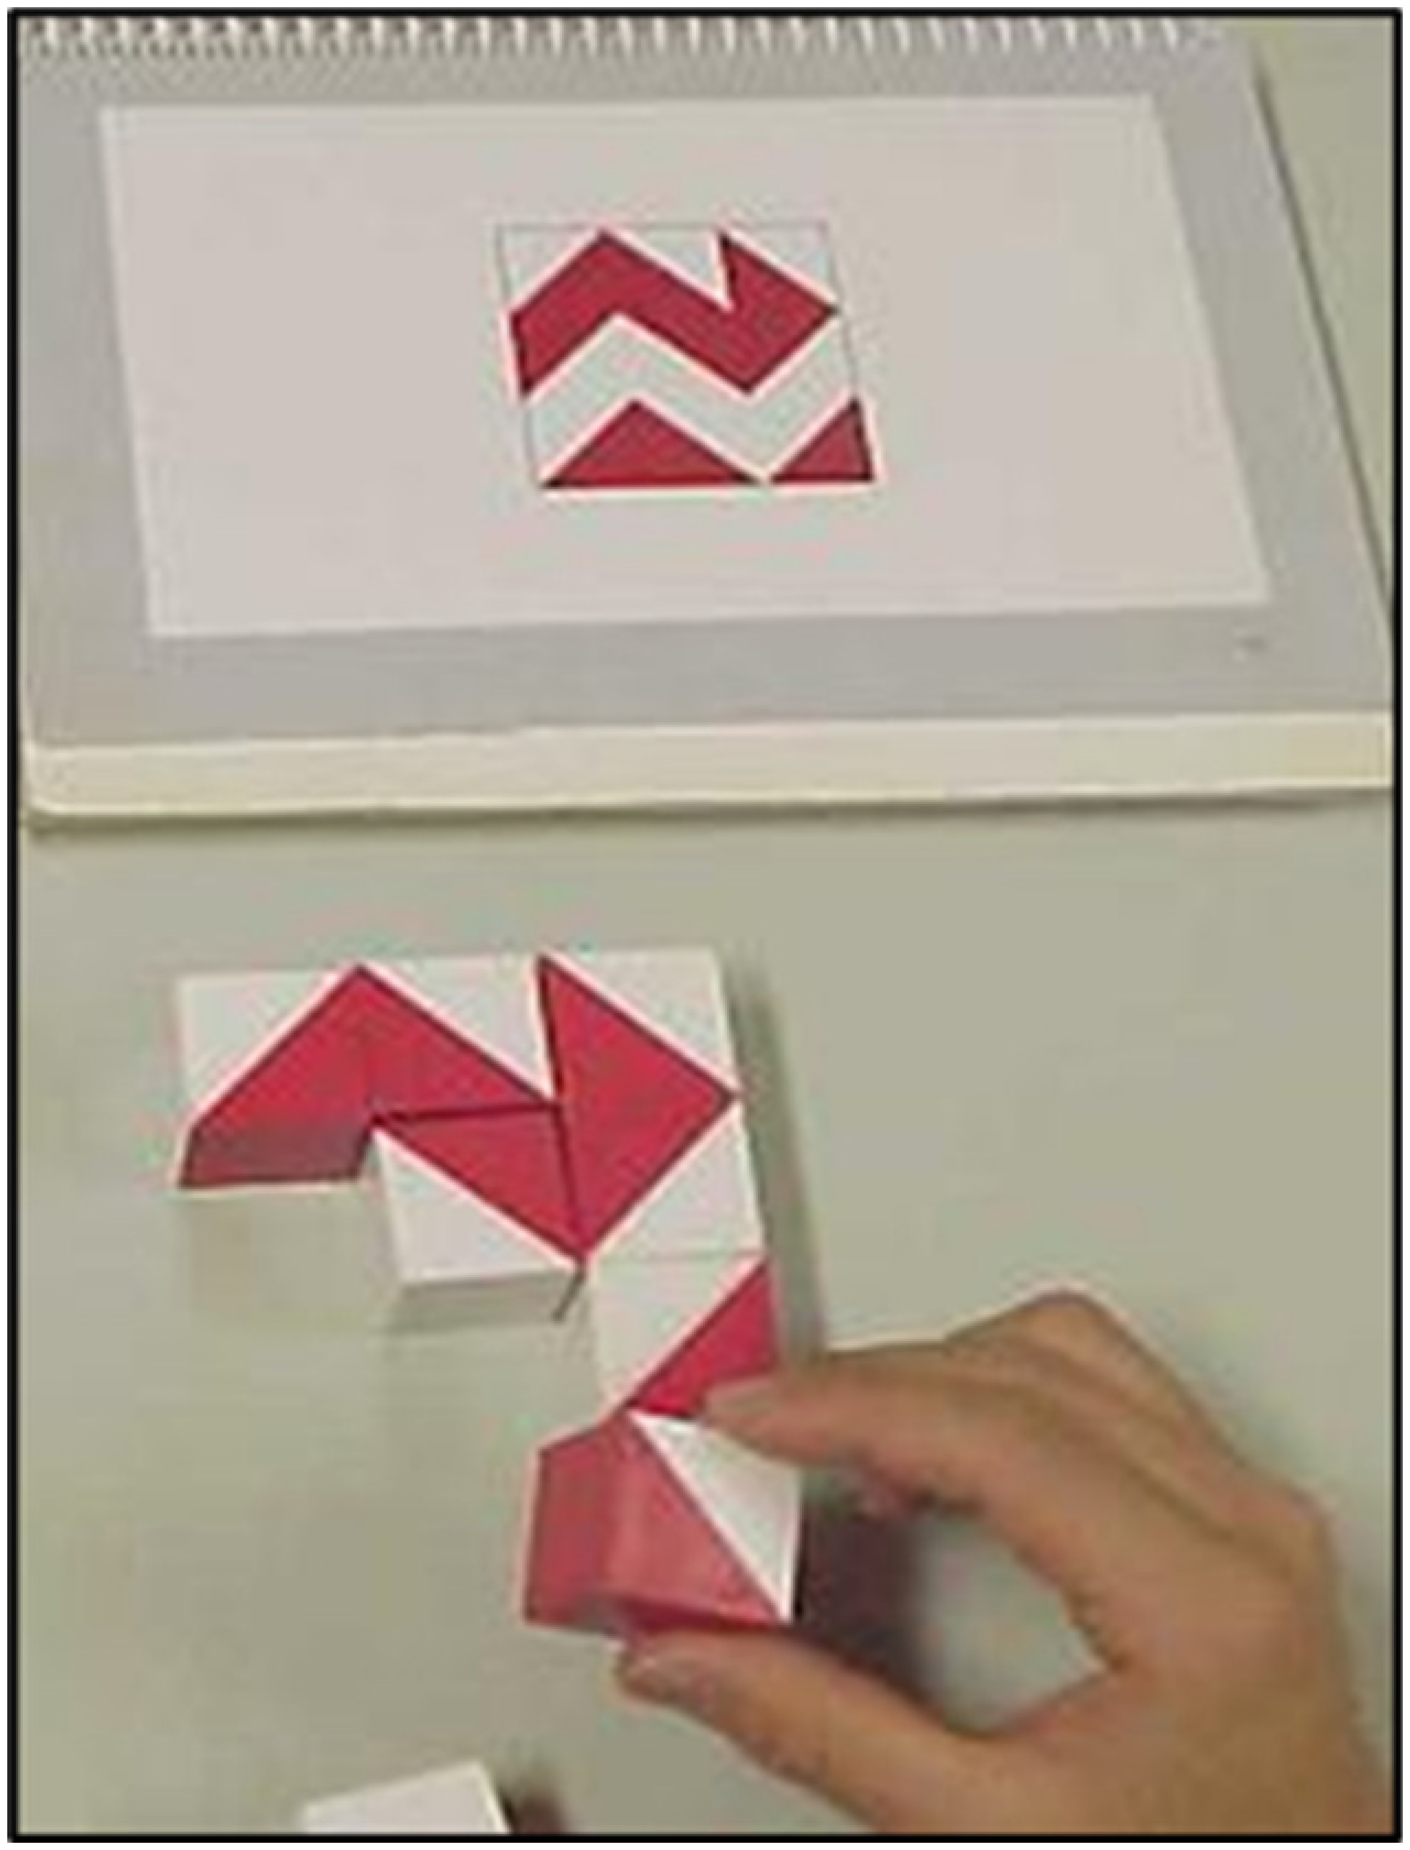
Illustration of the Block Design task, in which individuals are required to replicate 2D patterns using 3D blocks.
Odour Identification Task
Participants were asked to identify each of the six individual odours. Stimuli were presented in one of two orders, as shown in Table 1, and were split across participants (Order 1: n = 29, Order 2: n = 30). On each trial, the participant was asked to smell the contents of the jar and using the corresponding card, select which of four pictures best represented the odour presented (Figure 4a). If a participant gave an incorrect answer, they were informed of the correct answer. All participants completed this part of the task twice to ensure that they were able to accurately identify all the individual stimuli on the second attempt. Thus, all participants were considered to have adequate olfactory function to complete the task. See Supplemental material for summary of identification performance for individual odours.
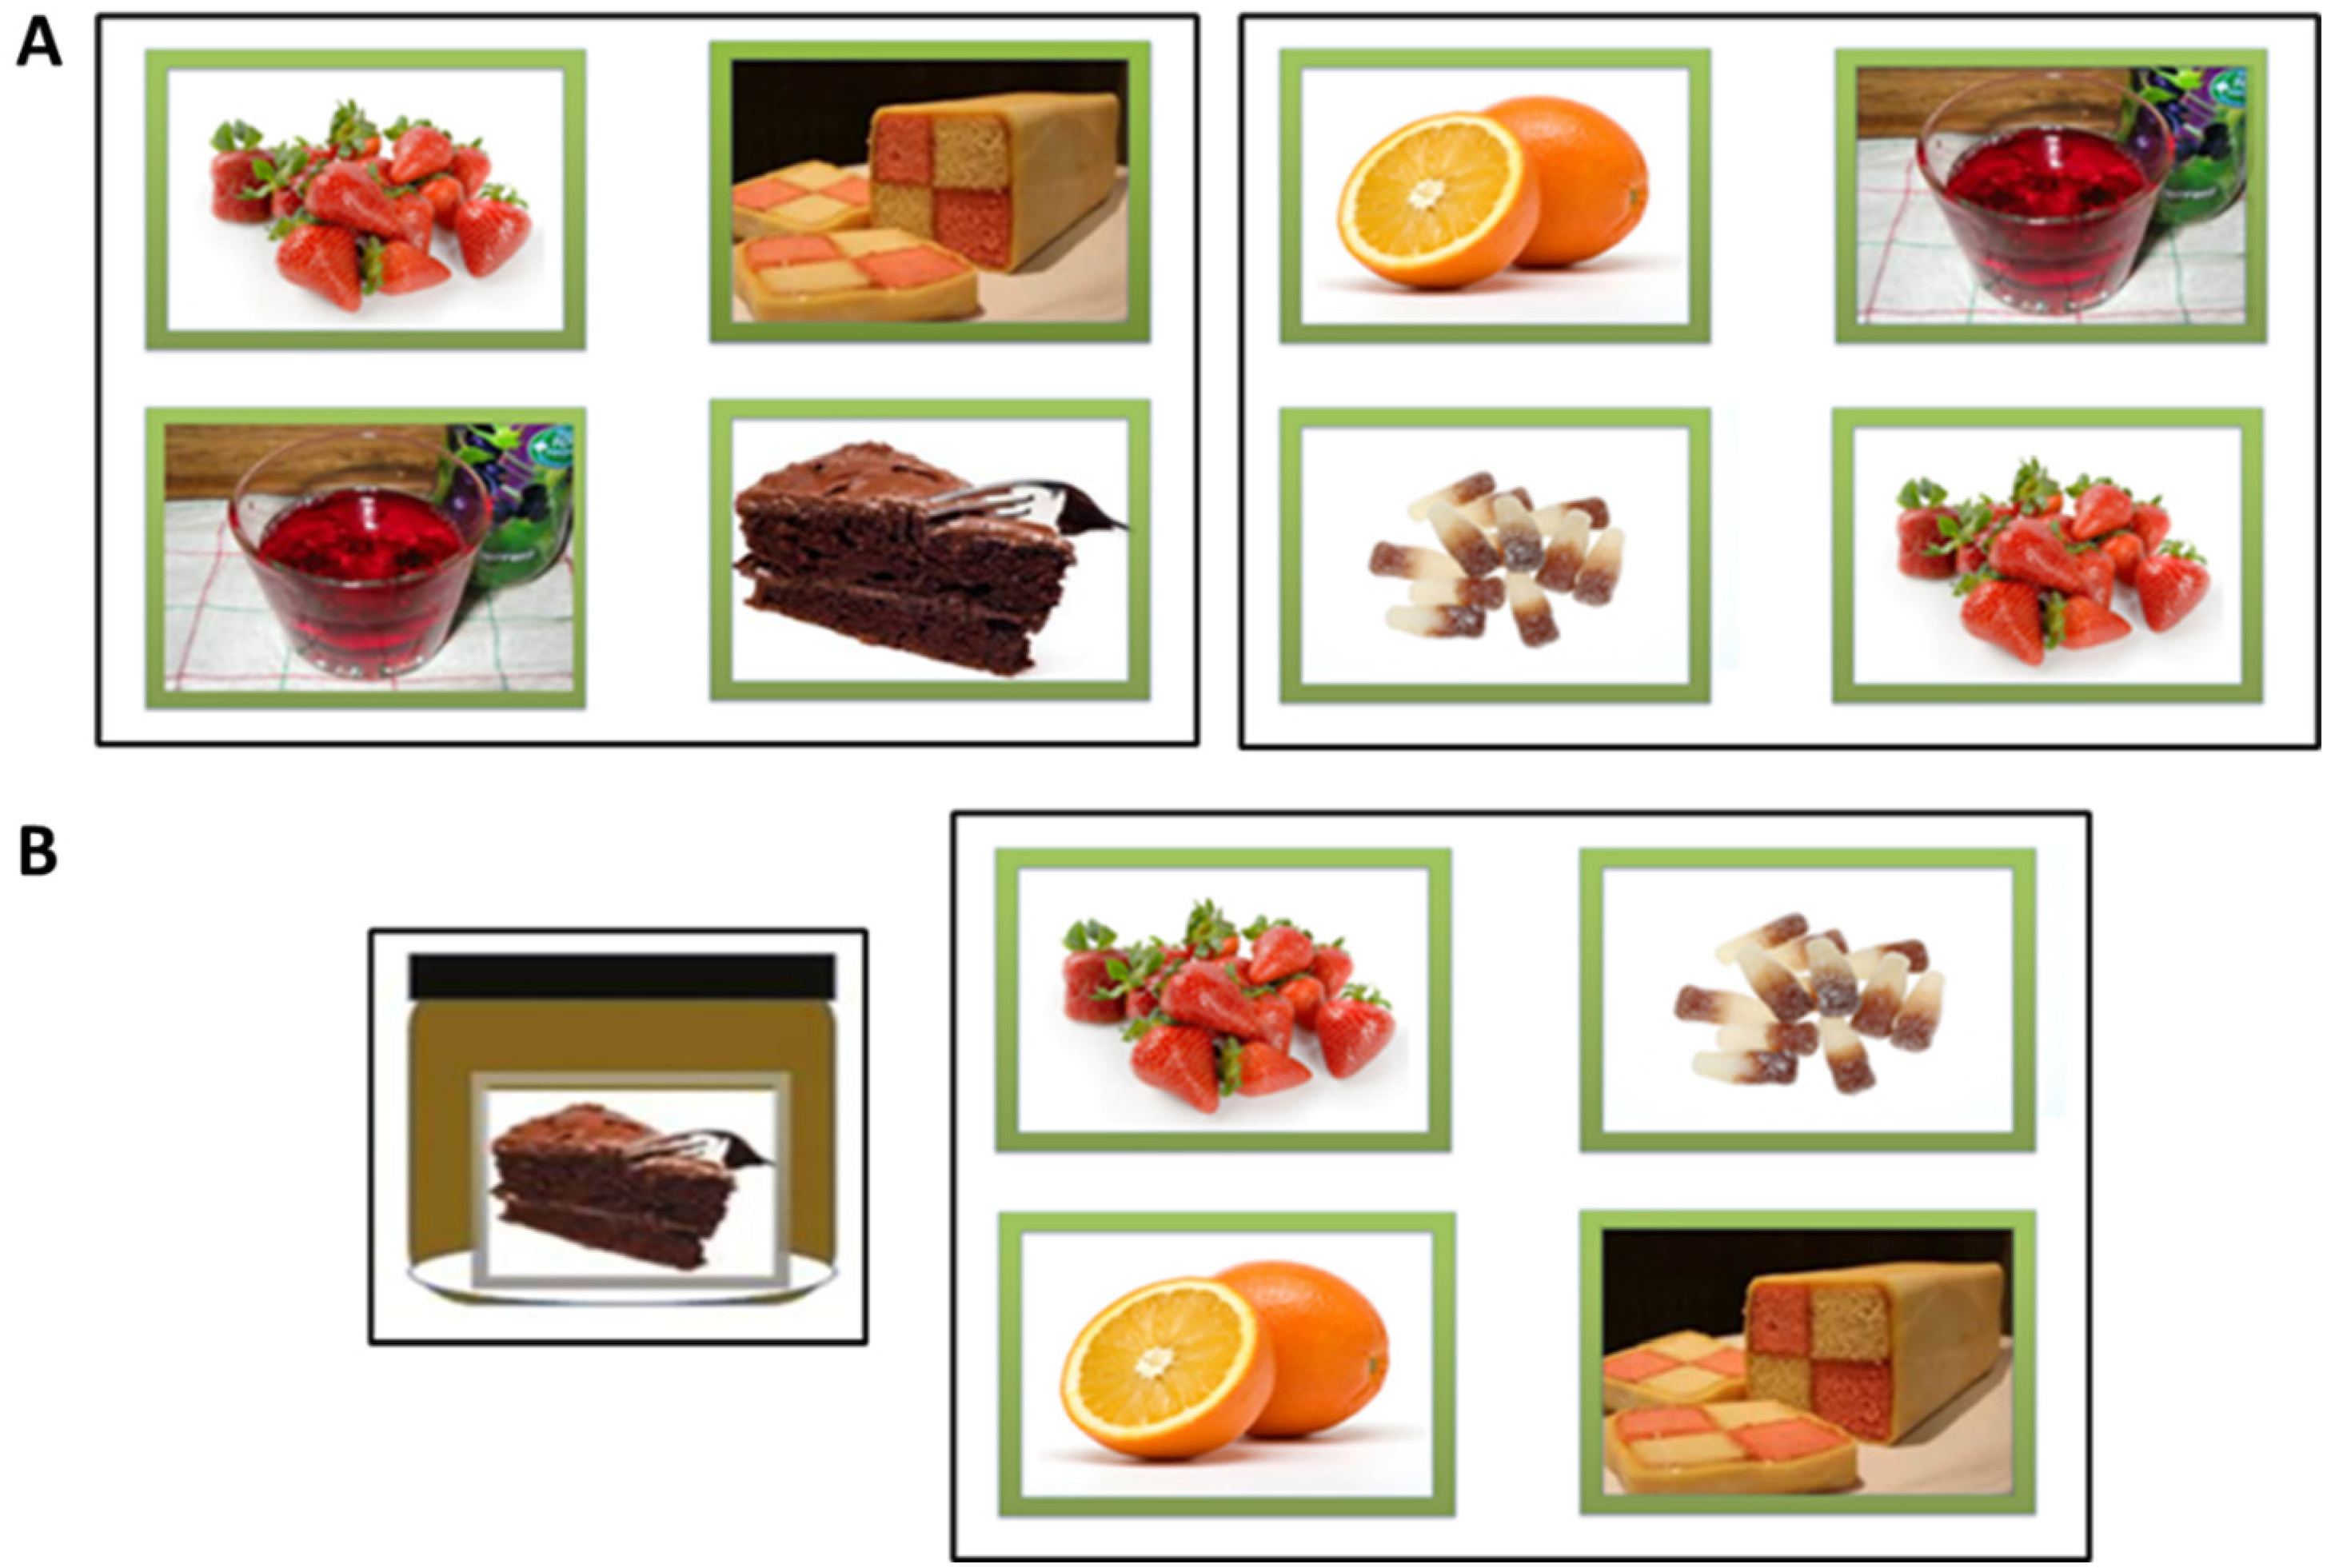
(A) Two example cards that were used to represent the six food odours. (B) An exemplar Binary mixture trial. Here, participants were told that there was chocolate cake in the jar and had to identify which one of the four options presented was also ‘hidden’ in there.
The contents of each jar during the identification phase.
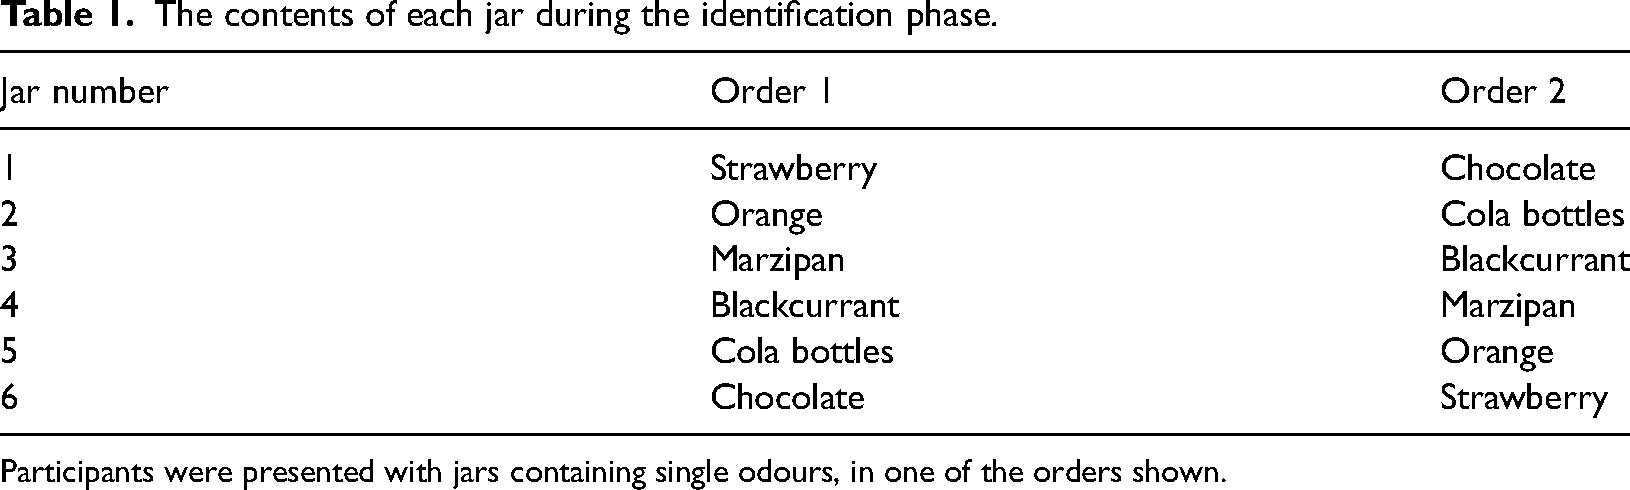
Participants were presented with jars containing single odours, in one of the orders shown.
Binary and Ternary Mixtures Task
For both the Binary and Ternary mixture trials, participants were asked to identify component odours within a mixture. In both phases, trials were completed in one of four orders – the two orders shown in Table 2, which were both also presented in reverse order. See Supplemental material for analysis of effects of target odour identity on binary and ternary mixture performance.
Stimuli within each phase were presented in one of four orders.
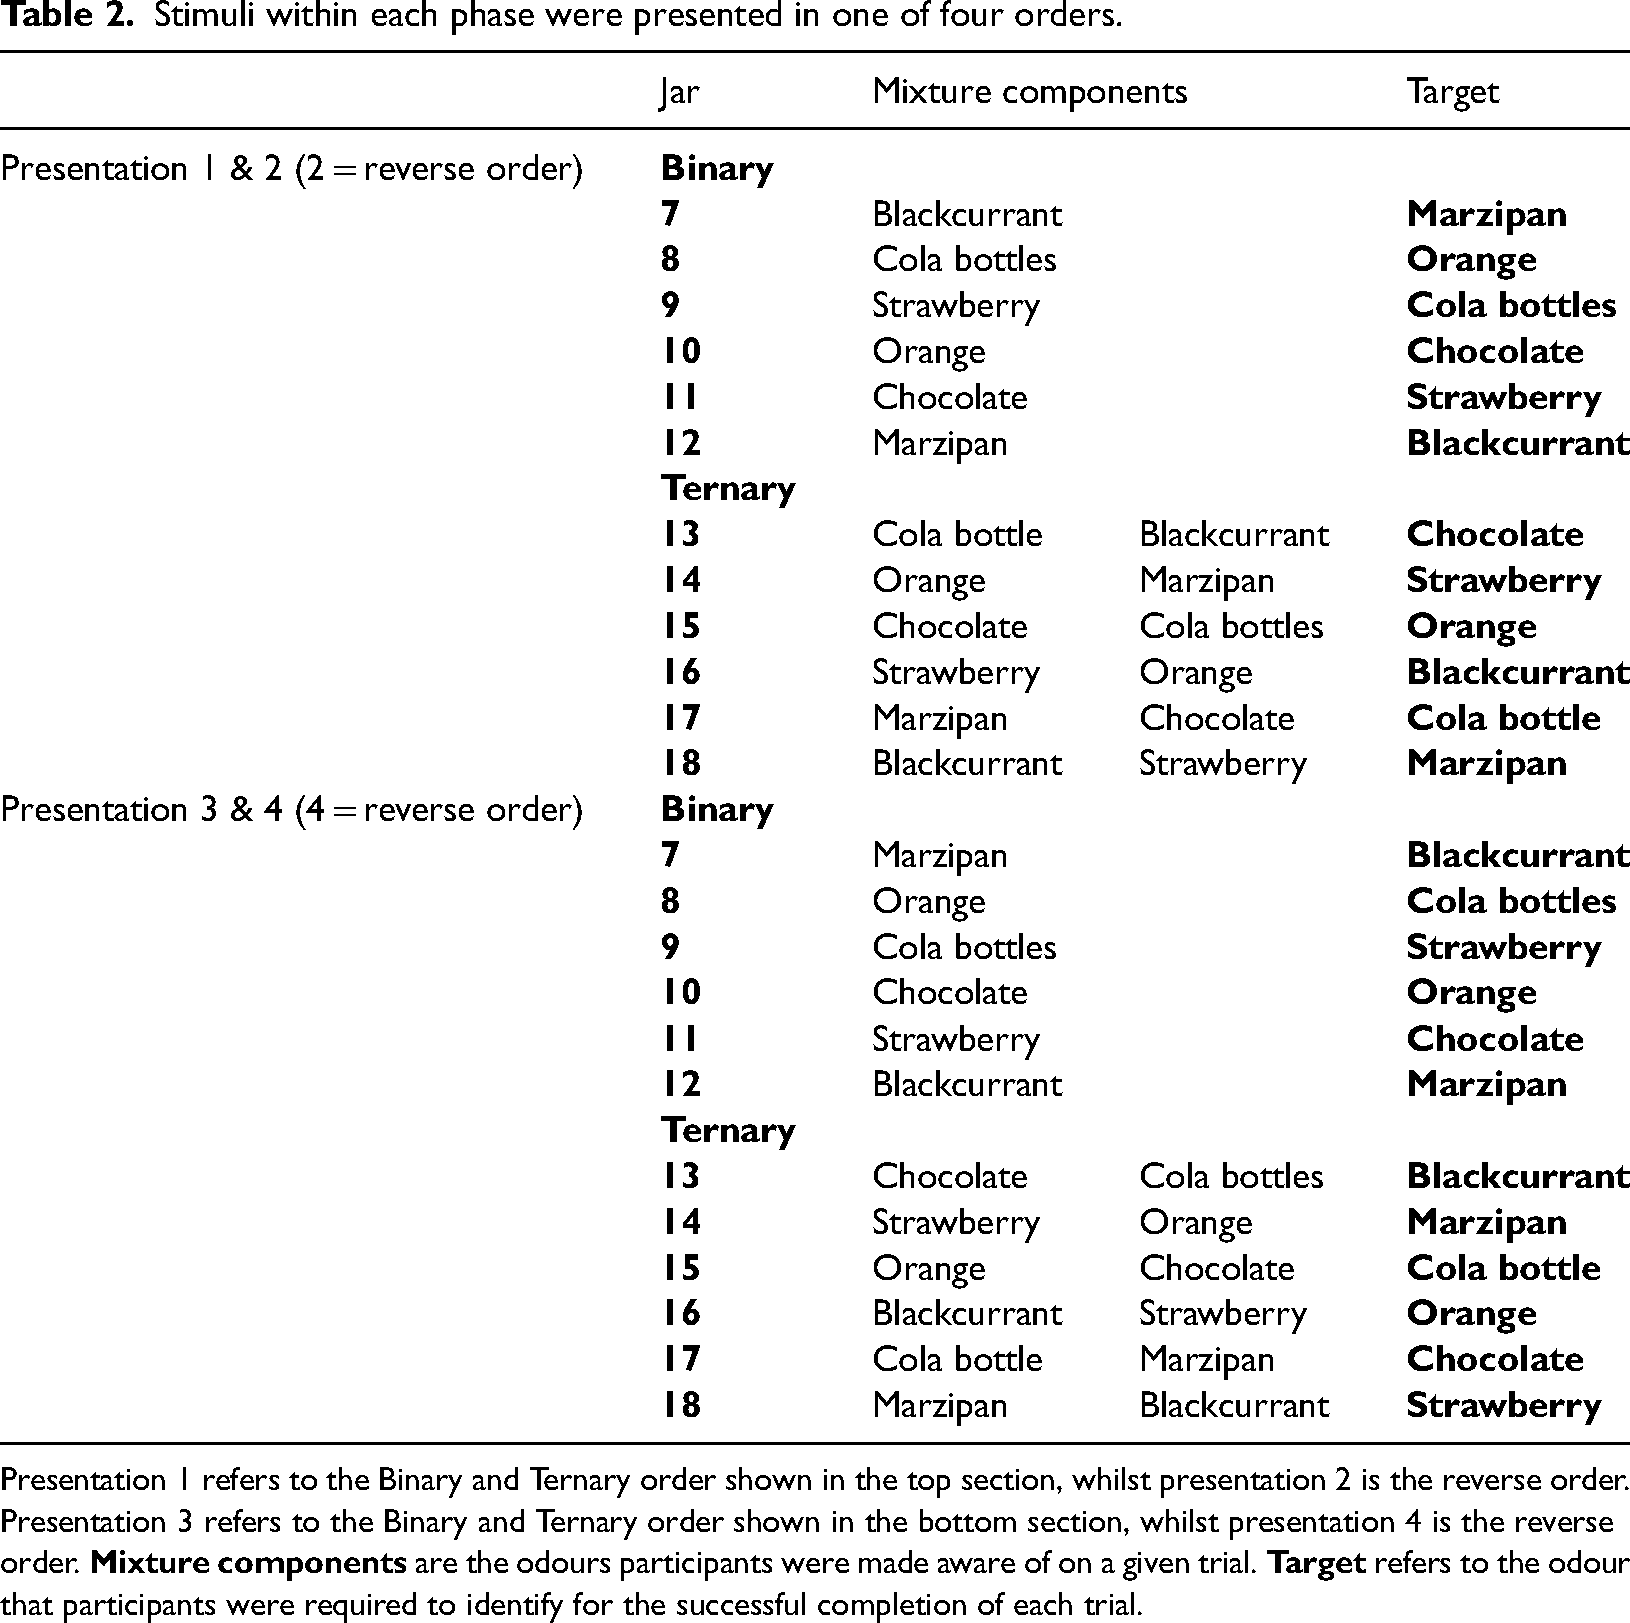
Presentation 1 refers to the Binary and Ternary order shown in the top section, whilst presentation 2 is the reverse order. Presentation 3 refers to the Binary and Ternary order shown in the bottom section, whilst presentation 4 is the reverse order.
Binary Mixture Trials
Participants were presented with a jar containing two pieces of fragrance-impregnated filter paper. Upon presentation to the participant, the experimenter indicated one of the odours present in the jar (see mixture components in Table 2) and asked the participant to identify which one of four pictures represented the ‘hidden’ (target) odour (see targets in Table 2). For example, they were told the jar contains chocolate cake and they must identify that the smell of strawberry is also present from four options (Figure 4b).
Ternary Mixtures Trials
Participants were presented with a jar containing three pieces of fragrance-impregnated filter paper. Upon presentation to the participant, the experimenter indicated two of the odours present in the jar and participants were asked to identify which one of four pictures represented another odour also ‘hidden’ there. For example, they were told the jar contains Blackcurrant and Strawberries and they had to identify that the smell of Marzipan was also present from four options (Figure 4b).
On all trials, the four response options were a subset of the six test fragrances. Every trial had its own corresponding response card. All participants used the same response card for each given trial and the incorrect options were a random selection of the possible alternatives (Figure 4a). Each image appeared across the whole set of response cards an approximately equal number of times. Scoring was based on the number of correctly identified target odours within the mixtures, with higher scores reflecting a better ability to segment and identify individual odours (local elements) within the overall (global) mixtures.
Odour Stimuli
Six food-related odours were used: blackcurrant, chocolate cake, cola bottles, marzipan, orange, and strawberry. Five of the odours were fragrances blended by a professional perfumer and varied in complexity from 3 to 32 components. These five fragrances were originally created for a project which aimed to support deaf and blind children to make food and drink choices (Murdoch et al., 2014) and were also used in a previously published study (Walker et al., 2020) from this laboratory. The other odour (orange) was an essential oil. All fragrances were diluted to 10% in ethanol. For testing, fragrances were pipetted onto individual quarters of filter paper (GE Healthcare Whatman, 55 mm diameter, Fisher Scientific), placed at the bottom of an Amber glass jar (Azpack, 120 mL, Fisher Scientific). The dose presented varied between 150 and 200 μL (2–4 drops from a Pasteur pipette): chocolate cake (150 μL), cola bottles (150 μL), marzipan (150 μL), orange (150 μL), strawberry (150 μL), and blackcurrant (200 μL). These doses were in-line with previously published research (Walker et al., 2020), established to produce perceptually iso-intense stimuli.
The Autism Spectrum Quotient (AQ)
AQ consists of 50 questions and measures autistic traits in the general population (Baron-Cohen et al., 2001a). Participants are asked to indicate how much each statement applies to them on a 4-point scale with descriptors: ‘Definitely agree’, ‘Slightly Agree’, ‘Slightly Disagree’, and ‘Definitely Disagree’. For half the questions, an ‘Agree’ or ‘Slightly Agree’ response indicates characteristics similar to those on the autistic spectrum and are scored as one, whereas ‘Disagree’ or ‘Slightly Disagree’ responses are scored as zero. 50% of questions are reverse scored. Scores on the scale can range from 0 to 50 with a typical population scoring 17 on average (Ruzich et al., 2015) and over 80% of individuals diagnosed with Autism scoring over 32 (Woodbury-Smith et al., 2005).
Procedure
Testing took place on a one-to-one basis in a quiet room. Upon entering the laboratory, participants were asked to place their personal belongings, including their mobile phone, to one side. They were then provided with a paper version of the participant information sheet and instructed to read it carefully. Once the participant was happy with the instructions, they were asked to sign a consent form. Participants first completed the Navon task which took approximately 10 min; they were instructed to sit comfortably in front of the computer screen and to follow the instructions on the screen which would start the task. Upon completion, participants were moved to another table in the same room where they completed the Block Design Task. Participants were then moved to another room to complete the Odour Identification Task – during this task, jars were presented individually. On each trial, the lid was unscrewed and held away from the participant for approximately 5 s while the experimenter gave them instructions; the jar was then placed under the participant's nose around 5 cm away. Participants were instructed to smell the contents of the jar and asked to indicate which of the four pictures presented best represented the odour they smelled in the jar. Note, the experimenter was not blind to odour identity. For the mixtures task, participants were told 1 (Binary mixtures) or 2 (Ternary mixtures) of the odours in the jar and asked to identify which of the four images presented best represented the other odour that was present. To avoid olfactory fatigue, there was a 30 s interval between trials and a 2-min break between each phase of testing. Participants were then asked to complete the AQ questionnaire on a laptop before being thanked for their time and debriefed. At that point, participants were given the opportunity to ask any questions.
Data Analysis Plan
All statistical analyses in this study are Bayesian, including ANOVAs, correlation assessments, and regressions. These analyses were conducted using JASP (version 0.19.3), employing the default prior, which is a Cauchy distribution centred at zero with a scale parameter of r = .707, which allows for a wide range of possible effect sizes (Morey et al., 2016). BFs enable us to quantify the evidence for the alternative hypothesis (H1) against the null hypothesis (H0). A BF10 of 3, for example, indicates that the evidence in favour of the alternative hypothesis is three times stronger than for the null hypothesis. While a BF > 1 provides evidence for the alternative hypothesis, and a BF < 1 provides evidence for the null hypothesis, BFs between 1 and 3 are generally considered insufficient evidence in either direction. Where data were not normally distributed, appropriate non-parametric analyses were applied (Nahm, 2016).
Assumption checks were conducted in SPSS v29.0.2.0. For all regressions, linearity was assessed by partial regression plots and a plot of studentised residuals against the predicted values. Independence of residuals was assessed using the Durbin-Watson statistic, and homoscedasticity was evaluated by visual inspection of a plot of standardised residuals versus unstandardised predicted values. The assumption of normality was checked using Q-Q plots. Additionally, there were no standardised deleted residuals greater than ±3 standard deviations, and values for Cook's distance were below 1.
Olfactory Data
Prior to the main analysis, accuracy scores for each of the single odours used in the initial identification trials were examined. A Bayesian Mixed ANOVA was used to identify whether participants displayed superior performance on the identification trials versus the mixture trials. This also ensured that the order of mixture presentation within the Binary and Ternary phases was not an issue.
Visual Data
For the Navon task, data from accuracy trials were removed if they were deemed anticipatory responses (<200 ms). In order to capture genuine cognitive responses while reducing the influence of extreme outliers, responses above 1500 ms were also removed (Gupta et al., 2021). In line with Forster (2011), reaction times for incorrect responses were excluded, representing 9.8% of the total trials: 3.64% for Congruent-Global, 5.58% for Congruent-Local, 12.59% for Incongruent-Global, and 17.39% for Incongruent-Local. After excluding incorrect, anticipatory, and long responses, performance scores for each trial type (Congruency/Level) were compared using separate Bayesian mixed ANOVAs.
Two indices, reflecting different aspects of visual processing, were derived on a participant-by-participant basis from Navon task data (Gerlach & Poirel, 2018; Navon, 1977).
Global-Local Precedence Effect: This index measures the advantage in processing global-level information over local-level information. It is calculated by subtracting the mean RT for trials where global and local levels are Congruent from the mean RT for trials where they are Incongruent. Positive values reflect faster processing of global compared to local trials.
Global-Local Interference Effect: This index measures the interference caused by Incongruent local information when attending to global-level information. It is calculated by subtracting the mean RT for Congruent trials from the mean RT for Incongruent trials. Positive values reflect greater accuracy on global compared to local trials.
Performance on the Block Design Task was assessed by the number of correctly completed trials, weighted by the time taken to complete each. Participants were scored according to their age group using the WAIS-III norms, structured in increments of 2 years (ages 16 to 19), 5 years (ages 20 to 34), 10 years (ages 35 to 64), and 5 years (ages 65 to 89). Higher scores indicated better performance.
Olfactory and Visual Task Associations
Bayesian correlation analyses were conducted to determine whether there were any associations between visual and olfactory task performance. All correlations were assessed using BF10 values to evaluate the strength of evidence for the alternative hypothesis over the null.
Autism Quotient
Scores from the Autism Quotient Questionnaire were primarily examined to ensure the sample contained a good range of scores for a typical population (Ruzich et al., 2015). The distribution of Autism Quotient scores ranged from 6.00 to 45.00, with a mean score of 20.20 (SD = 8.57). Bayesian Correlation analysis was conducted in order to determine whether AQ scores were associated with performance on the Odour Mixture Task (Binary and Ternary), the Navon task (trial types and indices) and the Block Design task.
Results
Navon
For reaction time (RT), as shown in Figure 5A, Bayesian analysis provided extreme evidence against the null hypothesis for a main effect of Congruency (BFincl = 4.256 × 10+¹²), indicating that responses were faster for Congruent than Incongruent stimuli. There was moderate-to-strong evidence against the null hypothesis for a main effect of Level (BFincl = 6.306), with faster responses for Global compared to Local identity judgments. However, there was weak evidence against the null hypothesis for the interaction between Level and Congruency (BFincl = 1.671). Bayesian model comparison indicated that the best-supported model included both Level and Congruency (BF10 = 2.892 × 10+¹³), whereas adding the Level × Congruency interaction did not improve model fit (BF10 = 1.398 × 10+¹³), providing little support for an interaction effect.
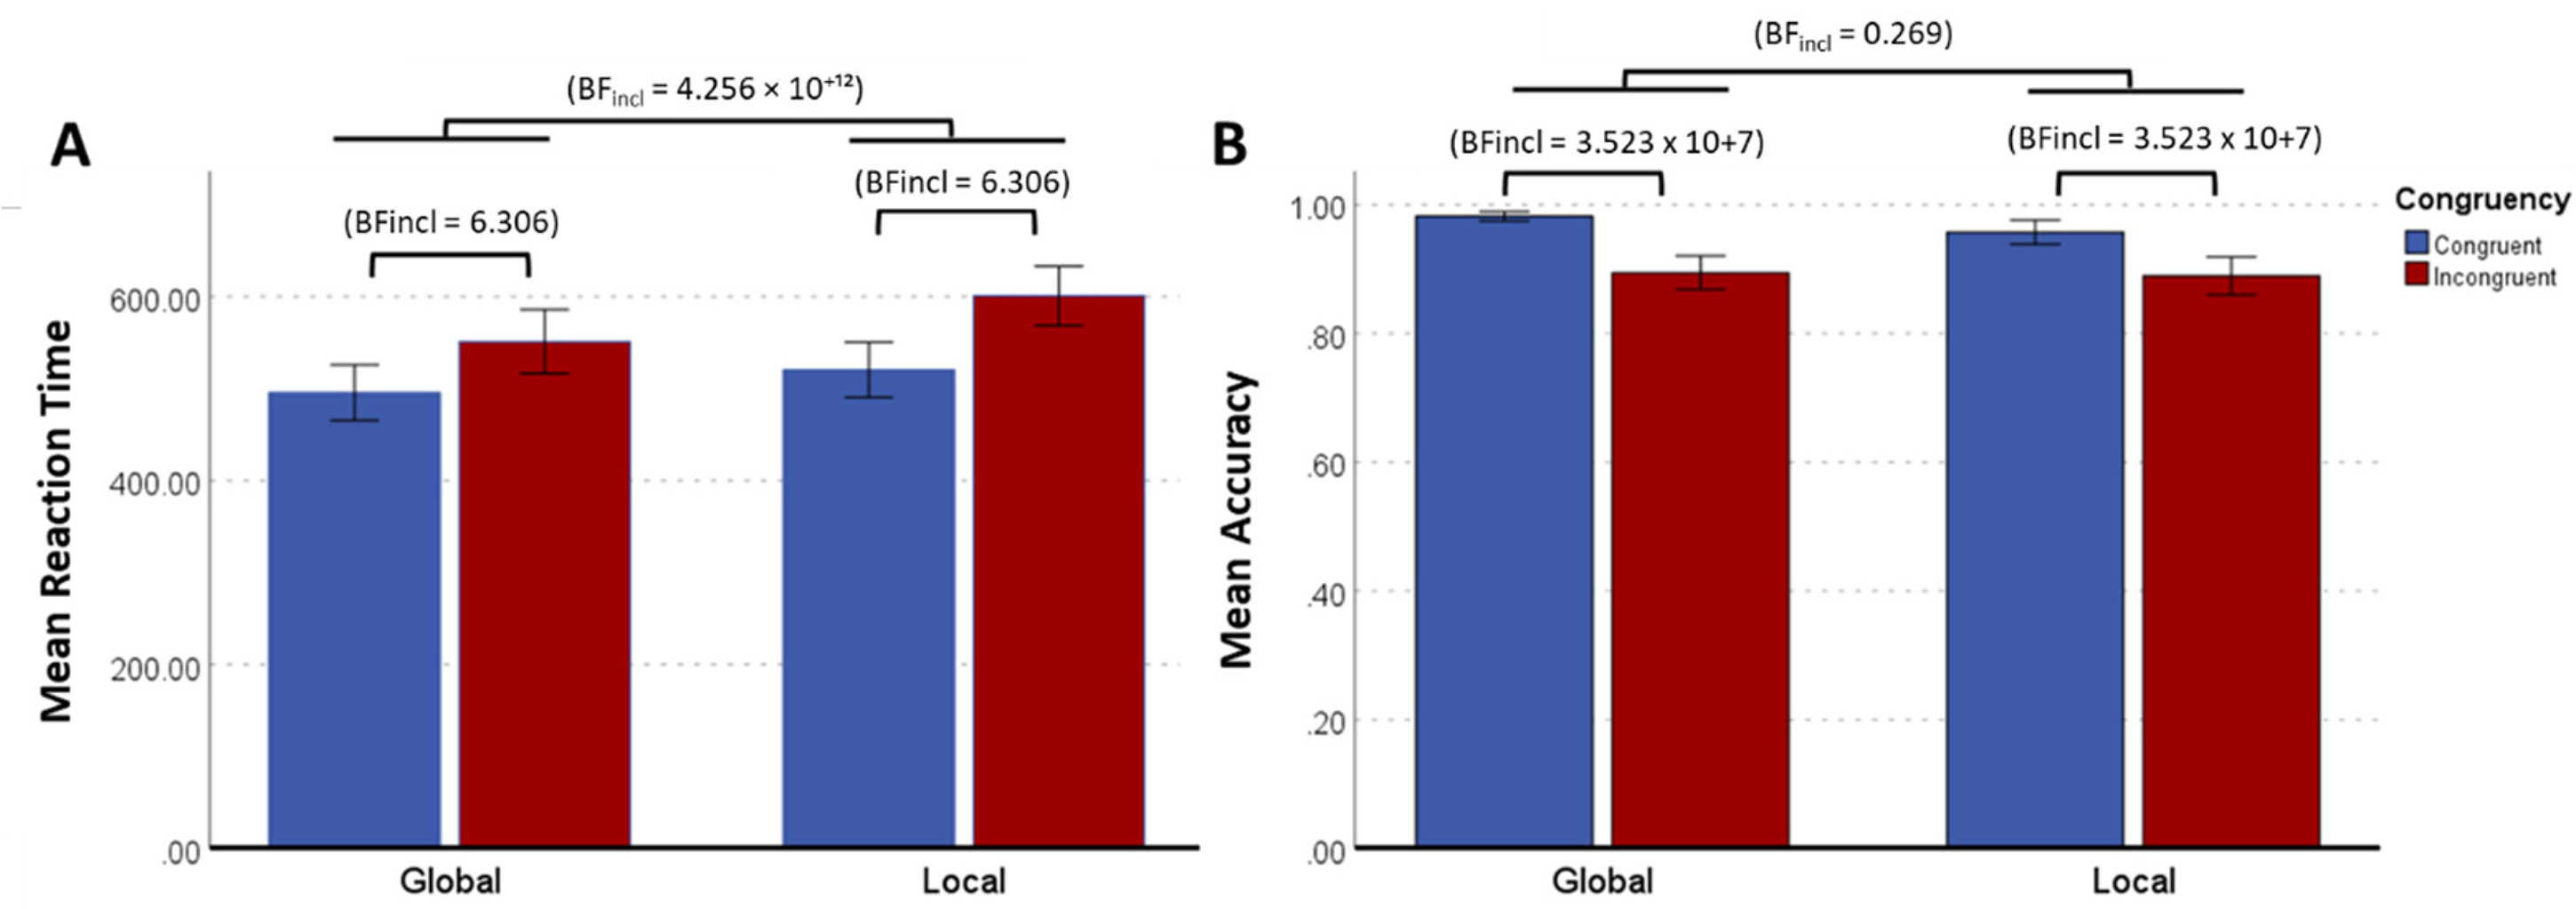
(A) Mean Reaction Time and (B) Mean Accuracy, for each trial type. Blue bars represent Congruent Trials, while red bars represent Incongruent Trials. For both Reaction Time (BFincl = 4.256 × 10¹²) and Accuracy (BFincl = 3.523 × 10⁷), there was extreme evidence against the null hypothesis for a main effect of Congruency. Additionally, for Reaction Time, there was moderate-to-strong evidence against the null hypothesis for a main effect of Level (BFincl = 6.306), though this effect was not observed for Accuracy (BFincl = 0.269). Error bars display 95% CI. BFincl < 1 = no evidence for the alternative hypotheses, BFincl > 3 = moderate evidence for the alternative hypotheses, BFincl > 10 = strong evidence for the alternative hypotheses, and BFincl > 100 = extreme evidence for the alternative hypotheses.
For Accuracy (Figure 6B), Bayesian analysis provided extreme evidence against the null hypothesis for a main effect of Congruency (BFincl = 3.523 × 10 + 7) with superior performance on Congruent compared with Incongruent trials. However, there was strong evidence in favour of the null hypothesis for a main effect of Level (BFincl = 0.269), indicating that responses did not differ between Global and Local trials. Similarly, there was moderate evidence in favour of the null hypothesis for the interaction between Level and Congruency (BFincl = 0.387), suggesting no meaningful interaction effect. Bayesian model comparison indicated that the best-supported model included Congruency alone (BF10 = 4.709 × 10+7), whereas adding Level did not improve model fit (BF10 = 1.319 × 10+7). Furthermore, including the Level × Congruency interaction reduced model fit (BF10 = 5.833 × 10+6), reinforcing support for the null hypothesis regarding the interaction effect.
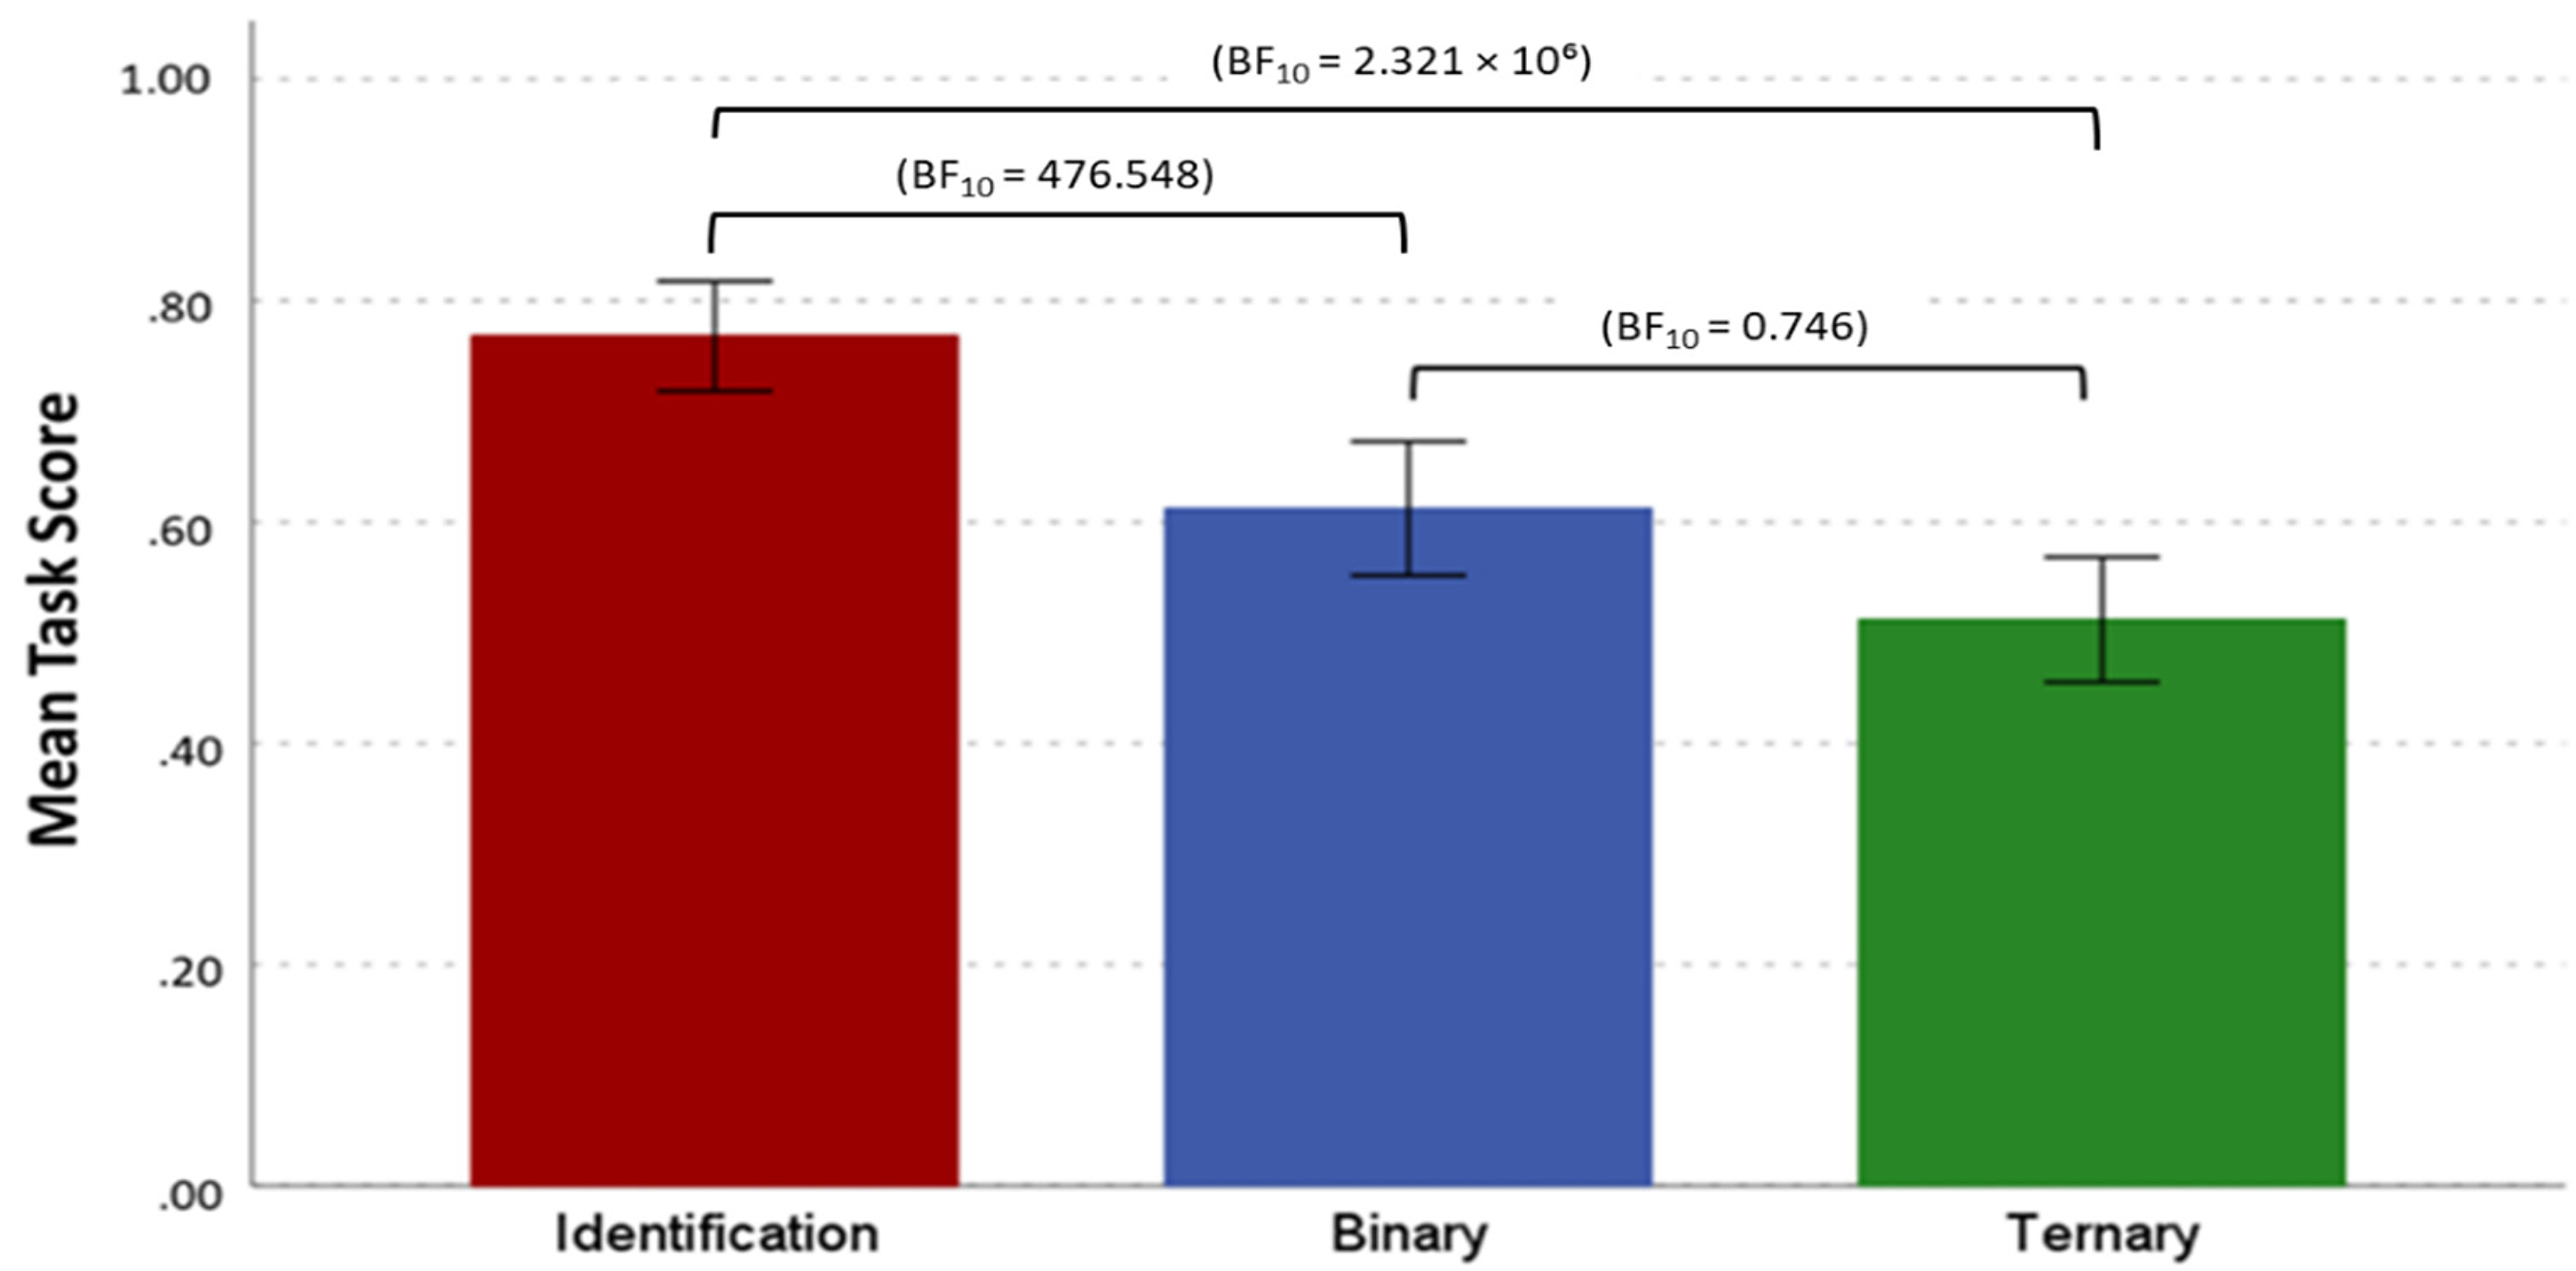
The mean scores for each trial type (Identification, Binary, Ternary). There was extreme evidence supporting better performance on Identification trials compared to Binary and Ternary trials. However, there was weak evidence against the null hypothesis for the comparison between Binary and Ternary trials. Error bars display 95% CI. BFincl < 1 = no evidence for the alternative hypotheses, BFincl > 3 = moderate evidence for the alternative hypotheses, BFincl > 10 = strong evidence for the alternative hypotheses and BFincl > 100 = extreme evidence for the alternative hypotheses.
Navon Indexes
The mean score on the Global-Local Interference index (M = .078, SD = .06) indicates that accuracy was greater when participants were required to identify the Global information compared to the Local information, as such Global information interfered with reporting of Local information.
The mean score on the Global-Local Precedence index (M = −37.35, SD = 67.34) indicates that RT was generally faster when participants were asked to identify the Global information compared to the Local information.
Block Design Task
Raw scores on the Block Design Task ranged from 2.00 to 56.00, with a mean of 30.95 (SD = 14.35). Using Weschler norms, scaled scores ranged from 1.00 to 14.00, with a mean of 7.85 (SD = 3.14), with participants successfully completing an average of 6.3 trials, and 30.5% of participants successfully completing all 9 trials.
Odour Task
The proportion of correct answers given in the identification phase, as well as in binary and ternary mixtures phases, was calculated on a participant-by-participant basis, with mean overall scores calculated for each trial type.
As multiple odour sets were used, it was important to confirm that performance did not differ between odour sets. A Bayesian mixed ANOVA was conducted to examine the effects of Trial Type and Odour Set on accuracy
Correlations
AQ
We hypothesised that AQ would be associated with superior local processing in both visual and olfactory tasks. However, Bayesian analyses provided strong support for the null hypothesis, indicating no meaningful associations between AQ and performance on these tasks.
For the visual tasks, there was no association between AQ and Block Design performance (r = .17, BF10 = 0.204), providing support for the null hypothesis over the alternative. Similarly, there was evidence favouring the null hypothesis for both Navon Precedence (r = −.08, BF10 = 0.170) and Navon Interference (r = −.12, BF10 = 0.246), suggesting that AQ does not systematically relate to global-local processing in visual tasks.
For the olfactory tasks, AQ was not associated with Odour Identification (r = −.06, BF10 = 0.165), Binary trials (r = .09, BF10 = 0.258), or Ternary trials (r = −.06, BF10 = 0.178). The Bayes factors consistently provided support for the null hypothesis, indicating that AQ does not predict performance in olfactory processing tasks.
Given the lack of evidence for an association between AQ and task performance across both modalities, AQ was not included in any further analyses.
Visual and Olfactory Tasks
Block Design Task
Bayesian correlation analyses did not support the alternative hypothesis that performance on the Block Design Task would be associated with odour identification accuracy. Instead, the results provided evidence in favour of the null hypothesis, indicating no associations between Block Design performance and Identification trials (r = .20, BF10 = 0.798), Binary trials (r = .06, BF10 = 0.192), or Ternary trials (r = .04, BF10 = 0.228).
Navon
Contrary to the study hypotheses, the two standard indices of NAVON performance were not associated with odour mixture performance. For Binary trials, there was no evidence for an association between performance and either Navon Precedence (r = .05, BF10 = 0.208) or Navon Interference (r = .01, BF10 = 0.174). Similarly, for Ternary trials, there was no evidence for an association with either Navon Precedence (r = .09, BF10 = 0.428) or Navon Interference (r = .01, BF10 = 0.176).
Since the NAVON indices were not associated with odour mixture performance, further analyses were undertaken to explore whether a relationship emerged when considering RT and Accuracy across the four NAVON trial types (Congruent Global, Congruent Local, Incongruent Global, Incongruent Local).
Analysis of Relationship Between NAVON and Odour Mixture Performance
A Bayesian correlation analysis was conducted to examine whether RT and Accuracy on Congruent and Incongruent Navon trials was associated with performance on the odour mixture task. Since congruent global and local trials involved identical stimuli, they were collapsed into a single congruent response factor.
Accuracy
For Binary trials, there was strong evidence supporting the null hypothesis that Accuracy would be associated with performance on the odour mixture task. Performance on Binary mixture trials was not associated with Accuracy on Congruent trials (Kendall's τ = −0.153, BF10 = 0.652), Incongruent Global trials (Kendall's τ = −0.195, BF10 = 1.488), and Incongruent Local trials (Kendall's τ = −0.106, BF10 = 0.330). For Ternary trials, again, there was strong evidence supporting the null hypothesis that Accuracy would be associated with performance on the odour mixture task. Performance on Ternary mixture trials was not associated with Accuracy on Congruent trials (Kendall's τ = 0.136, BF10 = 0.495), Incongruent Global trials (Kendall's τ = 0.032, BF10 = 0.187) and Incongruent Local trials (Kendall's τ = −0.181, BF10 = 1.091). This implies that Accuracy is not an advantage in performance on either the Binary or Ternary mixture trials.
Reaction Time
For Binary trials, there was strong evidence supporting the alternative hypothesis that RT would be associated with performance on the odour mixture task. Specifically, performance was moderately negatively correlated with Navon RT across all trial types (Figure 7), including Congruent trials (Kendall's τ = −0.301, BF10 = 55.899), Incongruent Global trials (Kendall's τ = −0.279, BF10 = 25.576) and Incongruent Local trials (Kendall's τ = −0.225, BF10 = 5.910). Thus, revealing that participants who performed better in the binary odour mixtures task processed visual stimuli more quickly during all trial types on the Navon task.
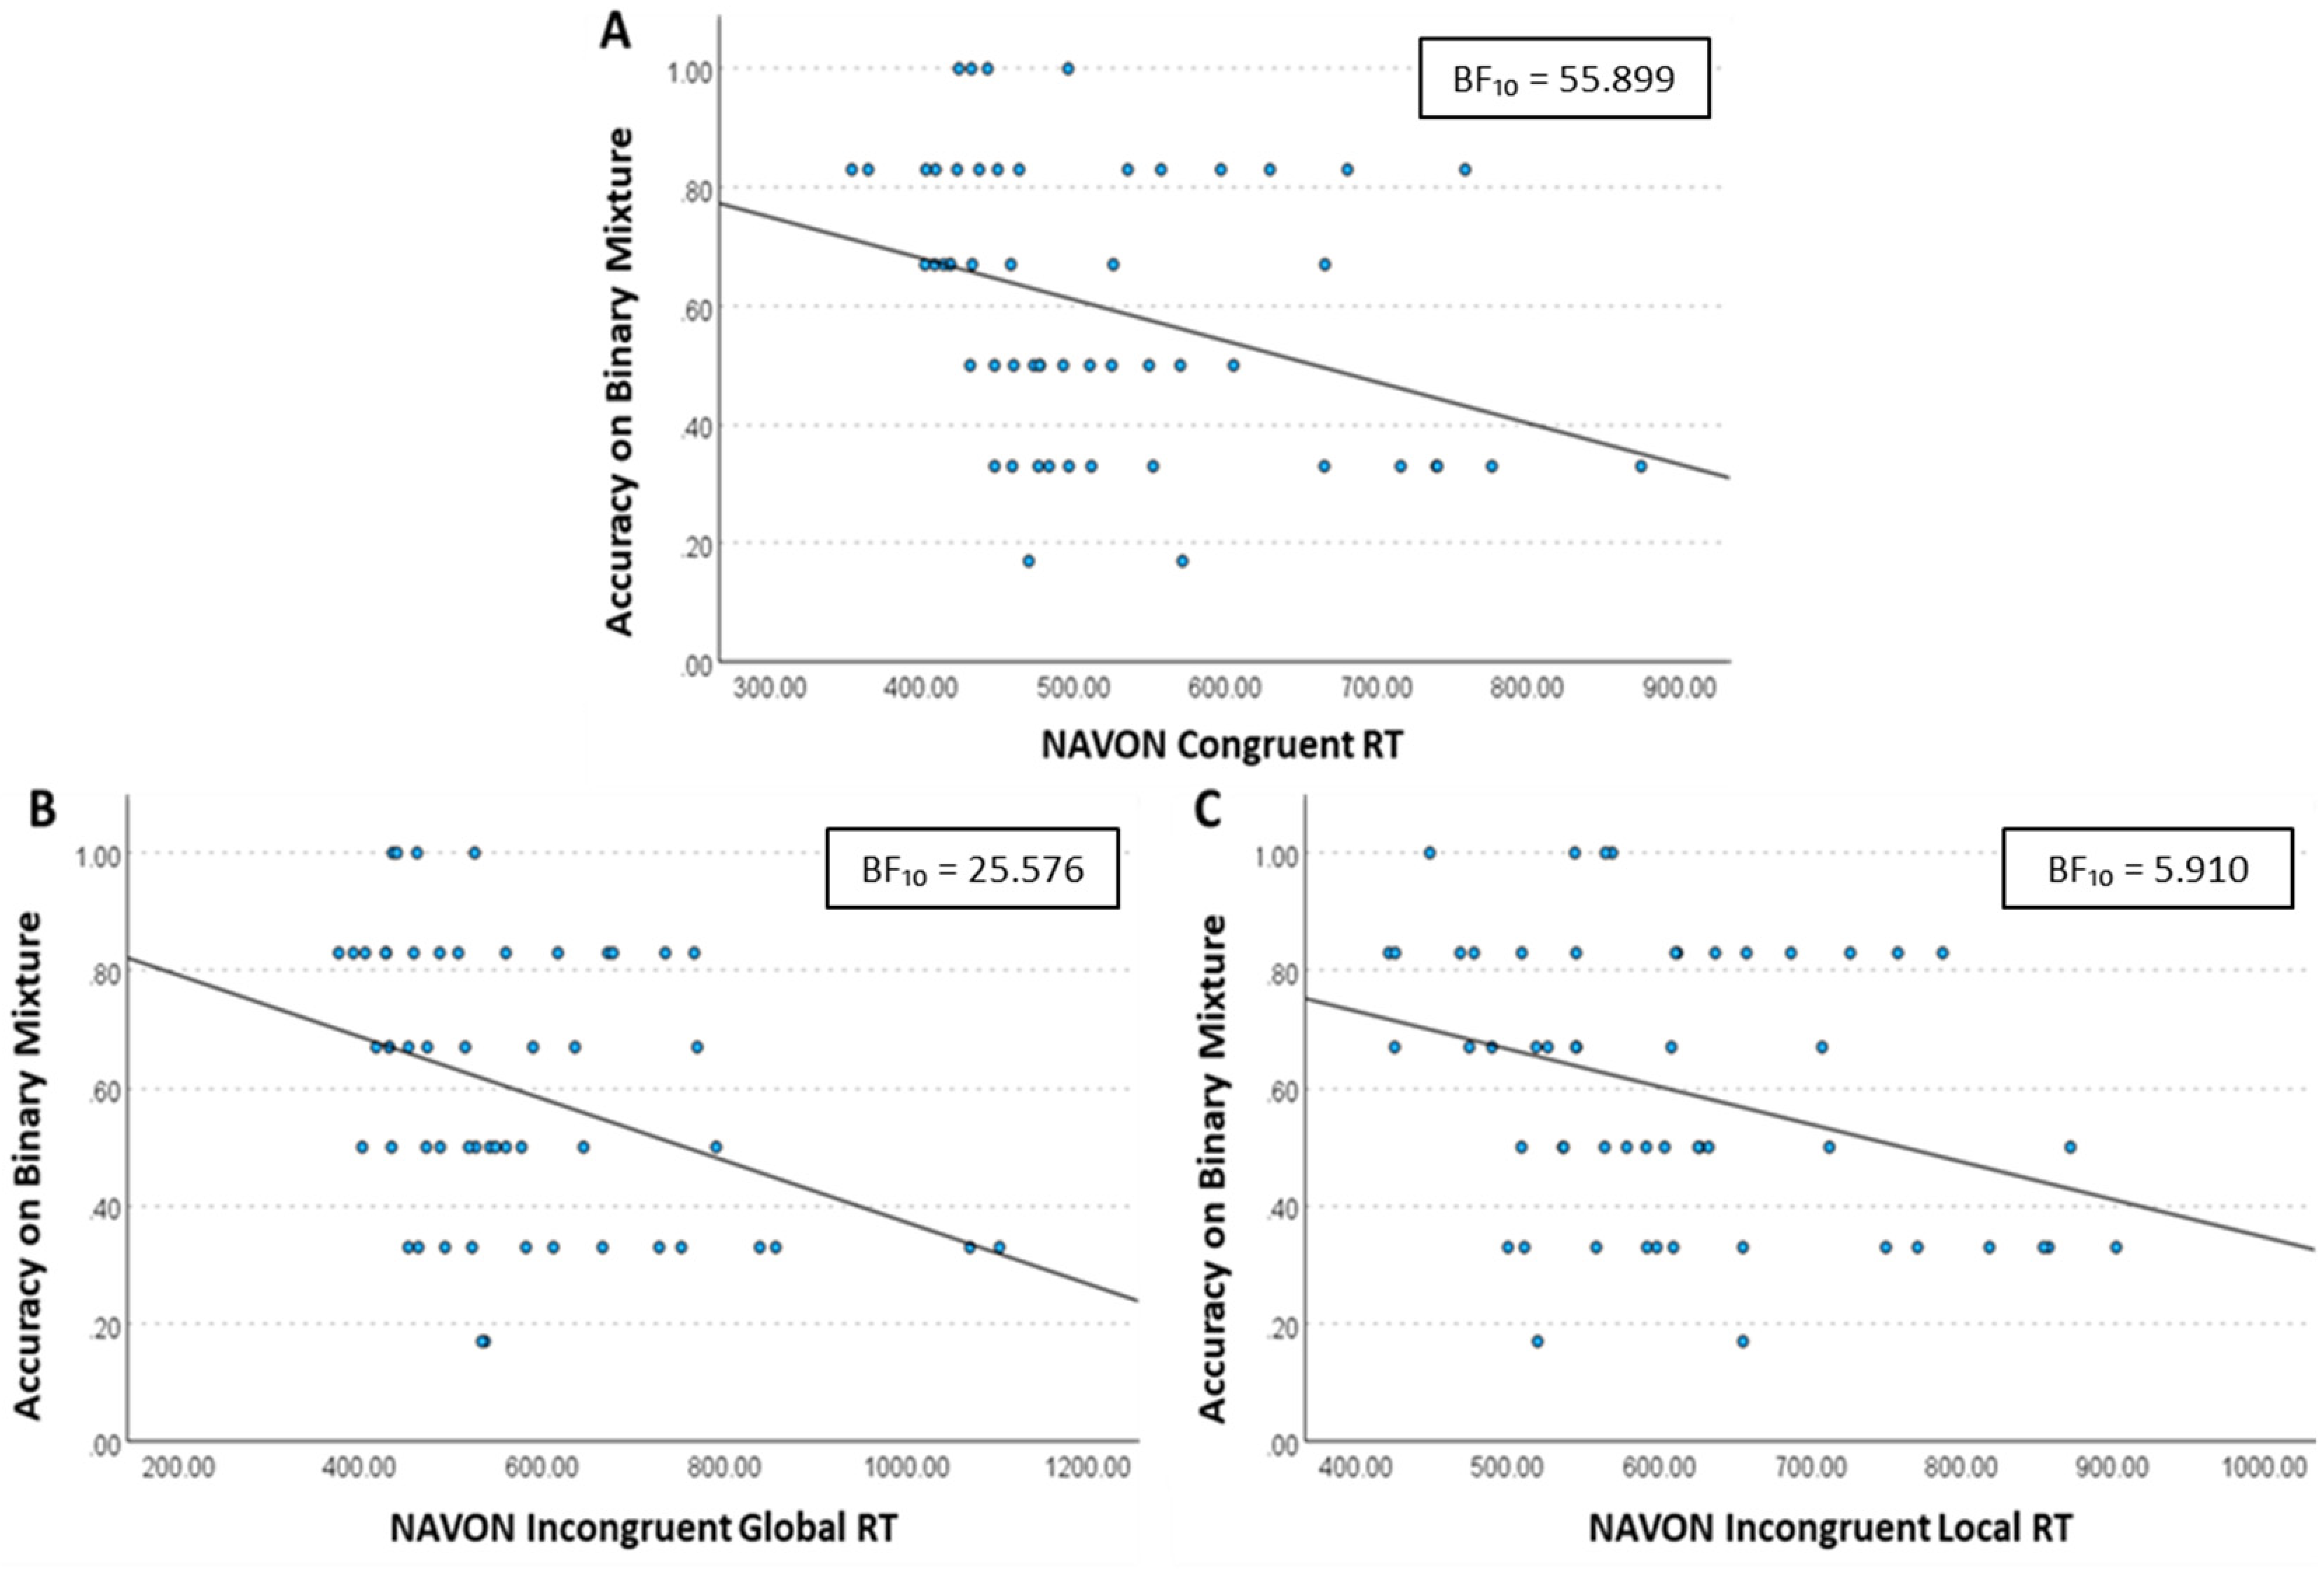
Scatterplots depicting the relationship between odour identification performance in the binary mixture task and reaction time on Navon trials. (A) Congruent trials, (B) Incongruent Global trials and (C) Incongruent Local trials. Across all trial types, performance was moderately negatively correlated with reaction time, including Congruent trials, Incongruent Global trials and Incongruent Local trials. The trend lines represent the linear regression fit for each dataset. BF10 > 3 = moderate evidence for the alternative hypotheses, BF10 > 10 = strong evidence for the alternative hypotheses.
For Ternary trials, the results provided support for the null hypothesis, as there was little to no evidence of an association between Navon RT and odour mixture identification. There was no association between performance ternary odour mixture trials with Navon RT, for any trial type: Congruent trials (Kendall's τ = −0.142, BF10 = 1.016), Incongruent Global (Kendall's τ = −0.069, BF10 = 0.355) and Incongruent Local (Kendall's τ = −0.112, BF10 = 0.628). This implies that faster processing speed is not an advantage to performance on the more complex mixture trials.
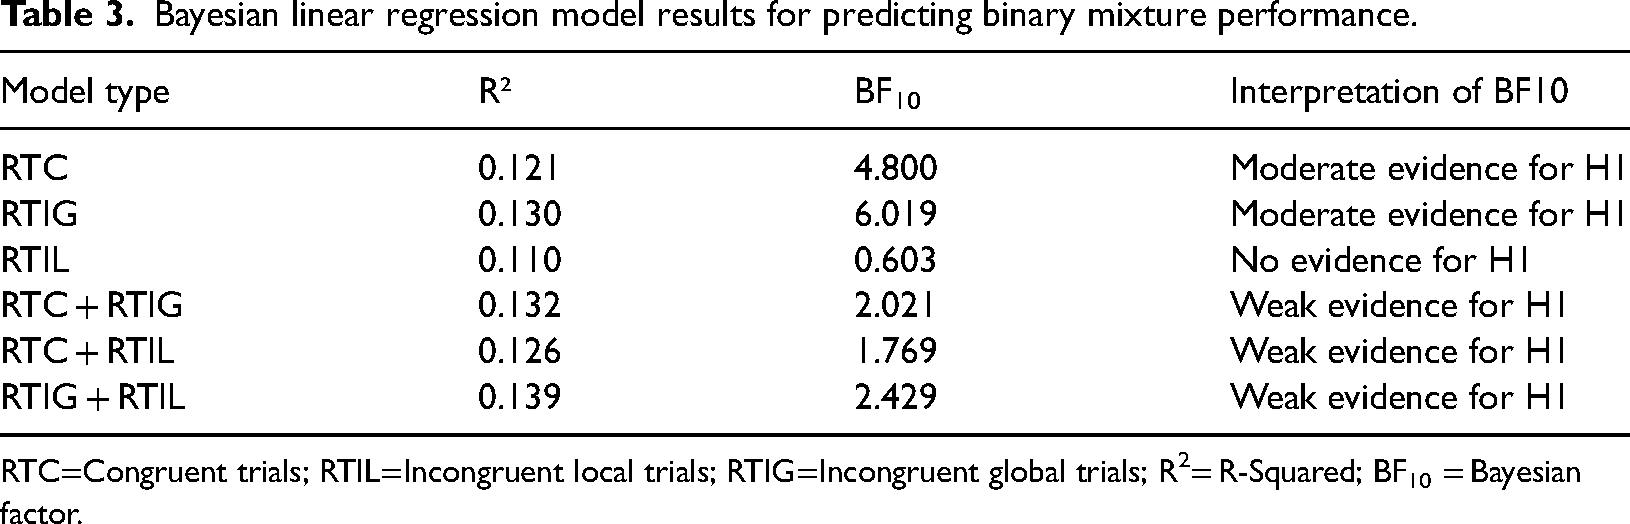
Due to RT for all trial types, being strongly associated with Binary mixture performance, a Bayesian linear regression analyses, containing Binary mixture performance and RT for all NAVON trial types (Congruent, Incongruent Global, Incongruent Local) was conducted in order to ascertain the amount of variance in odour mixture performance, each trial type accounted for. The results of this analysis, including the amount of variance accounted for by each trial type, are presented in Table 3.
Bayesian linear regression model results for predicting binary mixture performance.
RTC=Congruent trials; RTIL=Incongruent local trials; RTIG=Incongruent global trials; R2
The results indicated that RT on Incongruent Global trials was the strongest predictor of binary mixture performance, accounting for 13.0% of the variance (R² = 0.130, BF10 = 6.019). This provides moderate evidence for the alternative hypothesis (H1), suggesting that RT on Incongruent Global trials is predictive of odour mixture performance.
RT on Congruent trials also accounted for a notable portion of the variance in Binary mixture performance (12.1%, R² = 0.121, BF10 = 4.800), which also provides moderate support for H1, indicating that RT on Congruent trials is also a relevant predictor of odour mixture performance.
In contrast, RT on Incongruent Local trials accounted for 11.0% of the variance (R² = 0.110, BF10 = 0.603), however, the Bayes factor suggests no evidence for its contribution to the model, supporting the null hypothesis (H0) that RT on Incongruent Local trials does not predict odour mixture performance.
When considering the combined models, RT for Congruent Trials and Incongruent Global Trials together explained 13.2% of the variance (R² = 0.132, BF10 = 2.021), however, the Bayes Factor indicated weak support for the combined predictive value. Similarly, the combination of RT for Congruent Trials and Incongruent Local Trials explained 12.6% of the variance (R² = 0.126, BF10 = 1.769), with weak support for the predictive value of this combined model. Finally, the combination of RT for Incongruent Global and Incongruent Local Trials explained 13.9% of the variance (R² = 0.139, BF10 = 2.429), which also provides weak support for the combined model. Thus, RT on Incongruent Global trials was the strongest predictor of binary mixture performance.
Discussion
The aim of the current study was to determine whether a local processing bias in the visual domain predicts superior performance in identifying individual odour objects within complex mixtures. It was hypothesised that participants who display a local level processing advantage on visual tasks would be better at identifying multicomponent odour objects in both binary and ternary mixtures. Further, it was expected that higher levels of self-reported autistic traits would be associated with superior local processing in both visual and olfactory tasks.
In contrast to the study hypotheses, performance on the odour mixtures task was not associated with success on either the block design task or classic indices of local processing advantage on the Navon. However, the analysis of RT on the Navon task provided evidence supporting the alternative hypothesis that processing speed is associated with odour mixture performance. There was moderate evidence in support of the association between RT and performance on the Binary mixture trials, indicating that participants who processed visual stimuli more quickly tended to perform better on the Binary odour mixture task. Bayesian linear regression revealed that RT on Incongruent Global trials was the strongest predictor of Binary mixture performance, providing moderate evidence for the alternative hypothesis, that RT on Incongruent Global trials predicts odour mixture performance. Thus, suggesting that processing speed confers some advantage when analysing relatively simple olfactory scenes. It is noteworthy that these associations were only apparent on Binary mixture trials as Navon RT did not predict performance on the more complex Ternary mixtures, perhaps reflecting the fact successful performance of this more complex task requires additional or different cognitive strategies (Walker et al., 2020). Processing speed interacts in a critical way with other higher-order cognitive functions (Motes et al., 2018; Wong et al., 2021), such as selective attention (Jehu et al., 2014; Prinzmetal et al., 2005; Vaportzis et al., 2015). That is, faster processing speed has been associated with the ability to selectively attend to information in a more localised manner, meaning individuals can efficiently focus on specific details, elements or features within a task or stimulus. In such cases, those with faster processing speed may excel in tasks that require a narrowed, localised attentional focus (Jehu et al., 2014; Prinzmetal et al., 2005; Vaportzis et al., 2015). This interplay between cognitive processes would support the current findings in which individuals who displayed faster processing speed also exhibited superior performance in segmenting odour objects in Binary mixtures.
In contrast to previous research, in which individuals with a clinical Autism diagnosis, or those self-reporting high levels of autistic traits, have displayed a bias for local processing of visual stimuli on the Navon Task (Happe & Booth, 2008; Neufeld et al., 2019) and the Block Design Task (Shah & Frith, 1993; Stewart et al., 2009) and superior performance on the Odour Mixtures task (Walker et al., 2020), in the current study, no association was found between AQ score and performance on these tasks. Whilst much of the past research focusses on Local and Global processing styles in Autistic individuals (Caron, 2006; Happé & Booth, 2008; Lebreton et al., 2021; Neufeld et al., 2019), it is important to note that preference for local processing has been observed in the general population, especially when considering state and trait factors such as negative moods (Fredrickson & Branigan, 2005; Gasper, 2004; Noguchi & Tomoike, 2016), superior observational drawing (Chamberlain et al., 2013; Drake et al., 2024), familiarity of a stimulus (Förster et al., 2009), increased anxiety (Becker et al., 2017; Shilton et al., 2019) and higher levels of autistic traits (Happé & Booth, 2008; Neufeld et al., 2019). This unexpected finding may be due to the fact a strong local processing bias is more reliably observed in those with a clinical diagnosis of Autism (Behrmann et al., 2006; Mottron et al., 2000; Plaisted et al., 1999; Rinehart et al., 2000; Van Eylen et al., 2015) than those self-reporting high level autistic traits, such as the current study and others where null results were reported (Hayward et al., 2018; Mottron et al., 2003). This notion would be consistent with the findings of Walker et al. (2020), who found that superiority in odour mixture processing was stronger in children with a clinical diagnosis of autism than in adults reporting high levels of autistic traits. Future research could address this by selectively recruiting participants in the upper and lower thirds of the AQ distribution or by directly comparing the performance of autistic individuals with that of a matched neurotypical control group.
There are some limitations in the present study, which warrant further investigation. For example, using only six odours in the mixture trials, raises question as to whether the findings are generalisable to other stimulus sets. In addition, whilst the order of presentation of odour mixtures was considered, all possible combinations of stimuli from the odour set were not. This raises uncertainties regarding the identifiability of target odours in alternative mixture combinations (Jinks & Laing, 1999; Laing & Francis, 1989; Laing & Glemarec, 1992; Livermore & Laing, 1998). As such, future research should extend the number and character of odour stimuli used. Furthermore, familiarity with specific odours and their hedonic qualities are known to affect identification (Martinec Novakova et al., 2015; Royet et al., 1999). For example, odours that are more familiar or associated with positive experiences are typically identified more accurately (Sulmont et al., 2002), highlighting the importance of considering these factors in future studies. In addition, there is a sex bias within the current sample, with 66% female participants. Given known sex differences in olfactory perception, with females typically showing greater sensitivity (Sorokowski et al., 2019), the results may not fully generalise to males. Future research should aim for a balanced sample that would allow direct comparison of male and female performance. Finally, the present study was underpowered to detect small effects sizes, so future work should recruit larger samples to provide more power to detect effects.
Given that the odour mixtures created in the present study were not designed to generate a new novel percept, with an identity that is independent of the constituent odour objects, it cannot be considered to be fully analogous to the NAVON task and performance perhaps better reflects the demands of visual search tasks, which test the ability to detect a target in a non-embedding array (Milne & Szczerbinski, 2009). Given visual search tasks require speeded performance and yet tap different perceptual constructs to the NAVON and Block Design, it would be interesting to consider whether visual search is associated with mixture performance, in a replication and extension of this study. An alternative approach to assessing the relationship between local and global processing in visual and olfactory domains is to consider whether a local processing style primed in the visual domain can enhance olfactory mixture task performance. Initial evidence that this may be the case comes from a wine recognition test, where induction of a local bias impaired performance (Lewis et al., 2009). It would be of interest to determine the extent to which this effect was replicated with odour mixtures that have a clear local and global identity.
In conclusion, the results reported here provide the first evidence that processing speed confers some advantage when analysing relatively simple olfactory scenes, supporting the notion that those with faster processing display a narrowed, localised attentional focus (Jehu et al., 2014; Prinzmetal et al., 2005; Vaportzis et al., 2015). Further research is however warranted, in order to fully elucidate the mechanisms underlying these olfactory processing, as well as how they might influence more complex olfactory processing in real-world contexts.
Supplemental Material
sj-docx-1-pec-10.1177_03010066251328886 - Supplemental material for Olfactory scene analysis: Does analytical visual processing predict superior identification of component odours in a complex mixture?
Supplemental material, sj-docx-1-pec-10.1177_03010066251328886 for Olfactory scene analysis: Does analytical visual processing predict superior identification of component odours in a complex mixture? by Rachel Hagan, David Moore, Francis McGlone and Susannah C. Walker in Perception
Footnotes
Author Contribution(s)
Declaration of Conflicting Interests
The authors declared no potential conflicts of interest with respect to the research, authorship, and/or publication of this article.
Funding
The authors disclosed receipt of the following financial support for the research, authorship, and/or publication of this article: This work was supported by a Biotechnology and Biological Sciences Research Council/Glaxo Smith Kline industrial CASE studentship awarded to RH.
Supplemental Material
Supplemental material for this article is available online.
References
Supplementary Material
Please find the following supplemental material available below.
For Open Access articles published under a Creative Commons License, all supplemental material carries the same license as the article it is associated with.
For non-Open Access articles published, all supplemental material carries a non-exclusive license, and permission requests for re-use of supplemental material or any part of supplemental material shall be sent directly to the copyright owner as specified in the copyright notice associated with the article.