
Abstract
We used a simple stimulus, dissociating perceptually relevant information in space, to differentiate between bottom-up and task-driven fixations. Six participants viewed a dynamic scene showing the reaction of an elastic object fixed to the ceiling being hit. In one condition they had to judge the object's stiffness and in the other condition its lightness. The results show that initial fixations tend to land in the centre of an object, independent of the task. After the initial fixation, participants tended to look at task diagnostic regions. This fixation behaviour correlates with high perceptual performance. Similarly, low-latency saccades lead to fixations that do not depend on the task, whereas higher latency does.
Keywords
Perception is flexible and adaptive. These qualities allow the perceptual system to adapt to new tasks and situations and to compensate for inherent limitations in processing capacity. For example, in the visual system, only the central part of the retina has high resolution (fovea) hence we need to move our eyes to position the fovea onto potentially relevant parts in space in order to resolve them. The trade-off with limited energy resources potentially led to the evolution of gaze behaviour that optimises information intake and movement costs. Early studies proposed that eye movements are largely automatic and mostly (bottom-up) driven by stimulus properties. Participants tend to fixate more conspicuous or salient parts of the image, for example, image parts with higher contrast and edge information (Tatler et al., 2005). Itti and Koch (2001) proposed a model in which gaze allocation can be predicted from such simple visual features reflecting early visual processing. More recent saliency models incorporate also more complex features such as objects (e.g., Einhäuser et al., 2008; Kümmerer et al., 2016). It was also proposed that the saliency map can directly be computed from the responses of the primary visual cortex (Li, 2002) or even the superior colliculus (White et al., 2017).
However, there is also evidence highlighting the importance of higher-level factors such as task demand or value (Hayhoe & Ballard, 2005; Land, 2009; Schütz et al., 2011). The visual system is in fact tuned to extract the relevant information for the perceptual task in which it is engaged. For instance, when estimating object colour, participants fixate parts of the image which are most diagnostic for this task (Toscani et al., 2013a, 2013b). This happens also for moving stimuli, where fixation landing positions are balanced between the need to follow the object and the need to sample its most informative regions (Toscani et al., 2016). Tuning of fixation behaviour to the perceptual task can be so fine that it is constantly updated in a dynamic scene. Viewing a dynamic stimulus where gloss-diagnostic or speed-diagnostic features are dynamically changing position over time, participants could constantly change their fixation allocation towards gloss-diagnostic regions when asked to judge a surface's gloss, and towards motion diagnostic regions when asked to judge an object's speed (Toscani, Yücel, et al., 2019).
What differentiates the bottom-up driven and the top-down driven fixations, at what time course they evolve and how they relate to performance is yet unclear. In general, it has been argued that fast processing is used to direct initial fixations to a surface and it is driven by bottom-up saliency. It was shown that low-latency saccades tend to land on bottom-up salient positions whereas long-latency saccades tend to be driven by higher-order factors such as value, operationalised as monetary reward or penalty (Schütz et al., 2012).
Here we use a simple stimulus to dissociate perceptually relevant information in space, to differentiate between bottom-up and task-driven fixations.
Method
Participants
We recruited six volunteer participants (four female, average age 19.66 years, age range 19–22 years), all of whom were naïve to the task, had normal or corrected to normal vision, and were Bournemouth University students. Sample size estimation was based on a pilot experiment (Alley et al., 2019a, 2019b). Their participation was compensated with course credits. The study was approved by the ethics committee of Bournemouth University and conducted in accordance with the 2013 Declaration of Helsinki, except for preregistration.
Stimuli
Participants were presented with a scene (Figure 1A) featuring an elastic object attached to the ceiling in a room with coloured walls. The squared scene measured approximately 25 × 25 degrees of visual angle (dva). The object was rendered in a dynamic sequence of 48 frames, resulting in a 2 s video. At the start of the video, the object began to wobble as a consequence of being poked from behind. Given its top attachment, the vibrations were more pronounced at the bottom. The shape of the object was modelled with Blender (v2.79), using the Bullet physics engine to simulate the wobble and Blender's cycles physically based renderer for simulated reflections.
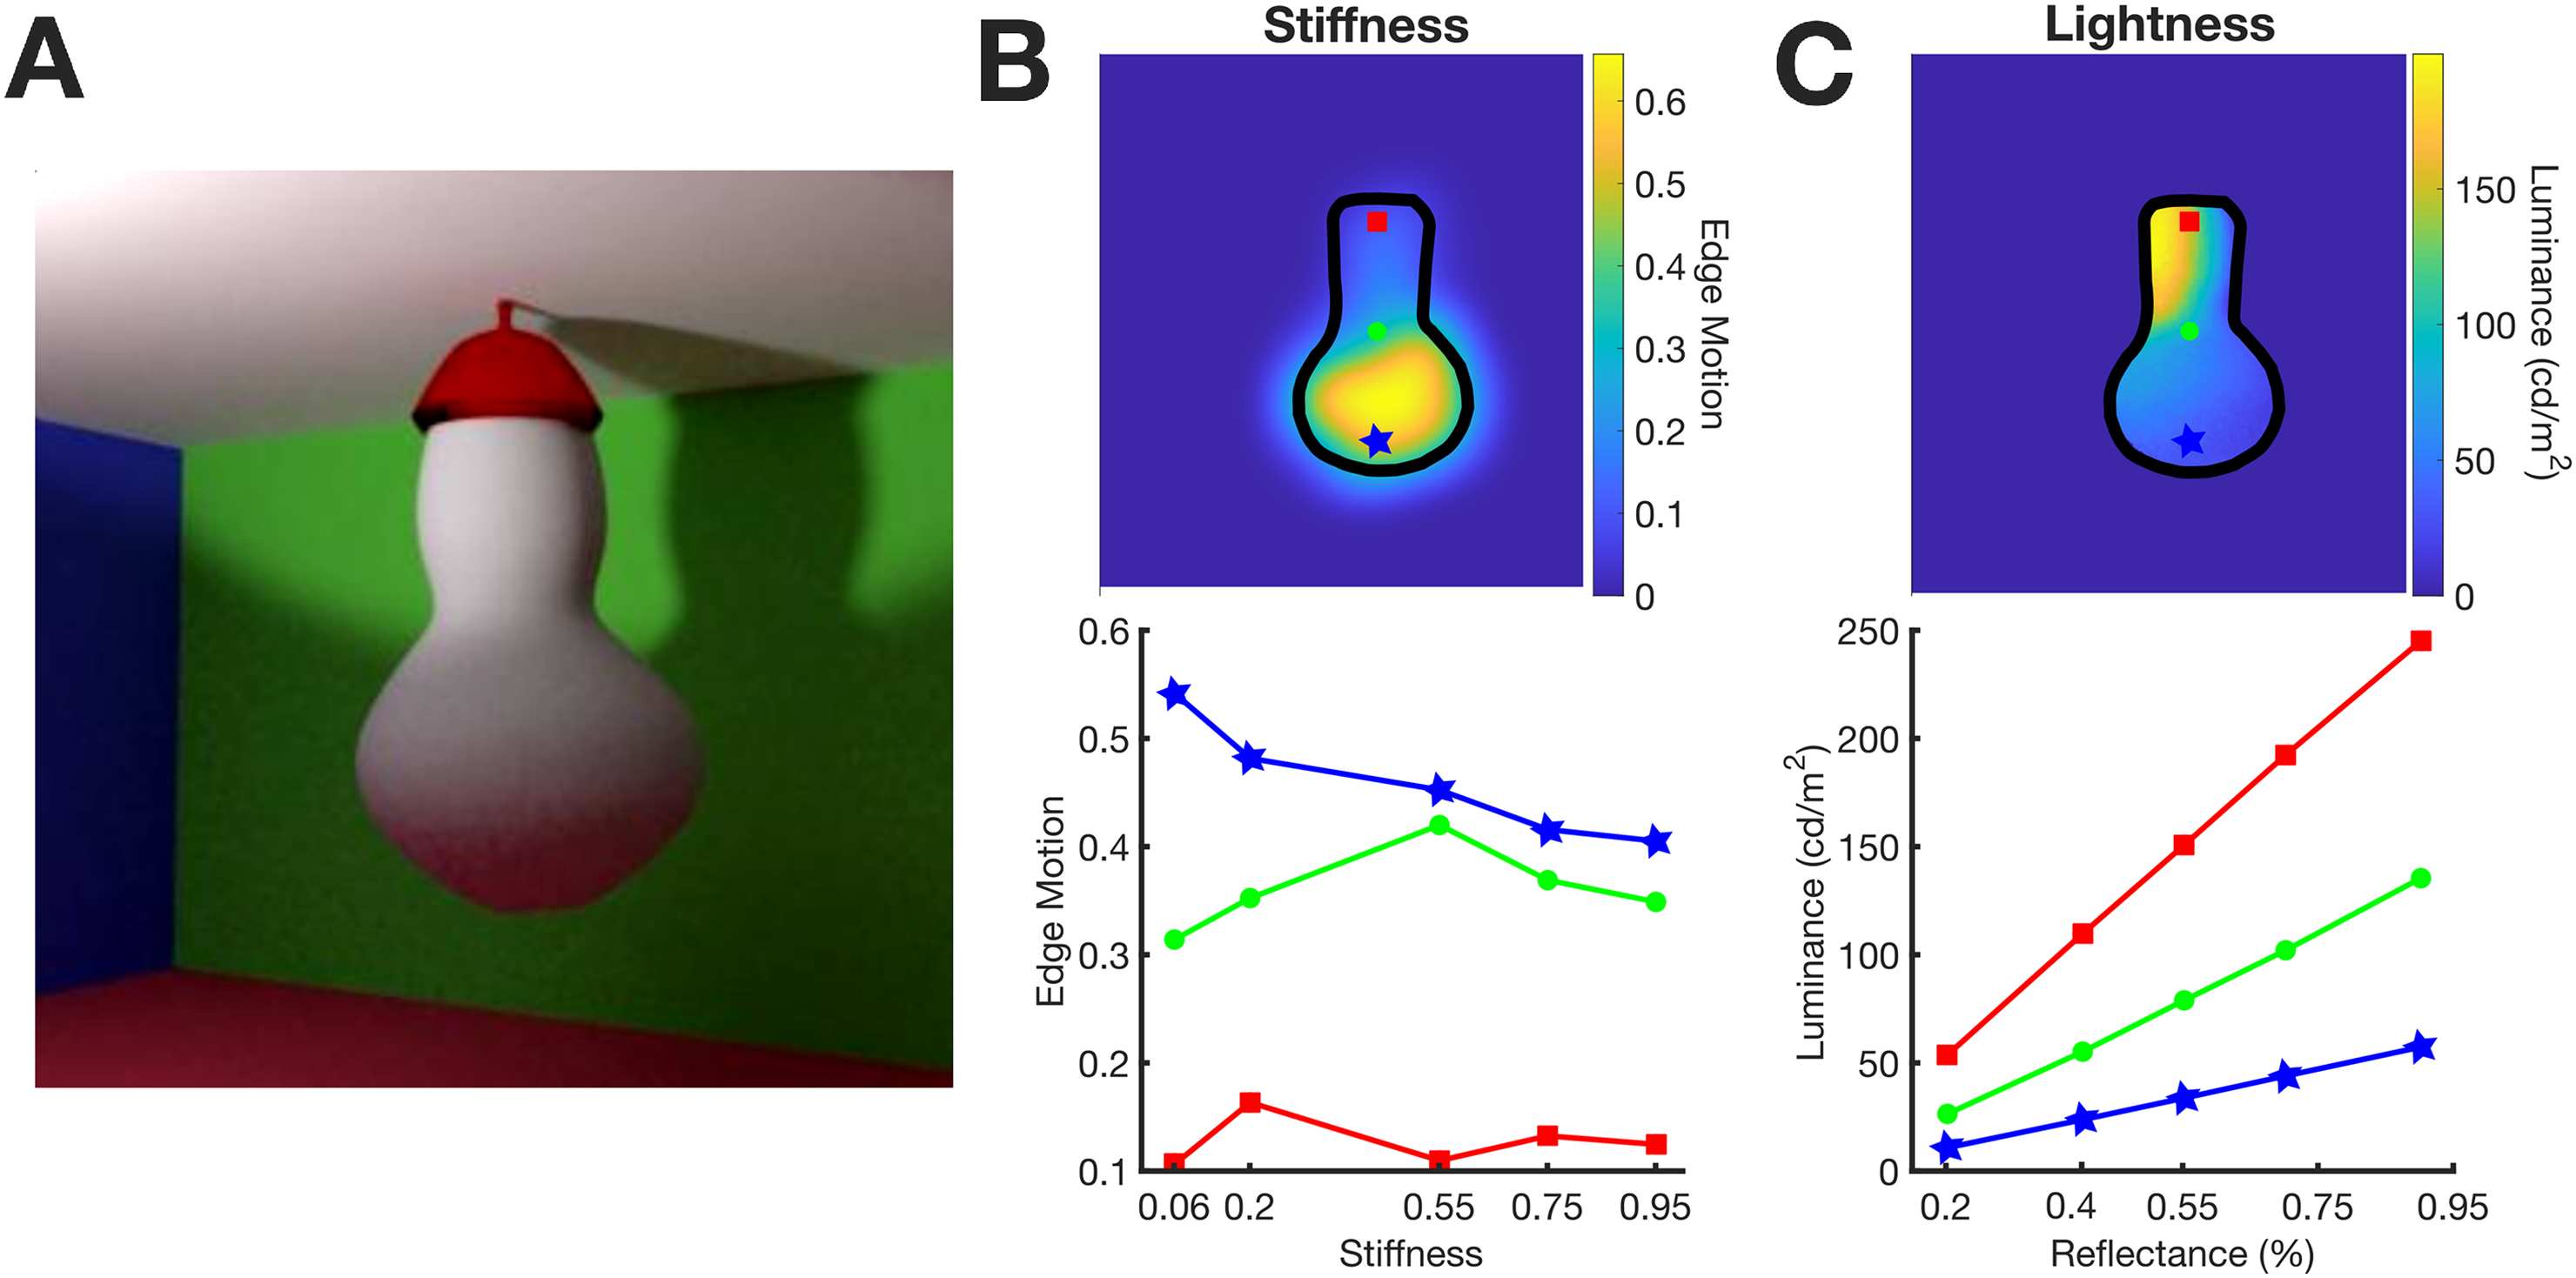
Stimuli. (A) Scene layout. (B) Motion of the stimuli as a function of stiffness and position on the object's surface. Top: Edge motion across the object's surface. Bottom: Edge motion as a function of stiffness for different vertical positions on the stimulus's surface; red point on top, green in the middle and blue on the bottom. (C) Luminance reflected from the object's surface as a function of reflectance and position. Top: Luminance across the object's surface. Bottom: Luminance as a function of reflectance for different vertical positions on the stimulus's surface; red point on top, green in the middle and blue on the bottom. The colours of the data points in the bottom panels correspond to the colours of the points on the top panels.
The wall colours were specified in terms of red–green–blue values representing diffuse reflectance components: red [1 0 0], green [0 1 0], blue [0 0 1], or white [1 1 1] for the ceiling. Our simulated reflections aligned with the Lambertian model, with no specular reflections. We rendered five videos with the object varying in stiffness while maintaining a middle-range albedo (achromatic reflectance) of 55%. Additionally, five videos were created with the object varying in albedo while keeping stiffness at a middle-range value of 0.55. Albedo values used were 20%, 40%, 55%, 70%, and 90%, and stiffness values were set at 0.06, 0.2, 0.55, 0.75, and 0.95. These values were selected following a series of pilot experiments to balance the perceptual tasks’ difficulty level (see procedure).
The layout of the scene was chosen to dissociate the information about albedo and the information about stiffness across the vertical dimension of the object. The top provided more information about the albedo and the bottom about stiffness (Figure 1C).
As an illustration, we quantified the motion information available to participants and how it changes with the stiffness level and vertical position along the stimulus surface (Figure 1B). We applied Canny edge detection to each frame to compute the magnitude of edges. Subsequently, we calculated the standard deviation of the edge magnitude across frames to obtain a measure of how the edges changed over time (Edge Motion). This is evident for one example video in Figure 1B, top image. Edge motion increased from top to bottom, and, as seen in the bottom panel, decreased when stiffness increased. Crucially, this phenomenon occurs specifically for regions on the bottom portion of the object (e.g., the blue point in the illustration), where edge motion is more pronounced. While this information is not utilised in the subsequent analyses, it serves as a clear demonstration that the lower parts of the object convey more information about the object's stiffness. In fact, visual perception of stiffness highly relies on the extent of perceived deformations (Paulun et al., 2017).
The pattern of informativeness across the object is reversed for lightness. Although the object is rendered with a uniform albedo, luminance is higher at the top (Figure 1C—top panel) because the scene is lit from above. According to Lambert's law, in regions where the illumination is stronger, a difference in albedo between two surfaces results in larger differences in luminance than where illumination is weaker. This is evident in the correlation between luminance and albedo (Figure 1C—bottom panel) for both the top and bottom portions of the object's surface (represented by the red, green, and blue dots from top to bottom). The visual system is sensible to such information differences, since lightness appearance (Toscani et al., 2017) and lightness discrimination (Toscani & Valsecchi, 2019) for matte surfaces mostly rely on a surface's brightest portions.
Procedure
Participants engaged in two perceptual tasks: lightness and stiffness judgements.
In each trial, they were presented with two videos sequentially. In the lightness task, participants had to indicate whether the first or the second stimulus (2-interval forced choice [2IFC]) had a “lighter paint.” In the other task, they were asked to determine which one was stiffer.
Participants initially fixated on a fixation point presented on a white screen, positioned where one of the four corners of the scene would appear, and pressed the space bar when ready to proceed. The corner was randomly selected. Then, they viewed the first video for 2 s. This was followed again by a white screen with a fixation point positioned in one of the four corners at random. Once participants fixated it and pressed the space bar the second video was played, also for 2 s. Afterwards, they were required to choose between the first and the second stimulus (Figure 2). While fixating at the fixation point, if the distance between the fixated position recorded by the eye-tracker and the nominal position of the corner was more than 1 dva, a calibration was performed, otherwise a drift correction was performed. We presented the fixation points at the corners rather than at the centre of the stimulus, to let participants direct their first saccade from outside to inside the stimulus.
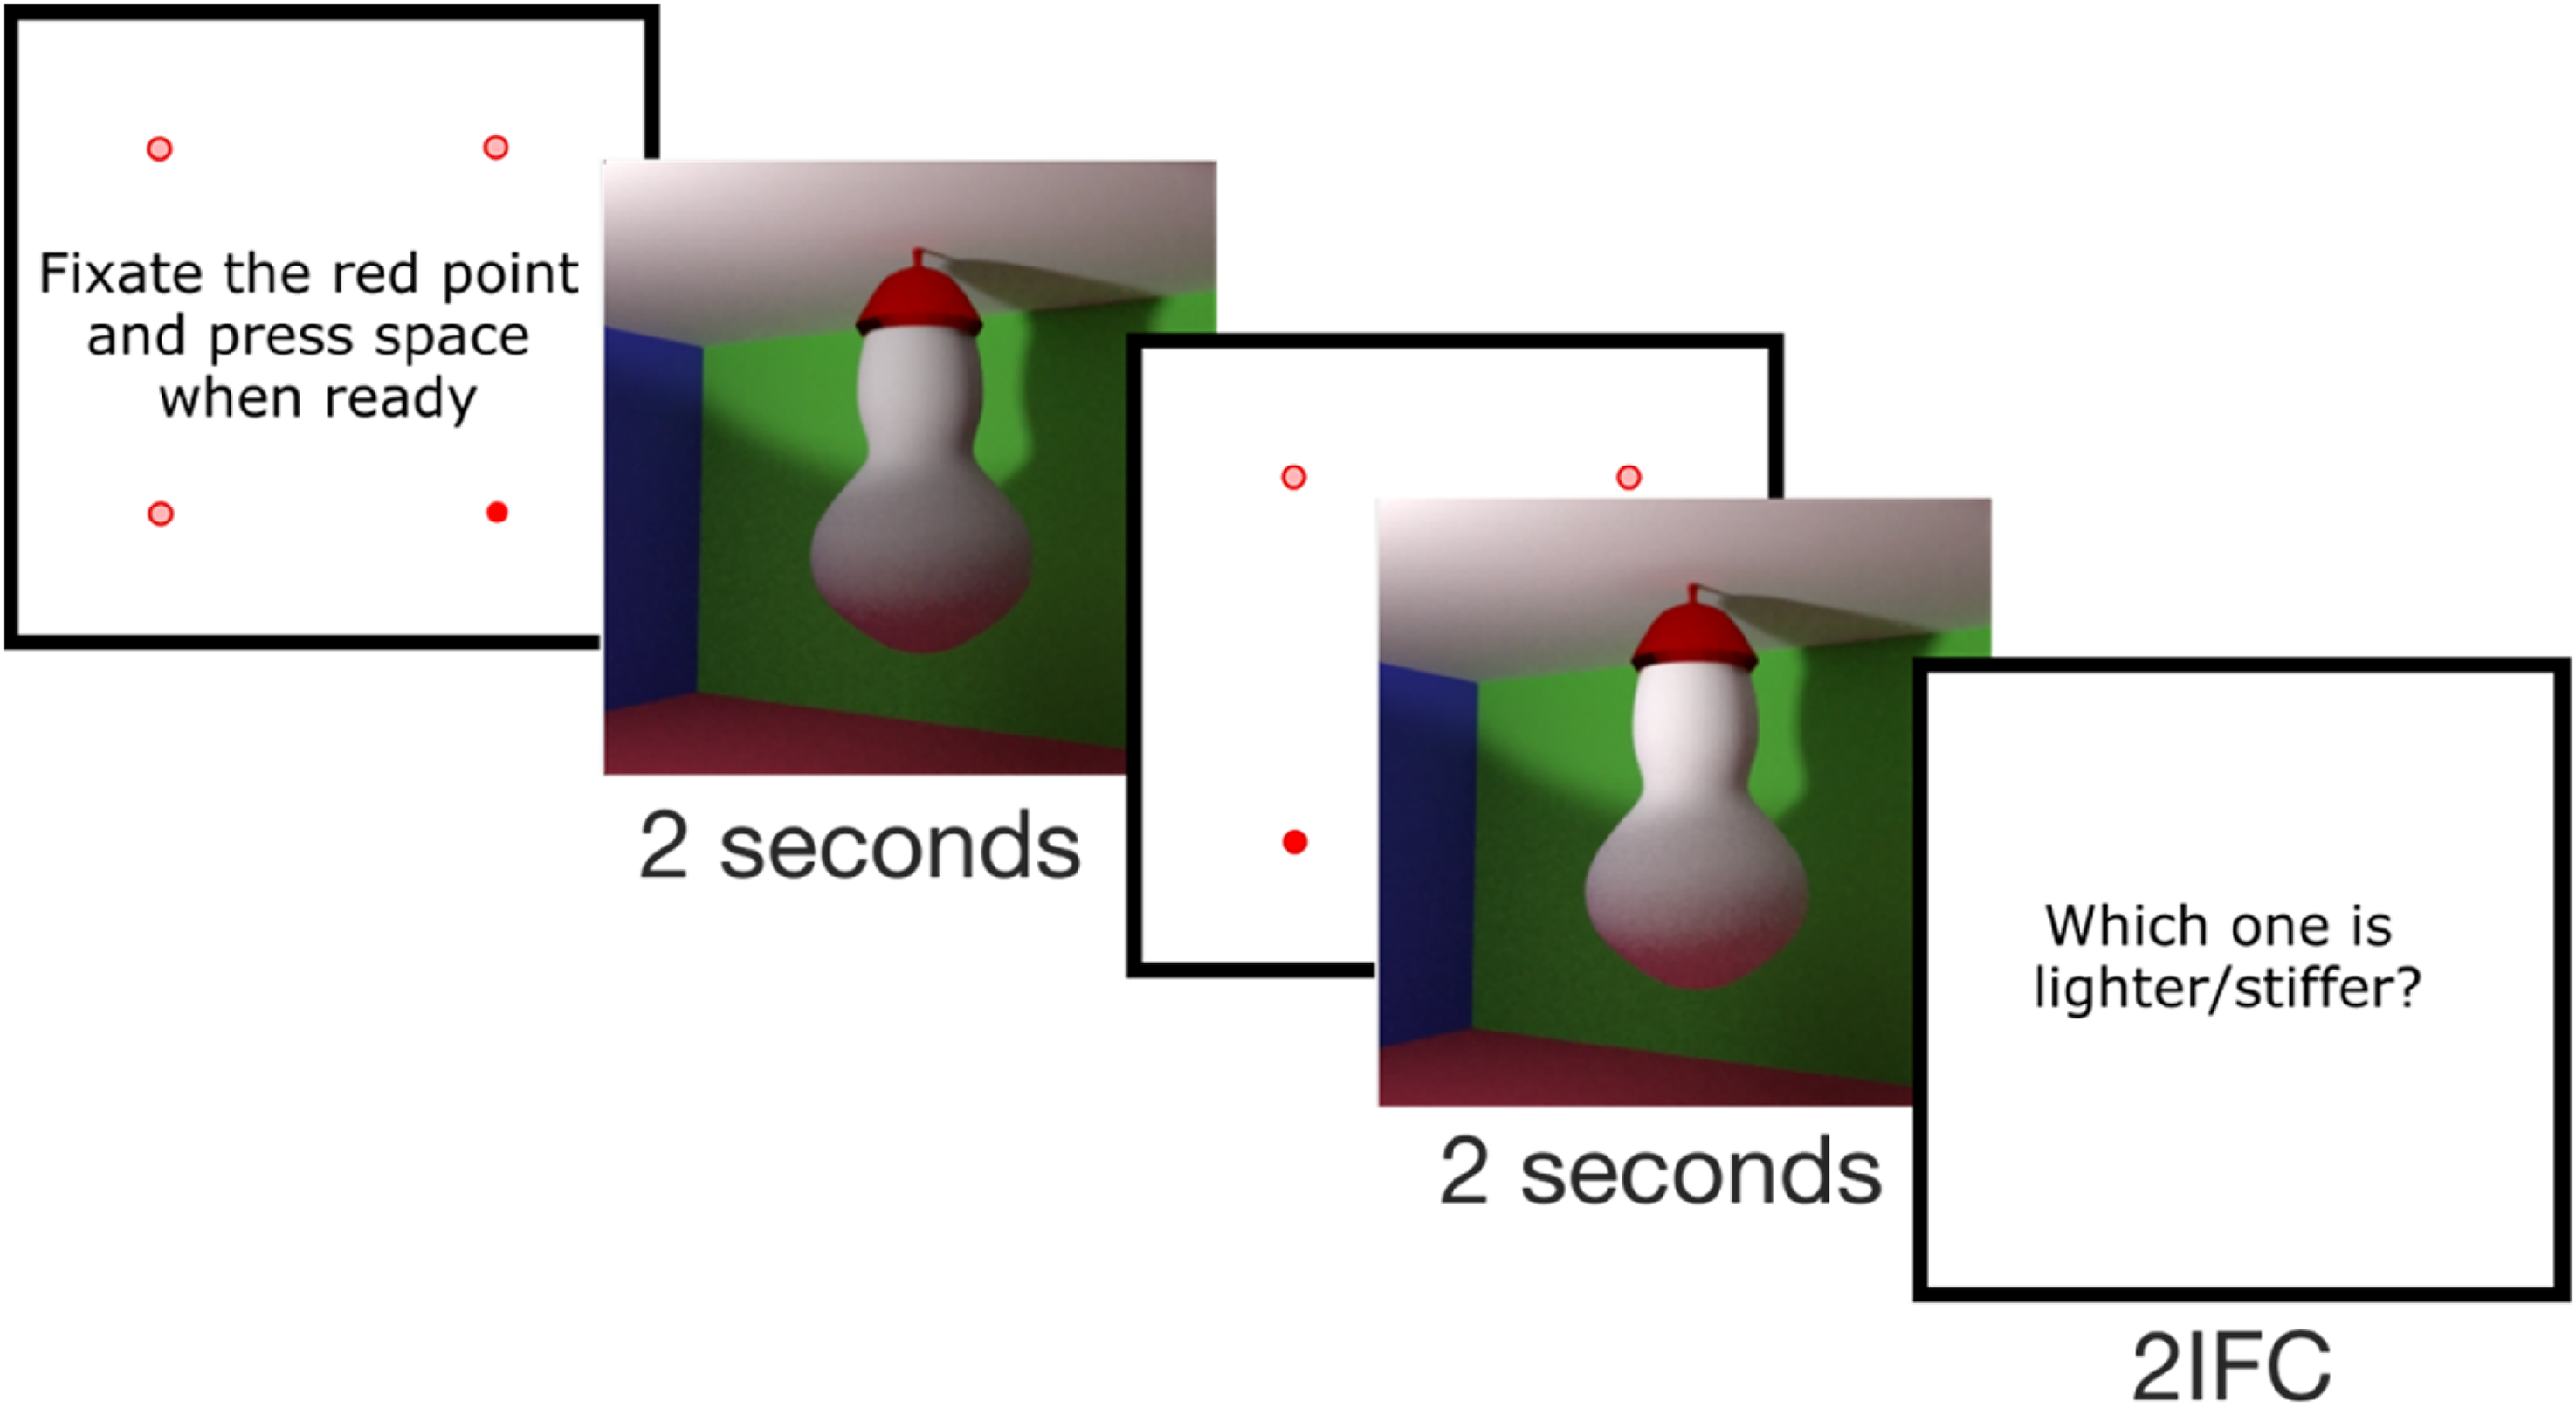
Procedure—2-interval forced choice (2IFC) task.
For each of the two tasks, in every trial, one stimulus (comparison) was chosen to have a middle-range value (55% for lightness, 0.55 for stiffness), while the other stimulus (reference) had one of the other five values, each presented an equal number of times (method of constant stimuli).
We used a blocked design, so that participants did not have to constantly switch between the two tasks. There were two blocks for each task, five levels of stiffness or lightness for the comparison stimulus, and 25 repetitions per level, task and block, for a total of 2 × 2 × 5 × 25 = 500 trials.
Setup
Participants sat comfortably at a table in front of a monitor (1920 × 1080) in a dark room. Head position was controlled via a chinrest. The viewing distance was 58 cm. Participants provided their responses by clicking the left or right mouse button to indicate that the first or second stimulus was stiffer/lighter respectively.
Eye-Tracking Recording
Using a desktop-mounted eye-tracker (EyeLink 1000; SR Research Ltd, Osgoode, Ontario, Canada), gaze position signals were recorded and sampled at 1000 Hz. The display was viewed binocularly, but only the right eye was tracked. We performed a standard calibration procedure at the beginning of each experiment (Toscani et al., 2013b).
Colour Calibration
We used a standard calibration procedure (Gil Rodríguez et al., 2022; Toscani, Gil, et al., 2019) to linearise the screen and make sure that we displayed the desired colour. We measured the gamma curves of each channel and their chromaticity with the Spyder 4 colourimeter (Datacolor, Lawrenceville, NJ). This colourimeter performs at the same level as professional, high-cost photometers (MKII and PR-670) in terms of measurement accuracy (Lin et al., 2023). Our screen had the following chromaticity: red primary CIE xyY coordinate (x: 0.6413, y: 0.3274, Y: 57.61 cd/m2), green (x: 0.3104, y: 0.6256, Y: 256.98 cd/m2), and blue (x: 0.1514, y: 0.0568, Y: 26.2 cd/m2). The gamma exponents were 1.913, 1.567 and 2.096, for the red, green and blue channels, respectively.
Results
Figure 3 shows average fixation densities (A) and vertical gaze position (B) as a function of the task and fixation order. A two-way repeated measures analysis of variance on the vertical component of the gaze position showed a significant interaction between task and fixation order (F(4,20) = 3.12, p = 0.038). The main effect of fixation order (F(4,20) = 0.42, p = 0.793) and task (F(1,5) = 5.53, p = 0.065) were not significant. These results suggest that, following the initial fixations, participants tended to direct their gaze towards higher portions of the stimulus during the lightness task and lower portions during the stiffness task. This happens for all participants, as shown in Figure 3C. After the second fixation, the vertical position averaged across fixation is always higher in the lightness task than in the stiffness task.
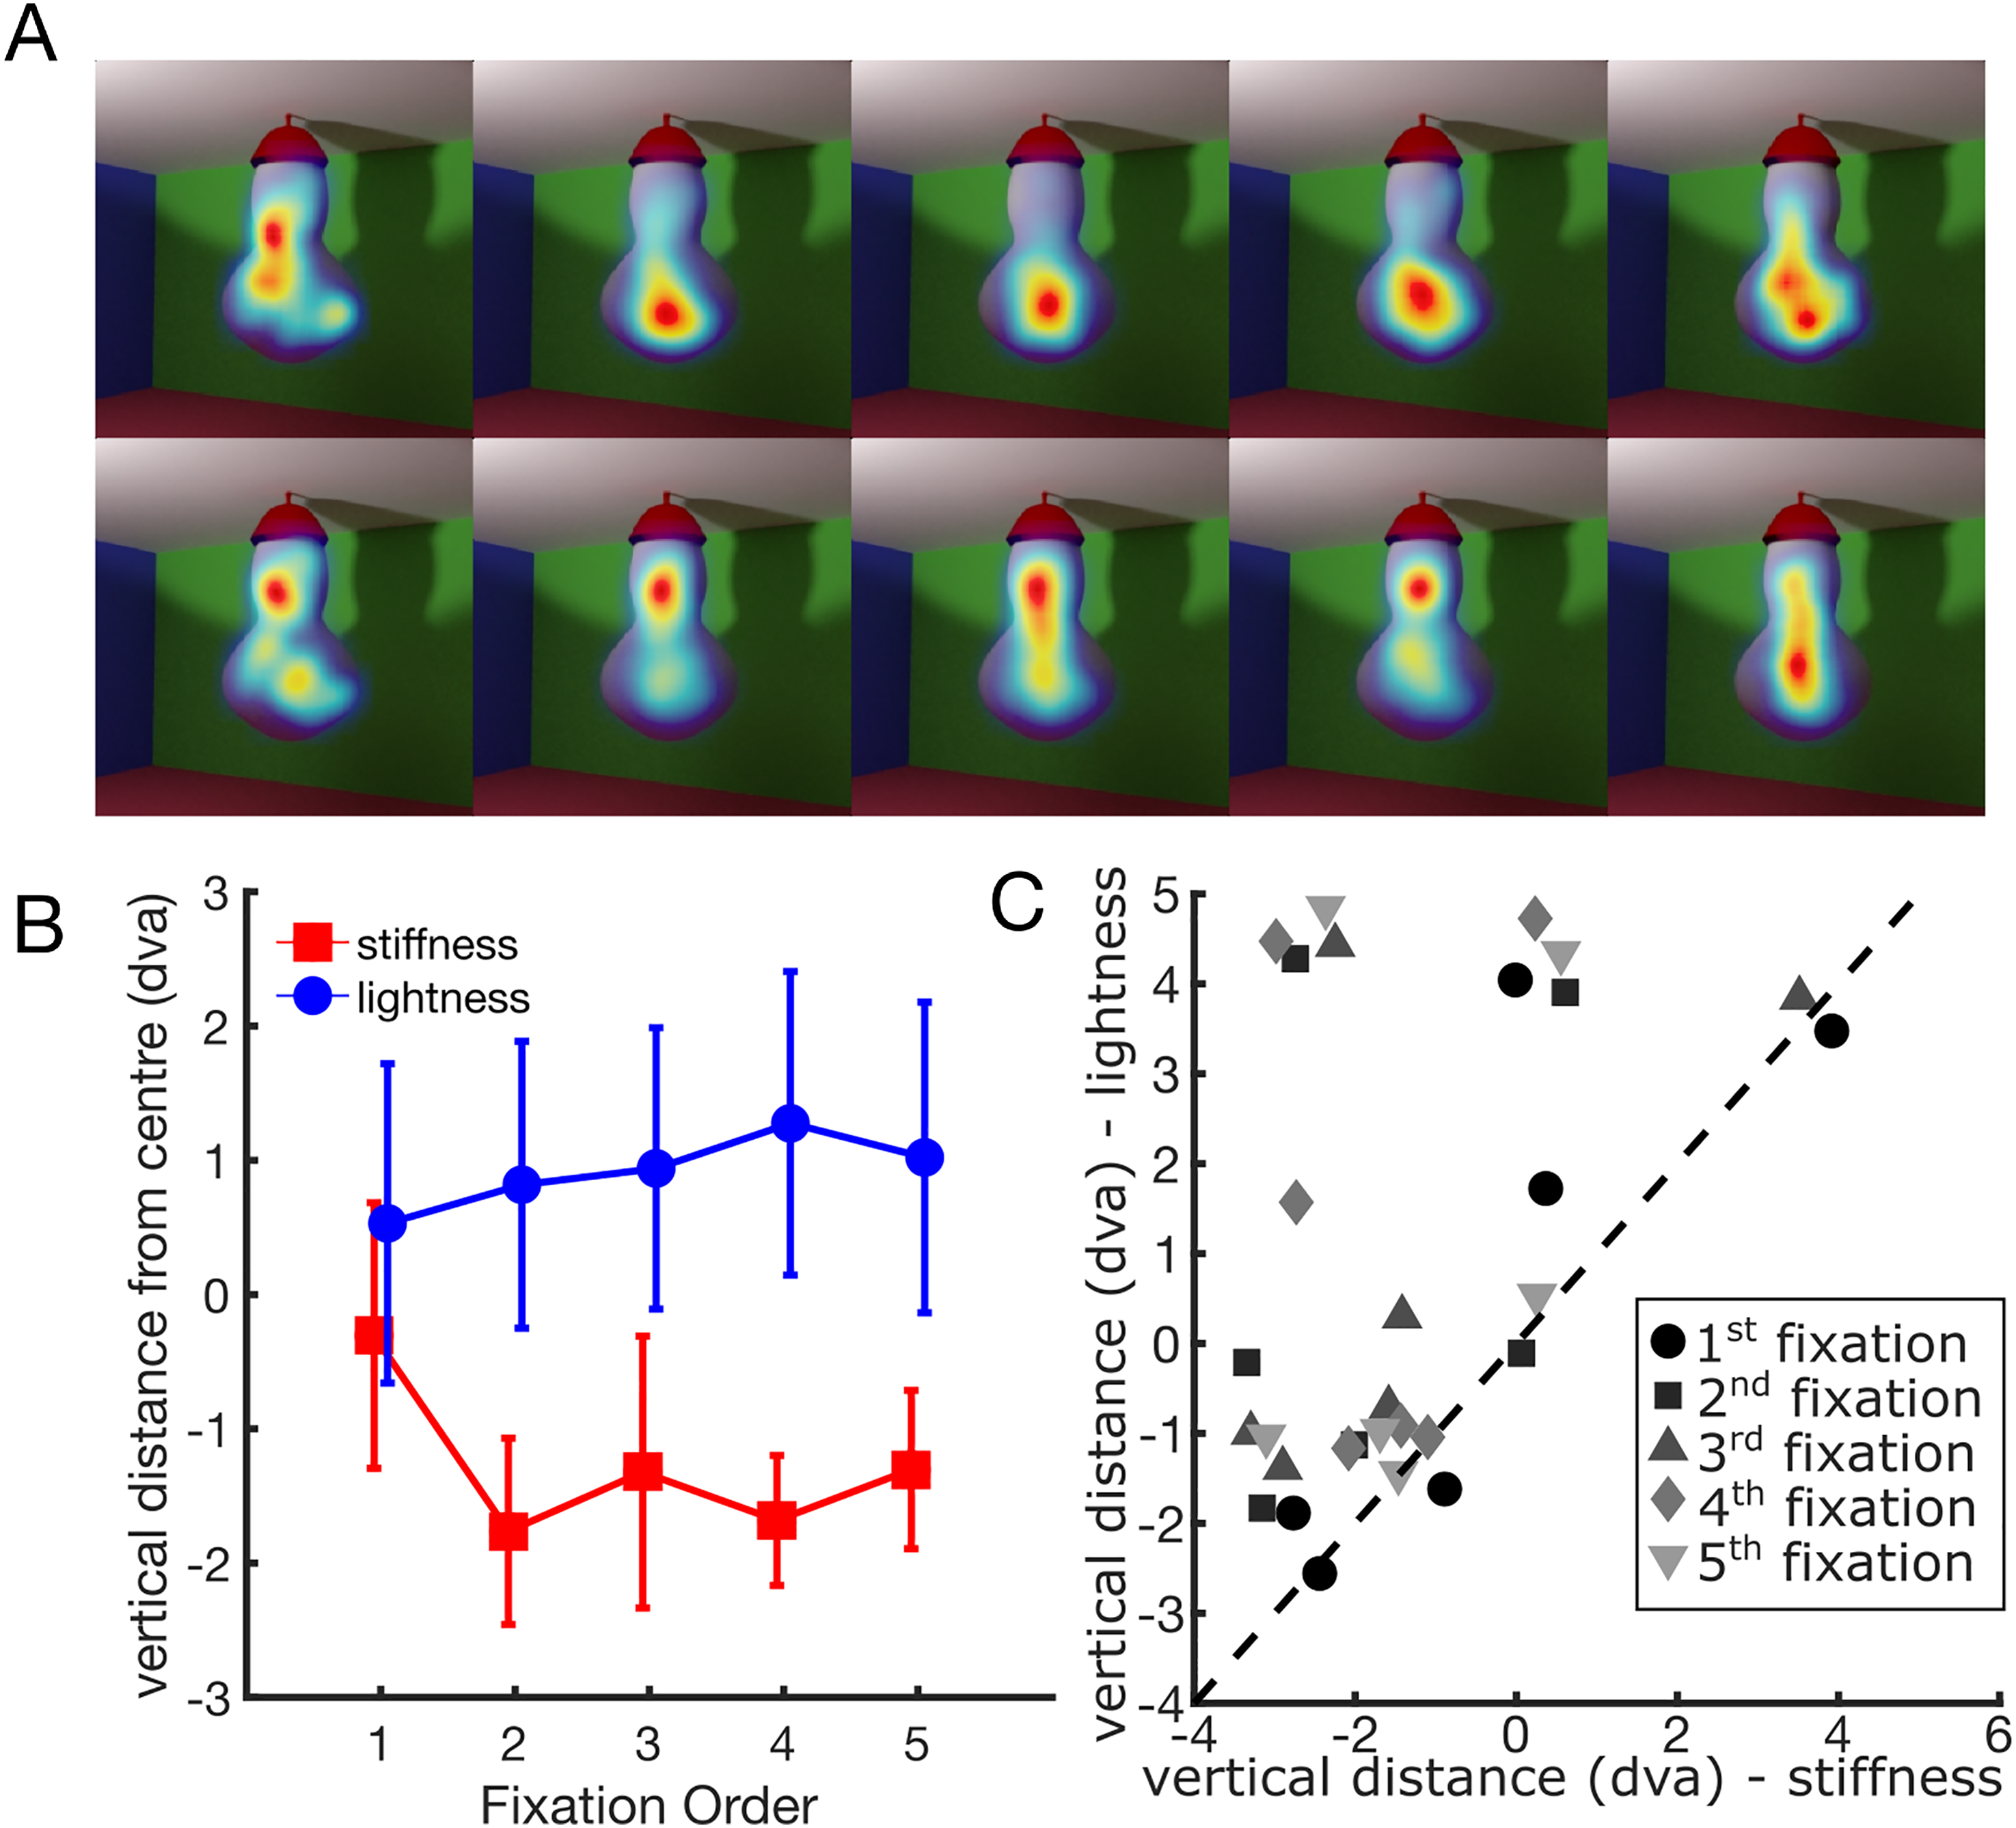
Gaze position as a function of fixation order and task. (A) Average fixation densities in the stiffness task (top) and the lightness task (bottom) for the first five fixations. (B) Vertical gaze position relative to the centre as a function of fixation order and task. Error bars indicate the standard error of the mean. (C) Individual data. Vertical difference from the centre for the lightness task (y-axis) and the stiffness task (x-axis). Each point represents the mean vertical distance for each participant and fixation. Fixation order is represented by different colours and symbols (see legend). The dashed line is the unity line.
We tested the hypothesis that participants would focus more on task-relevant positions during correct trials than incorrect ones. This distinction is evident in Figure 4A.
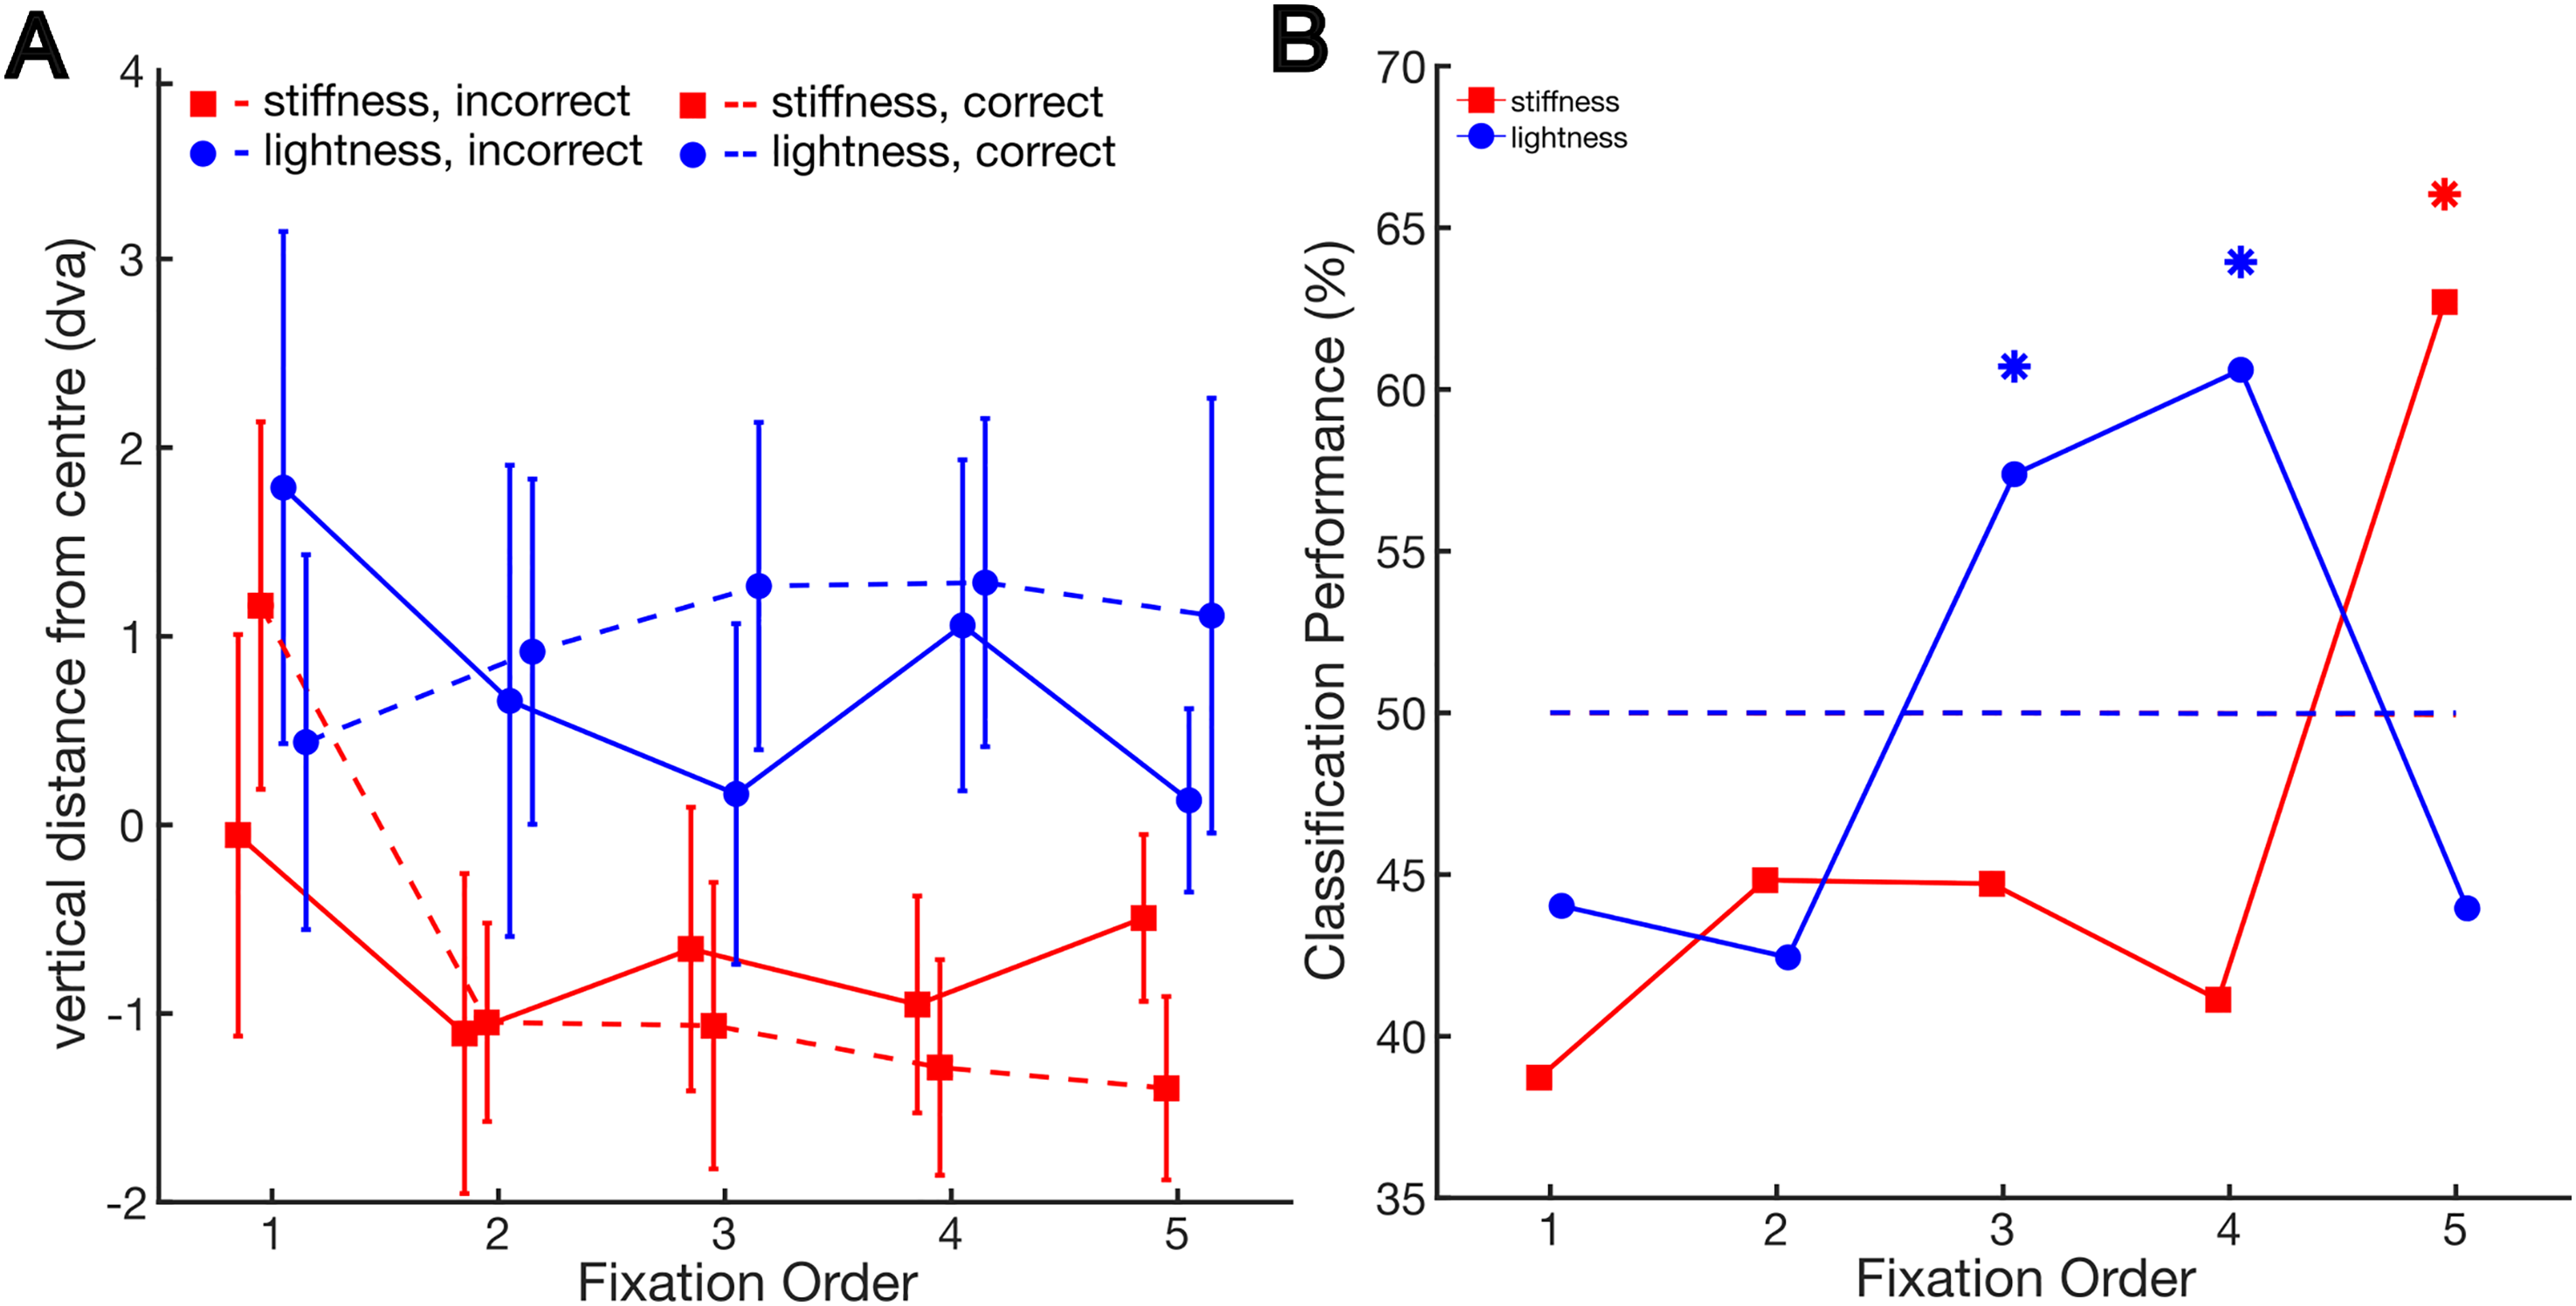
(A) Vertical gaze position relative to the centre as a function of fixation order and the correctness of participants’ responses in the different tasks. Error bars indicate the standard error of the mean. (B) Performance of the classification into a correct or incorrect trial given the average vertical gaze position in the trial as a function of fixation order and task. Stars indicate higher performance than chance, as determined by bootstrap analysis.
In the lightness task, following the initial fixations, participants tended to gaze at higher regions during correct trials compared to incorrect ones. Conversely, in the stiffness task, they tended to direct their attention to lower regions during correct trials.
We tested this on a trial-by-trial basis using a classification analysis. A linear classifier was employed to distinguish between correct and incorrect trials, relying on the average vertical distance from the centre for the fixations in each trial. We left each participant out iteratively, using each one for testing while training with the remaining participants. The performance results are shown in Figure 4B. We used a bootstrap analysis to assess whether performance was higher than chance. To assess this, we evaluated the classification performance under the assumption of no relationship between correct and incorrect trials and the vertical distance from the centre. We achieved this by randomly shuffling the correspondence between these two variables.
Classification performance exceeded the 99.5% confidence interval (alpha = 0.05/10, with Bonferroni corrected for 10 comparisons) of bootstrapped performance under the null hypothesis in the lightness task for the third and the fourth fixations (performance = 57.4%, [45%, 55%]; performance = 60.6%, [44.6%, 55.1%], respectively), and in the stiffness task for the fifth fixation (performance = 62.7%, [40.45%, 58.6%]).
We tested the hypothesis that saccades that took longer to be planned (i.e., longer latency) were more task-driven rather than bottom-up driven, following Schütz and colleagues’ study (Schütz et al., 2012). Saccadic latency is typically defined as the time it takes for an individual's eyes to initiate a saccadic eye movement in response to a new stimulus. In the present experiment, this concept specifically applies to the saccade leading to the first fixation. The time taken to plan the saccades leading to the subsequent fixations is accounted for by the duration of the previous fixation. Therefore, we used the duration of the previous fixation as a measure of latency. We classified each fixation as high or low latency by median splitting based on the latency of the preceding saccade.
Figure 5A shows that in the lightness task, for fixations following high-latency saccades, participants tended to gaze at higher regions compared to lower latency saccades. Conversely, in the stiffness task, they tended to direct their attention to lower regions when latency was high, at least for the fifth fixation. This is consistent with the hypothesis that saccades that took longer to be planned (i.e., longer latency) were more task-driven rather than bottom-up driven.
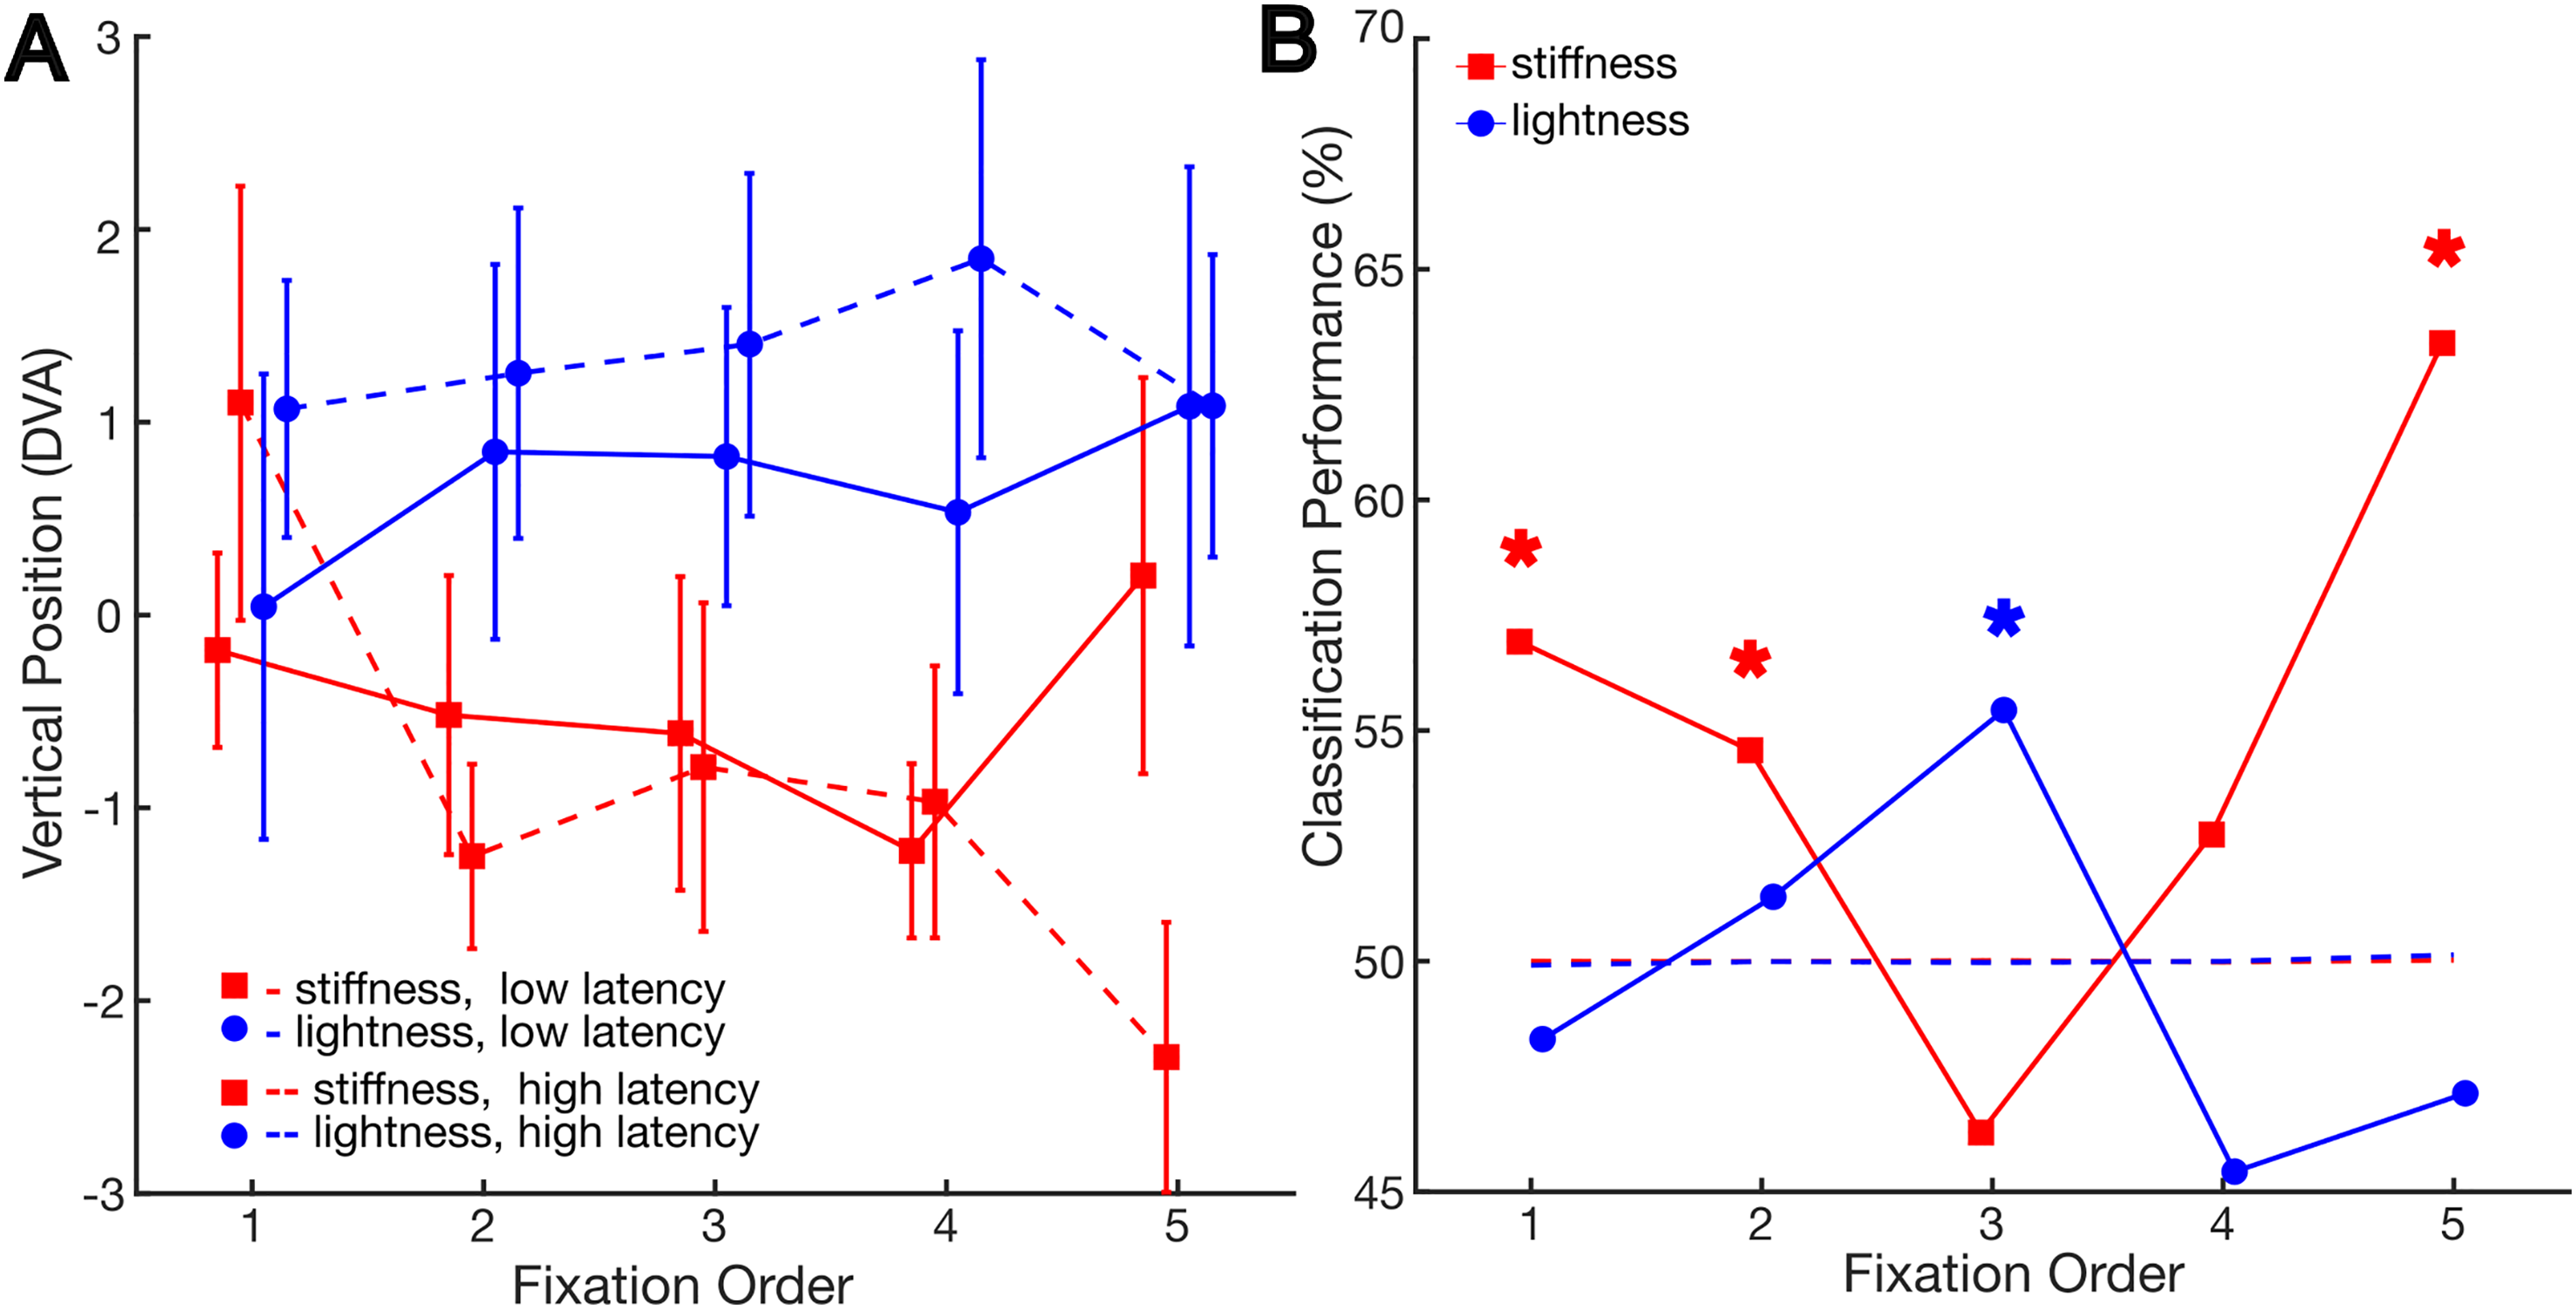
(A) Vertical gaze position relative to the centre as a function of fixation order and saccade latency in the different tasks. Error bars indicate the standard error of the mean. (B) Performance of the classification into a high- or low-latency saccade given the average vertical gaze position in the trial as a function of fixation order and task. Stars indicate higher performance than chance, as determined by bootstrap analysis.
Again, we tested this on a trial-by-trial basis using a classification analysis. The performance results are shown in Figure 5B. For the stiffness task, performance was higher than the chance for the first, second and fifth fixations (performance = 56.9%, [49.77%, 50,23%]; performance = 54.57%, [45.58%, 54.42%], and performance = 63.4%, [42.77%, 57.23%], respectively). It is visible in Figure 5A that for the first fixation, the result is inverted with respect to the other fixations. For the lightness task, performance was higher than chance for the third fixation (performance = 55.45%, [47.4%, 52.6%]).
Overall, the results show a tendency for fixations with longer latency to be directed towards task-relevant regions for both tasks. However, this pattern is not entirely consistent across fixations order.
Discussion
Here we found that fixation behaviour varies depending on the perceptual task. Crucially, these variations are primarily associated with later fixations and those that follow saccades with a high latency. Initially, fixations tend to target the centre of an object, regardless of the task being performed. In fact, objects are important predictors for recent bottom-up saliency models (Kümmerer et al., 2016) and we tend to look at their centre (Henderson, 1993). It was also shown that participants generally tend to fixate in the centre of the scene (Kadner et al., 2023; Tatler, 2007; Tatler et al., 2011). As in our stimuli, the centre of the object coincides with the centre of the scene, so the first fixation might also reflect this centre bias. However, there is no clear prediction from bottom-up saliency in our stimulus as both the top (being the brightest part) and bottom (being in motion) would be salient as well. We assume that initial fixations are driven by bottom-up saliency because there is no difference between the stimuli in the two tasks, however, it is also possible that they are driven by both tasks in the same way. Similarly, when saccades have low latency, the resulting fixations do not show a significant dependence on the task. However, subsequent fixations and those that follow longer latency saccades tend to land on brighter regions at the top of the object when participants are comparing the lightness of stimuli, and on lower portions of the object when comparing their stiffness. Our results further contribute to the notion that task-driven eye movements need a longer time to be planned, whereas initial fixations or fixations following short latency saccades are more automatic. To the best of our knowledge, our study is the first one to separate bottom-up and top-down driven fixations based on their order, although it is known that bottom-up saliency models work best in predicting initial fixations (Foulsham & Underwood, 2008; Parkhurst et al., 2002). Also, while it was shown that long-latency saccades tend to be driven by top-down factors such as value (Schütz et al., 2012), we are the first ones to show that long-latency saccades are also finely tuned to the perceptually relevant properties of visual scenes.
We showed that task-related differences in fixation position are more pronounced in correct trials than in incorrect trials, suggesting that task-driven fixations effectively sample perceptually relevant information for each of the tasks. In fact, the brightest regions are particularly informative about a surface's lightness and humans use them to judge the lightness and the colour of objects (Hedjar et al., 2023; Toscani et al., 2013a, 2016, 2017; Toscani & Valsecchi, 2019). Similarly, the bottom regions of our stimulus are the ones that deformed most in response to the perturbation, and there is evidence that visual perception of the stiffness of non-rigid surfaces depends on simple heuristics based on the amount of deformation (Paulun et al., 2017). However, our results are only correlational: future research could use a gaze-contingent display to effectively manipulate fixation behaviour and assess its causal influence on perceptual performance.
After the first fixation, we computed latency as the duration of the fixation before the saccade. This is because the time to plan the saccades leading to a subsequent fixation is part of the duration of the previous fixation. However, during a fixation, the visual system is not only planning the next saccade, but also processing the incoming information. In fact, fixation duration increases when luminance and colour information are reduced (Henderson et al., 2013; Ho-Phuoc et al., 2012; Nuthmann & Malcolm, 2016; Walshe & Nuthmann, 2014), presumably to compensate for the missing information. This means that with our measure, latency and information processing are confounded. Future experiments can be designed to investigate latency alone, for instance with a task involving a single fixation (Schütz et al., 2012).
Footnotes
Acknowledgments
This study is based on a pilot experiment performed at the Justus Liebig University of Giessen as part of the doctoral work of Lorilei Alley (Alley et al., 2019a, ![]() ). We thank our Research Assistants, Alex Perera, Erica Reynolds, Faith Murray, Kameliya Krachunova, Melody Hannah, Rifah Maryam and Vidushi Rampat, for their excellent work with data collection.
). We thank our Research Assistants, Alex Perera, Erica Reynolds, Faith Murray, Kameliya Krachunova, Melody Hannah, Rifah Maryam and Vidushi Rampat, for their excellent work with data collection.
Author contribution(s)
Declaration of Conflicting Interests
The authors declared no potential conflicts of interest with respect to the research, authorship, and/or publication of this article.
Funding
The authors received no financial support for the research, authorship, and/or publication of this article.