
Abstract
One of key mechanisms implicated in multisensory processing is neural oscillations in distinct frequency band. Many studies explored the modulation of attention by recording the electroencephalography signals when subjects attended one modality, and ignored the other modality input. However, when attention is directed toward one modality, it may be not always possible to shut out completely inputs from a different modality. Since many situations require division of attention between audition and vision, it is imperative to investigate the neural mechanisms underlying processing of concurrent auditory and visual sensory streams. In the present study, we designed a task of audiovisual semantic discrimination, in which the subjects were asked to share attention to both auditory and visual stimuli. We explored the contribution of neural oscillations in lower-frequency to the modulation of divided attention on audiovisual integration. Our results implied that theta-band activity contributes to the early modulation of divided attention, and delta-band activity contributes to the late modulation of divided attention to audiovisual integration. Moreover, the fronto-central delta- and theta-bands activity is likely a marker of divided attention in audiovisual integration, and the neural oscillation on delta- and theta-bands is conducive to allocating attention resources to dual-tasking involving task-coordinating abilities.
In our environment, we are constantly confronted with an abundance of information. Much of this information originates from identical sources and is redundant or complementary. These inputs through our multiple sensory systems need to be processed and integrated. Multisensory processing allows us to organize this information. One of key mechanisms implicated in multisensory processing is neural oscillations in distinct frequency bands (Keil & Senkowski, 2018). Evidence is now emerging that neural oscillations in distinct frequency bands reflect different mechanisms of multisensory processing, that is, feed-forward-feedback processing, attention modulation, and predictive coding in multisensory processing (Keil & Senkowski, 2018). Oscillatory neural activity recorded by electroencephalography (EEG) can be understood as the synchronous waxing and waning of summed postsynaptic activity of large neural populations (Keil & Senkowski, 2018; Wang, 2010). The resulting waveform can be decomposed into different frequency components with distinct amplitudes and phases (Mitra & Pesaran, 1998). Different types of oscillatory responses, which reflect different aspects of neural synchronization, can be distinguished (Jones, 2016; Tallon-Baudry & Bertrand, 1999).
Rapid progress in electrophysiological research has extended our knowledge of the cortical mechanisms underlying bottom-up, stimulus-driven information processing. In addition, recent research has shed light on the influence of top-down processes, such as attention, on multisensory perception and the underlying neural processes. Attention is an essential cognitive function that allows humans and other animals to continuously and dynamically select particularly relevant stimuli from all the available information present in the external or internal environment, so that greater neural resources can be devoted to their processing (Talsma et al., 2010). Talsma et al. used event-related potentials (ERPs) to evaluate the role of attention in integrating visual and auditory features of multisensory objects (Talsma & Woldorff, 2005). They asked the subjects to attend to auditory and visual stimuli simultaneously in a bimodal audiovisual stimulus, and found multiple stages at which attention can modulate multisensory-integration processes, indicating a joint contribution between endogenous and stimulus-driven mechanisms (Talsma & Woldorff, 2005). Tang et al. proposed a framework in which attention modulates multisensory processing in both endogenous (goal-driven) and exogenous (stimulus-driven) ways (Tang et al., 2016). They suggested that endogenous attention acts on multiple levels of multisensory processing to determine the extent to which simultaneous stimuli from different modalities can be integrated (Tang et al., 2016). Additionally, they proposed that integrated multisensory events can capture attention efficiently, even in complex circumstances, due to their increased salience compared to unimodal events (Tang et al., 2016). Peng et al. measured neural activity using EEG while participants performed an auditory selective attention task (Peng et al., 2023). They found that endogenous and stimulus-driven mechanisms co-operate to select relevant spatial locations for multisensory processing (Peng et al., 2023). A large number of ERP studies have shown that the human brain is selective, highly effective in relatively attenuating the further processing of irrelevant stimuli (Corbetta & Shulman, 2002; Grent-’t-Jong & Woldorff, 2007; Moore et al., 2003; Talsma et al., 2010; Woldorff et al., 2004; Yantis & Serences, 2003). Odegaard et al. investigated how selective attention impacts sensory precision and integration using spatial and temporal tasks (Odegaard et al., 2016). They found that selective attention improved precision of visual sensory representations but not auditory sensory representations. They concluded that a sensory modality must possess a certain degree of encoding precision to benefit from selective attention (Odegaard et al., 2015). A fronto-parietal network of brain areas has been proposed to be involved in allocating and controlling the direction of top-down attention by sending control signals that modulate the sensitivity of neurons in sensory brain regions (Corbetta & Shulman, 2002; Grent-’t-Jong & Woldorff, 2007; Moore et al., 2003; Talsma et al., 2010; Woldorff et al., 2004; Yantis & Serences, 2003). Many studies explored the modulation of selective attention by recording the EEG signals when subjects attended one modality, such as auditory or visual stimulus, and ignored the other modality input (Wijers et al., 1996; Woldorff et al., 1993; Woldorff & Hillyard, 1991). Mozolic et al. investigated the effects of modality-specific selective attention on multisensory integration (Mozolic et al., 2008). They found that attention to a single sensory modality limits processing of stimuli in the unattended sensory modality, resulting in a reduction of performance enhancements produced by semantically matching multisensory stimuli (Mozolic et al., 2008).
However, when attention is directed toward one modality, it may not always possible to shut out completely inputs from a different modality (Talsma et al., 2010). Moreover, in tasks that do not entail distracting information in one sensory modality, it is often advantageous to share attention between multiple, concurrent sensory inputs (Talsma et al., 2010; Wozny et al., 2016). So many situations require division of attention between audition and vision, it is imperative to investigate the neural mechanisms of divided attention underlying processing of concurrent auditory and visual sensory streams (Talsma et al., 2010; Wozny et al., 2016). Divided attention is a term used to describe the mental state where people try to focus on multiple things. Over the years, scientists have been very interested in the human ability to multitask in this way, and several studies have been performed to test the limitations and mechanics of attention splitting. Divided attention primarily modulated lower-frequency oscillations in a more widespread cortical network, presumably reflecting top-down control (Keil & Senkowski, 2018; Wozny et al., 2016). However, to date, it is not well understood how divided attention modulates on audiovisual integration through ongoing neural oscillations in lower-frequency bands.
Under the assumption that the electrical activities summat at the scalp, one can sum the ERP responses elicited by auditory-only (A) and visual-only (V) objects together and compare the sum of the combined (A + V) waveform to ERPs elicited by true audiovisual objects (AV) that are composed of the same auditory and visual components as the unisensory objects (Giard & Peronnet, 1999; Stein & Meredith, 1993). The effects of audiovisual integration are expected to be found as differences between the AV and A + V waveform, which can simply be expressed mathematically as [AV−(A + V)]. In the present study, we designed a task of audiovisual semantic discrimination, in which the subjects were asked to share attention to both auditory and visual stimuli. By manipulating the location of stimuli, we obtained the EEG data for attended and unattended audiovisual integration [AV−(A + V)] based on the method above mentioned. And then, the waveform was dissected into delta-, theta-, alpha-, and beta-bands, exploring the contribution of neural oscillations in lower-frequency band to the modulation of divided attention on audiovisual integration.
Materials and Method
Participants
Twenty-three healthy volunteers (17 female, age range 16–26 years, mean age 22 years) participated in this study. All participants were right-handed and had normal or corrected-to-normal vision and normal hearing. The experimental protocol was approved by the Ethics Committee of Northeast Electric Power University. After fully explaining the study, all participants provided written informed consent. All the methods were conducted in accordance with the approved guidelines.
Stimuli and Tasks
Twenty outline drawing figures obtained from the international common Snodgrass-Vanderwart white-black line graphic library (Shams & Beierholm, 2010) were used as unimodal visual stimuli (V stimuli, 6.0 cm × 4.8 cm, subtending a visual angle of approximately 4.3°, and a duration of 300 ms). All figures were processed using Adobe Illustrator (Adobe Systems Inc., SAN Jose, CA). The selected pictures contained two groups of animate (e.g., cat, dog, frog, bird) and inanimate objects (e.g., bell, clock, car, gun) (Gibson & Maunsell, 1997). The V stimulus was presented on the left or right side of the screen at an angle of approximately 6° from a centrally presented fixation point located 90 cm directly in front of the participants’ eyes. The unimodal auditory stimuli (A stimuli, 16 bit, 44 kHz sampling rate, and duration of 300 ms including 10 ms rise and fall periods) included sounds corresponding to the visual stimuli (e.g., the sound of a cat “meowing,” the sound of a bell “ringing”). All sound files were downloaded from https://www.findsounds.com and modified with audio editing software (Audacity version 2.3.0, https://www.audacityteam.org/). The A stimulus was presented through one of the two speakers placed on either side of the computer monitor. The bimodal audiovisual (AV) stimuli consisted of temporally, spatially, and semantically congruent A and V stimuli (semantically identical auditory and visual stimuli are presented simultaneously in time, and spatially, visual stimuli were presented on the left/right side of the fixation in screen, while auditory stimuli were presented through the left/right speaker). Here, the audiovisual stimuli contain pictures and sounds that are consistent in time, space and semantics in order to ensure that the brain fully integrates the visual and auditory stimuli, as shown in Figure 1A. To maintain participant attention during the experiment, stimulus difficulty was modified by weighted averaging the original pictures and sounds with random noise images of identical size or noise sounds of identical length (Gibson & Maunsell, 1997). The inter-stimulus interval varied randomly between 750 and 1250 ms.
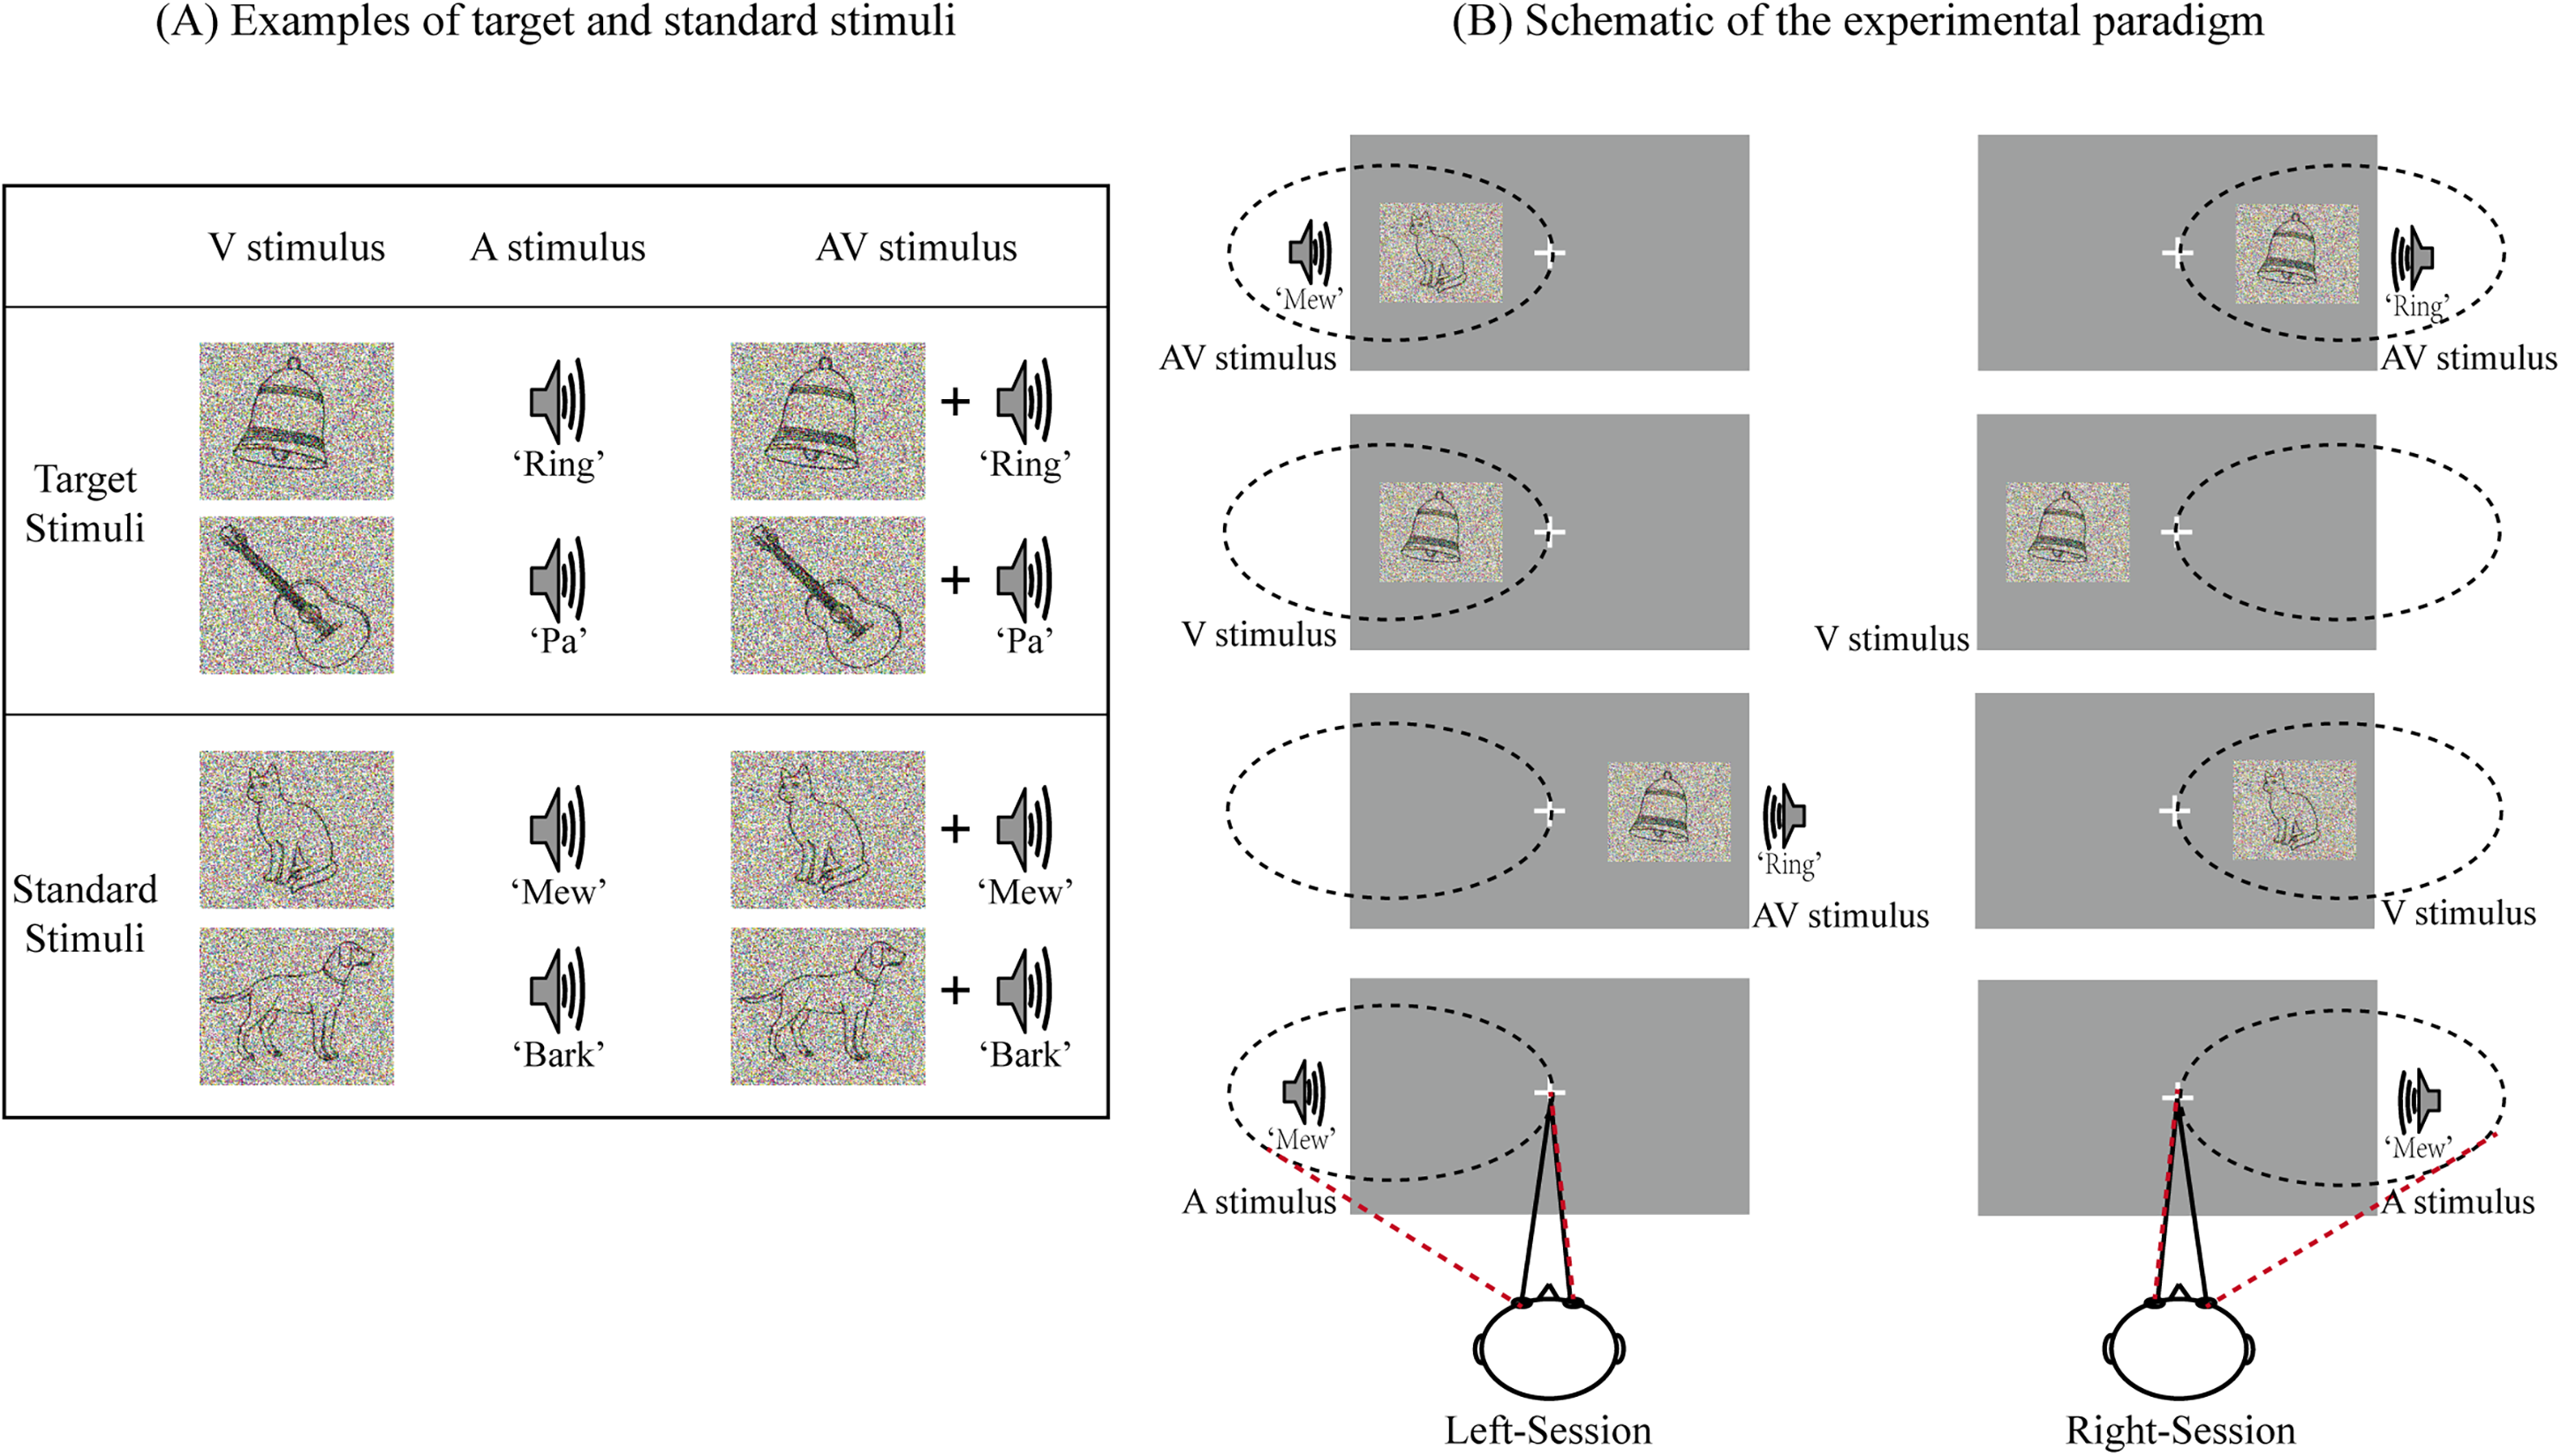
Experimental design. (A) Examples of target and standard stimuli. (B) Schematic of the experimental paradigm. In left-session, the participants were required to attend to the stimuli presented on the left side and ignore those on the right side. In right-session, the participants were required to attend to the stimuli presented on the right side and ignore those on the left side. The semantic pictures and sounds were selected randomly in the stimulus set of each session, which were different from each other.
The experiment was conducted in a dimly lit, sound-attenuated, electrically shielded room. Each participant was required to perform eight sessions. Each session included 40 A, 40 V, and 40 AV stimuli. The stimuli containing animate pictures and/or animate sounds were regarded as standard stimuli, while those containing inanimate pictures and/or inanimate sounds were regarded as target stimuli. The frequency was 20% for A, V, and AV target stimuli (there would be 4 A, 4 V, and 4 AV target stimuli presented on left side, and other 4 A, 4 V, and 4 AV target stimuli presented on right side in each session). Each type of stimulus (2 (standard and target) × 3 (A, V, and AV)) was presented with equal probability on the left and right sides of the screen according to a pseudorandom sequence, as shown in Figure 1B.
Participants were seated in a comfortable chair with their head position fixed using a chin rest. After providing task-specific instructions, the participants were asked to complete several practice blocks, and we considered that an accuracy of above 80% meant that participants understood the task. To avoid movement artifacts, participants were further instructed to minimize blinking and bodily movements. During the experiment, the participants were required to fix their eyes on a centrally presented fixation point and to attend to the stimuli on one side while ignoring all stimuli on the opposite side. The task was to press the left button of a computer mouse with the right hand as quickly and accurately as possible when hearing and/or seeing the target stimulus. Participants were asked to attend and respond to target stimuli on the left side in four sessions (named as left-sessions), and to attend and respond to target stimuli on the right side in the other four sessions (named as right-sessions), as shown in Figure 1B. The two types of sessions were conducted in an alternating manner. All participants could take a 5 min break between sessions. The stimulus that presented on left side in left-sessions and that presented on right side in right-sessions was attended A, V, or AV. In contrast, the stimulus that presented on left side in right-sessions and that presented on right side in left-sessions was unattended A, V, or AV.
EEG Recordings and Data Prepossessing
Stimulus presentation was controlled using a personal computer running Presentation 0.71 (Neurobehavioral Systems Inc., Albany, CA). A SynAmps2 system (Neuroscan Inc., Melbourne, Australia) was used to record EEG signals through 64 electrodes mounted on an electrode cap. The AFZ was used as a ground, and all signals were referenced to the left mastoid. Horizontal eye movements were recorded using a pair of horizontal electrooculography (EOG) electrodes placed at the outer canthi of the left and right eyes. Vertical eye movements and eye blinks were detected using a pair of vertical EOG electrodes placed approximately 1 cm above and below the participant's left eye. The EEG and EOG signals were amplified and band-pass faltered with an analog filter of 0.01 to 100 Hz. The impedance was maintained below 5 kΩ. Raw signals were digitized using a sample frequency of 1000 Hz, and all data were stored digitally for off-line analysis.
We analyzed EEG data corresponded to the standard stimuli (Li et al., 2015). EEG signals contaminated by EOG artifacts were corrected using an ICA algorithm. And EEG signals were divided into epochs from −100 to 800 ms, and baseline corrections were made from −100 to 0 ms. Trials with a voltage exceeding ±100 μV at any electrode location (except EOG electrodes) were excluded from the analysis. The data were averaged for each stimulus type (attended and unattended A, V, AV stimuli) following digital filtering using a band-pass filter of 0.01 to 30 Hz. Then each channel of intercepted EEG was decomposed into the four EEG sub-bands of interest: delta (1 to 4 Hz), theta (5 to 8 Hz), alpha (9 to 13 Hz), and beta (14 to 30 Hz) via the band-passed FIR filter. Then all signals were re-referenced off-line to the algebraic average of the right and left mastoids.
Statistical Analysis
Behavioral Analysis
Mean reaction times (RTs) for the correct response to target stimuli, mean hit rates (HRs), the probability of correct response to target stimuli, and false alarm rates (FARs) for the target stimuli were computed separately for each stimulus type (AV, A, and V stimuli) and location (left and right sides). Subsequently, all behavioral data were entered into separate repeated-measures analysis of variance (ANOVA) with modality (AV, A, and V stimuli) and location (left and right sides) as within-subject factors. Greenhouse-Geisser corrections were applied with adjusted degrees of freedom. A value of p < .05 was considered to indicate a statistically significant difference.
ERP Analysis
The first ERP analysis was performed to confirm that the visual and auditory stimuli were integrated in brain. The mean amplitude of each ERP component was calculated separately at FP1, FPZ, FP2 (prefrontal region), F3, FZ, F4 (frontal region), C3, CZ, C4 (central region), P3, PZ, P4 (parietal region), O1, OZ, O2 (occipital region), F7, T7, P7 (left temporal region), F8, T8, and P8 (right temporal region) electrodes. Based on previous studies (Kutas & Hillyard, 1980; Liu et al., 2011a; Liu et al., 2011b; Talsma & Woldorff, 2005), audiovisual integration in 60–80 ms, 120–180 ms, 220–240 ms, 280–320 ms, 340–360 ms, and 580–640 ms time windows in attended and unattended conditions were identified and quantified. For attended and unattended conditions, the mean amplitude was then subjected to separate repeated-measure ANOVA with Wave (AV and A + V), and Region (prefrontal, frontal, central, parietal, occipital, left temporal and right temporal) as within-subject factors. Only effects involving the factor condition of interest were reported. A significant effect of Wave (AV and A + V) means that auditory and visual stimuli were integrated in the brain (Giard & Peronnet, 1999; Stein & Meredith, 1993). Then the ERPs related to audiovisual integration [AV−(A + V)] in attended and unattended conditions were obtained.
To determine the neural activity on which frequency band is associated with the modulation of divided attention on audiovisual integration, we further calculated ERPs related to audiovisual integration, which is AV−(A + V), on delta-, theta-, alpha- and beta- frequency bands to obtain individual ERPs of audiovisual integration in attended and unattended conditions, respectively. Then we obtained eight individual ERPs data (4 frequency bands (delta-, theta-, alpha- and beta-bands) × 2 conditions (attended and unattended conditions)) for each participant. For each frequency band, the data of audiovisual integration was subjected to separate repeated-measure ANOVA with Attention (attended and unattended AV−(A + V)) and Region (prefrontal, frontal, central, parietal, occipital, left temporal, and right temporal) as within-subject factors. We selected time windows of 40–80 ms, 80–120 ms, 120–160 ms, 200–400 ms, and 500–600 ms to explore the Attention effect (Talsma et al., 2010; Talsma et al., 2010).
Spectral Power Analysis
For the data of audiovisual integration (AV−(A + V)) on attended and unattended conditions, a Fast Fourier Transform (FFT) was performed to obtain the values of spectral power on delta-, theta-, alpha-, and beta- frequency bands. Numbers of studies have suggested that the fronto-parietal network of brain areas has been shown to be involved in allocating and controlling the direction of top-down attention by sending control signals that modulate the sensitivity of neurons in sensory brain regions (Corbetta & Shulman, 2002; Grent-’t-Jong & Woldorff, 2007; Moore et al., 2003; Talsma et al., 2010; Woldorff et al., 2004; Yantis & Serences, 2003). Considering that the fronto-parietal region is closely related to the attention mechanism, for each frequency band, power values for audiovisual integration (both in attended and unattended conditions) on 42 electrodes (FP1, FPZ, FP2, AF3, AF4, F7, F5, F3, F1, FZ, F2, F4, F6, F8, FC5, FC3, FC1, FCZ, FC2, FC4, FC6, C5, C3, C1, CZ, C2, C4, C6, CP5, CP3, CP1, CPZ, CP2, CP4, CP6, P5, P3, P1, PZ, P2, P4, P6) at the fronto-parietal position were selected for further statistical analysis. Then, for each frequency band, the values of spectral power of audiovisual integration were subjected to separate repeated-measure ANOVA with Attention (attended and unattended AV−(A + V)) and Region (prefrontal, frontal, central, parietal) as within-subject factors. A post-hoc paired t-test for power values of attended and unattended conditions was performed to identify the significant difference on each electrode. The significant difference of the values of spectral power between attended and unattended conditions was considered to be the modulation of divided attention on audiovisual integration on delta-, theta-, alpha-, and beta- frequency bands.
All statistical analyses were conducted using IBM SPSS (version 22, IBM Inc., UAS) software for Windows. Greenhouse-Geisser corrections were applied with adjusted degrees of freedom. A value of p < .05 was considered to indicate a statistically significant difference.
Results
Behavioral Performance
A separate repeated-measure ANOVA with modality (AV, A, and V stimuli) and location (left and right sides) as within-subject factors was performed. No significant main effect of location was found in RTs (F1,22 = 0.261, p = .808), HRs (F1,22 = 1.916, p = .180), or FARs (F1,22 = 1.416, p = .247), indicating that there was no behavioral difference associated with attending to the left or right side. Thus, the RTs, HRs, and FARs from the left and right sides were combined. Mean RTs, HRs, and FARs for target A, V, and AV stimuli are shown in Figure 2.
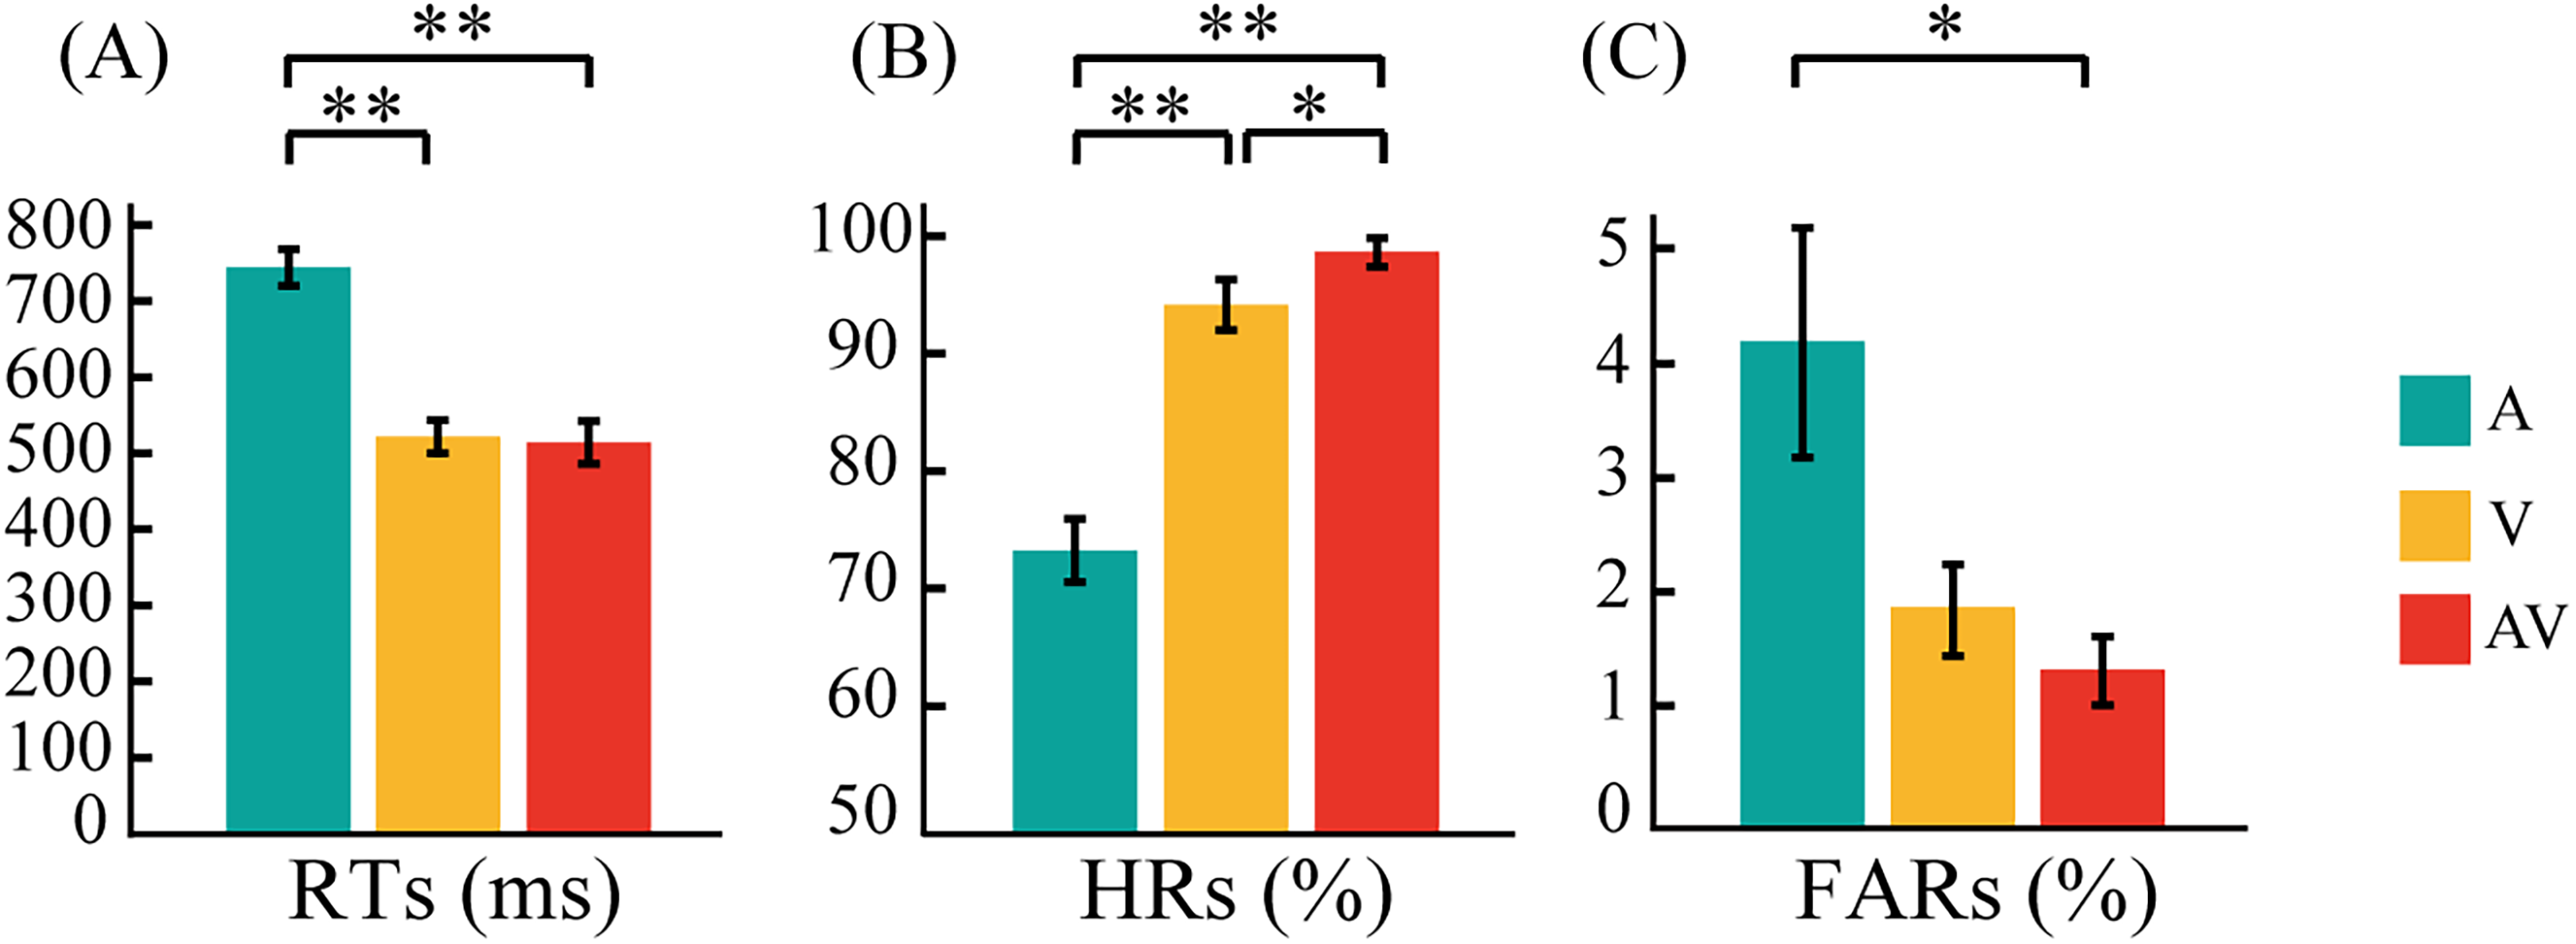
Bar plots showing behavioral results. (A) Mean response times (RTs) for A, V, and AV target stimuli. (B) Mean hit rates (HRs) for A, V, and AV target stimuli. (C) Mean false alarm rates (FAR) for A, V, and AV target stimuli. The error bars represent the SEM. SEM, standard error of mean. **p < .01, *p < .05.
A three-factor (A, V, AV) ANOVA for RTs to target stimuli revealed a main effect of modality (F2,44 = 188.180, p < .0005), indicating that RTs significantly differed among modalities. The result of paired t-test showed that RTs were significantly faster to AV than to A stimuli (p < .0005), although they did not significantly differ from those to V stimuli (p = .478). RTs were significantly faster to V than to A stimuli (p < .0005) (Figure 2A). A three-factor (A, V, AV) ANOVA for HRs revealed a main effect of modality (F2,44 = 31.299, p < .0005). The result of paired t-test showed that HRs were much higher for AV than for A stimuli (p < .0005) and significantly higher than those for V stimuli (p = .048). HRs were also significantly higher for V than for A stimuli (p < .0005) (Figure 2B). FARs to target AV, A, and V stimuli were no significantly different (F2,44 = 3.460, p = .075). Paired t-tests showed that the FARs to target AV were significantly lower than that to target A (p = .031). No significant difference was observed in the FARs to target A and V stimuli (p = .114) and target AV and V stimuli (p = .809) (Figure 2C).
ERP Related to Audiovisual Integration With and Without Divided Attention
In order to identify the effect related to audiovisual integration, a repeated measures ANOVA was conducted to examine the differences between AV and A + V both in attended and unattended conditions. As a result, we found significant differences between AV and A + V over bilateral centro-temporal region (C3, CZ, C4, F7, T7, P7, F8, T8, P8) at 60–80 ms (F1,21 = 7.301, p = .013), over prefronto-fronto-central and bilateral temporal regions (FP1, FPZ, FP2, F3, FZ, F4, C3, CZ, C4, F7, T7, P7, F8, T8, P8) at 120–180 ms (F1,21 = 28.437, p < .0005), over fronto-centro-parieto-occipital and bilateral temporal regions (FP1, FPZ, FP2, F3, FZ, F4, C3, CZ, C4, F7, T7, P7, F8, T8, P8, P3, PZ, P4, O1, OZ, O2) at 220–240 ms (F1,21 = 17.097, p < .0005), over prefrontal, fronto-centro-parietal, bilateral temporal, and occipital regions (FP1, FPZ, FP2, F3, FZ, F4, C3, CZ, C4, F7, T7, P7, F8, T8, P8, O1, OZ, O2) at 280–320 ms (F1,21 = 17.229, p < .0005), and over prefrontal and parieto-occipital regions (FP1, FPZ, FP2, F7, F3, FZ, P7, P3, PZ, P4, P8, O1, OZ, O2) at 340–360 ms (F1,21 = 6.606, p = .018) in attended condition. Superimposed ERP waveform to AV and A + V in attended conditions was displayed in Figure 3A. Meanwhile, significant differences between unattended AV and A + V were found over prefronto-fronto-central and bilateral temporal regions (FP1, FPZ, FP2, F3, FZ, F4, C3, CZ, C4, F7, T7, P7, F8, T8, P8) at 120–180 ms (F1,21 = 24.908, p < .0005), over prefrontal, fronto-centro-parietal, bilateral temporal and occipital regions (FP1, FPZ, FP2, F3, FZ, F4, C3, CZ, C4, F7, T7, P7, F8, T8, P8, P3, PZ, P4, O1, OZ, O2) at 220–240 ms (F1,21 = 100.138, p < .0005), over frontal region (F3, FZ, F4) at 280–320 ms (F1,21 = 5.150, p = .034), and over parietal region (P3, PZ, P4) at 340–360 ms (F1,21 = 6.177, p = .021).Superimposed ERP waveform to AV and A + V in unattended condition is displayed in Figure 3B.
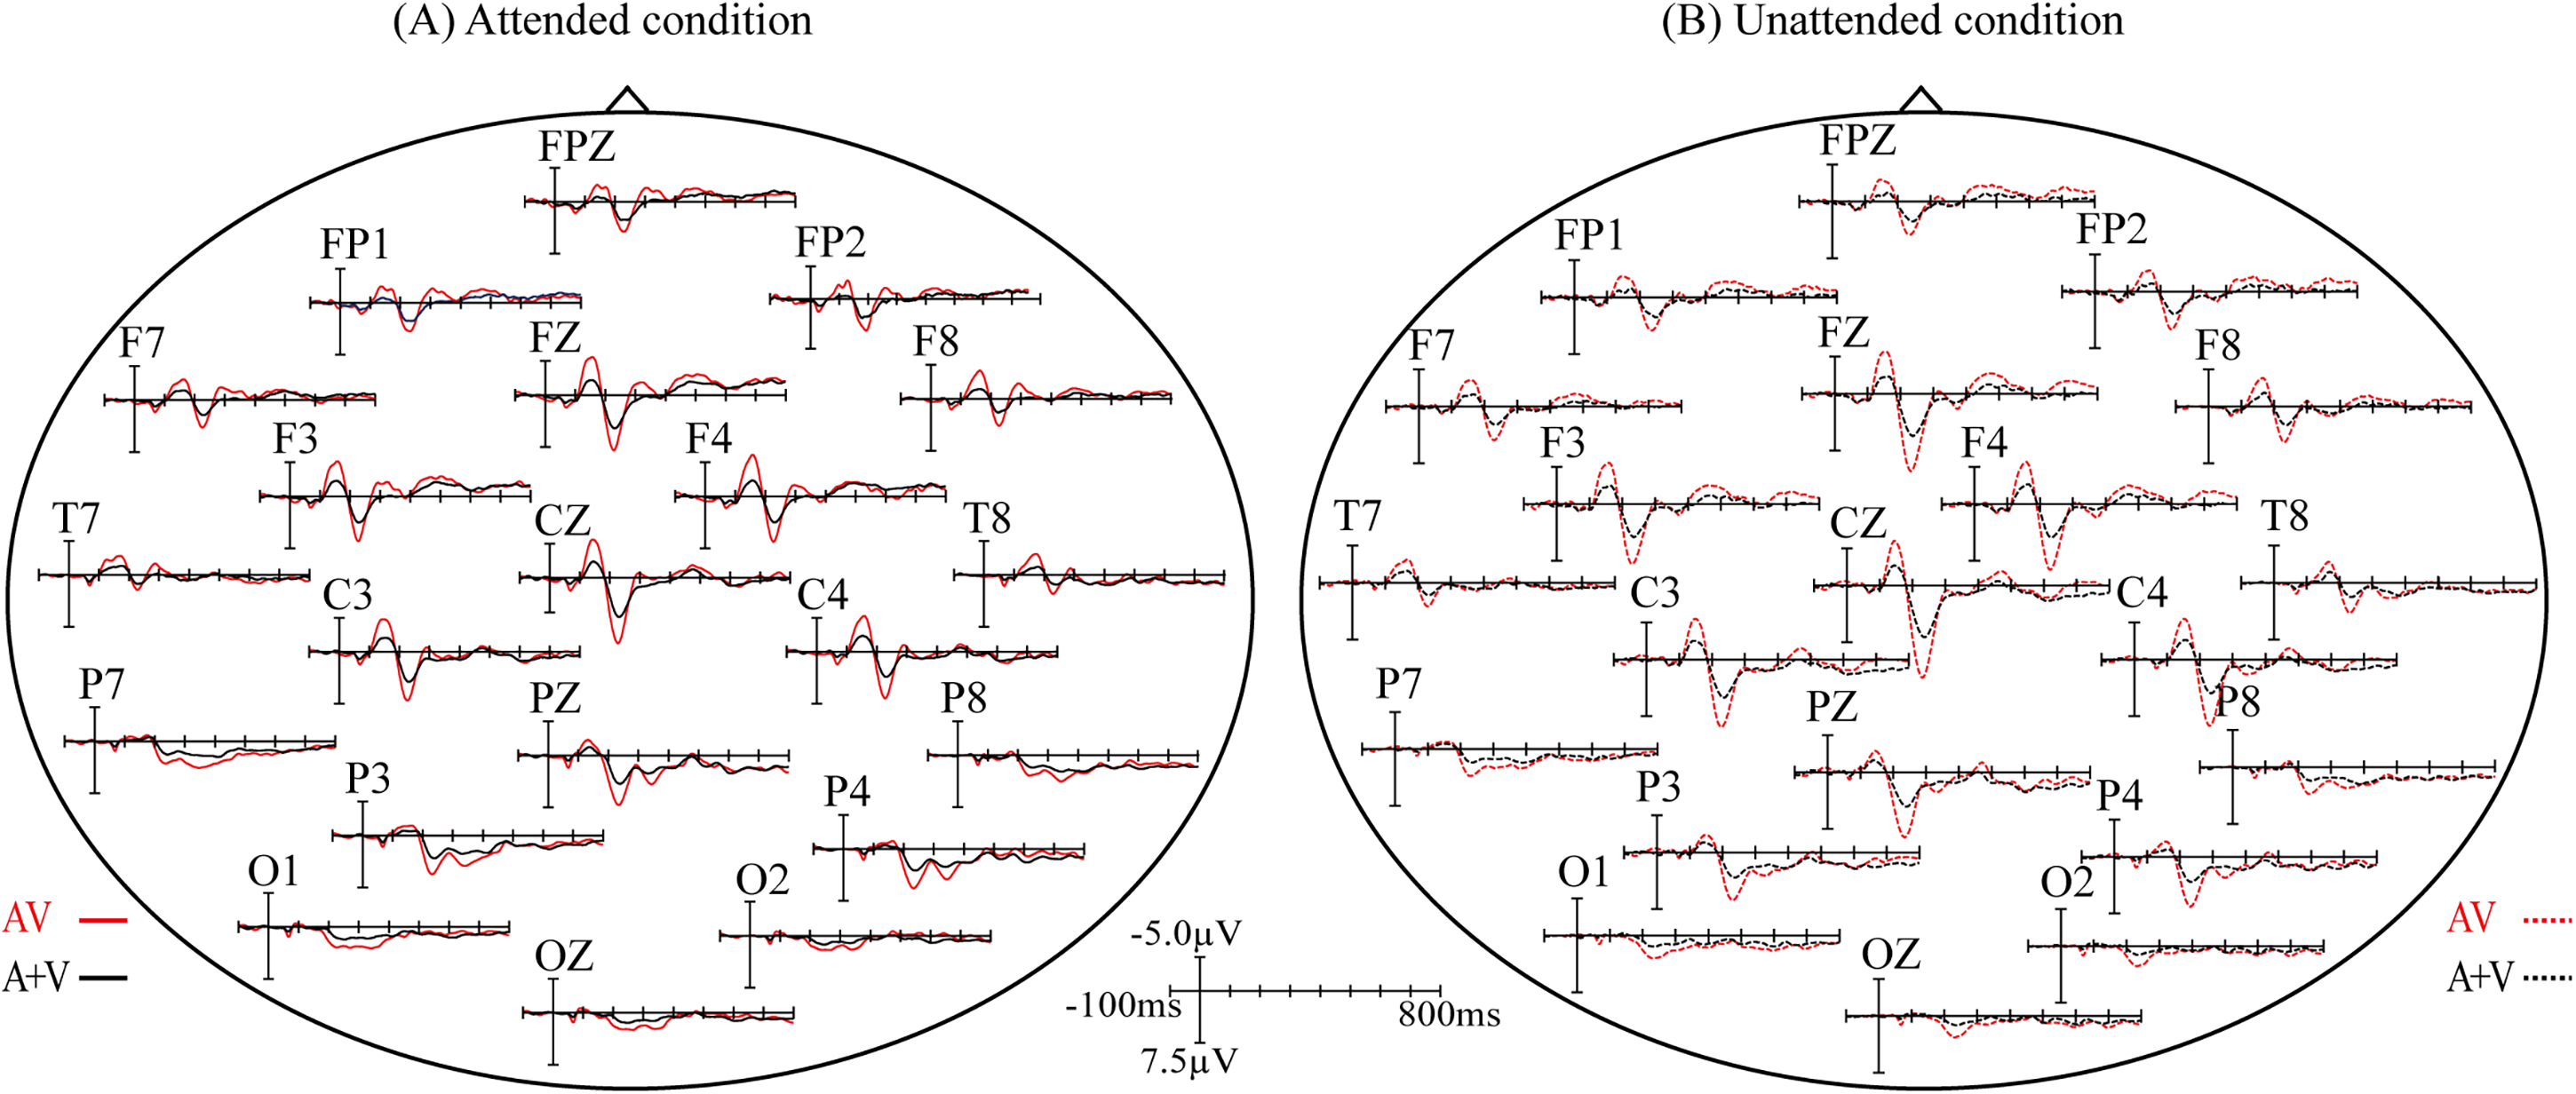
Differences between grand-averaged event-related potentials (ERPs) to AV and (A + V) for attended (A) and unattended (B) conditions.
The overlapped grand-averaged ERP waveform to AV−(A + V) in attended and unattended conditions are shown in Figure 4A. To identify the modulation of divided attention on audiovisual integration on different frequency band, we compared the waveform related to audiovisual integration between attended and unattended conditions on delta-, theta-, alpha-, and beta-bands, and the results were shown in Figure 4B. The modulation of divided attention on audiovisual integration was found on both delta- and theta-bands over fronto-central region, and no difference was found between attended and unattended audiovisual integration on alpha- and beta-bands. Specifically, for delta-band, the results showed significant differences between attended and unattended audiovisual integration from 80 to 120 ms (F1, FZ, F2, FC1, FCZ, FC2, C1, CZ, C2, CP1, CPZ, CP2, P1, PZ, P2: F1,21 = 4.727, p = .042), from 200 to 400 ms (F3, F1, FZ, F2, F4, FC3, FC1, FCZ, FC2, FC4, C3, C1, CZ, C2, C4, CP3, CP1, CPZ, CP2,CP4, P3, P1, PZ, P2, P4: F1,21 = 5.239, p = .033), and from 500 to 600 ms (F3, F1, FZ, F2, F4, FC3, FC1, FCZ, FC2, FC4, C3, C1, CZ, C2, C4, CP3, CP1, CPZ, CP2,CP4, P3, P1, PZ, P2, P4: F1,21 = 14.703, p = .0024) over wide fronto-centro-parietal region. The scalp topographies of audiovisual integration with and without divided attention on delta-band were shown in Figure 5. For theta-band, the results showed significant differences between attended and unattended audiovisual integration from 40 to 80 ms at centro-parietal region (C3, C1, CZ, CP3, CP1, CPZ, P3, P1, PZ: F1,21 = 14.603, p = .0045), from 120 to 160 ms (F3, F1, FZ, F2, F4, FC3, FC1, FCZ, FC2, FC4, C3, C1, CZ, C2, C4, CP3, CP1, CPZ, CP2,CP4, P3, P1, PZ, P2, P4: F1,21 = 8.33, p = .009), and 200–300 ms (F3, F1, FZ, F2, F4, FC3, FC1, FCZ, FC2, FC4, C3, C1, CZ, C2, C4, CP3, CP1, CPZ, CP2,CP4, P3, P1, PZ, P2, P4: F1,21 = 22.932, p < .0005) over fronto-centro-parietal region. The scalp topographies of audiovisual integration with and without divided attention on theta-band were shown in Figure 6.
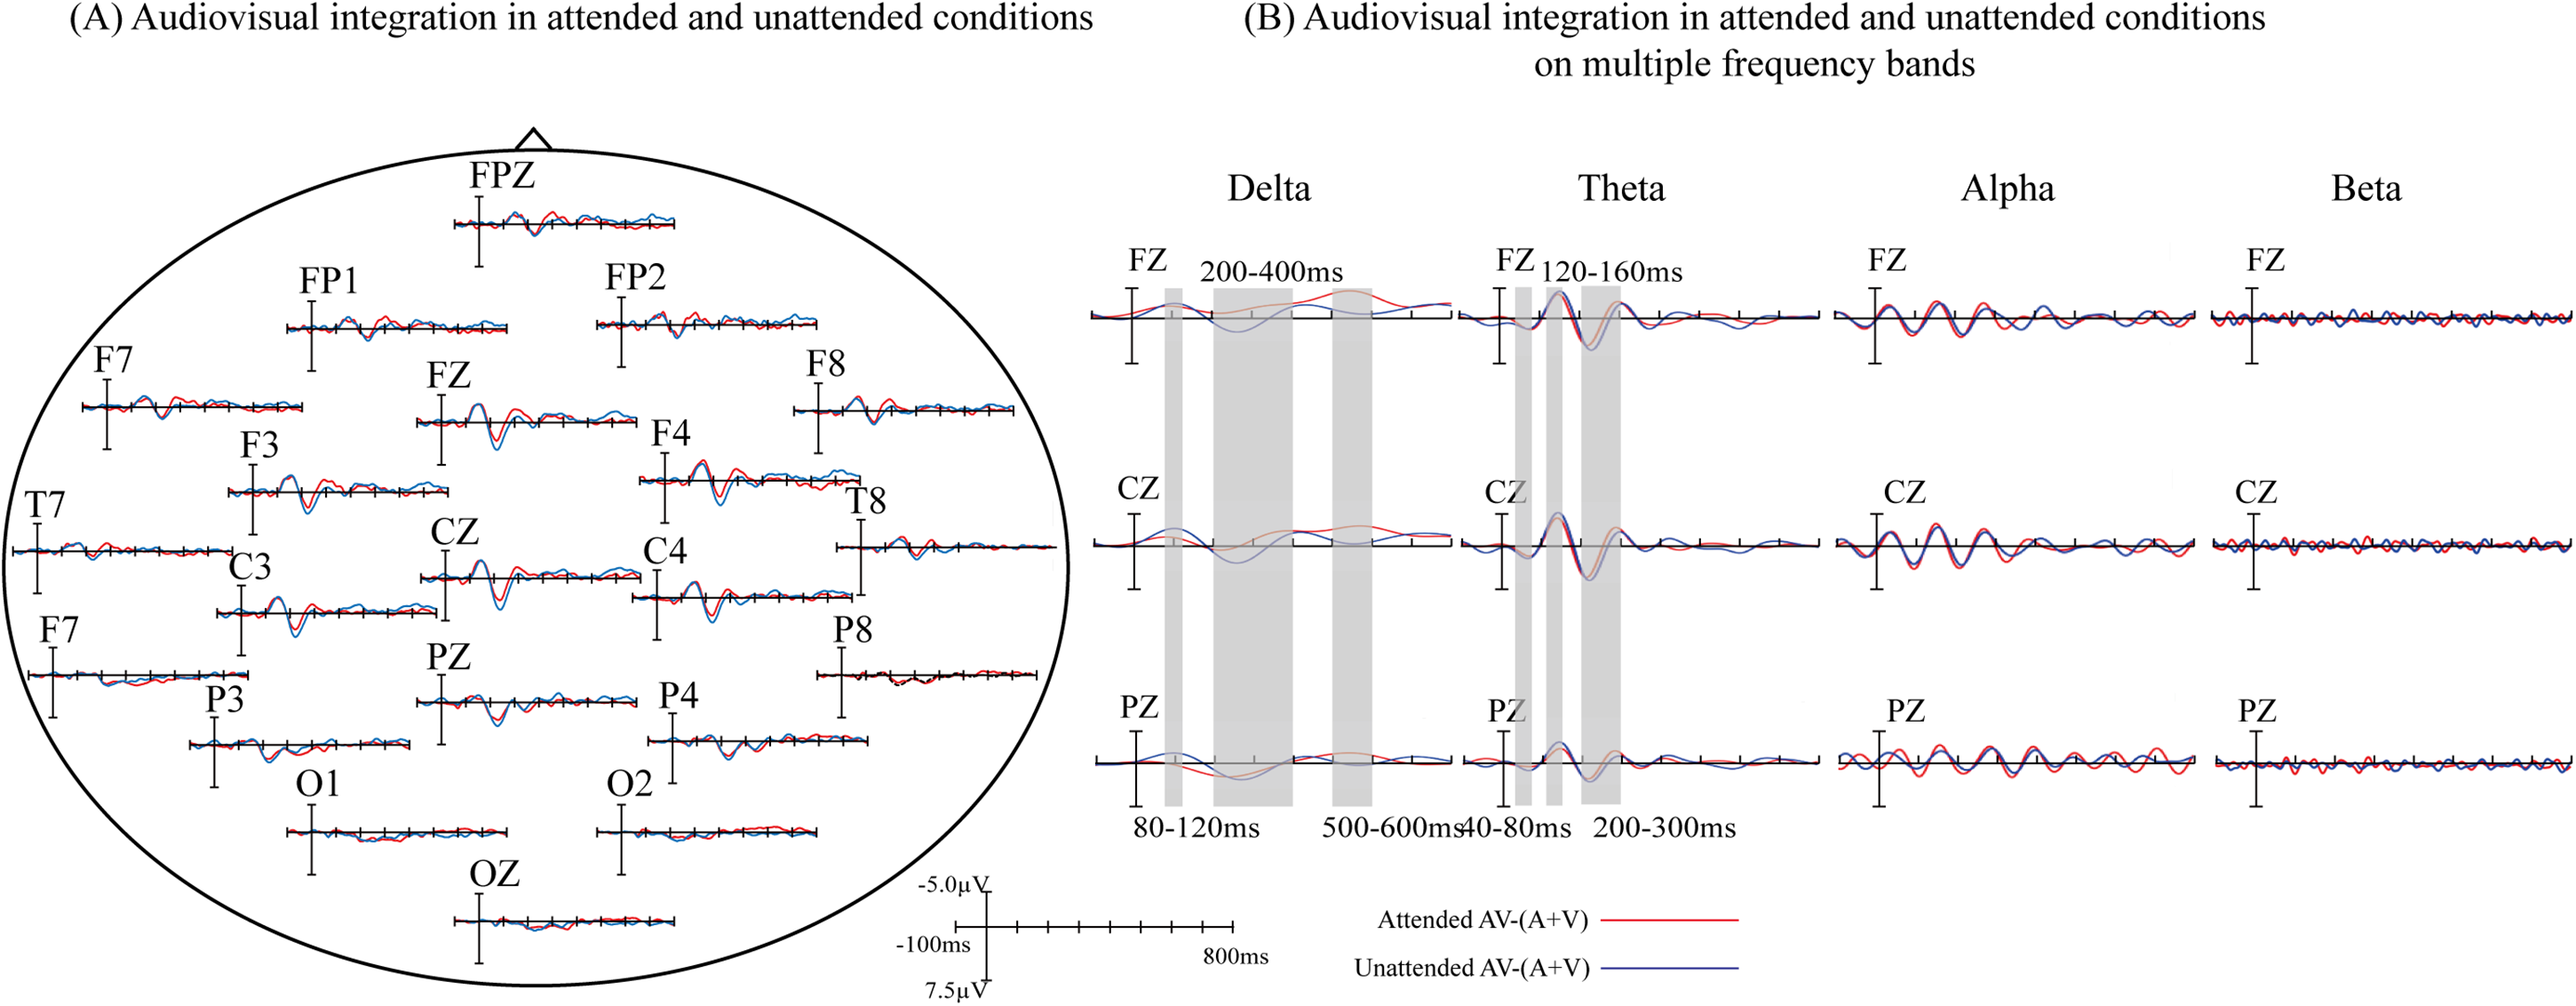
(A) Audiovisual integration in attended and unattended conditions. Differences between grand-averaged event-related potentials (ERPs) to attended and unattended AV−(A + V). (B) Audiovisual integration in attended and unattended conditions on multiple frequency bands. Three electrodes (FZ, CZ, and PZ) representing the frontal, central, and parietal regions were selected to show the difference between attended and unattended audiovisual integration.
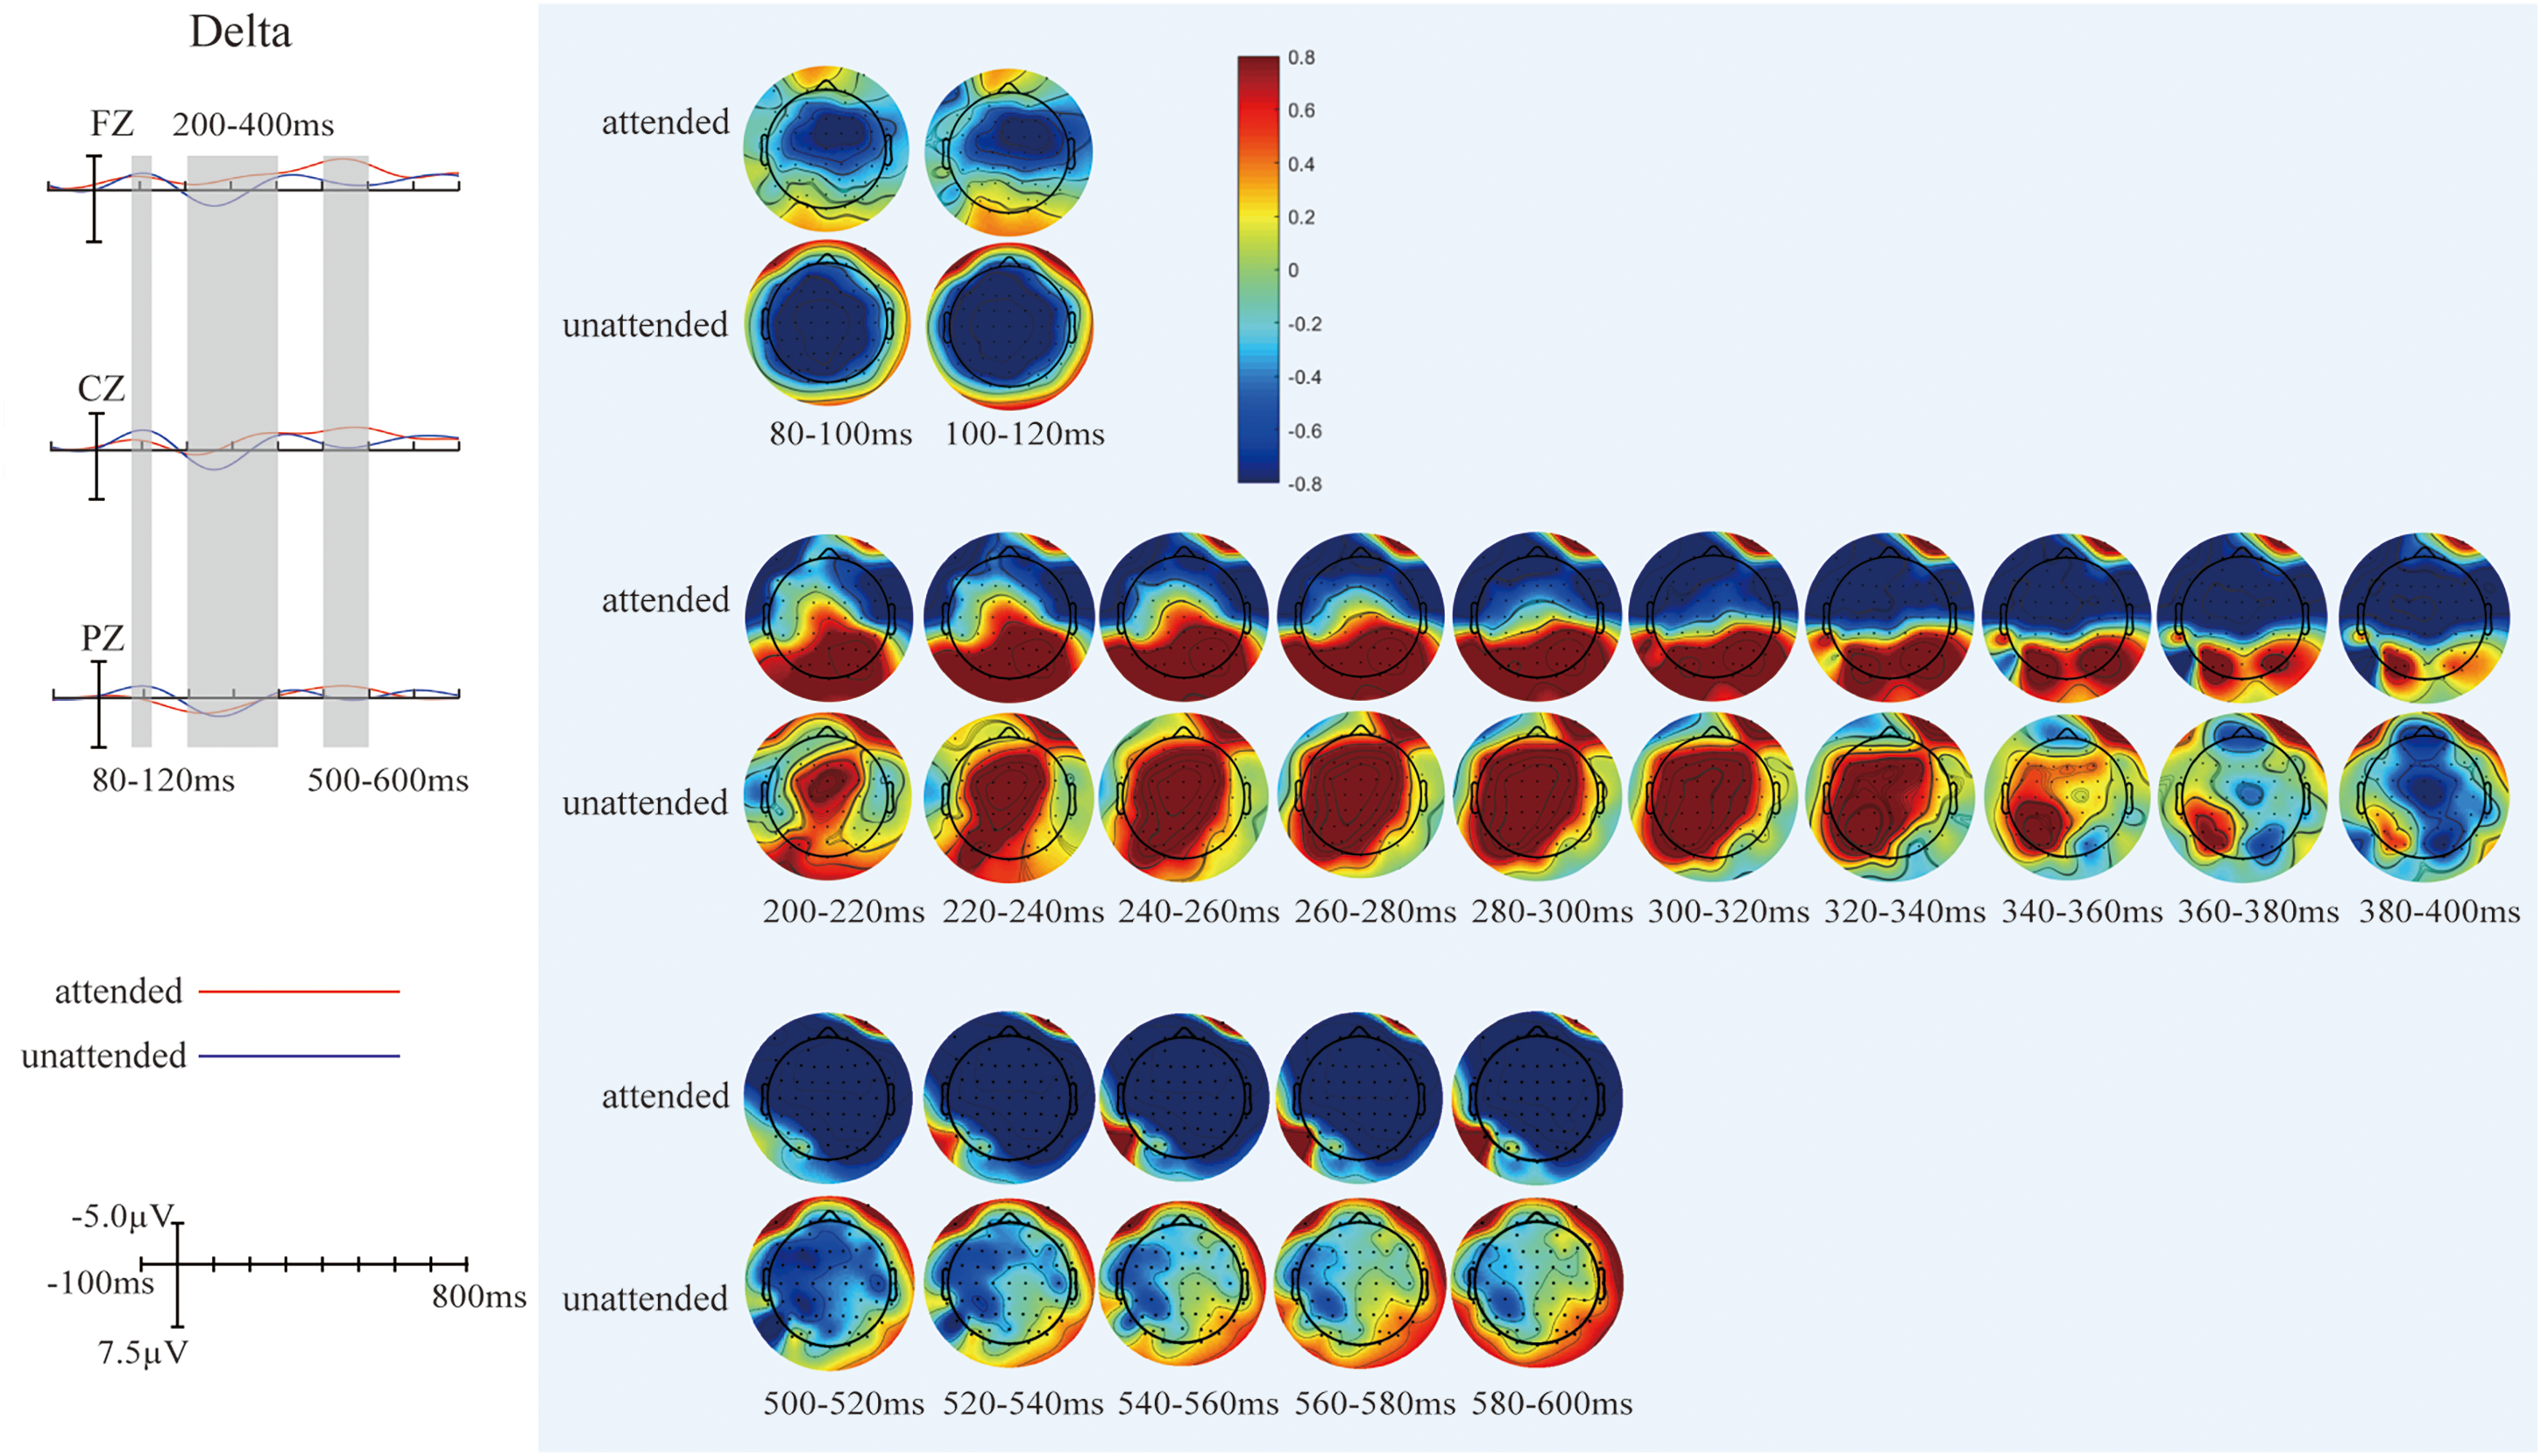
(A) Differences between grand-averaged event-related potentials (ERPs) to attended and unattended AV−(A + V) on delta band. Three electrodes (FZ, CZ, and PZ) representing the frontal, central, and parietal regions were selected to show the difference between attended and unattended audiovisual integration on delta band. (B) The scalp topographies of AV−(A + V) related to attended and unattended audiovisual integration on delta band.
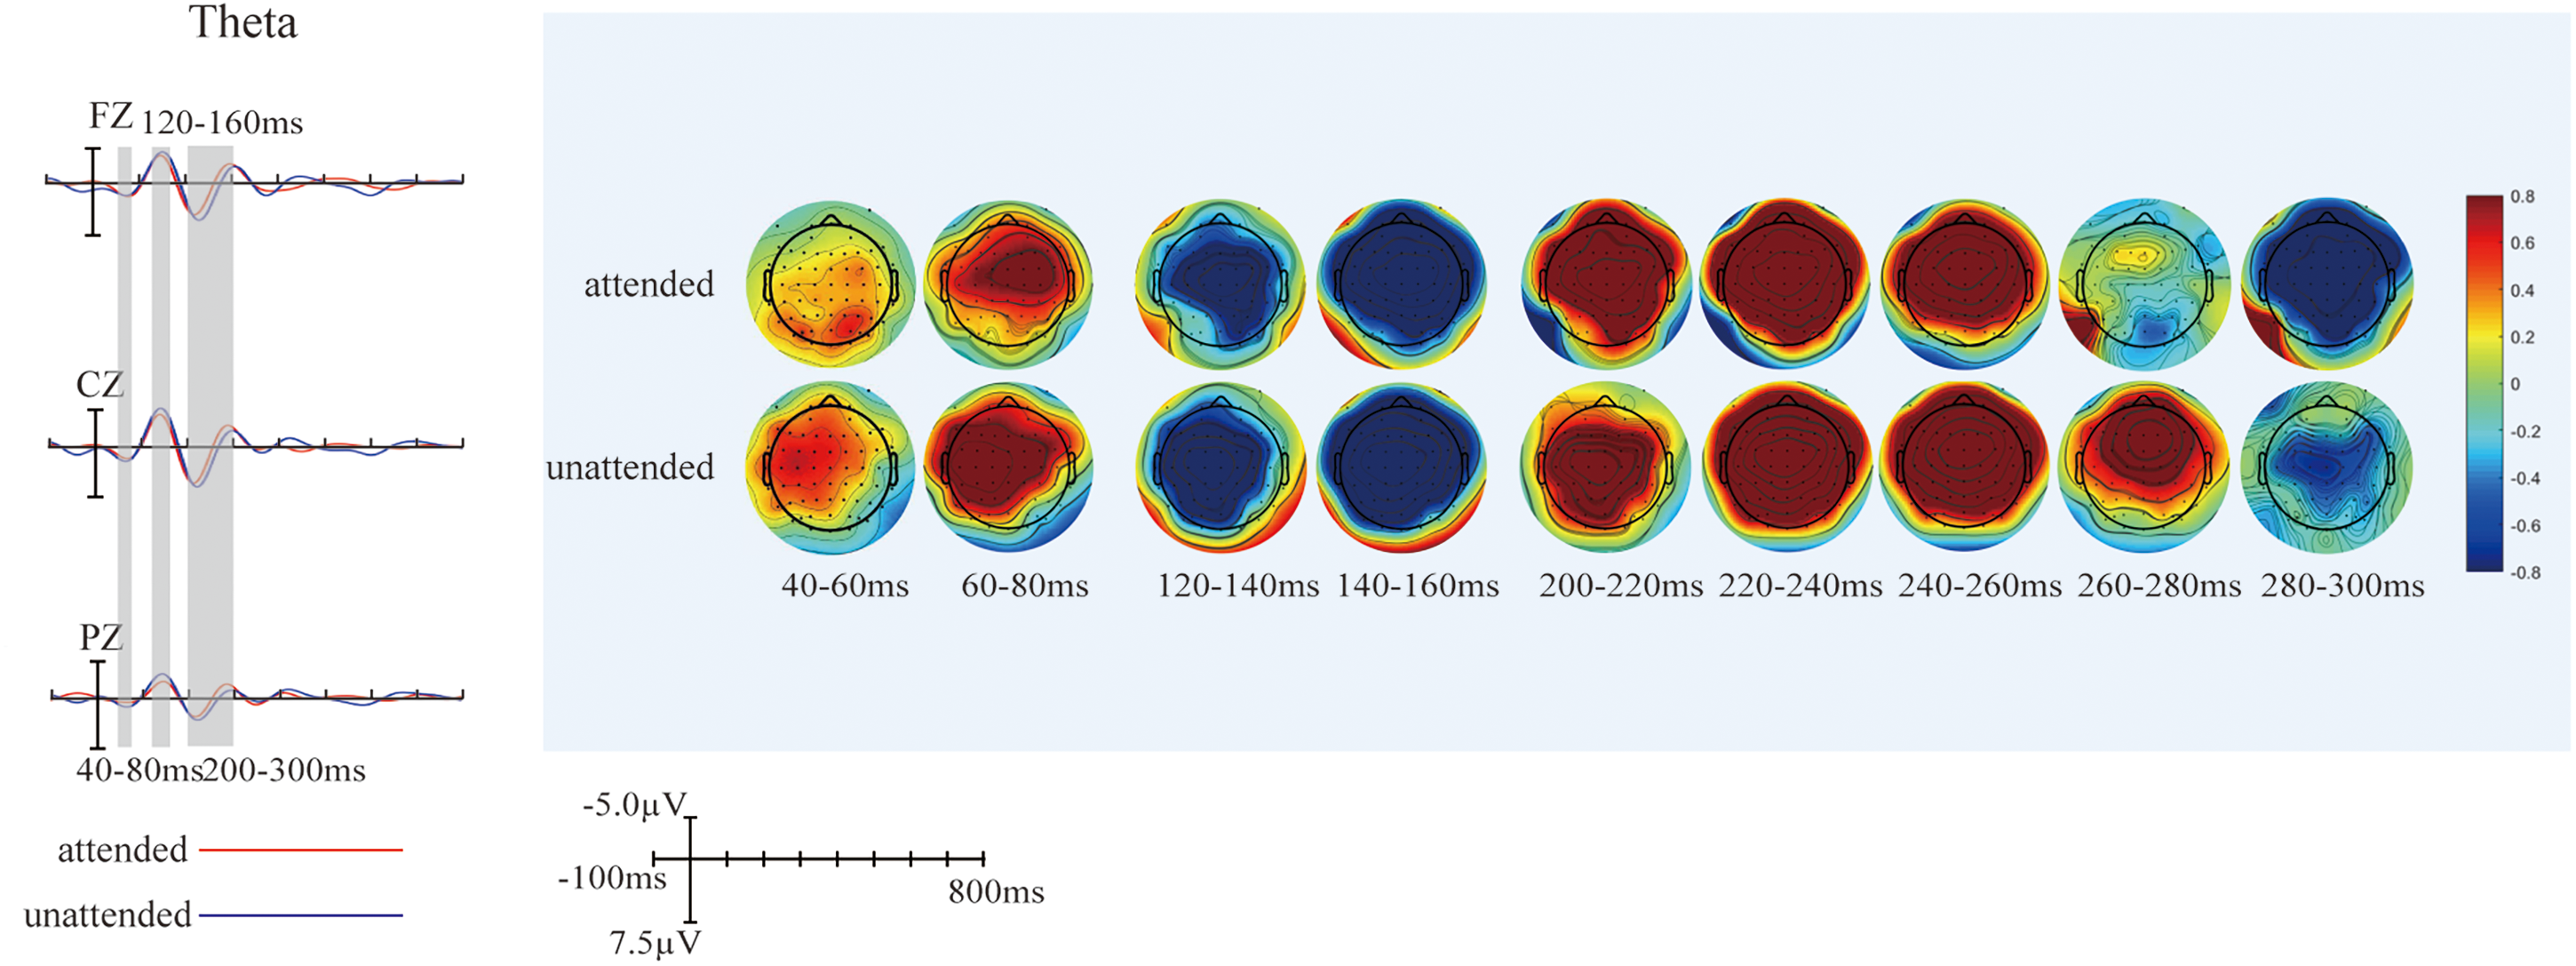
(A) Differences between grand-averaged event-related potentials (ERPs) to attended and unattended AV−(A + V) on theta band. Three electrodes (FZ, CZ, and PZ) representing the frontal, central, and parietal regions were selected to show the difference between attended and unattended audiovisual integration on theta band. (B) The scalp topographies of AV−(A + V) related to attended and unattended audiovisual integration on theta band.
Spectral Power on Multiple Frequency Bands of Audiovisual Integration With and Without Divided Attention
There was no significant difference in power between attended and unattended audiovisual integration on alpha-and beta-bands. However, we found significant differences on delta-band power between attended and unattended audiovisual integration over prefrontal region (FP1, FPZ, FP2, AF3, AF4: F1,21 = 9.317, p = .006), over frontal region (F7, F5, F3, F1, FZ, F2, F4, F6, F8: F1,21 = 6.578, p = .017), and over fronto-central region (F1, FZ, F2, FC1, FCZ, FC2, C1, CZ, C2: F1,21 = 4.488, p = .045). Post-hoc paired t-test showed significant differences of power values between attended and unattended conditions on 20 electrodes, as shown in Figure 7.
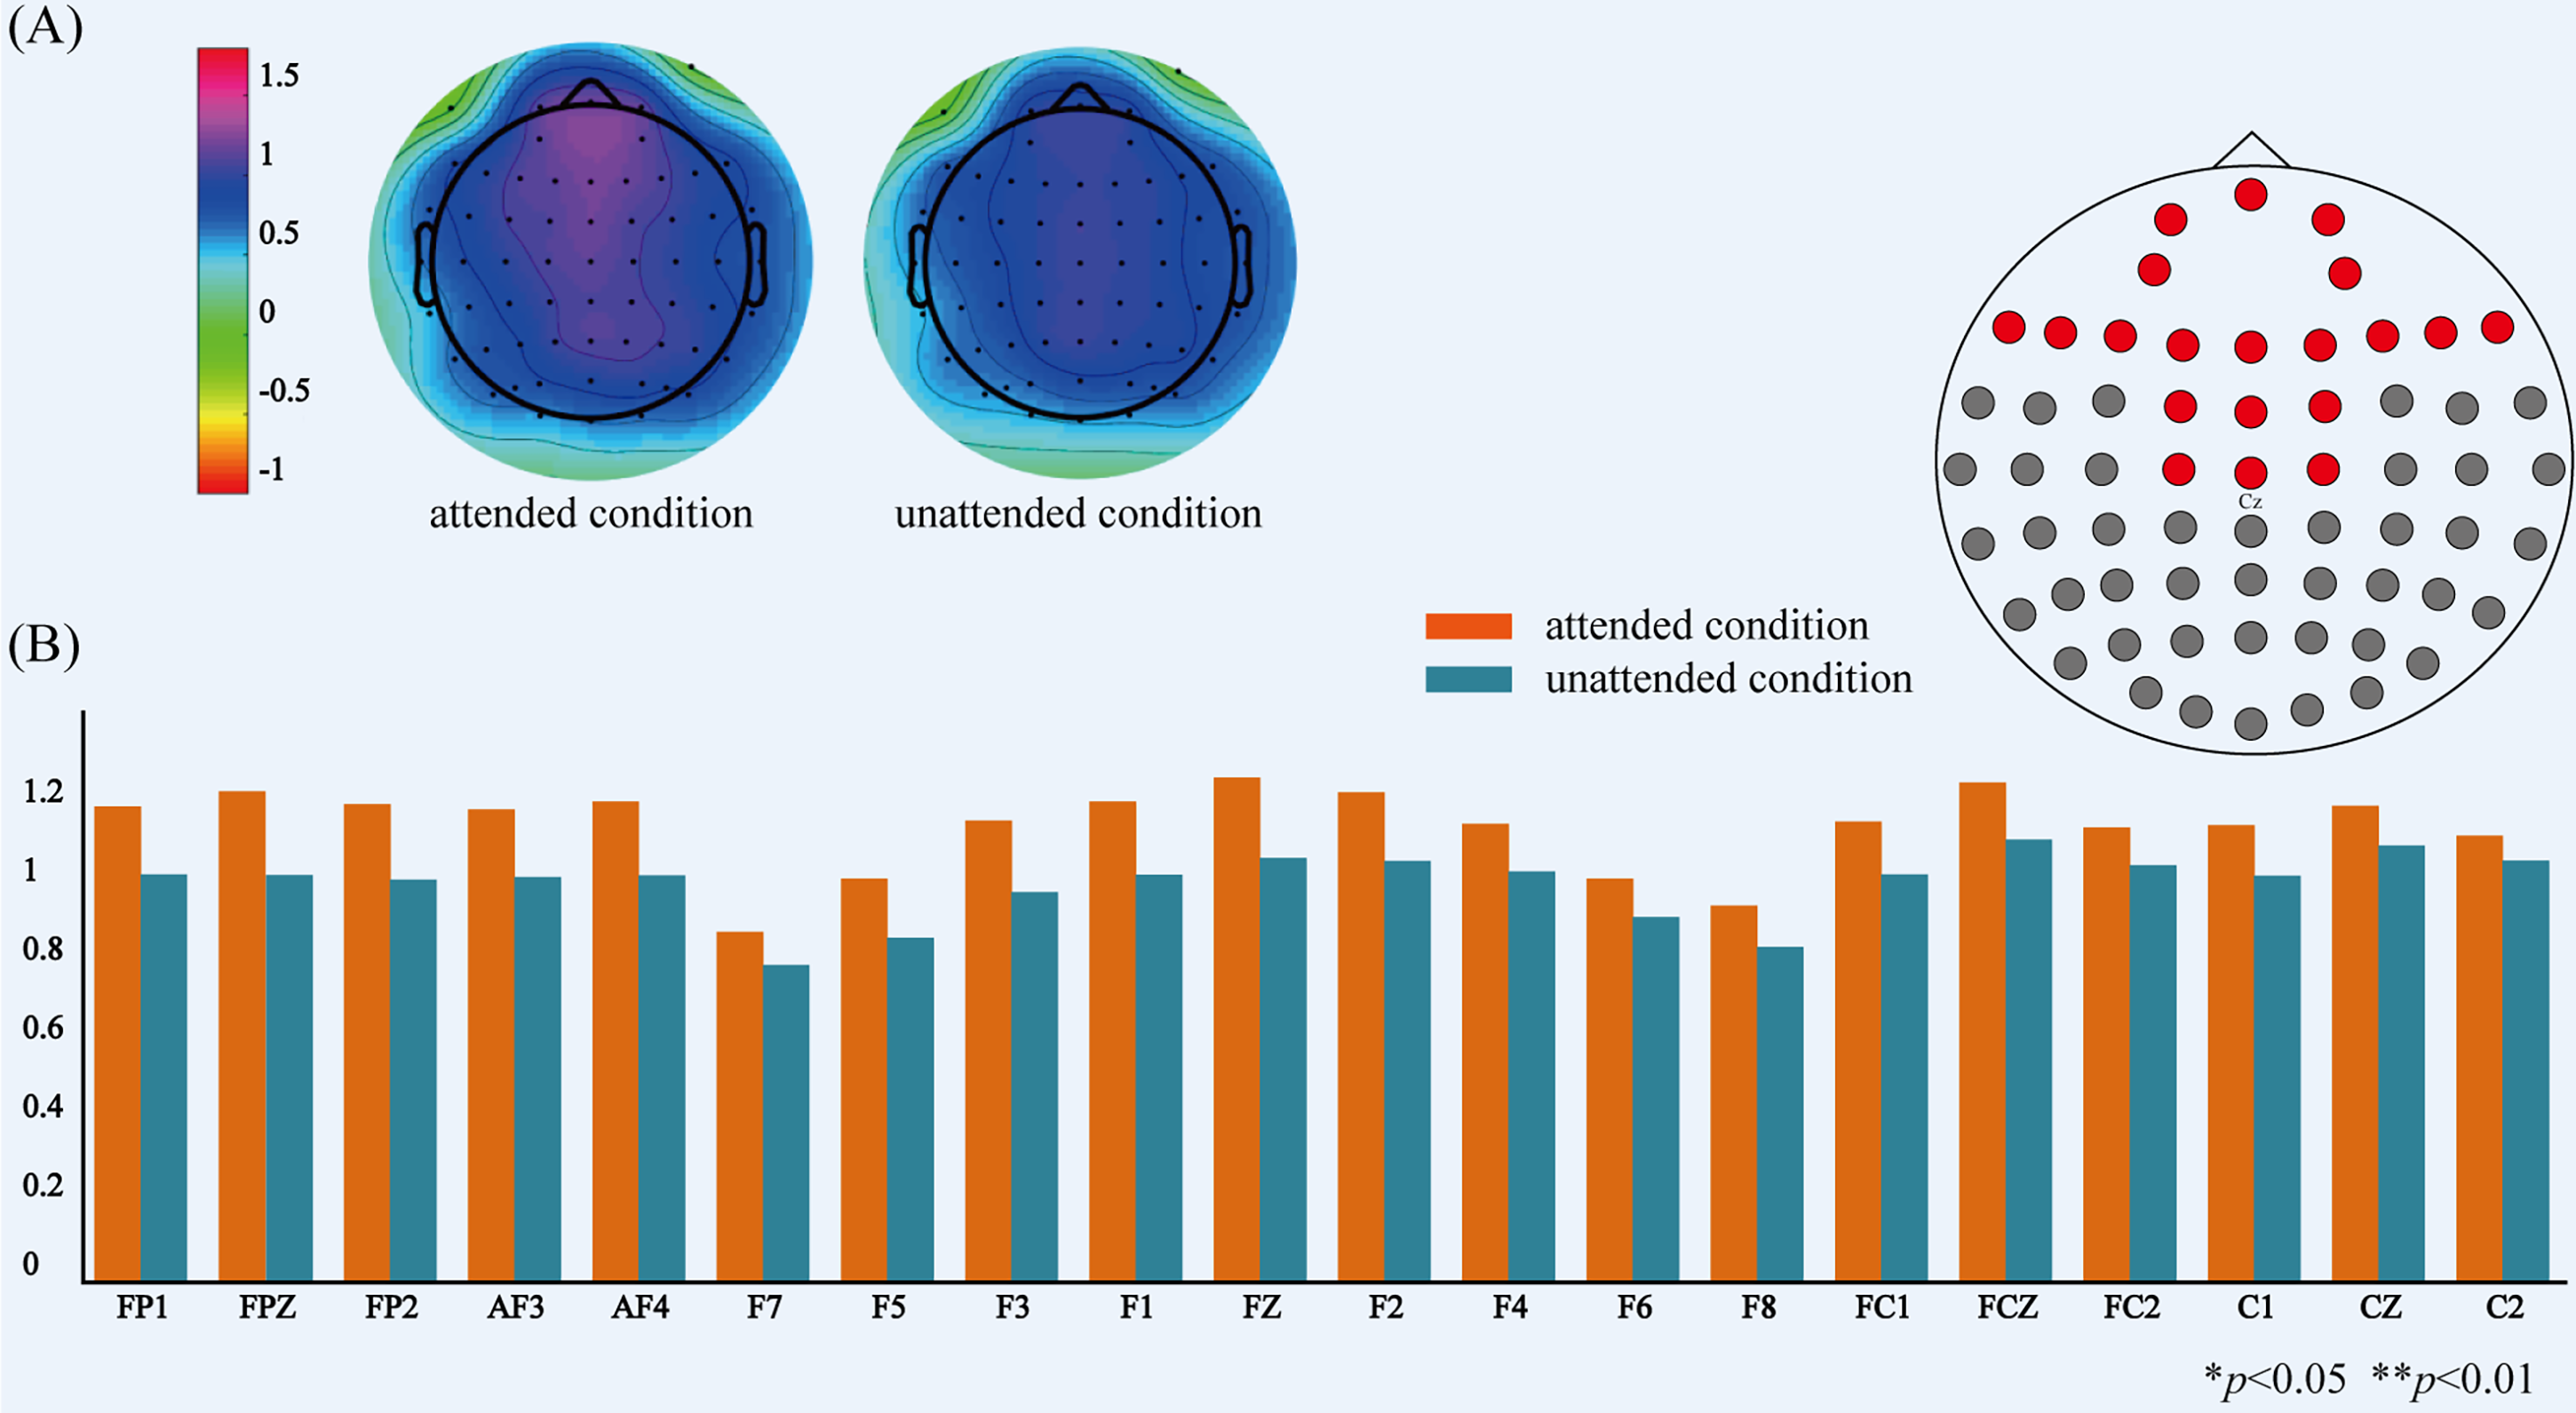
The comparison of power on delta-band between attended and unattended conditions. (A) The topographical distribution of delta-band power for attended and unattended audiovisual integration. (B) The power values of delta-band at 20 electrodes over prefrontal, fronto-central regions for attended and unattended audiovisual integration.
Moreover, for theta-band, significant differences in power between attended and unattended audiovisual integration over prefrontal region (FP1, FPZ, FP2, AF3, AF4: F1,21 = 4.733, p = .04), and over frontal region (F1, FZ, F2: F1,21 = 4.724, p = .04) were observed. Post-hoc paired t-test showed significant differences of power values between attended and unattended conditions on eight electrodes. The power at these electrodes over prefrontal and frontal regions was shown in Figure 8.
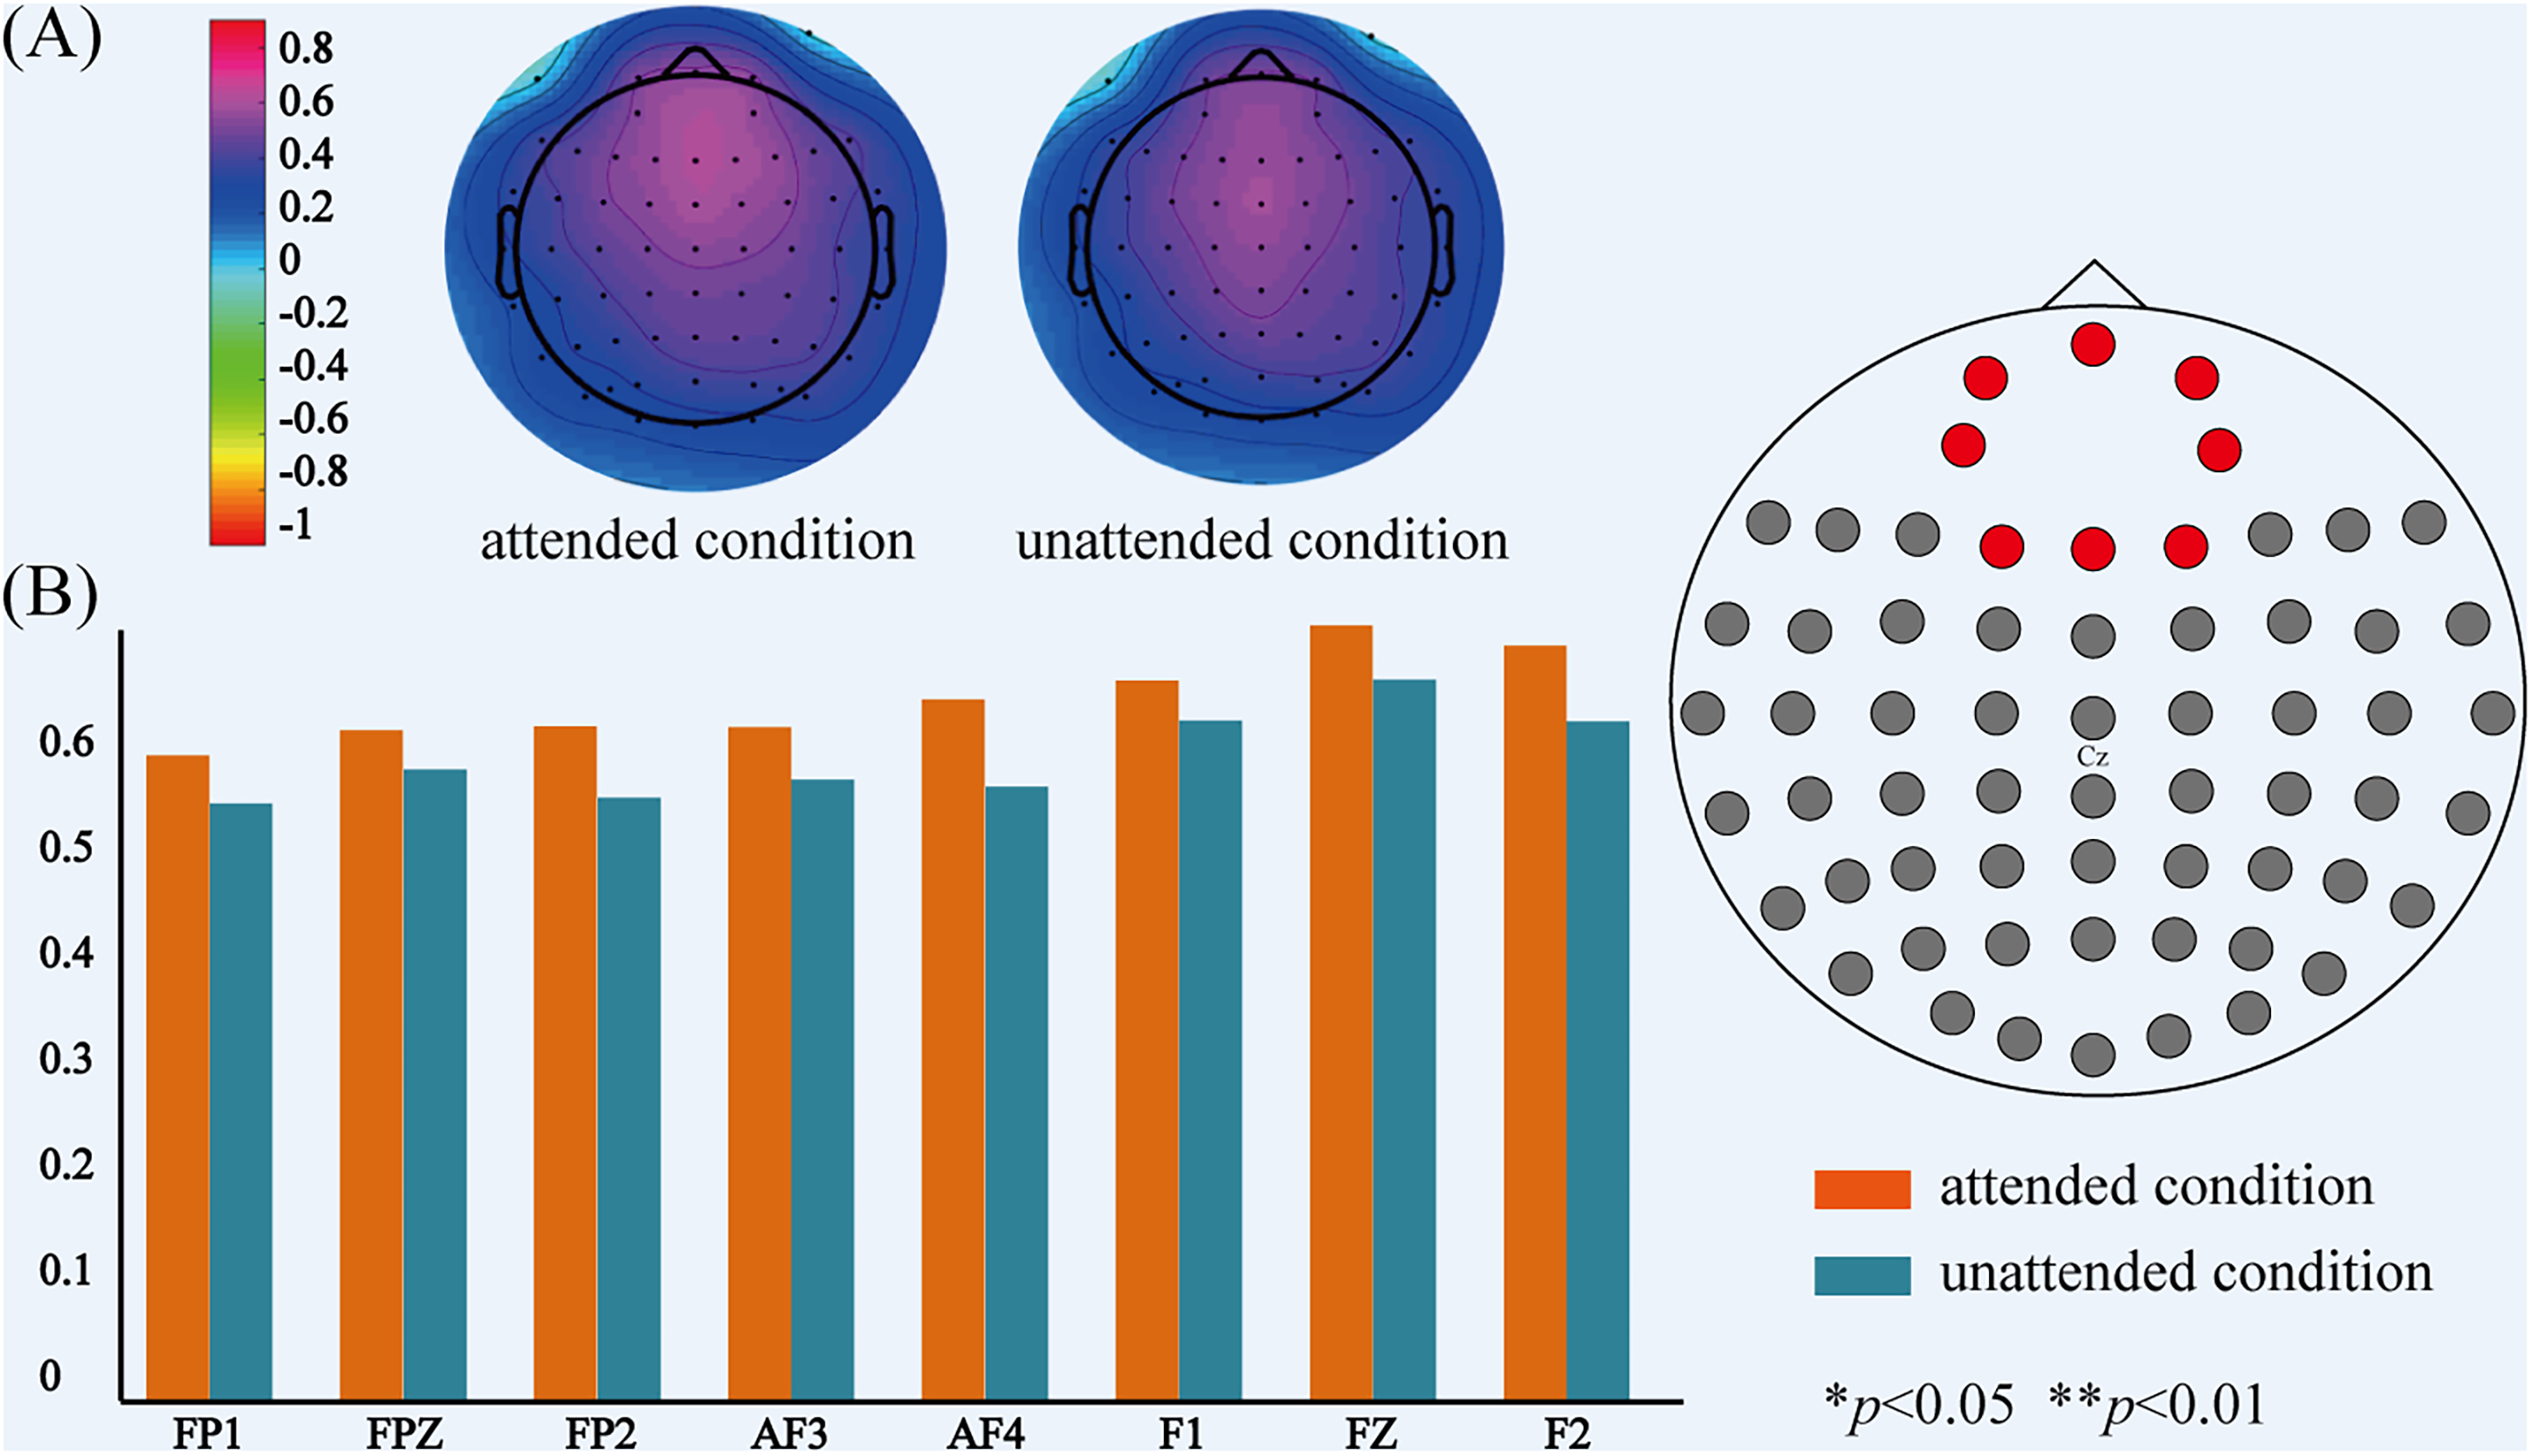
The comparison of power on theta-band between attended and unattended conditions. (A) The topographical distribution of theta-band power for attended and unattended audiovisual integration. (B) The power values of theta-band at 20 electrodes over prefrontal, fronto-central regions for attended and unattended audiovisual integration.
Discussion
Task Performance
We analyzed the RTs, HRs, and FARs to A, V, and AV target stimuli. The results showed that RTs and HRs to AV were significantly better than those to A stimuli. Though RTs to AV stimuli were not significantly faster than those to V stimuli, HRs to AV stimuli were significantly higher than those to V stimuli. These results indicated the participants were still able to reach a high level of performance accuracy while attending to two stimuli simultaneously (Figure 2). Previous studies have demonstrated that simultaneously performing several tasks is demanding and often leads to decrements in performance speed and accuracy (Pashler, 1994; Moisala et al., 2015). These decrements may be due to a bottleneck in executive task-coordination systems recruited by multitasking (D’Esposito et al., 1995; Moisala et al., 2015). Additional interference may be generated if the component tasks are presented in different sensory modalities and the corresponding sensory cortices have to compete for attentional resources (Moisala et al., 2015; Näätänen, 1992). Similar to the previous studies, the participants were asked to attend to the stimuli from two different sensory modalities in our current study. However, there was no decrement in performance speed and accuracy observed. We suggested that one important reason is that the bimodal stimuli in our study have the consistent temporal, spatial, and semantic relationships. Although attention resource was divided to two different modalities of sensory input, consistent temporal, spatial, and semantic relationships allowed the brain to integrate visual and auditory stimuli into an unified event. According to the view of Tang et al. that integrated multisensory events can capture attention efficiently, even in complex circumstances, due to their increased salience compared to unimodal events (Tang et al., 2016), we suggested that the reason why divided attention did not reduce the behavioral response is that integrated audiovisual events in turn captured attention, further facilitating the processing of the task.
The Modulation of Divided Attention on ERP Related to Audiovisual Integration
In our present study, participants voluntarily attended to stimulus sequences for the semantic recognition task. That is, divided attention here was endogenous and modulated audiovisual integration by a top-down way. The results showed that the differences between AV and A + V were observed at 60–80 ms, 120–180 ms, 220–240 ms, 280–320 ms, 340–360 ms in attended condition, and at 120–180 ms, 220–240 ms, 280–320 ms, 340–360 ms in unattended condition, implying that audiovisual integration occurred both in attended and unattended conditions. In order to determine the contribution of neural oscillations in different frequency band to the modulation of attention on audiovisual integration, we decomposed the waveform of audiovisual integration in attended and unattended conditions respectively into delta-, theta-, alpha-, and beta-bands. As a result, we found significant differences of ERPs related to audiovisual integration on delta- and theta-bands between attended and unattended conditions. For delta-band, divided attention modulated the ERPs at 80–120 ms, 200–400 ms, and 500–600 ms over wide fronto-centro-parietal region. For theta-band, divided attention modulated the ERPs at 40–80 ms over centro-parietal region, 120–160 ms and 200–300 ms over fronto-centro-parietal region.
A number of studies have investigated interactions between attention and integration of multisensory inputs (Bertelson, 1999; Bertelson et al., 2000; Driver, 1996; Talsma & Woldorff, 2005). For example, Driver et al. have shown that the localization of speech sounds can be influenced by lip reading and argued that integration of audiovisual stimuli occurs at a preattentive processing stage (Driver, 1996). Talsma et al. used ERP to evaluate the role of attention in integrating visual and auditory features of multisensory objects (Talsma & Woldorff, 2005). They found multiple stages at which attention can modulate integration processes (Talsma & Woldorff, 2005). More specifically, when stimuli were attended, the multisensory integration effect was larger than when stimuli were unattended as early as 100 ms after stimulus onset (Talsma & Woldorff, 2005). They suggested that attention can act as an early filter that increases the binding together of auditory and visual components of a multisensory stimulus (Talsma & Woldorff, 2005). Similar to our present study, the participants in their study were also asked to attend to both auditory and visual modalities of AV stimuli. However, in contrast to their results, we found an earlier modulation effect of attention to audiovisual integration on theta-band. The difference between attended and unattended audiovisual integration was already appeared on theta-band at 40 ms after stimulus onset, which supported the early-selective theory of attention.
Another important finding was the modulation of divided attention on audiovisual integration on delta-band at a late time window of 500–600 ms, lasting up to 700 ms after stimulus onset. In the study of Talsma et al., followed the first effect of attention at 100 ms after stimulus onset, modulation effects of attention occurred at around 160, at 190, 250, and 300–500 after stimulus onset (Talsma & Woldorff, 2005). As shown in Figure 3, similar to the modulation effect at 300–500 ms in their study, audiovisual integration at 340–360 ms over fronto-centro-parietal region in attended condition and over parietal region in unattended condition were observed in our present study. The temporal distribution of these integration effects are similar to N400, and we speculated that they are related to the semantic integration of visual and auditory stimuli (Wang et al., 2016). In addition, a fronto-parietal network of brain areas has been shown to be involved in allocating and controlling the direction of top-down attention by sending control signals that modulate the sensitivity of neurons in sensory brain regions (Corbetta & Shulman, 2002; Grent-’t-Jong & Woldorff, 2007; Moore et al., 2003; Woldorff et al., 2004; Yantis & Serences, 2003). In line with these previous studies, a larger fronto-parietal activity in attended audiovisual integration in our study suggested that divided attention, as a kind of top-down attention, promoted the processing of audiovisual integration by allocating more attention resources. Therefore, we speculated that divided attention in our present study modulated audiovisual semantic integration, and this modulation of divided attention on delta-band was the lasted effect, which was not found on other frequency bands.
These results suggested that the details of modulation effect of divided attention on multiple frequency bands may be hidden in previous studies. Enhanced oscillations on different frequency bands are associated with information transmission throughout the brain, having different “meanings” and “functions” (Dubé et al., 2013; Keller et al., 2017; Sakowitz et al., 2005; Tavano & Poeppel, 2019). Moreover, the frequency band-specificity systems with different distribution are involved in various stages of audiovisual integration and attention modulation (Xi et al., 2020). By decomposing the audiovisual integration into multiple frequency bands, we uncovered the hidden modulation effects of divided attention. The results in our present study demonstrated that divided attention also can modulate multiple stages of audiovisual integration, and further revealed that theta-band activity contributes to the early modulation of divided attention, and delta-band activity contributes to the late modulation of divided attention to audiovisual integration.
Lower-Frequency Oscillation is the Key to Divided Attention
Neural oscillations reflect rhythmic shifting of neural excitability over a wide range of spatial and temporal scales (Buzsáki & Draguhn, 2004; Fries, 2005; Lakatos et al., 2005). These oscillations play a role in variety of brain operations including stimulus processing (Fries, 2005; Keil & Senkowski, 2018; Lakatos et al., 2005; Womelsdorf et al., 2007), neuronal interactions across areas (Fries, 2005; Womelsdorf et al., 2007), memory formation (Fries, 2005), and cognitive control of input processing (Canolty et al., 2006; Engel et al., 2001). The oscillatory responses on the delta-, theta-, alpha-, and beta-bands are involved in sensory processing and play roles in different stages and regions (Sakowitz et al., 2005). In our present study, we calculated spectral power values of audiovisual integration on delta-, theta-, alpha-, and beta-bands using FFT method. The results of statistical analysis showed that divided attention modulated the delta-band neural activity over front-central region, and the theta-band neural activity over frontal region, but no modulation effect was observed on alpha- and beta-bands. These results suggested that low-frequency oscillation is the key to divided attention.
Mounting evidence indicated that lower-frequency oscillations contribute to active processing and that during rhythmic stimulation, oscillatory in various frequency bands can be enhanced by attention (Ding et al., 2006; Morgan et al., 1996). Tavano and Poeppel showed that the phase coherence on delta- and theta-bands predominantly reflected attention capture by feature changes (Tavano & Poeppel, 2019). Lakatos and others reported that when attended stimuli were in a rhythmic stream, delta-band oscillations in the primary visual cortex entrained to the rhythm of the stream, resulting in increased response gain for task-relevant events and decreased RTs (Lakatos et al., 2008). The delta-band oscillations are associated with attention-selective (Lakatos et al., 2008; Tavano & Poeppel, 2019) and processing-attended task-relevant events (Lakatos et al., 2008). In addition, theta-band is predominantly implicated in cognitive control and short-term memory in audiovisual integration (Keller et al., 2017; Sakowitz et al., 2005; Sakowitz et al., 2000) and plays an important role in bimodal audiovisual stimulus processing. Cortical theta oscillation appears to play a role in divided-attention audiovisual condition when attention is distributed over multiple sensory modalities (Keller et al., 2017). Keller and others designed an experiment, in which participants performed an oddball task with auditory, visual, or simultaneous audiovisual sequences in separate blocks (Keller et al., 2017). The results showed that fronto-central theta-band activity was strongest in divided-attention audiovisual condition, when the participants monitored auditory and visual sequences simultaneously (Keller et al., 2017). Moreover, previous studies have highlighted the importance of frontal and parietal cortical areas as parts of a neural network involved in coordination of multiple parallel tasks. The involved frontal areas include the inferior frontal (Herath et al., 2001; Schubert & Szameitat, 2003; Stelzel et al., 2006) and middle frontal regions (Szameitat et al., 2002; Yoo et al., 2004) and the dorsolateral prefrontal cortex (Corbetta et al., 1991; D’Esposito et al., 1995; Johnson & Zatorre, 2006). The involved parietal areas, in turn, include the superior parietal lobule (Yoo et al., 2004) and intraparietal sulcus (Szameitat et al., 2002). Based on these previous studies, we also measured the effect of divided attention in the fronto-parietal region. However, slightly different from previous studies, we did not find the significant differences of spectral power in the parietal region on delta- or theta-band, and the modulation effect of divided attention was only concentrated in fronto-central region. We believed that this difference may be due to the fact that we analyzed modulation of divided attention on audiovisual integration [AV−(A + V)], whereas previous studies analyzed that on bimodal audiovisual stimuli (AV). Taken together, we concluded that fronto-central delta- and theta-bands activity is likely a marker of divided attention in audiovisual integration, and the neural oscillation on delta- and theta-bands is conducive to allocating attention resources to dual-tasking involving task-coordinating abilities.
Conclusion
In daily activities, we must attend to different information at the same time, for this reason, divided attention gains importance, which tackles two or more stimuli simultaneously. In our present study, we designed a task of audiovisual semantic discrimination, in which the subjects were asked to divide attention to both auditory and visual stimuli. By manipulating the location of stimuli, we obtained the attended and unattended audiovisual integration. We compared the audiovisual integration on delta-, theta-, alpha-, and beta-bands for attended and unattended conditions, exploring the contribution of neural oscillations in lower-frequency to the modulation of divided attention on audiovisual integration. The ERP and spectral power on delta- and theta-bands showed significant differences between attended and unattended audiovisual integration. These results implied that theta-band activity contributes to the early modulation of divided attention, and delta-band activity contributes to the late modulation of divided attention to audiovisual integration. Moreover, the fronto-central delta- and theta-bands activity is likely a marker of divided attention in audiovisual integration, and the neural oscillation on delta- and theta-bands is conducive to allocating attention resources to dual-tasking involving task-coordinating abilities.
Footnotes
Acknowledgements
The authors would like to thank all patients and volunteers for their support.
Declaration of Conflicting Interests
The authors declared no potential conflicts of interest with respect to the research, authorship, and/or publication of this article.
Funding
The authors disclosed receipt of the following financial support for the research, authorship, and/or publication of this article: This work was financially supported by the National Natural Science Foundation of China (grant number: 62206044).
Correction (April 2024):
The article has been updated to correct the incorrect citation of ‘(Julian & Daniel, 2018)' reference as ‘(Keil & Senkowski, 2018)’ in both text and reference list. For further details, please see
<![]() >.
>.