
Abstract
A wealth of studies have shown that humans are remarkably poor at determining whether two face images show the same person or not (face matching). Given the prevalence of photo-ID, and the fact that people employed to check photo-ID are typically unfamiliar with the person pictured, there is a need to improve unfamiliar face matching accuracy. One method of improvement is to have participants complete the task in a pair, which results in subsequent improvements in the low performer (“the pairs training effect”). Here, we sought to replicate the original finding, to test the longevity of the pairs training effect, and to shed light on the potential underlying mechanisms. In two experiments, we replicated the pairs training effect and showed it is maintained after a delay (Experiment 1). We found no differences between high and low performers in confidence (Experiment 1) or response times (Experiment 2), and the content of the pairs’ discussions (Experiment 2) did not explain the results. The pairs training effect in unfamiliar face matching is robust, but the mechanisms underlying the effects remain as yet unexplained.
Photo-ID and Unfamiliar Face Matching
We are used to relying on face photographs as a means of identification. When a security official is presented with photo-ID, they are required to decide whether the person presenting the ID matches the person shown in the photo. A growing body of research has shown that people are, in fact, poor at this sort of unfamiliar face matching task (Bruce et al., 2001; Ritchie et al., 2015; White et al., 2014a). UK police officers (Burton et al., 1999), Australian passport officers (White et al., 2014c), and Australian supermarket cashiers (Kemp et al., 1997), all of whom have jobs that involve checking photo-ID, have been shown to be as error-prone at unfamiliar face matching as undergraduate students. A recent review of 29 unfamiliar face matching tests found over a third of comparisons between professional groups and novices show no differences in performance (White et al., 2021). There were no reliable differences found between novices and facial reviewers (those who conduct a high volume of face identification decisions, such as border control officers). Reliable differences were only found for more specialist groups, such as facial examiners and police super-recognisers. Here, we investigate one potential way of improving unfamiliar face matching performance—completing the task in a pair.
Improving Unfamiliar Face Matching by Changing the Images
There have been some attempts to improve face matching by changing the types of images used. It is widely understood that a person's appearance can vary widely between images, and it has been suggested that this within-person variability is the problem underlying poor unfamiliar face matching performance (Burton, 2013; Burton et al., 2016; Jenkins et al., 2011). Exposure to variability has been shown to be beneficial for learning what a new person looks like (Murphy et al., 2015; Ritchie & Burton, 2017) since this variability is idiosyncratic (Burton et al., 2016). Some studies have therefore applied the idea of exposure to variability to the task of face matching. Although some studies have suggested multiple images can help to improve unfamiliar face matching (Menon et al., 2015; White et al., 2014a), subsequent studies have not replicated this effect (Kramer & Reynolds, 2018; Ritchie et al., 2020, 2021; Sandford & Ritchie, 2021). A recent paper reconciles these differences by showing that in order to find a multiple image advantage, the task must require memory (Ritchie et al., 2021).
Other attempts to improve face matching performance have used face averages comprising multiple images of the same person. Face averages have been shown to produce improvements in computer face recognition (Burton et al., 2005; Jenkins & Burton, 2011), but the evidence for a face average advantage in human face matching is mixed (Ritchie et al., 2018, 2020; White et al., 2014a). Attempts to improve face matching by using different stimuli such as multiple-image arrays or face averages have, therefore, not yielded consistent results.
Improving Unfamiliar Face Matching Through Training
Instead of altering the images used in face matching tasks, another method of improving performance may be to provide training. One study provided trial-by-trial feedback and showed that this training produced both a cumulative improvement within a test, and that it also extended to better performance with new stimuli (White et al., 2014b). Another study, however, suggested that this technique actually serves to prevent a decline in performance, rather than improving overall performance (Alenezi & Bindemann, 2013). A recent investigation of professional facial image comparison training courses showed that those lasting for less than one day do not improve performance, and that a three-day course provided only small, inconsistent improvements (Towler et al., 2019). Therefore, there is mixed evidence that training can improve face matching performance.
Improving Unfamiliar Face Matching Using Group Responses
The “wisdom of the crowd” refers to the fact that predictions or responses averaged across multiple observers are more accurate than responses given by a single observer (e.g., Clemen, 1989). This crowd sampling has been used previously to produce improvements on face matching tests (White et al., 2013, 2015; Jeckeln et al., 2018). As well as sampling a crowd, averaging responses within one participant can also improve estimates, albeit of numbers which are unlikely to be known (e.g., “What percentage of the world's airports are in the United States?” Vul & Pashler, 2008).
One technique which has been shown to produce large and lasting improvements in face identification performance is to carry out the task in pairs, discuss the stimuli, and/or come to a joint decision (Bruce et al., 2001; Dowsett & Burton, 2015). In one study, participants viewed videos of unfamiliar faces either alone or in a pair, with pairs being asked to discuss the videos (Bruce et al., 2001). Participants then completed a face matching task individually, and accuracy on this test was higher for participants who had viewed the videos in a pair compared to those who viewed them alone, suggesting that talking about the faces helped participants to encode them. A more recent study developed the idea of social interaction by asking participants to perform a face matching task together (Dowsett & Burton, 2015). Participants completed three phases: T1—individually; T2—in pairs; T3—individually. In the paired condition, pairs were instructed to discuss the stimuli and come to a joint decision. Pairs outperformed individuals, and crucially in this study, there was a training effect. Each pair was split into the high and the low performer based on their T1 performance. Low performers showed a larger improvement from T1 to T2, and performed more accurately at T3 than they had at T1. The authors argued, therefore, that the low performers had been trained by the high performers during the second, paired phase of the experiment. Furthermore, control experiments showed that the effect was not due to practice, and that participants did not improve when merely performing the task in the presence of the researcher. Therefore, the authors argued that the results were due to social interaction rather than merely social facilitation.
The Current Studies
Here, we are interested in further exploring the pairs training effect first described by Dowsett and Burton (2015). In Experiment 1, we test the longevity of the effect by introducing a week-delay follow-up testing phase. Dowsett and Burton (2015) showed that the benefit from the pairs session continued for the lower performers during a subsequent testing session, administered immediately after the pairs session. If the effect is to be described as “training” then it ought to last longer than the initial testing session. Therefore, we tested participants at least one week after the initial session to ascertain whether the lower performers had been trained to consistently perform the task more accurately.
In Experiment 1, we also address the suggestion made by Dowsett and Burton (2015) that confidence could be the mechanism behind the effect. Dowsett and Burton (2015) suggested that the high performer may have some insight into their ability at the task and is therefore more confident during the pairs session. They go on to suggest the low performer picks up on this confidence and learns to adopt a new strategy, perhaps even stated to them by the high performer during the pairs phase, resulting in their sustained improvement in performance. This confidence hypothesis was supported by subsequent studies in Dowsett's (2015) PhD thesis. There, participants did not complete the task in social pairs, but were shown on screen either the previous participant's response, or their response and their confidence. Only participants who viewed the response and confidence improved. This finding is in line with the weighted confidence sharing model whereby individual confidence is shared in the pair, and the decision of the more confident individual is chosen (Bahrami et al., 2010; Koriat, 2012). In the current study, on each trial, we asked participants to give both their response and their confidence, asking pairs to come to a joint confidence rating. Here, we predict that the higher performers in the pairs will be more confident than the lower performers, and that lower performers’ confidence will increase as a result of completing the task in a pair.
In Experiment 2, we ask whether the content of the discussion during the pairs session shows a consistent pattern which could explain the training effect. This is an exploratory analysis, but we did predict that higher performers may offer up an answer first during the pairs session, as this could be an implicit cue of confidence or ability, signalling that they were more certain of their answer.
In Experiment 2, we also test response times (RTs) as reflecting a potential mechanism behind the effect. There is some evidence that forensic face examiners, who outperform controls at face matching, benefit from taking longer to complete the task (Towler et al., 2020; White et al., 2015). It is likely that this RT difference reflects the longer time taken to carry out the facial comparison procedures used by forensic face examiners. Evidence also exists for a separate fast and intuitive route to making face matching decisions (Towler et al., in prep; Towler et al., 2020). So-called “super-recognisers” are people with naturally exceptional face recognition ability—that is, they have not been trained at the task but consistently out-perform controls. Towler and colleagues (in prep, 2020) have suggested that super-recognisers may respond more quickly than forensic face examiners and controls because their decision making is more instinctive. We therefore measure RTs in our task to ascertain whether higher performers take longer to make decisions than lower performers, reflecting a more analytical method as in forensic face examiners, or make decisions more quickly reflecting an intuitive response as in super-recognisers.
Across Experiments 1 and 2, we also assess the relationship between performance and participants’ own insight into their face recognition/perception abilities using the Stirling Face Recognition Scale (SFRS; Bobak et al., 2019). Here, we predict that higher performers would be more accurate than lower performers in their assessment of their own face recognition/perception abilities, possibly leading them to be more confident and express that confidence during the pairs testing phase.
Experiment 1. Longevity of Effect, and Confidence as Training Mechanism
In this first experiment, we sought to first replicate Dowsett and Burton's (2015) pairs training effect whereby pair performance is higher than individual performance on an unfamiliar face matching task, and that the pairs effect produces a lasting improvement, particularly for the poorer performers in each pair. We sought to extend this by introducing an additional week-delay follow-up test to assess whether the training effect is long-lasting. In addition, we followed the suggestion of Dowsett and Burton (2015) that confidence may provide a mechanism for the pairs training effect, with higher performers being more confident, and essentially training lower performers to also be more confident. To this end, on each trial, we asked participants to indicate whether the two images showed the same person, and to indicate their confidence on a seven-point Likert scale.
Method
Participants
Forty participants (20 females, 20 males; 37 self-reported White; mean age: 20 years, range: 18–24 years) took part in the experiment. We based our sample size on Experiment 3a in Dowsett and Burton (2015) which used 36 participants.
Stimuli and Procedure
The stimuli were those used in Experiment 3 of Dowsett and Burton (2015), known as the Models Face Matching Test (MFMT). The images are full-colour photos of White male models, cropped to show only the face, and show natural variability (see Figure 1). All images were cropped to 300 × 420 pixels. The MFMT comprises 90 trials—half are match trials in which the two images show the same person, and half are mismatch trials showing two different people. The 90 trials are split into three different blocks which the authors state are of equal difficulty, each containing 15 match and 15 mismatch trials (see Dowsett & Burton, 2015, for details).
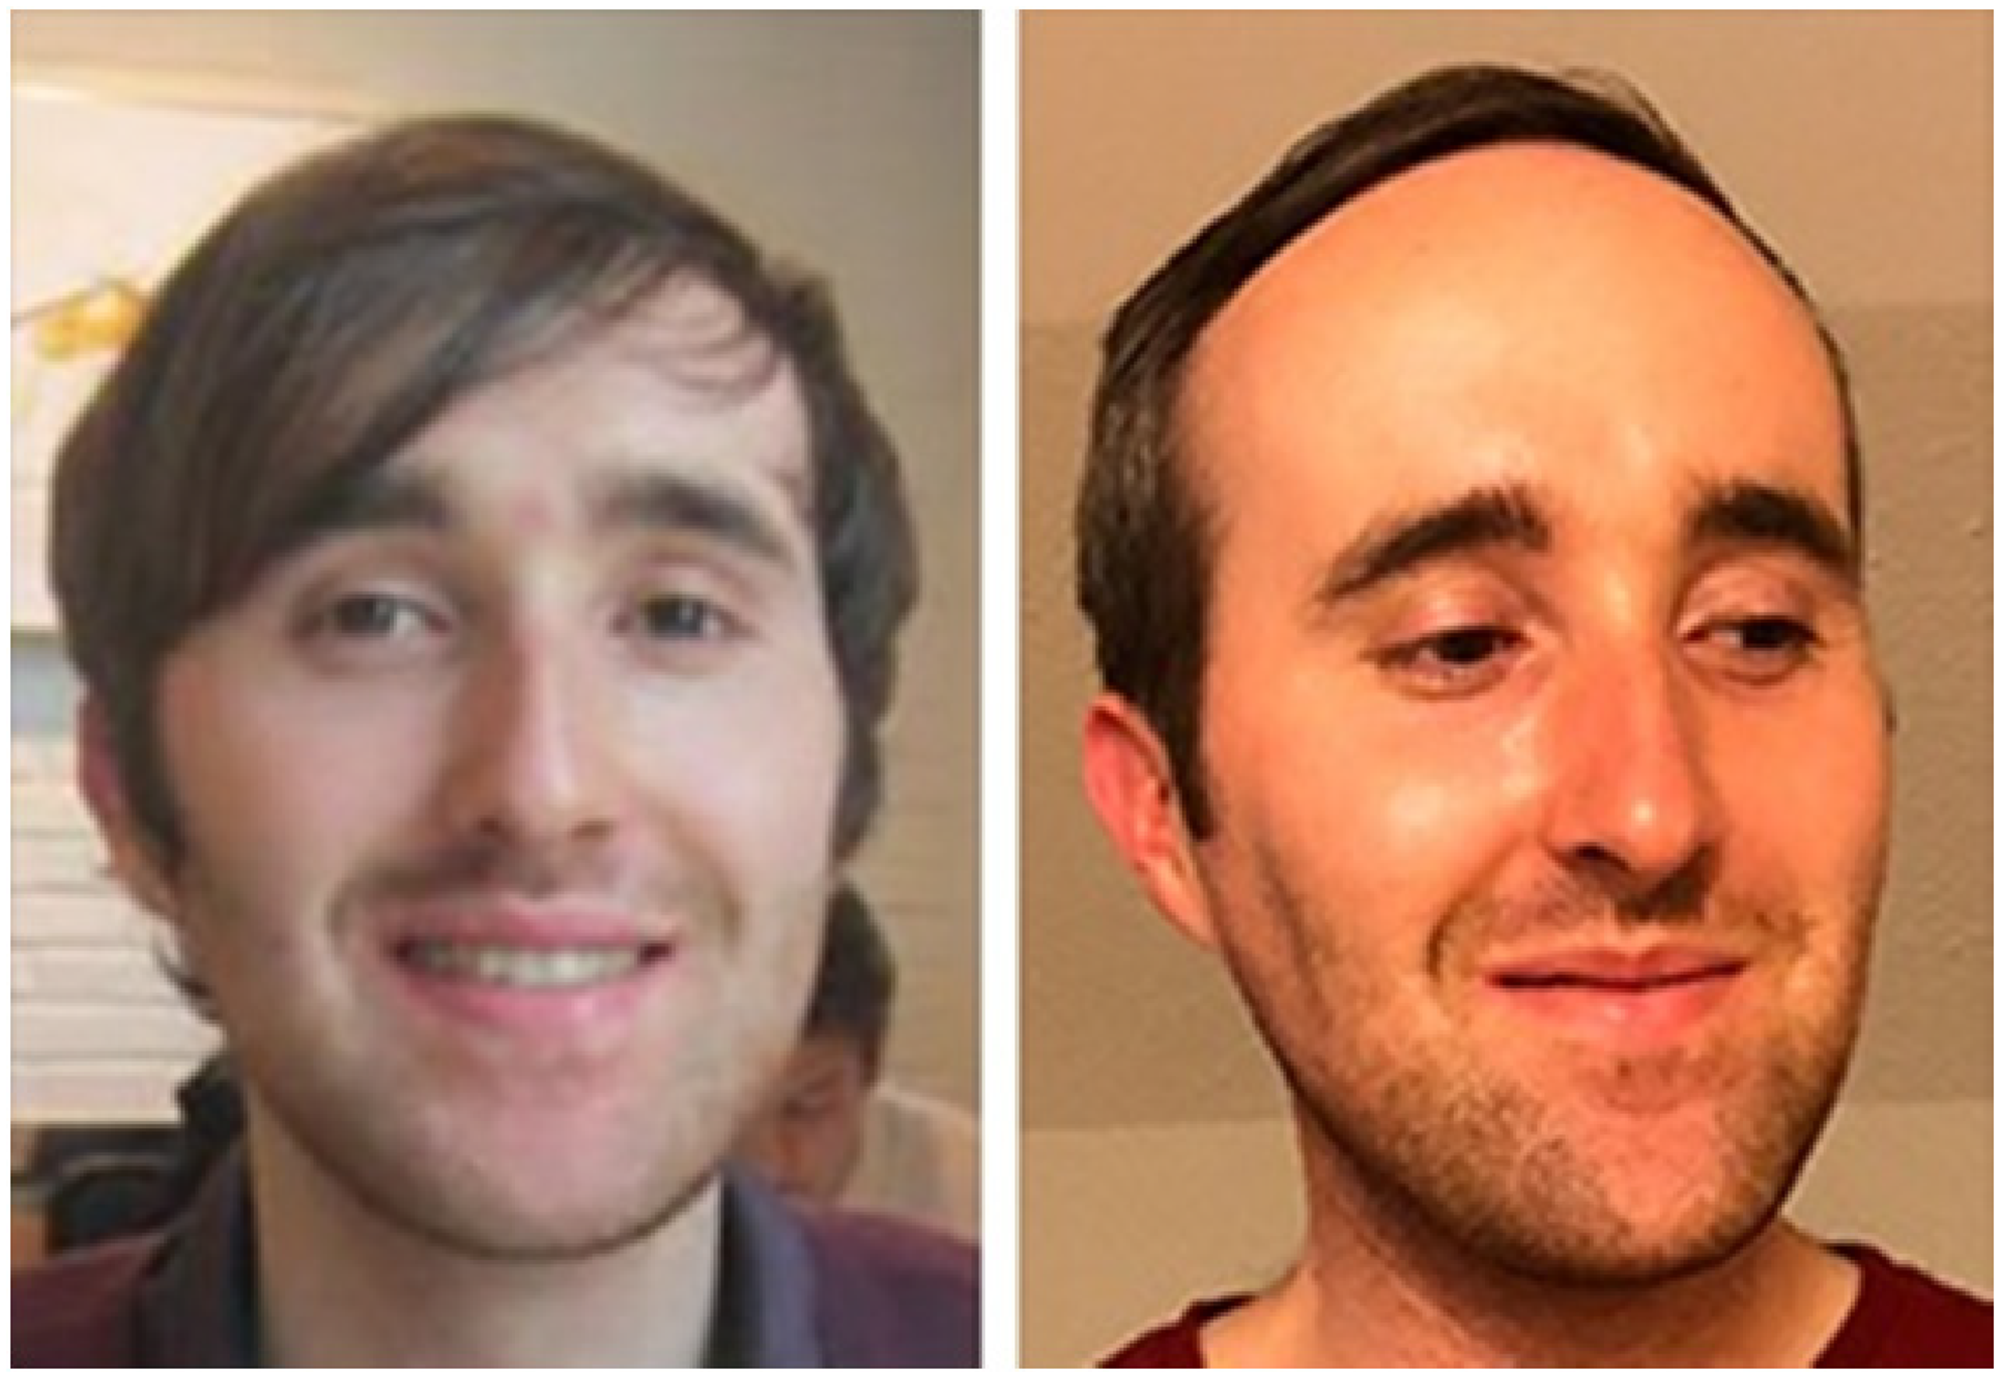
Example match trial stimuli. (Copyright restrictions prevent publication of the images used in the experiment. These images are illustrative of the experimental stimuli and depict someone who did not appear in the experiments but has given permission for the images to be reproduced here).
Participants were recruited in pairs, and each pair comprised two friends who were familiar with each other prior to the experiment. This is a deviation from the Dowsett and Burton (2015) paradigm who recruited pairs who were unfamiliar with each other. Before completing the face matching tasks, all participants completed the SFRS (Bobak et al., 2019), adapted from a 20-item questionnaire used for diagnosing developmental prosopagnosia (Shah et al., 2015). This was used as a self-report measure of face recognition/perception ability.
After completing the SFRS, participants completed the face matching task. Each of the four phases of the experiment comprised 30 trials (half match). Pairs were seated back-to-back in the same room and completed the T1 (individual) face matching task. During the individual phases of the experiment, participants were instructed not to communicate with each other or look at each other's screens. This was monitored by the experimenter, who was present throughout T1–T3. Immediately following T1, participants were seated together at the same computer and completed the T2 (pairs) task, where they were instructed to discuss the images on screen and come to a joint decision as to whether they showed the same person or two different people (following Dowsett & Burton, 2015). Immediately following this, participants were again seated back-to-back to complete the T3 (individual) matching task. This concluded the first lab-based testing phase. One week later, participants were emailed a link to an online version of the face matching task and instructed to complete this alone (T4, individual). The T4 task was administered using the online platform, Qualtrics.
The order of blocks was fixed, such that all participants saw the same blocks at T1–T3. Each identity appeared only once across these three blocks, and the order of trials within blocks was randomised across participants. Because the MFMT comprises only three blocks, at T4 (delay) we repeated the block of trials used at T1. We selected the T1 block to be reused as this was the first block seen during the initial testing session and so this placed the maximum amount of time between the repeated blocks. A control experiment in which participants viewed all four blocks in order individually (that is not paired with another participant) did not show improvement from T1 to T4 (the repeated T1 block), and in fact showed that block three shown at T3 was more difficult than the other blocks, therefore any observed effects are not due to the order of the blocks (see Supplemental Materials, section 1). In all four blocks, participants viewed the two face images side-by-side and were asked to respond via a button press, communicating whether the images showed the same person or two different people. On every trial, participants were also asked to rate how confident they were in their response from 1 (not very confident) to 7 (very confident).
Results and Discussion
Data Analysis
In addition to traditional frequentist hypothesis testing, we included Bayes factors using JASP (JASP Team, 2020; default priors used for all analyses) for key comparisons in which we compare high and low performers, which allowed us to quantify the extent to which the data support the alternative hypothesis (BF10). Thirty participants completed the T4 (delay) phase of the matching task, and of these, 14 were “high performers” in their pair, as defined by their performance at T1, and 16 were “low performers.” For each pair, we defined the high and the low performer based on their performance at T1. Therefore, in each pair, the person with the higher T1 performance was designated as the “high performer” for that pair. High and low performance was taken from T1 percent correct for 19 of the pairs, with d-prime (d′) being used to separate the performance of the final pair whose percentage accuracy was identical (see Supplemental Materials, section 3 for a full explanation of how d′ was calculated). The analyses presented here follow those of Dowsett and Burton (2015). Additional analyses are presented in the Supplemental Materials.
Analysis of Delay Duration for T4
Although participants were sent the link to T4 one week after they completed T1–T3, many participants failed to complete the task that day. The mean delay between T1–T3 and T4 was 20 days (range: 7–54). The delay was, however, equivalent across both the high performers (M = 19, range: 7–54) and the low performers (M = 22, range: 7–49), t(28) = 0.457, p = .651, d = 0.17, BF10 = 0.37. There was no correlation between the length of delay before T4 and T4 performance (see Supplemental Materials, section 2).
Accuracy – Replication of Dowsett and Burton (2015)
We first analysed the results using a one-way repeated measures ANOVA (T1, T2, T3) following Dowsett and Burton (2015). This analysed all participants’ data together, irrespective of whether they were the high or low performer and established that working in a pair improves performance in general. The results showed a significant main effect of experimental session F(2, 78) = 17.38, p < .001, ηp2 = 0.31, BF10 = 51,389.29. Bonferroni-corrected pairwise comparisons showed significantly higher accuracy at T2 (the pairs session; M = 84.00%) than at T1 (the pre-pair individual session, M = 73.42%, p < .001, d = 1.16, BF10 = 5,241.00), and higher accuracy at T2 compared to T3 (the post-pair individual session, M = 78.42%, p = .003, d = 0.62, BF10 = 29.34). Accuracy at T3 was also significantly higher than accuracy at T1, p = .027, d = 0.49, BF10 = 4.30. The same pattern was found using a generalised linear mixed-effects model (see Supplemental Materials, section 3). This replicates Dowsett and Burton's (2015) pairs training effect whereby people perform more accurately on a face matching task when they work in a pair rather than individually. Moreover, the pairs training effect produced a lasting benefit whereby performance remained higher than baseline in an individual task immediately following the pairs phase.
Accuracy – Analysis of the Pairs Training Effect for High and Low Performers
Given our hypothesis that pairs training would affect the performance of the low performer in each pair but not the high performer, we now added T4 performance to our analysis and analysed accuracy data separately for high and low performers who completed T4. Where high performers’ accuracy did not change between experimental sessions, low performers improved in the pair and remained more accurate than they began.
For the high performers in each pair, a one-way (T1, T2, T3, T4) ANOVA showed a non-significant effect of experimental session, F(3, 39) = 1.30, p = .287, ηp2 = 0.09, BF10 = 0.35. For the low performers, the ANOVA showed a significant main effect of experimental session, F(3, 45) = 25.60, p < .001, ηp2 = 0.63, BF10 = 2.34 × 10⁹. Follow-up Bonferroni corrected paired samples t-tests showed that performance at T2 (M = 83.96%) was significantly higher than performance at T1 (M = 65.42%, p < .001, d = 2.36, BF10 = 59,582.78) and T4 (M = 73.75%, p = .001, d = 1.44, BF10 = 221.07), but not T3 (M = 77.29%, p = .095, d = 0.75, BF10 = 3.74). Performance at T1 was significantly lower than at all three other experimental sessions (all ps < .01, all ds > 1, all BF10 > 100), and there was a non-significant reduction in performance between T3 and T4 (p = .756, d = 0.41, BF10 = 0.75, see Figure 2). These results show that the pairs training effect improved the performance of the low performer in each pair, and that this effect was still evident after a delay. It is also possible to analyse the data separately in terms of match and mismatch trials, and using signal detection measures. The training effect from T1 to T3 for low performers cannot be explained by a change in bias or a shift of criterion (see Supplemental Materials, section 4). The observed effects cannot be explained simply by regression to the mean, as the above analysis shows that low performers’ accuracy increased with no accompanying decrease in high performers’ accuracy. The control experiment further rules out regression to the mean (see Supplemental Materials, section 1). Finally, the control experiment shows that low performers in Experiment 1 perform no differently at T1 from control participants who completed all four blocks on their own, but perform significantly better than control participants at T3 and T4 (see Supplemental Materials, section 1).
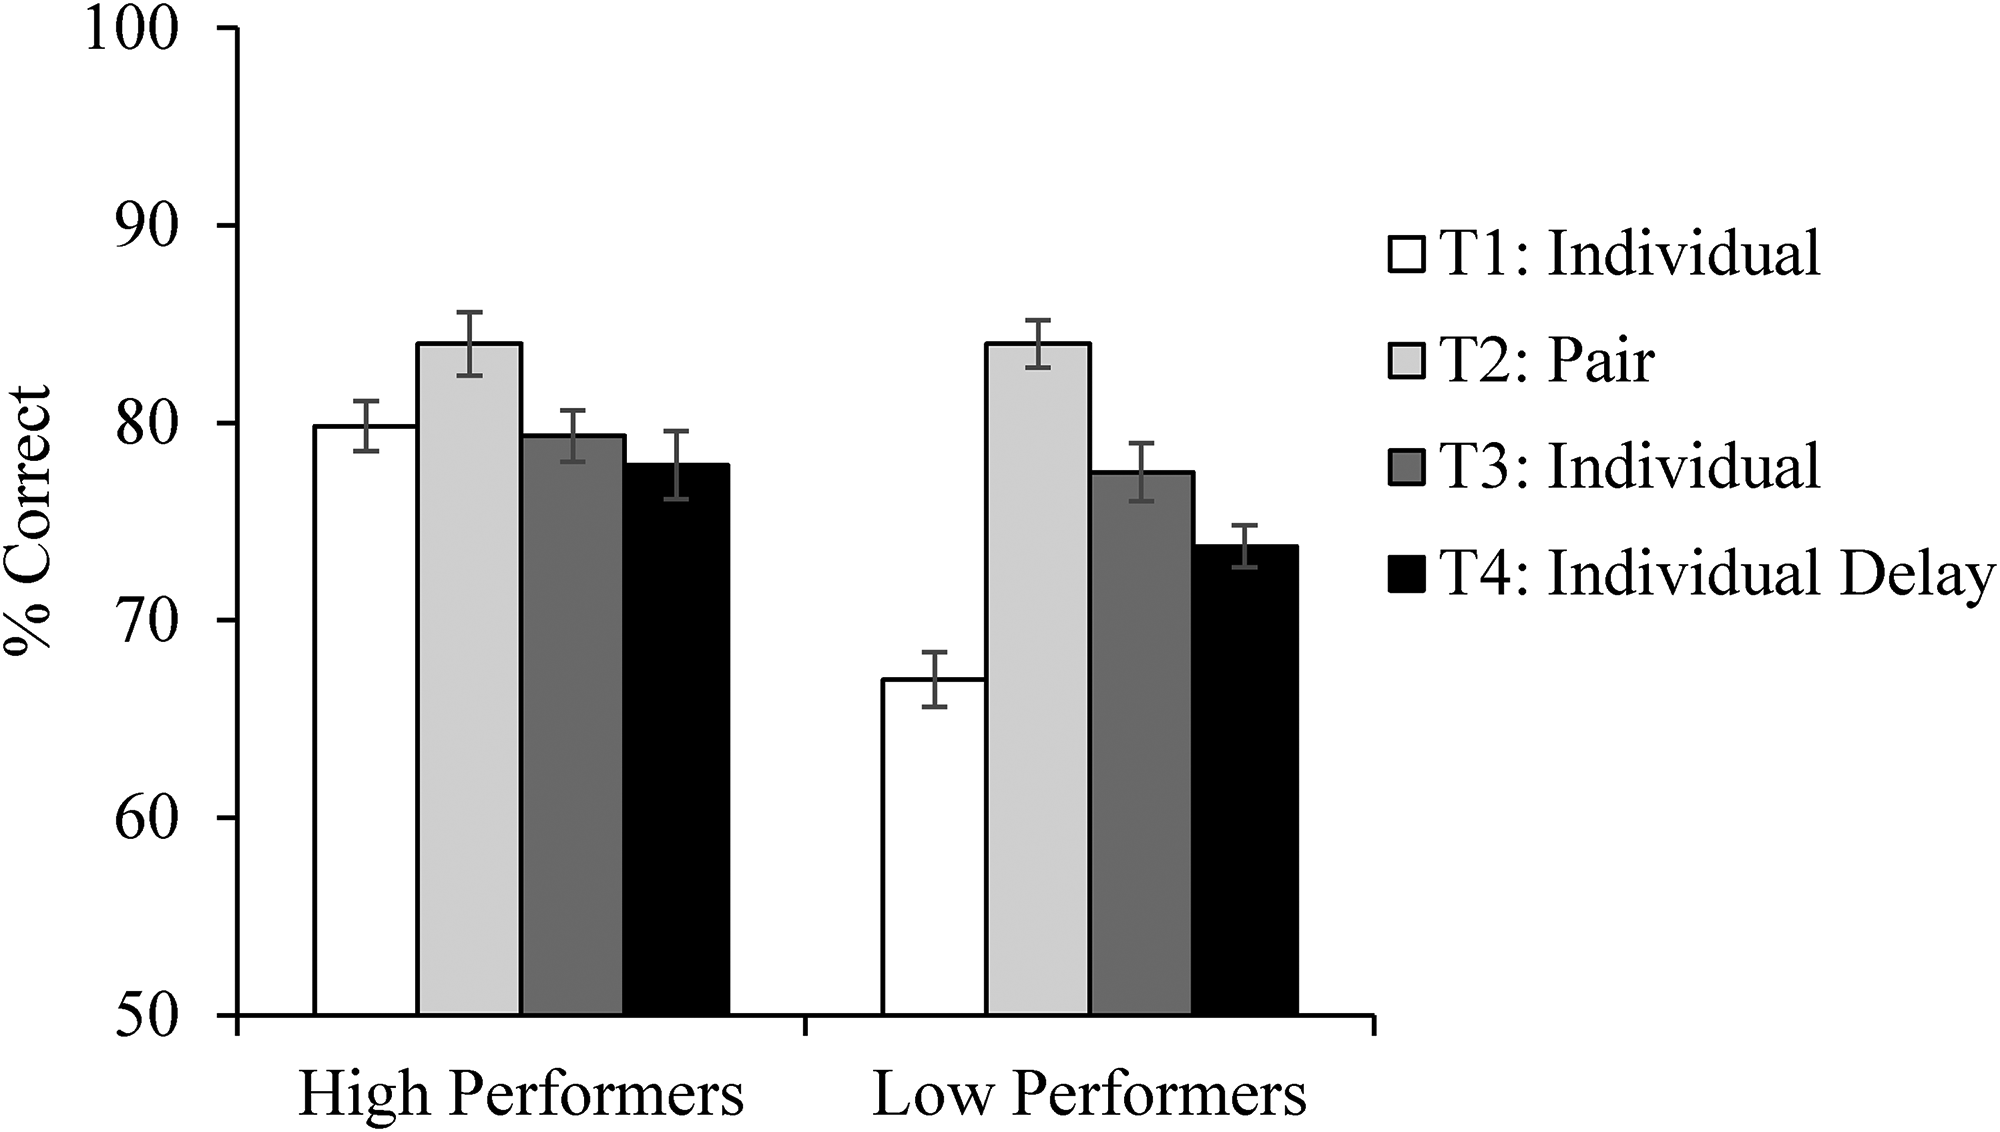
Accuracy data for the face matching task in Experiment 1, separately for high and low performers as defined by performance at T1. Error bars show the within-subjects standard error (Cousineau, 2005).
Accuracy – Are Low Performers Trained to be as Good as High Performers?
It was also of note to establish whether pairs training improved the low performers to be as good as the high performers. These analyses ultimately showed that although low performers began more poorly than the high performers, following the pairs training session there were no differences between the groups. We ran a 3 (within-subjects factor of time: T1, T3, T4) × 2 (between-subjects factor of pair member: high, low) mixed ANOVA which showed a significant main effect of pair member, F(1, 28) = 4.83, p = .036, ηp2 = 0.15, BF10 = 19.82, a significant main effect of time, F(2, 56) = 6.60, p = .003, ηp2 = 0.19, BF10 = 81.94, and a significant interaction, F(2, 56) = 6.44, p = .003, ηp2 = 0.19, BF10 = 37.08.
To test the interaction, we ran three independent-samples t-tests comparing performance between pair members at T1, T3, and T4 (all p-values are Bonferroni corrected). Although accuracy was different between the high and low performers at T1, t(38) = 4.92, p < .001, d = 1.56, BF10 = 1003.926, the differences at T3 and T4 were non-significant (T3: t(38) = 0.57, p > .999, d = 0.18, BF10 = 0.35; T4: t(38) = 1.28, p = .243, g = 0.47 (Hedge's g for effect size for unequal sample sizes), BF10 = 0.64. The results suggest that the pairs training removed the difference between high and low performers at subsequent testing sessions, even after a lengthy delay. This result should be interpreted with caution as the Bayes factor indicates weak evidence for the null hypothesis (Goodman, 2005).
Finally, we sought to explain the pairs training effect by examining the amount of gain made by each low performer between T1 and T3. It may be reasonable to expect that the bigger the difference in T1 performance between the high and low performer in each pair, the greater the gain the low performer would make from T1 to T3. We found a non-significant correlation between high and low performer difference at T1 and the gain made between T1 and T3 by the low performer, r(18) = .30, p = .197, BF10 = 0.60. We may also suspect that the better the high performer, the bigger the gain the low performer would make. There was a non-significant correlation between the performance of the high performer at T1 and the gain made by the low performer between T1 and T3, r(18) = −.19, p = .435, BF10 = 0.37. These results suggest that the difference between high and low performers, and the overall performance of the high performer at T1, does not explain the gain made by low performers between T1 and T3.
Confidence – Analysis for High and Low Performers
We analysed participants’ confidence responses in the same way as the accuracy data above. We ran separate ANOVAs for the high and low performers who completed T4. The analyses did not show a clear pattern of results. For the high performers, a one-way (T1, T2, T3, T4) ANOVA showed a significant main effect F(3, 39) = 7.74, p < .001, ηp2 = 0.37, BF10 = 87.40, with Bonferroni-corrected pairwise comparisons showing that confidence at T2 (M = 5.37) was significantly higher than confidence at T3 (M = 5.00, p = .018, d = 0.85, BF10 = 5.92) and T4 (M = 4.73, p < .001, d = 1.23, BF10 = 424.15). No other comparisons were significant (all ps > .05). For the low performers, there was a significant main effect, F(3, 45) = 4.98, p = .005, ηp2 = 0.25, BF10 = 9.16, with Bonferroni-corrected pairwise comparisons showing higher confidence at T3 (M = 5.54) than T4 (M = 5.13, p = .024, d = 0.68, BF10 = 10.79, all other ps > .05). These results do not mimic the pattern of results found for the accuracy data, and so it is unlikely that the pairs training effect observed in the accuracy data for the low performers was due to increased confidence as a result of performing the task with a more accurate partner.
Confidence – Comparing the Groups
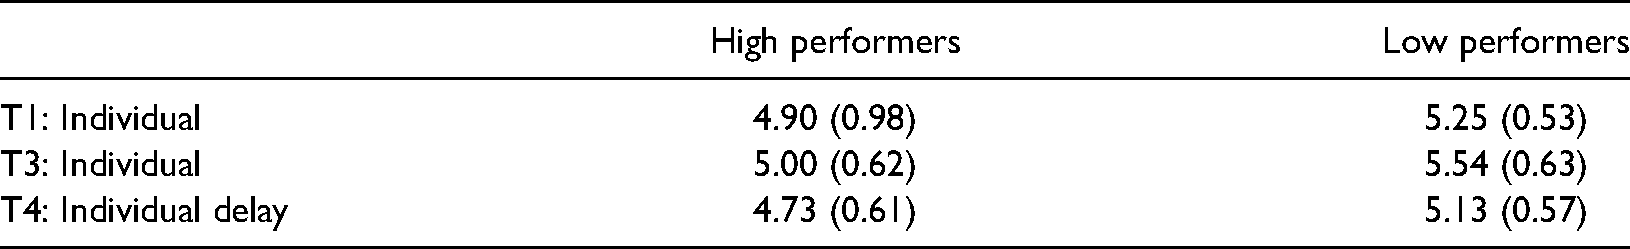
Previous research has shown that the pairs advantage for accuracy in perceptual tasks can be replicated simply by taking the response of the more confident person in each pair (Koriat, 2012). Therefore, we should see that the higher performers are also the more confident performers. To examine this in our data, we ran three independent-samples t-tests (Bonferroni corrected) comparing confidence between pair members at T1, T3, and T4 for those who completed all sessions. There were no differences in confidence between high and low performers at any testing session, although the Bayes factor shows weak evidence for the null hypothesis (all ps > .05, all medium effect sizes, T1 BF10 = 0.70, T3 BF10 = 3.02, T4 BF10 = 1.24). The effects remain non-significant when we include all participants (i.e., not just those who completed T4). Our results do not correspond with Koriat's (2012) results that show the pairs effect can be replicated by taking only the response of the more confident pair member. In fact, the low performers in our pairs rated their confidence consistently numerically higher than our high performers (see Table 1), although this was not borne out in our statistical analyses.
Mean confidence (on a 1–7 scale) for high and low performers for blocks completed individually (only for participants who completed T4). Parentheses show standard deviations.
Discussion of Experiment 1 Results
This experiment replicated the pairs effect described by Dowsett and Burton (2015). Pairs outperformed individuals on an unfamiliar face matching task. When we separated the pair members into high and low performers, the pairs training effect was only present for the low performers. This effect extended to a follow-up testing session (T4) completed on average 20 days after the initial training session, with no correlation between length of delay and T4 performance. This suggests that the pairs training effect is robust and long-lasting. We also established that confidence is unlikely to be the mechanism behind the effect, and that higher performers are not more confident than lower performers. In the next experiment, we test whether RT could reflect a mechanism underlying the pairs training effect, and whether there is a pattern in what the pairs say to each other that could help to explain the effect.
Experiment 2. Response Times and Pair Interaction
In this experiment, we recorded participants’ RTs to establish whether RT differences between high and low performers could reflect a mechanistic difference between the groups. We also filmed pairs during the interaction phase (T2) of the experiment in order to analyse the content of their discussions. Pairs’ discussions were transcribed in order to be subjected to thematic analysis. Thematic analysis was selected in order to allow us to identify and interpret patterns in the type of strategies or content of the discussions that could help to explain the pairs training effect.
Method
Participants
We recruited new participants for this experiment. Two pairs were excluded from the analysis due to scoring exactly the same number of correct match and mismatch responses at T1, therefore making it impossible to identify a high and low performer. These two pairs were replaced, leaving us with 40 participants (29 females, 11 males; 38 self-reported White; mean age: 23 years, range: 18–48 years) who took part in the experiment. As in Experiment 1, each pair comprised two friends who were familiar with each other prior to the experiment. Again, we based our sample size on Experiment 3a in Dowsett and Burton (2015) which used 36 participants.
Stimuli and Procedure
The stimuli and procedure were the same as those used in Experiment 1 but for four changes. First, participants only completed T1–T3 in this experiment, with no follow-up session. Second, participants did not indicate confidence in this experiment, and so each trial required only one response indicating whether or not the images showed the same person. Third, in this experiment, we recorded RT on every trial. Fourth, we filmed the pairs as they completed T2 so that we had a record of their discussions for each trial. At the beginning of the recording, the pairs were asked to identify themselves using their participant numbers so that we could code utterances by pair member (high, low) retrospectively. Both pair members remained in view throughout T2 to ensure for coding purposes that it was obvious who was speaking.
Results and Discussion
Data Analysis
Again, high and low performance was taken from T1 percent correct for 19 of the pairs, and as in Experiment 1, d-prime (d′) was used to separate the performance of the final pair whose percentage accuracy was identical.
Accuracy – Replication of Dowsett and Burton (2015)
Following the analysis in Experiment 1, we first analysed the results using a one-way repeated measures (T1, T2, T3) ANOVA using all participants’ data. As in Experiment 1, the analyses showed that working in a pair improves performance. The results showed a significant main effect of experimental session, F(2, 78) = 26.56, p < .001, ηp2 = 0.41, BF10 = 1.03 × 10⁷. Bonferroni-corrected pairwise comparisons showed significantly higher accuracy at T2 (the pairs session, M = 84.17%) than at T1 (the pre-pair individual session, M = 73.08%, p < .001, d = 1.23, BF10 = 408,976.11), and higher accuracy at T3 (the post-pair individual session, M = 80.83%) compared to T1, p < .001, d = 0.86, BF10 = 674.20. Accuracy at T3 was not significantly higher than accuracy at T2, p = .067, d = 0.38, BF10 = 2.06. The same pattern was found using a generalised linear mixed-effects model (see Supplemental Materials, section 5). These results replicated both Dowsett and Burton (2015) and the pairs training effect reported in Experiment 1, whereby participants perform more accurately on a face matching task when they worked in a pair, rather than individually. Once again, the pairs training effect produced a lasting benefit whereby performance remained higher than baseline in an individual task immediately following the pairs phase.
Accuracy – Analysis of the Pairs Training Effect for High and Low Performers
Again, we analysed accuracy data separately for high and low performers. As in Experiment 1, low performers benefited from working in a pair, and remained more accurate than they began. For the high performers in each pair, a one-way (T1, T2, T3) ANOVA showed a significant effect of experimental session, F(2, 38) = 3.59, p = .037, ηp2 = 0.16, BF10 = 1.86. Bonferroni-corrected pairwise comparisons showed significantly higher accuracy at T2 (M = 84.17%) than T1 (M = 78.83%, p = .045, d = 0.61, BF10 = 3.74). No other comparisons were significant (all ps > .05, all BF10 < 1). For the low performers in each pair, a one-way ANOVA showed a significant effect of experimental session, F(2, 38) = 37.50, p < .001, ηp2 = 0.66, BF10 = 4.19 × 10⁷. Bonferroni-corrected pairwise comparisons showed significantly higher accuracy at T2 (M = 84.17%) than T1 (M = 67.33%, p < .001, d = 2.24, BF10 = 733,703.62), and significantly higher accuracy at T3 (M = 79.00%) than T1, p < .001, d = 1.48, BF10 = 947.76. The difference between T2 and T3 performance was non-significant, p = .060, d = 0.57, BF10 = 2.92 (see Figure 3). Once again, we performed supplementary analyses on the accuracy data, breaking it down into match and mismatch trials, and using signal detection measures. As in Experiment 1, the training effect from T1 to T3 for low performers cannot be explained by a change in bias or a shift of criterion (see Supplemental Materials, section 6).
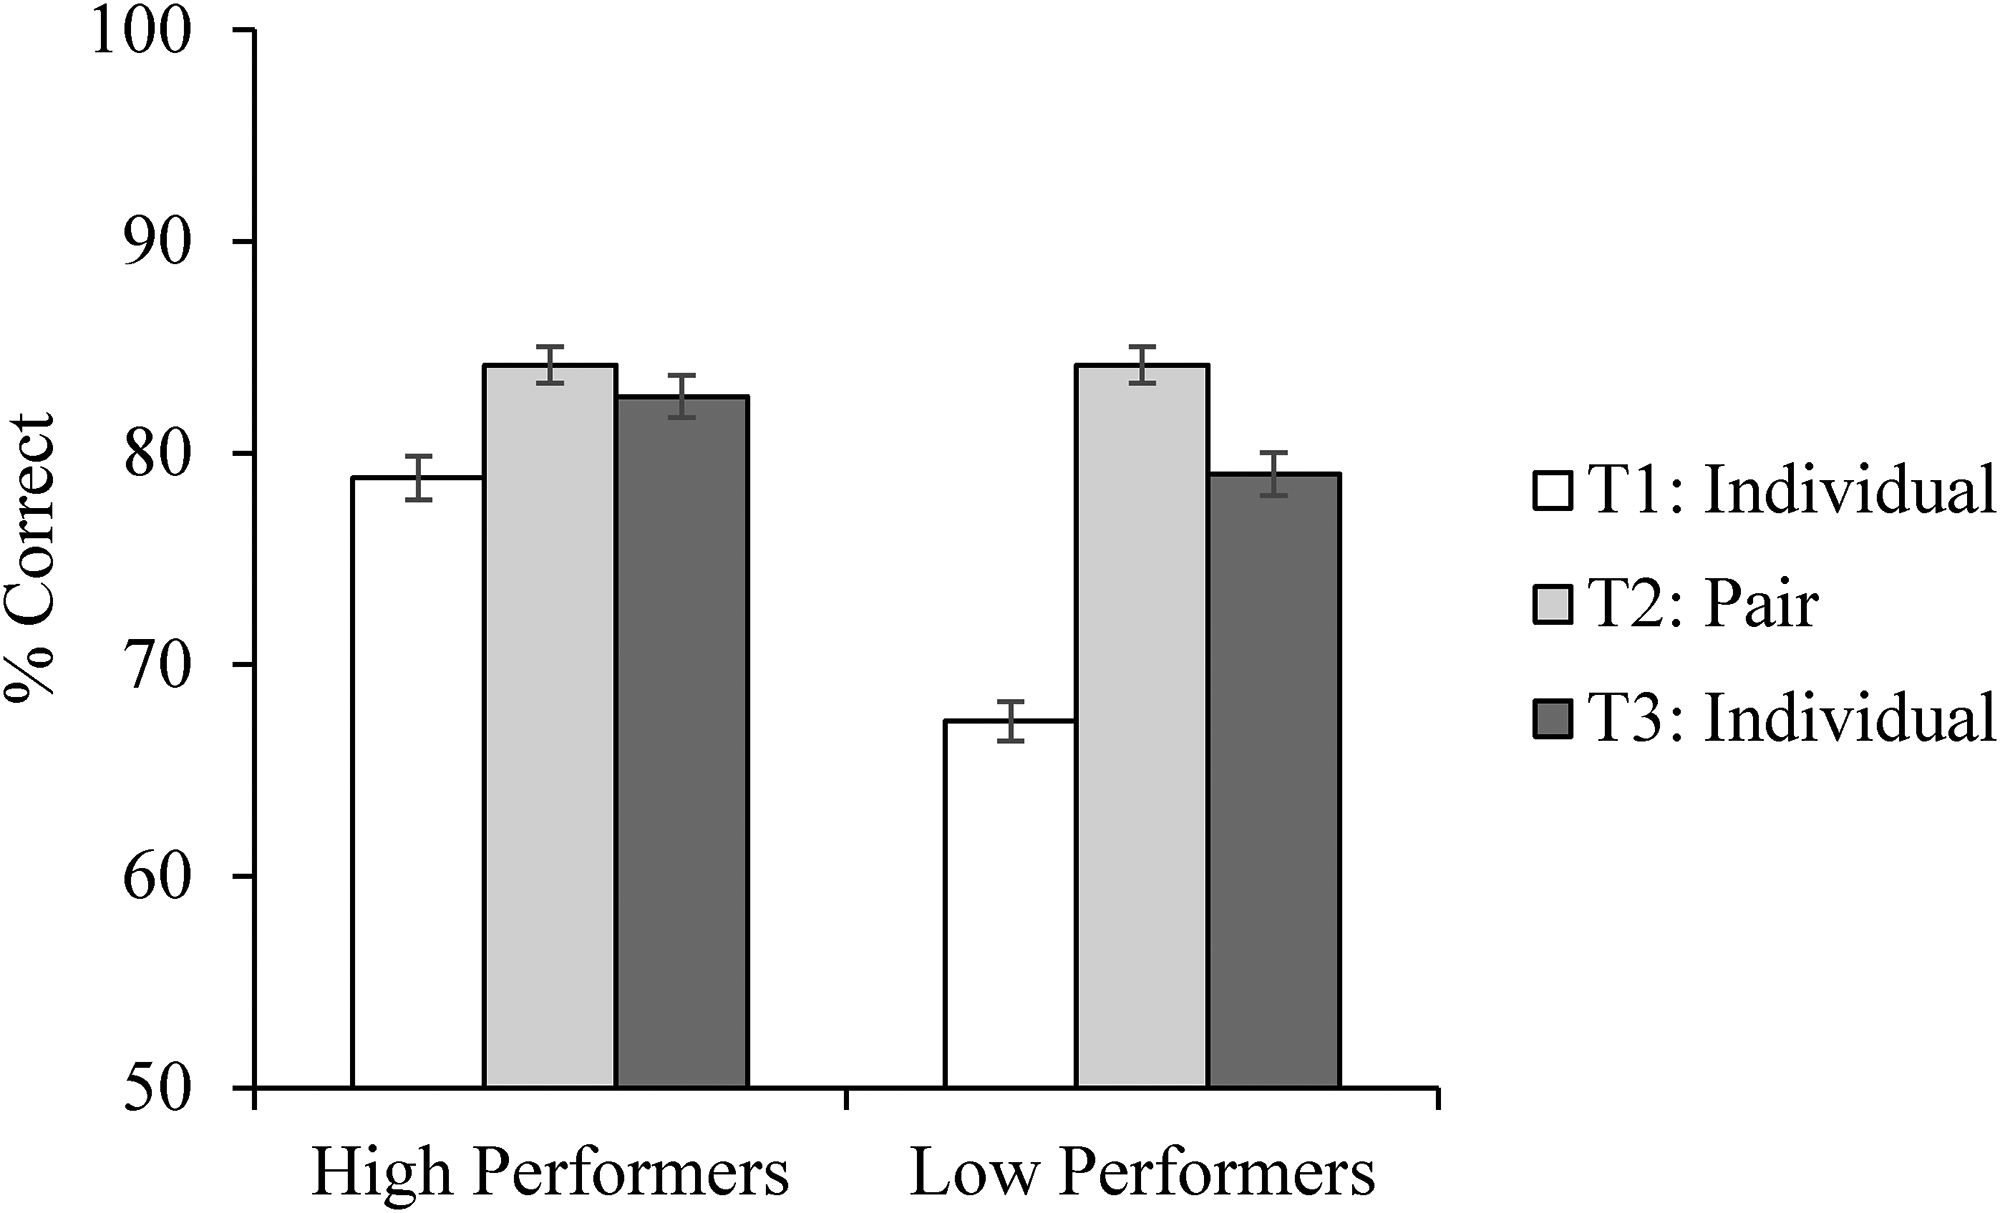
Accuracy data for the face matching task in Experiment 2, separately for high and low performers as defined by performance at T1. Error bars show the within-subjects standard error (Cousineau, 2005).
Are Low Performers Trained to be as Good as High Performers?
Again, we tested whether pairs training improved the low performers to be as good as the high performers. Here again we found no differences between the groups following the pairs training session. To establish this, we ran a 2 (within-subjects factor of time: T1, T3) × 2 (between-subjects factor of pair member: high, low) mixed ANOVA which showed a significant main effect of pair member F(1, 38) = 13.98, p < .001, ηp2 = 0.27, BF10 = 134.17, a significant main effect of time F(1, 38) = 25.09, p < .001, ηp2 = 0.40, BF10 = 7,882.86, and a significant interaction F(1, 38) = 6.41, p = .016, ηp2 = 0.14, BF10 = 134.17.
To investigate the interaction, we ran two independent-samples t-tests comparing performance between pair members at T1 and T3 (p-values are Bonferroni corrected). Although accuracy differed between the high and low performers at T1, t(38) = 4.86, p < .001, d = 1.54, BF10 = 846.20, the difference at T3 was non-significant, t(38) = 1.35, p = .186, d = 0.43, BF10 = 0.63, although the Bayes factor shows weak evidence for the null hypothesis (Goodman, 2005). This showed that the pairs training removed the difference between high and low performers in the subsequent testing session.
As in Experiment 1, we examined the amount of gain made by each low performer between T1 and T3 in an attempt to explain the pairs training effect. As in Experiment 1, we found a non-significant correlation between high and low performer difference at T1 and the gain made between T1 and T3 by the low performer, r(18) = .22, p = .357, BF10 = 0.41 1 . There was also a non-significant correlation between the performance of the high performer at T1 and the gain made by the low performer between T1 and T3, r(18) = −.04, p = .871, BF10 = 0.28 2 . As in Experiment 1, these results suggested that the difference between high and low performers, and the overall performance of the high performer at T1, did not explain the gain made by low performers between T1 and T3.
Response Times – Analysis by Group
We have not measured RTs in a traditional sense, as participants were not instructed to respond as quickly as possible, indeed the paradigm at T2 encourages the participants to take time to discuss responses. After log transformation, RTs at T2 remained non-normally distributed (see Supplemental Materials, section 7 for full details of RT transformations). This reflects the bimodality of the data whereby participants either came to a quick agreed decision or spent a long time discussing their answers. We therefore removed T2 from the main analysis in the manuscript, as the question of note here is not whether pairs take longer to respond than individuals, but rather whether high performers are faster/slower than low performers at T1, and whether low performers learn to adjust their speed accordingly.
We analysed participants’ RTs using a 2 (pair member: high, low) × 2 (experimental session: T1, T3) mixed ANOVA. The results did not reveal differences in RTs between the groups. The ANOVA showed a non-significant main effect of pair member, F(1, 38) = 0.13, p = .723, ηp2 < .01, BF10 = 0.30, a non-significant main effect of session, F(2, 76) = 1.25, p = .271, ηp2 = 0.03, BF10 = 0.29, and a non-significant interaction between experimental session and pair member, F(2, 76) = 0.06, p = .801, ηp2 = 0.002, BF10 = 0.10. The RT data did not show differences between pair members. Therefore, high performers neither took longer to perform the task, which might have been reflective of a similar analytical process to that used by forensic face examiners (Towler et al., 2020; White et al., 2015), nor did they respond faster, perhaps reflecting a more intuitive response as observed with super-recognisers (Towler et al., in prep; Towler et al., 2020).
Content of the Discussion
Dowsett and Burton (2015) suggested that “a full content analysis of the interactions [between participants] may be revealing” (p. 444). We therefore filmed participants’ discussions during T2 of this experiment in order to establish whether the content of these discussions revealed patterns which could explain the mechanism behind the pairs training effect. Across all pairs, conversations for each trial were very limited, mainly consisting of one pair member suggesting an answer (i.e., same or different), and the other simply agreeing or disagreeing. Even in instances where more was said, discussions were minimal (transcripts are available from the corresponding author upon request). Due to the limited nature of the discussions, it was not possible to perform a meaningful thematic analysis. We did, however, make thematic word clouds using NVivo 12 in order to look for meaningful patterns in the discussions (see Figure 4).
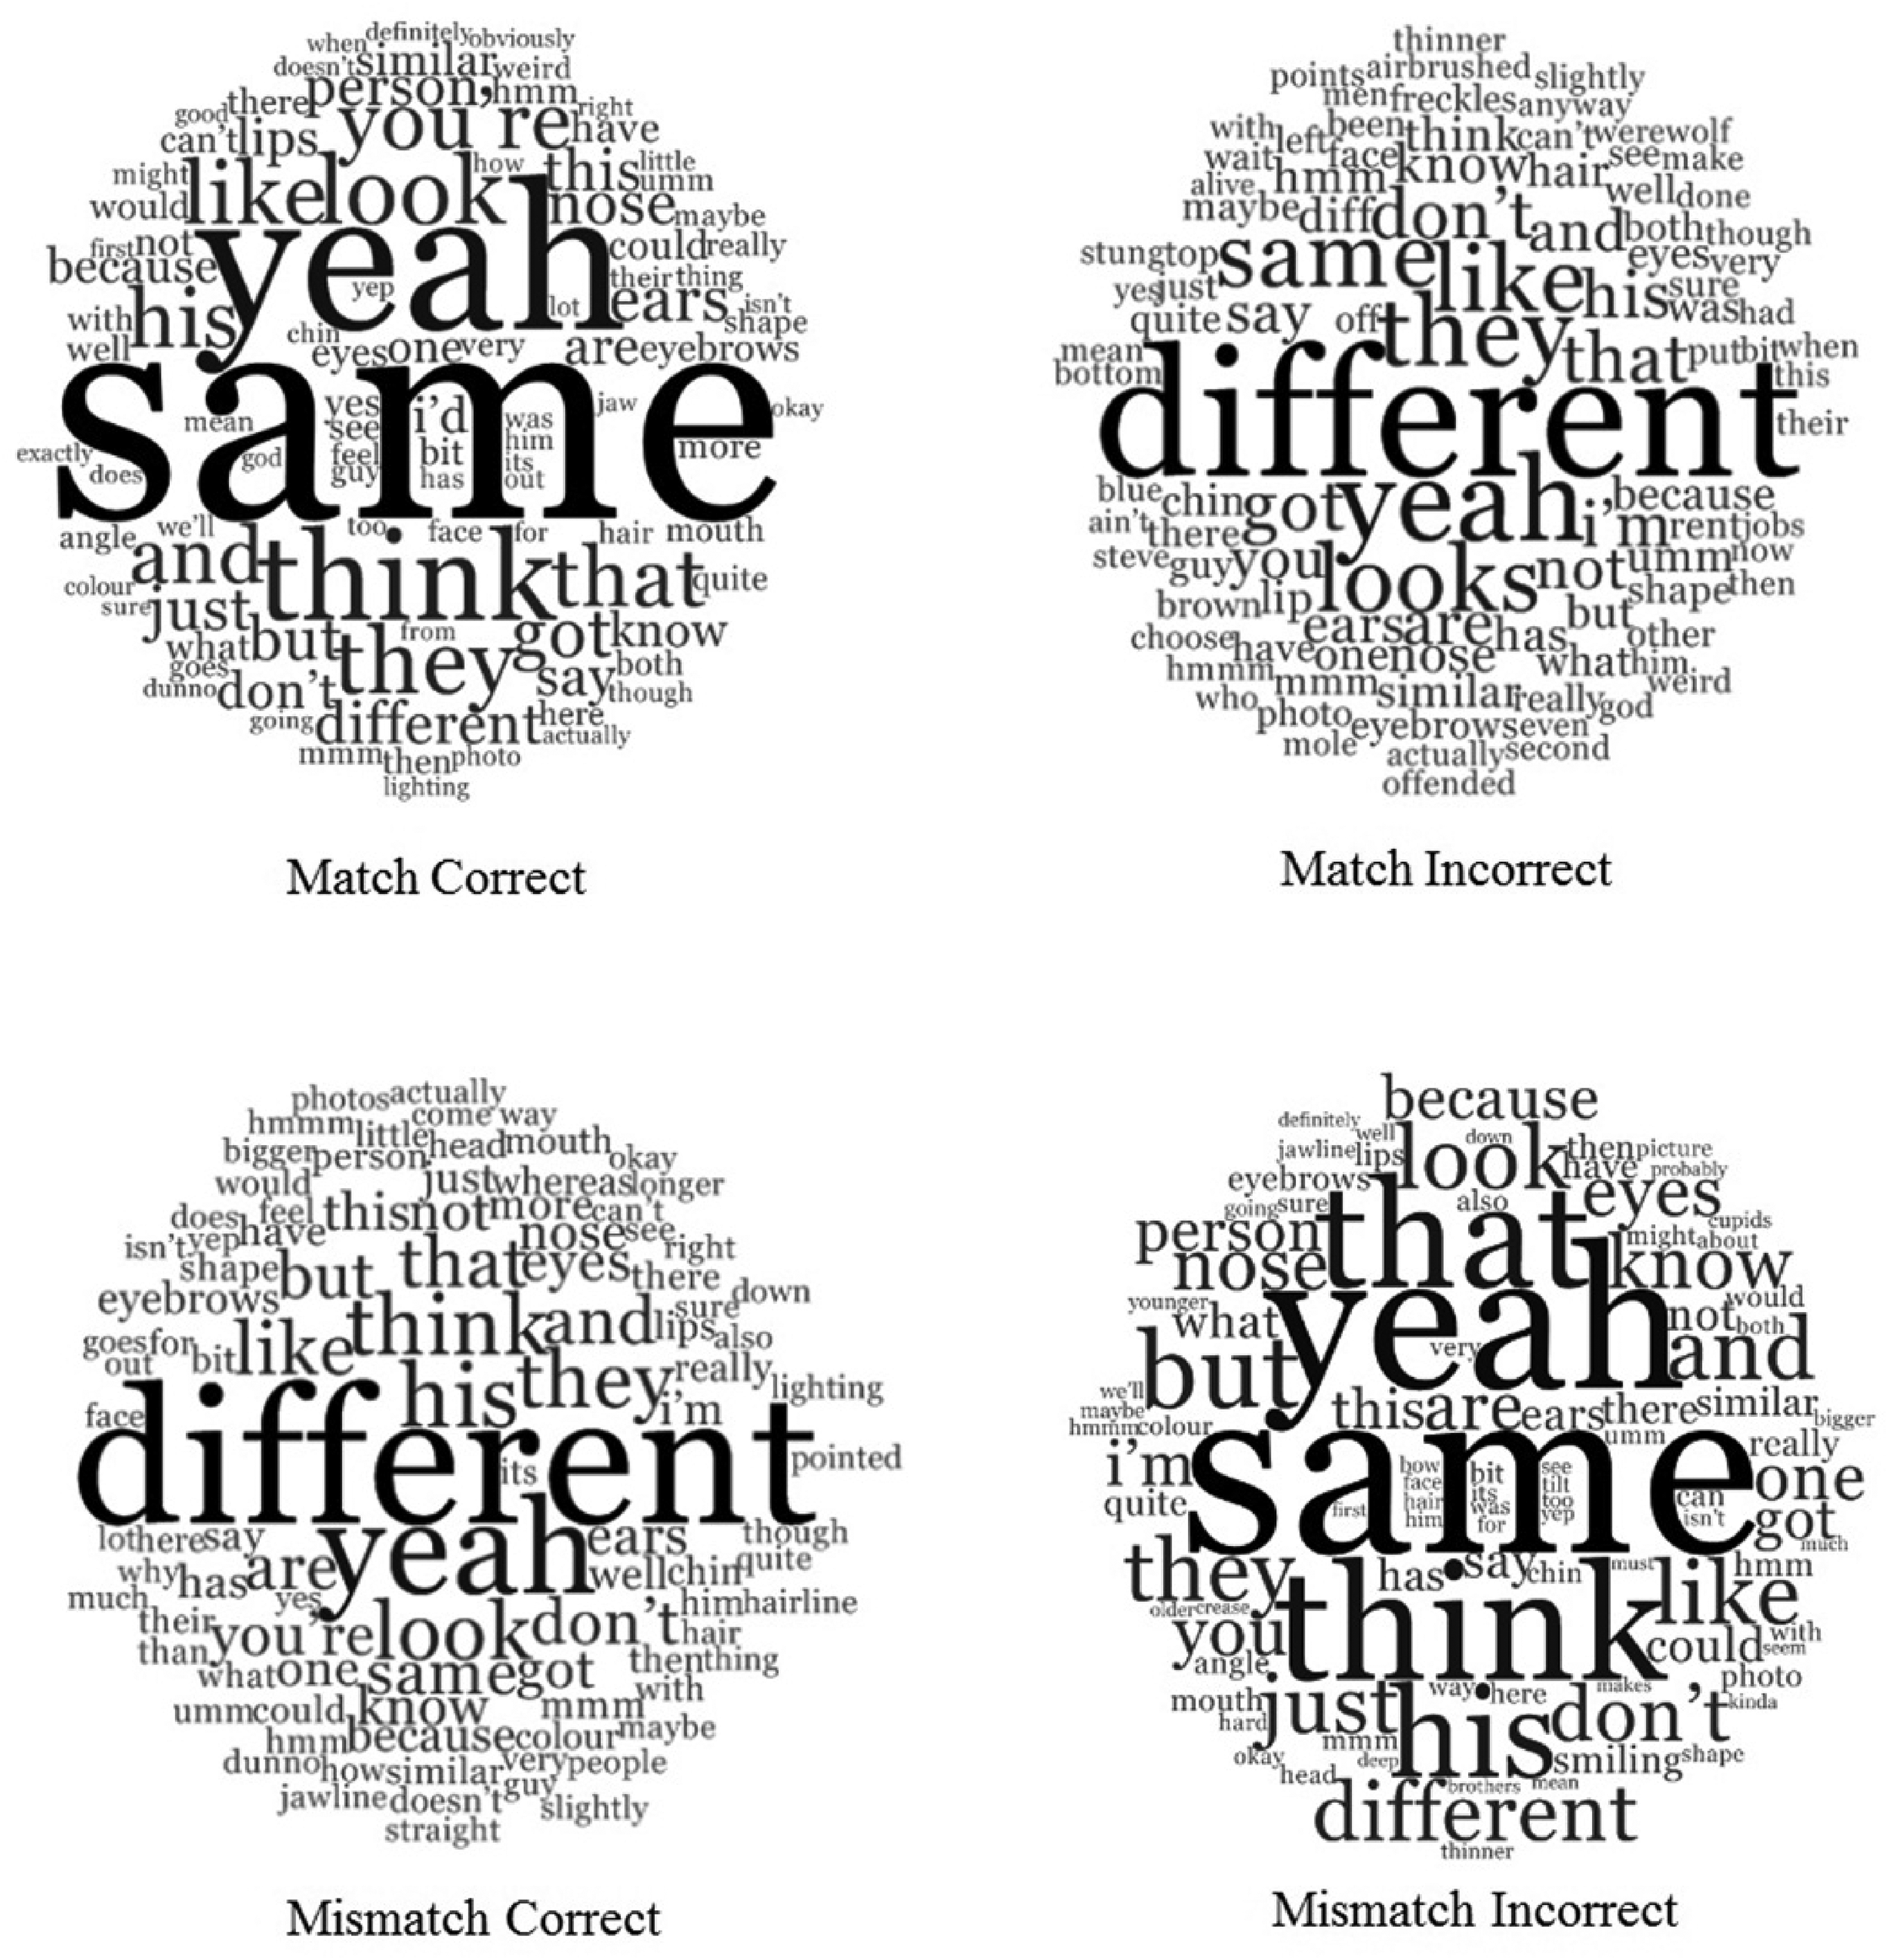
Word clouds depicting the content of pairs’ discussions for match and mismatch trials responded to correctly and incorrectly. Larger font size represents more frequent words.
We included all words greater than two characters except for the word “the,” and collated stemmed words together, for example, “think, thinking,” “look, looked, looking, looks.” Non-word utterances such as “uh-huh” were also included. It is clear from the word clouds (larger words represent higher frequency) that participants mainly state a response, that is, “same” or “different,” with “same” being said more on match trials which are responded to correctly and mismatch trials which are responded to incorrectly (vice versa for “different”). Unfortunately, this does not give us any more information than the accuracy scores. There also appeared to be a lot of agreement (“yeah”) and justification for statements (e.g., “look,” “think”). This is not surprising given that the task required that participants come to a joint decision. This qualitative exploration of the content of the discussions has, therefore, not shed any light on mechanisms underpinning the pairs training effect. The top 50 most common words per trial type are listed in the Supplemental Materials (see Supplemental Materials, section 8).
Quantifiable Factors of Conversations
For each pair, we counted the number of trials for which the high performer offered up an answer first. Giving an answer first could be an implicit cue of confidence or ability, signalling that they were more certain of their answer. We therefore hypothesised that high performers would give an answer first on the majority of trials, and that the number of trials on which the high performer answered first would correlate with pair performance. Across the 20 pairs in this experiment, the high performer offered an answer first on the majority of trials (i.e., more than 15 of 30 trials) in only six pairs. The mean number of trials on which the high performer gave an answer first was 13. The correlation between number of trials on which the high performer gave an answer first, and T2 performance was non-significant, r(18) = −.02, p = .919.
It may be reasonable to expect that certain quantifiable aspects of the conversations, such as how many words are spoken, or whether facial features are discussed, may be different across correct and incorrect trials. We calculated the number of words spoken on each trial (including non-word utterances such as “uh-huh”), giving us the mean number of words spoken by each pair on match and mismatch trials on which they responded correctly and incorrectly (bearing in mind there were a number of pairs who made no errors on match trials). Number of words was used as a proxy for the richness of the discussion. A 2 × 2 repeated measures ANOVA (accuracy: correct, incorrect; trial type: match, mismatch) showed a significant main effect of accuracy, F(1, 9) = 5.40, p = .045, ηp2 = 0.38 with more words spoken on incorrect (M = 69.67) compared to correct (M = 44.16) trials. There was a non-significant main effect of trial type, F(1, 9) = 3.05, p = .115, ηp2 = 0.25, and a non-significant interaction, F(1, 9) = 1.43, p = .263, ηp2 = 0.14. There was no difference, however, between the number of words spoken across the paired block by the high (M = 393.80) compared to the low performer (M = 440.50), t(19) = 0.47, p = .647, d = 0.12.
We also investigated whether pairs mentioned facial features more on trials in which they went on to respond correctly. There was no difference in the number of trials on which facial feature(s) were mentioned for either correct or incorrect trials (correct: t(19) = 0.95, p = .354, d = 41; incorrect t(19) = 0.30, p = .772, d = 0.09). Therefore, focussing the discussion on facial features did not explain the pairs effect.
We calculated frequencies per pair indicating how many times the high performer introduced a new facial feature into the discussion, and how many times the high performer disagreed with the low performer. Each trial was coded as 1 or 0. Neither measure significantly correlated with paired performance (features: r(18) = .40, p = .082; disagreements: r(18) = −.07, p = .778).
All pairs viewed the same trials at T2, albeit in a different random order. This allowed us to compare discussions of individual trials. Although we might expect to see specific facial features being discussed on specific trials (e.g., one matching pair of images having the same ear shape), there was some variety in participants’ discussions of facial features. Taking one of our mismatching trials as an example, 19/20 pairs answered correctly. Eleven pairs mentioned at least one facial feature (the pair who answered incorrectly did not). Pairs mentioned between one and four features, with the eyes being mentioned seven times; eyebrows four times; lips and mouth three times (but only once by the same pair); chin, hair, nose, and ears were each mentioned twice; and a mole was mentioned once. Taking a matching trial as a second example, 17/20 pairs answered correctly. Twelve pairs mentioned at least one facial feature (including one of the pairs who answered incorrectly). Pairs mentioned between one and five features, with the nose and ears being mentioned six times (only three pairs mentioned both nose and ears); lips five times; hair, freckles, mouth, chin, and eyebrows were each mentioned twice; and facial hair and eyes were each mentioned once. It was clear, therefore, that many facial features were mentioned, but all pairs did not mention the same features on the same trials.
Stirling Face Recognition Scale
The SFRS (Bobak et al., 2019) assesses people's perceptions of their face recognition/perception abilities, and consists of 20 questions rated on a scale from 1 to 7, with a maximum possible score of 140. To test reliability, as in Bobak et al. (2019), we analysed the SFRS scores using PCA, with very similar results as in the original paper (see Supplemental Materials, section 9). Of greater interest to our study was the comparison of SFRS scores between our high and low performers. If people have good insight into their face recognition abilities, this measure should separate our high and low performers. To increase the sample size, we combined the data from both experiments, giving us 80 participants, looking only at T1 performance as these scores are a “pure” measure of the individuals’ ability, where later performance was influenced by working in a pair. First, we split SFRS score based on participants’ performance at T1. An independent-samples t-test showed a non-significant difference in SFRS score between high (M = 98.55) and low performers (M = 98.50), t(78) = 0.02, p = .988, d < .01, BF10 = 0.23. Pearson's correlations showed that SFRS score did not correlate with overall percent correct at T1, r = .10, p = .371; match trial percent correct, r = .02, p = .843; or mismatch trial percent correct, r = .11, p = .345. These results cannot be explained by a lack of difference in T1 accuracy between our high and low performers as this was a statistically significant difference when taking all 40 pairs together (high M = 78.67%, low M = 67.83%, independent samples t-test: t(78) = 5.86, p < .001, d = 1.31, BF10 = 106,621.04). Our results did not show the same pattern observed by Bobak et al. (2019) who found a correlation between SFRS score and accuracy on the MFMT (Dowsett & Burton, 2015). A recent paper using a task in which participants searched for faces in crowds failed to find a significant correlation between search performance and participants’ SFRS scores (Mileva et al., 2021). The authors concluded that the lack of correlation may indicate that people do not have insight into their own face recognition ability, as suggested in the original SFRS paper (Bobak et al., 2019). This may also be true for the current study.
General Discussion
Here, we sought to test the longevity of the pairs training effect in unfamiliar face matching, and shed light on the mechanism underlying the effect. Across two experiments, we successfully replicated the pairs training effect whereby pairs outperformed individuals in an unfamiliar face matching task, with the lower performer in each pair improving substantially and remaining more accurate at the task after completing it with someone else.
Performance across all participants increased from T1 to T2 in both experiments. When we split participants into the high and low performers from each pair based on T1 performance, the high performers received a benefit at T2 compared to T1 in Experiment 2 but not Experiment 1. In both experiments, however, low performers improved from T1 to T2, and that improvement compared to baseline remained at T3 (Experiments 1 and 2), and T4 (Experiment 1). Moreover, in both experiments, there was no difference between the accuracy of the high and low pair members at T3 (Experiments 1 and 2), and T4 (Experiment 1), despite there being a significant difference at baseline (T1). Therefore, we have shown strong evidence for the pairs training effect, particularly for training poorer performers.
We sought to test different mechanisms underlying the pairs training effect. Dowsett and Burton (2015) suggested that this effect could rely on confidence with high performers having more insight into their ability and being more confident during the paired session, which may then be picked up by low performers and result in them changing their strategy. Here, however, we did not find an effect of confidence. In Experiment 1, high performers were no more confident than low performers, and confidence did not increase as a result of performing the task in a pair. Participants were, however, more confident on trials in which they answered correctly compared to incorrectly, as has been shown previously (Bruce et al., 1999; Hopkins & Lyle, 2020; Stephens et al., 2017), and this effect was present for both high and low performers (see Supplemental Materials, section 3). We also sought to measure implicit confidence by analysing the content of the pairs’ discussions (Experiment 2). Here, we hypothesised that the high performer may speak more than the low performer, perhaps indicating higher confidence in their answers. We did not find support for this, nor for other possible measures of implicit confidence such as speaking first, disagreeing with the other pair member, or offering an answer first. Future research may seek to analyse the content of pairs’ discussions when they are also asked to rate their confidence, perhaps showing some subtle differences between high and low performers’ confidence.
In Experiment 1, we tested the longevity of the effect by asking participants to complete the first block of the task individually again after a delay (T4, mean delay duration 20 days). Here, we found that low performers’ accuracy remained higher at T4, and in fact was no different to high performers’ T4 accuracy. This tells us that the training effect is not transient, and that whatever the low performers are learning from completing the task in a pair, they are able to retain and use this information or strategy after a delay.
In Experiment 2, we analysed RT data to establish whether this could reflect a difference in strategy between high and low performers. We found no differences in RT between the high and low performers. Therefore, we can rule out either a slow, meticulous strategy as used by forensic face examiners who show longer RTs than controls (Towler et al., 2020; White et al., 2015) or a fast, intuitive mechanism as reflected by super-recognisers’ shorter RTs (Towler et al., in prep; Towler et al., 2020).
Diagnostic feature training—instruction to focus on ears and facial marks—has been shown to improve face matching accuracy (Towler et al., 2021). Across three different tests of face matching, the authors found that diagnostic feature training led to no benefit with one test which uses face pairs containing one high- and one low-quality image, but a 6% benefit with both the Expertise in Facial Comparison Task (White et al., 2015) and the Glasgow Face Matching Test (Burton et al., 2010). The pairs effect reported here yielded higher increases in performance from T1 to T2 (11% in both experiments, considering both high and low performers together). This increased to 17% in Experiment 1 and 19% in Experiment 2 when looking only at the low performers. In terms of training—the gain made by low performers from T1 to T3—our pairs paradigm yielded a higher training benefit than the diagnostic pairs training (12% in both Experiments 1 and 2). Our results could have practical implications for settings in which people are required to judge identity from images of unfamiliar people, for example, passport issuing or border control. Our results suggest that two people working together on these types of tasks would increase accuracy. Moreover, our results suggest that members of the team who are poorer at the task could be trained by a partner simply in virtue of completing the task together.
We have shown improvement through working in a pair, particularly for the low performer in each pair, however, we have only shown improvement within one task. In other tests of the effectiveness of face identification training, transfer tests have been used to examine whether training with one set of images generalises to another that has been captured in different conditions (e.g., White et al., 2014c). It is possible that in our task participants learn something specific about the way in which the male models pictured vary between images. For example, in the test used here, the same model can look very different in two images as the images are taken from different photoshoots by different photographers working to different briefs. Whereas in other tests such as the Glasgow Face Matching Test (Burton et al., 2010), images of each person were taken moments apart, limiting within-person variability. Therefore, it is important that future research test whether the pairs training effect would extend to see an improvement on a different face matching test after completing pairs training with the current set of stimuli.
It is important to note that social collaboration is not the only method of combining responses in order to lead to improved accuracy. The “wisdom of the crowd” is a phenomenon whereby averaging responses across a number of individuals yields higher accuracy than an individual's responses (e.g., Clemen, 1989). This principle has been used in face matching tests whereby responses are combined without participants taking part in the task together. In two different studies of face matching using expert (forensic face examiners) and non-expert (student) populations, face matching accuracy increased as group size increased (White et al., 2013, 2015). A more recent paper investigated the social benefit of paired face matching decision making by having participants complete a face matching task together in a “social” pair (i.e., in person), or by averaging the responses of two individuals, creating a “non-social” pair (Jeckeln et al., 2018). Pairs (social and non-social) outperformed individuals, with no added benefit of collaboration in the social pair. The authors also showed that the performance of the pair was predicted by the decisions of the high performer in each pair. There was an added benefit of combining multiple responses, with peak performance with a crowd size of eight, which performed almost perfectly (area under the receiver-operating curve = .98). Therefore, combining responses from multiple people can lead to improved accuracy without the need for social collaboration.
Conclusions
Here, we replicated the original pairs training effect described by Dowsett and Burton (2015), but did not find support for mechanisms underlying the effect, such as differences in confidence or RTs between high and low performers. In addition, analysing the content of the pairs’ discussions shed no further light on any underlying mechanisms explaining the effect. Performing face matching tests in pairs leads to a robust increase in performance, and a sustained improvement for the lower performer in the pair, although the mechanism underlying this effect remains a mystery.
Supplemental Material
sj-docx-1-pec-10.1177_03010066221096987 - Supplemental material for The pairs training effect in unfamiliar face matching
Supplemental material, sj-docx-1-pec-10.1177_03010066221096987 for The pairs training effect in unfamiliar face matching by Kay L. Ritchie, Tessa R. Flack, Elizabeth A. Fuller, Charlotte Cartledge and Robin S. S. Kramer in Perception
Footnotes
Acknowledgements
The authors would like to thank Chloe Jowett, Bethany Raven, Sam Wagland, and Ellen Wheeler for help with data collection, and Alice O’Toole for advice on a previous version of the manuscript.
Declaration of Conflicting Interests
The authors declared no potential conflicts of interest with respect to the research, authorship, and/or publication of this article.
Funding
The authors received no financial support for the research, authorship, and/or publication of this article.
Supplemental material
Supplemental material for this article is available online.
Notes
References
Supplementary Material
Please find the following supplemental material available below.
For Open Access articles published under a Creative Commons License, all supplemental material carries the same license as the article it is associated with.
For non-Open Access articles published, all supplemental material carries a non-exclusive license, and permission requests for re-use of supplemental material or any part of supplemental material shall be sent directly to the copyright owner as specified in the copyright notice associated with the article.