
Abstract
The objective of this study is to study the influence of ocular variables in the perception of #thedress and to develop a logistic regression model that could help predict it. This is a cross-sectional study on 1,100 subjects. People who did not report one of the two main perceptions were excluded from the study. Dress perception was codified as 0 (white&gold) or 1 (black&blue). The association between dress perception and demographic and main ocular variables (age, gender, binocular visual acuity, grade of nuclear cataract, crystalline lens status [phakic/pseudophakic], spherical equivalent, and ocular health status) was tested using logistic regression. Receiver operation curves were used to test the predictive value of the model. Several variables were found to be related with dress perception. The best model included three variables—Age: adjusted odds ratio (OR) = 1.02 (1.01–1.03), p = 0.08; ocular refraction: adjusted OR = 1.07 (1.02–1.12), p = 0.009; and nuclear cataract grade: adjusted OR = 1.45 (1.05–1.99), p = 0.026. The predictive value of the model was low (area under the curve = 0.62). Older age, nuclear cataract grade, and hyperopia were associated with black&blue perception. The predictive capacity of the developed model was poor. Only a small proportion of the variability in the #thedress perception can be explained by ocular examination.
At the end of February 2015, a viral picture challenged our understanding of how colors are processed by the human visual system. Around the world, people disagreed about the colors of a night dress: some people said it was blue and black (B&B), while others insisted it was white and gold (W&G; Brainard & Hurlbert, 2015; Figure 1). Although a change in the perception of the dress can be induced by priming, one of the most striking features of this perception is its stability (Drissi Daoudi et al., 2017; Lafer-Sousa & Conway, 2017; Witzel et al., 2017); as Lafer-Sosa reported for the first time in 2015 (Lafer-Sousa et al., 2015), few people were able to shift from one perception to the other.
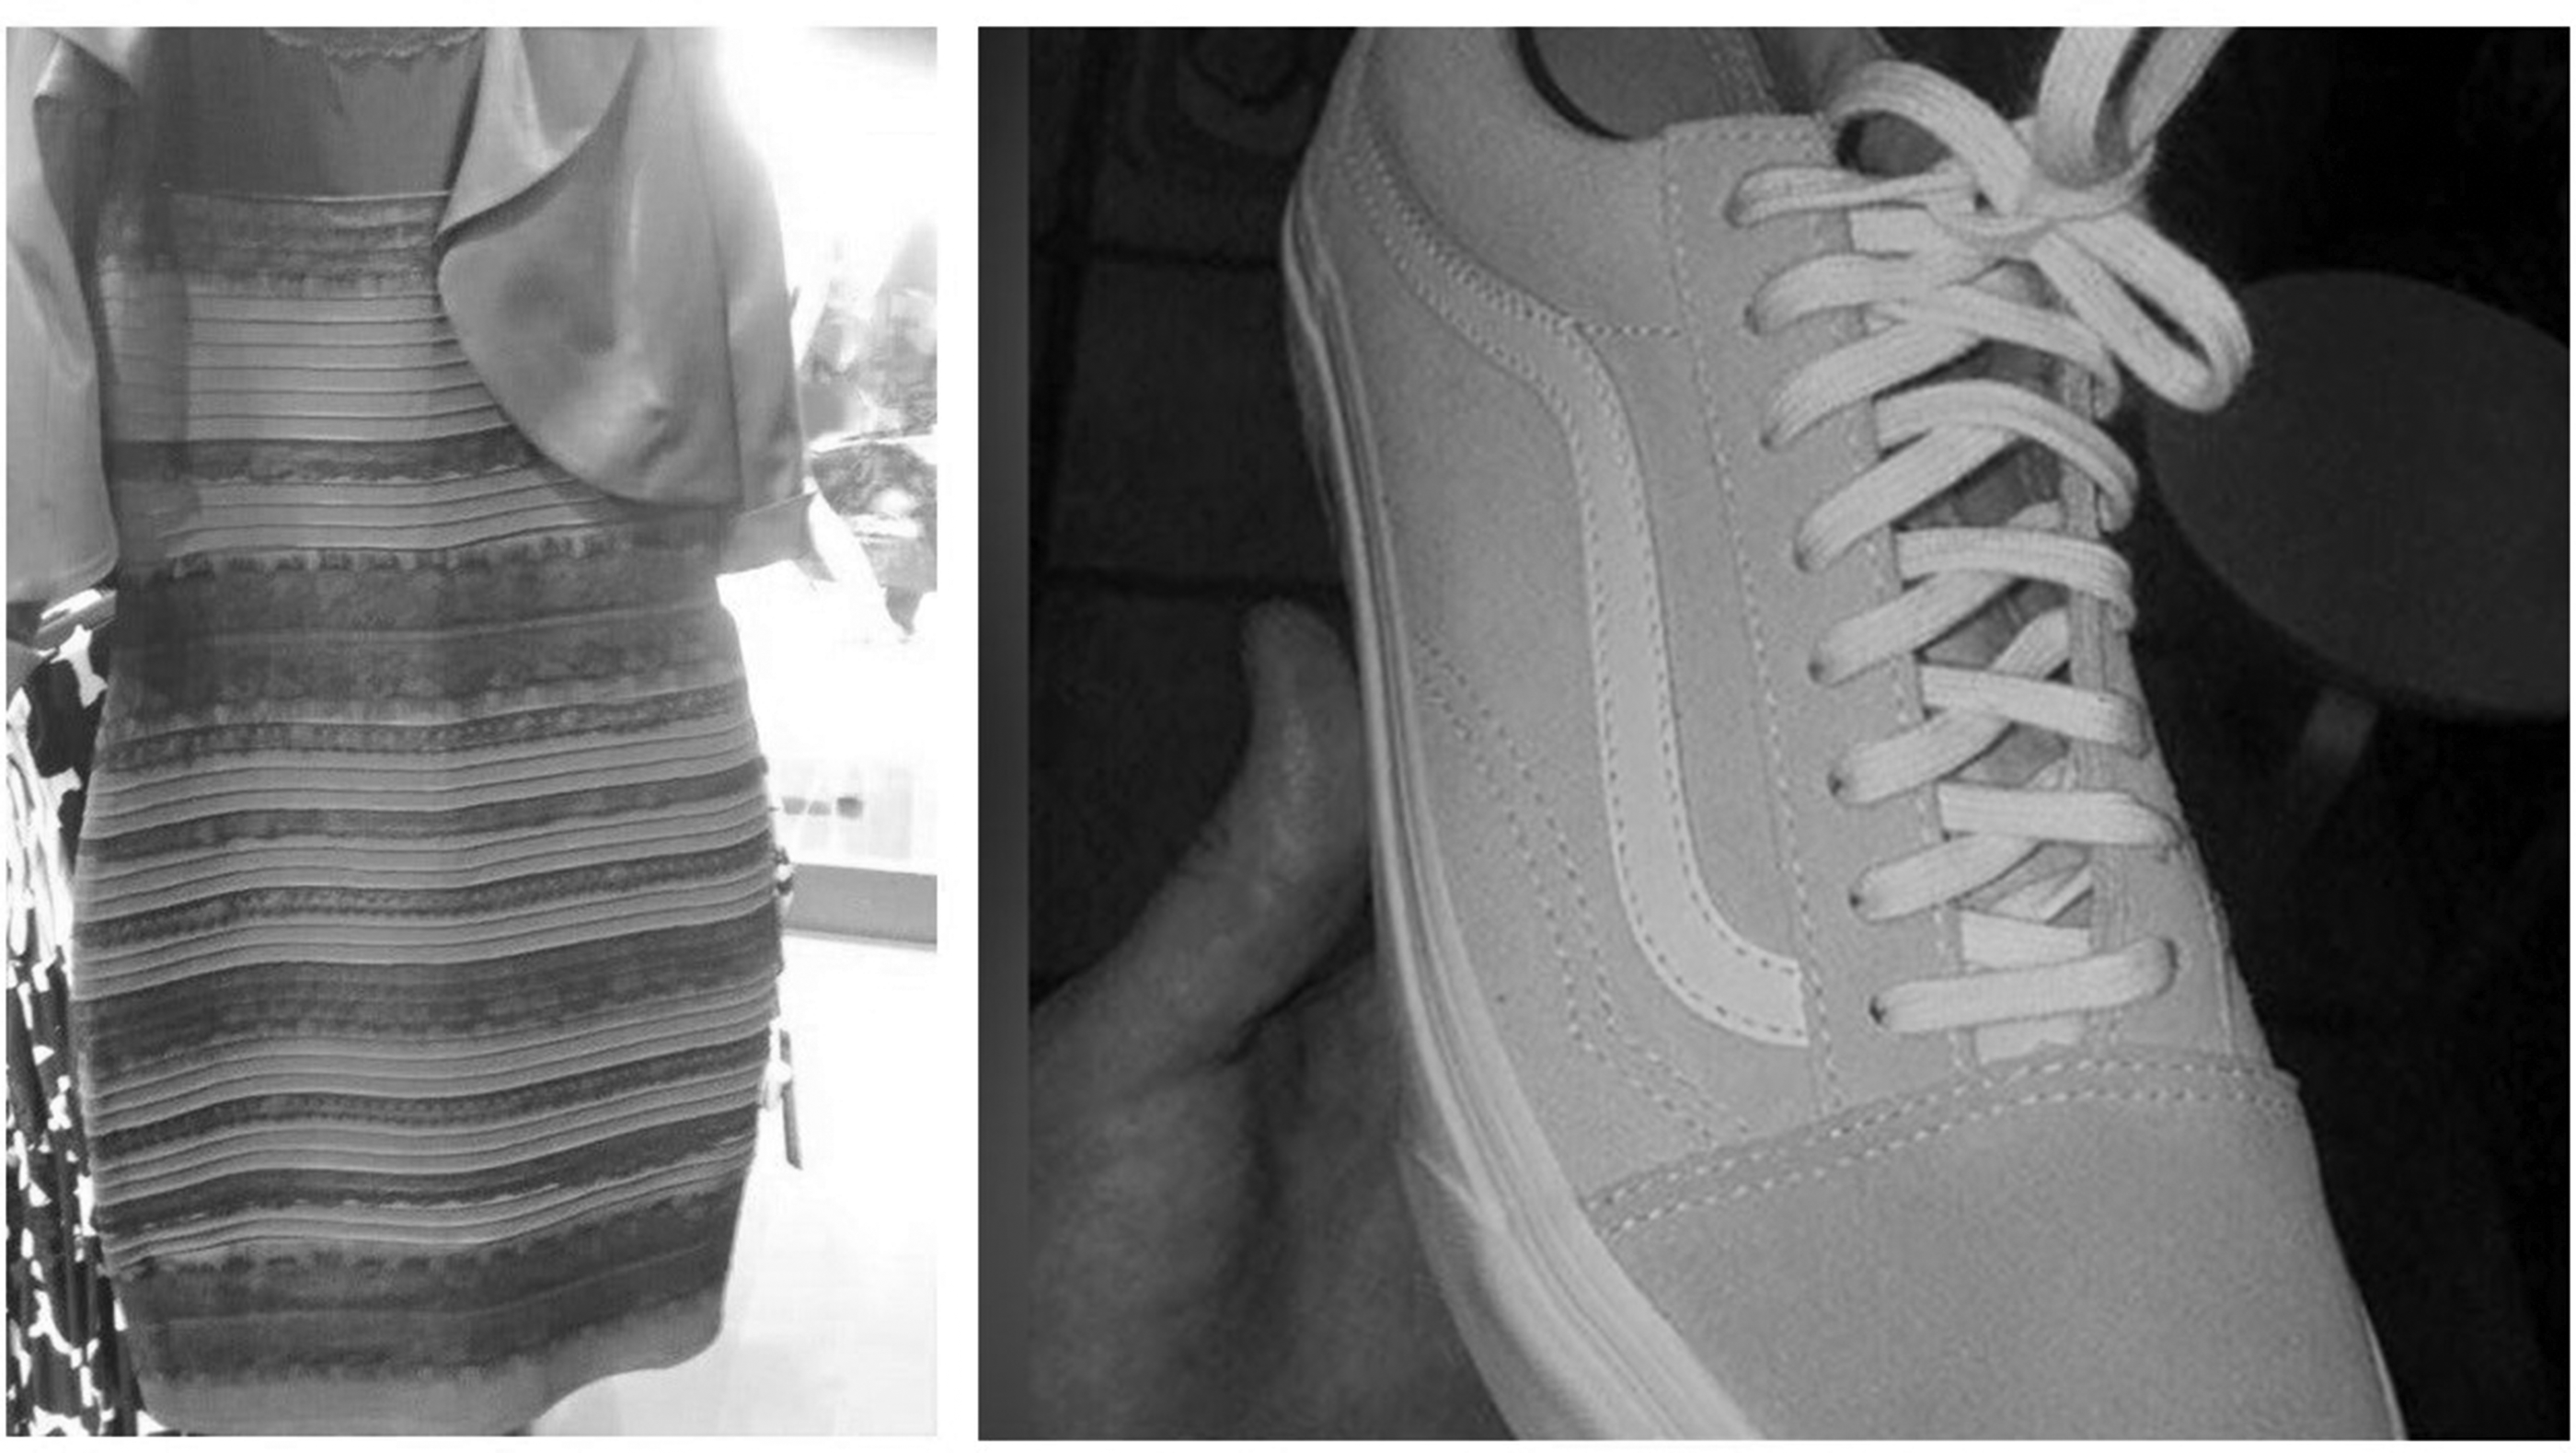
Image of the dress and the tennis shoe.
In the past 5 years, several controversial pictures have appeared in the media. One of the images that reached higher impact on social media is the #thetennisshoe. The perception in this case also has a bimodal distribution, with turquoise laces and sole and gray leather (T&G) being reported as the most common combination, the other being pink leather and white laces and sole (P&W; Werner et al., 2018).
Most papers try to explain this phenomenon in the light of color constancy. Several papers have suggested that this phenomenon is due to a failure in those mechanisms (Brainard & Hurlbert, 2015; Chetverikov & Ivanchei, 2016; Hesslinger & Carbon, 2016; Toscani et al., 2017; Uchikawa et al., 2017; Wallisch, 2017; Winkler et al., 2015; Witzel & Toscani, 2020). These mechanisms keep the mental representation of object color stable, despite changes in the retinal image due to changes in the light reflected from objects (Hurlbert, 2019).
Color constancy has evolved over millions of years and thereby can be particularly challenged by artificial lights, which have been developed recently (Foster, 2011; Hurlbert, 2019). Several independent studies have confirmed that both pictures contain some ambiguous clues about ambient lighting and that these striking differences in the perception of color arise from different interpretations of this ambient lighting (Brainard & Hurlbert, 2015; Chetverikov & Ivanchei, 2016; Hesslinger & Carbon, 2016; Toscani et al., 2017; Uchikawa et al., 2017; Wallisch, 2017; Winkler et al., 2015; Witzel & Toscani, 2020). However, being rigorous, we should admit that this theory does not answer the question, it only transforms one question into another, since no one has been able to explain why different subjects make different lighting assumptions looking at the same scene under the same lighting conditions. In summary, the mystery remains unsolved because, although some studies have proven that in an individual a change on illumination can change the perception of the image, nobody can explain the bimodal character of this optical illusion or why different individuals under the same illumination have different perceptions (Gonzalez Martin-Moro et al., 2018).
As far as we know, pupil size and macular pigment optical density have been the only ocular parameters whose influence on dress perception have been studied (Rabin et al., 2016; Vemuri et al., 2016, 2018). To the best of our knowledge, none of the published papers has studied the impact of routine ocular examination on the perception of these images. The main purpose of this study was to determine the influence of several ocular variables on the dress perception. Contrary to other surveys, for the first time a high number of subjects who suffer from different common ocular conditions were included. A secondary aim of this study was to test if suffering these conditions influences the way the dress is perceived. The response to another ambiguous photo was also tested. Thereby, a tertiary aim was to determine if the subjects who perceive one version of the dress are more prone to perceive one version of the shoe.
Material and Methods
An ophthalmic survey was conducted among subjects who asked for general consultation or who were followed in the retina, glaucoma, or neuro-ophthalmology unit at the Hospital Universitario del Henares. This is a public hospital located to the Northeast of Madrid (Spain), which assists a population of 175,000. The study was performed between September 2017 and September 2019.
Previous literature suggested that age could be a significant variable in the perception of #thedress (Lafer-Sousa et al., 2015; Wallisch, 2017). Thereby, the study was designed to include at least 100 people for each decade.
Group A (healthy ocular status) included subjects who came to our hospital for ocular check-ups and did not have any ocular condition (except refractive error or cataracts), and workers of the hospital, healthy family members, and friends of the authors.
Group B (unhealthy ocular status) included subjects who suffered from several ophthalmic conditions. These conditions were grouped into seven different diagnostic clusters. Subjects with more than one clinical condition were excluded from the sample. The diagnostic clusters were as follows: (a) ocular hypertension or glaucoma, (b) age-related macular degeneration, (c) other forms of retinopathy (different from age-related macular degeneration), (d) strabismus or amblyopia, (e) multiple sclerosis or demyelinating neuropathy, (f) other optic neuropathies, and (g) chiasmatic or retrochiasmatic lesions of the visual pathway.
The main dependent variable was the way the subject named the colors of #thedress. Verbal consent was obtained from the subject after a brief explanation about the aim of this work and then the subjects were asked to look at the photo in a smartphone (Motorola Moto G 5") with their near correction. The illumination presets of the phone were not modified. The subject was asked to choose between W&G and B&B (blanco y dorado or azul y negro in the original language). If after two attempts another combination of colors was given, their response was codified as other. Then, the same procedure was followed to test the perception of the tennis shoe. In this case, the subject had to choose between T&G or P&W (gris y verde or rosa y blanco).
The independent collected variables were age, gender, diagnostic cluster, visual acuity (VA) (decimal), ocular refraction (spherical equivalent), phakic status (phakic or pseudophakic), and grade of cataract. To standardize the statistical analysis, VA was transformed into logarithm of the minimum angle of resolution visual acuity.
Ocular refraction was obtained using an auto-refractometer (Kowa, Kw-2000; Kowa American Corporation, Torrance, CA). The ocular refraction of the subject was codified into three different variables: spherical power, cylinder power, and cylinder axis. The spherical and the cylinder power were used to calculate the spherical equivalent. This parameter summarizes how myopic or hyperopic the eye is and is calculated by adding to the spherical power a half of the astigmatism power.
The aged crystalline lens acts as a yellow filter and may have some influence in color perception. Thereby, the phakic (no previous cataract surgery) or pseudophakic (previous cataract surgery) status of the subject was also registered. Only subjects who were phakic or pseudophakic in both eyes were included. Aphakia (previous cataract surgery without intraocular lens [IOL] implantation) is very uncommon nowadays and was considered an exclusion criterion.
In phakic subjects, the grade of cataract was registered using the Lens Opacities Classification System III classification. This classification grades three different components of the crystalline lens (nuclear, cortical, and subcapsular) in an ordinal scale that goes from 1 (absence of opacity) to 6 (very advanced opacity).
VA was measured using decimal charts. When subjects were not able to see the letters of the 0.1 line, their ability to count fingers or to detect hand movement was tested. Finger counting was translated into 0.05 and hand movement into 0.025. As subjects were asked to look at the pictures with both eyes, VA of the best eye was used as an estimation of binocular VA.
The information was stored in an Excel database and afterward it was transferred to SPSS 15.0 for Windows (SPSS Inc., Chicago, IL, USA) for statistical analysis. A p value of less than 5% (p < .05) was considered statistically significant.
Logistic regression was used to quantify the weight of the selected variables. To use logistic regression, the perception of the dress was transformed into a binomial variable. Only subjects who perceived the dress as W&G or B&B were included. For the same reason, subjects whose answer to the tennis shoe was different from T&G or W&P were also excluded. A univariate logistic model was developed to study the correlation between the perception of the dress and the perception of the tennis shoe. A multivariate logistic model was developed to study the influence of the seven selected clinical and demographic variables (age, gender, binocular VA, grade of nuclear cataract, crystalline lens status [phakic/pseudophakic], spherical equivalent, and ocular health status). The logistic regression was performed choosing the backward method, considering the likelihood ratio and probabilities for exclusion 0.05. The value predicted by the equation for each subject was used to obtain receiver operating characteristic curves (ROC curves), and the area under the curve (AUC) was used to measure the discriminative capacity of the model. The final logistic regression model obtained before was also fitted under a Bayesian framework to estimate the probability of the null hypothesis of no association conditional to the data observed. We reported odds ratio (OR) along with 95% credible intervals. The analysis was done using flat priors for all parameters. A total number of 100,000 Markov chain Monte Carlo simulations in five chains were performed. Model convergence was checked using Gelman-Rubin diagnostics. Stata (version 16) was used to conduct this analysis.
Results
Subjects who did not choose one of the main perceptions of the dress and the shoe were eliminated from the study (Figure 2). After removing those subjects, 1,025 subjects remained in the sample. The demographic characteristics of these subjects are summarized in Table 1. Less than half of the subjects (44%) had an ocular condition (unhealthy subjects), while the remaining 56% were considered healthy from an ophthalmic point of view. Mean age was 46.7 years old. A detailed age distribution of the sample is presented in Figure 3. A higher number of female subjects (59%) were included. Most subjects had not been submitted to cataract surgery (82%).
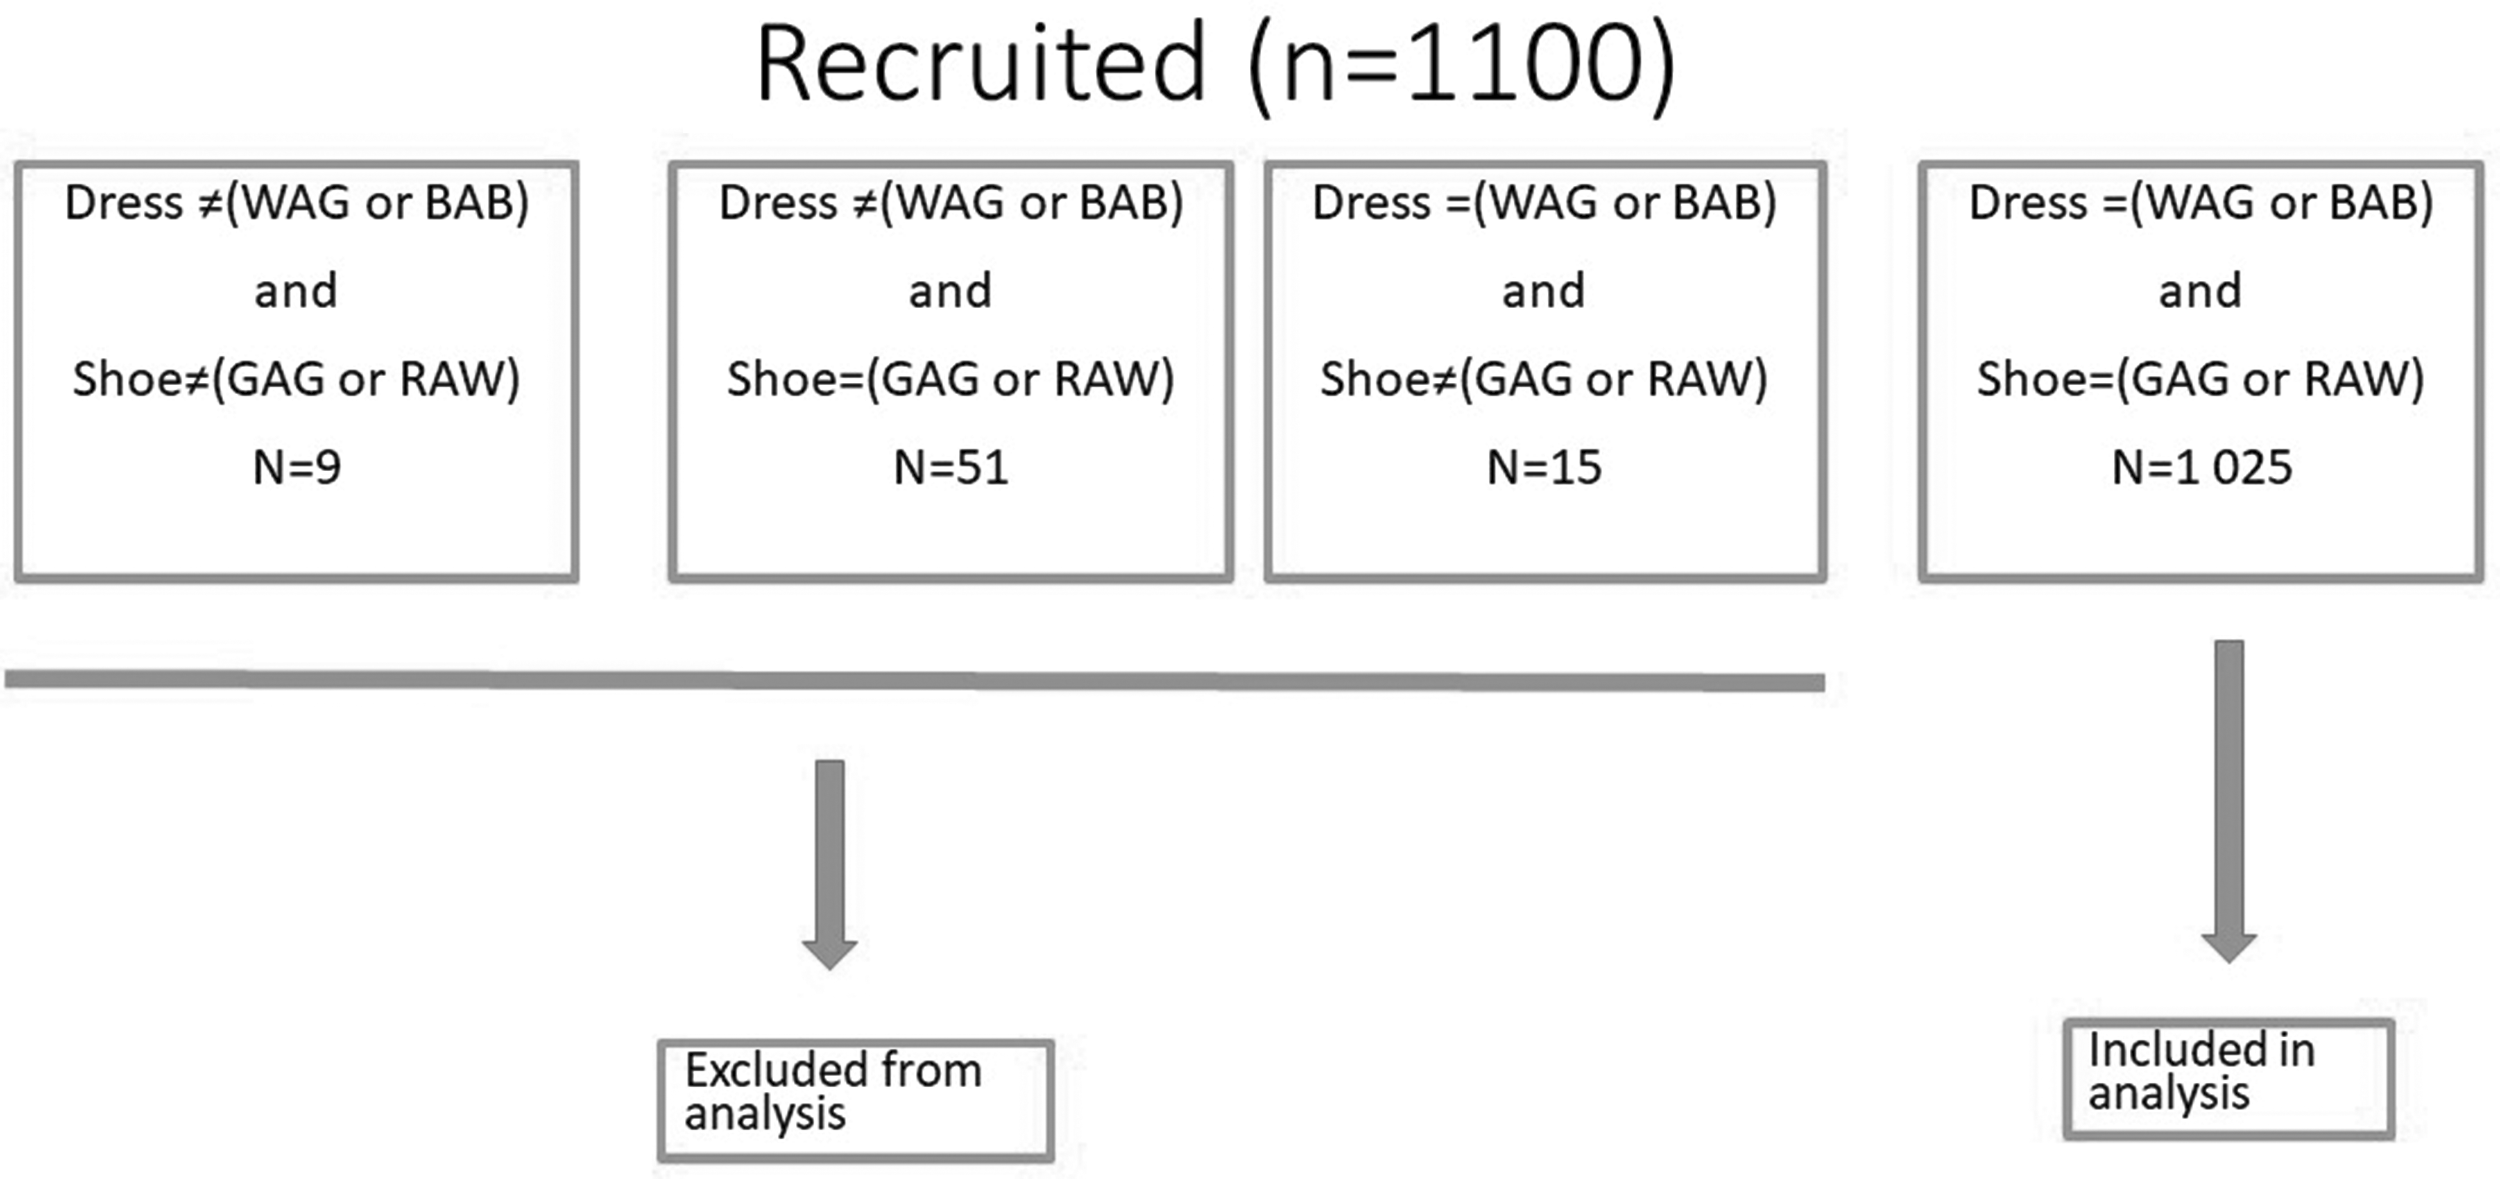
Flow diagram of the studied sample.
Demographic Characteristics of the Studied Sample.
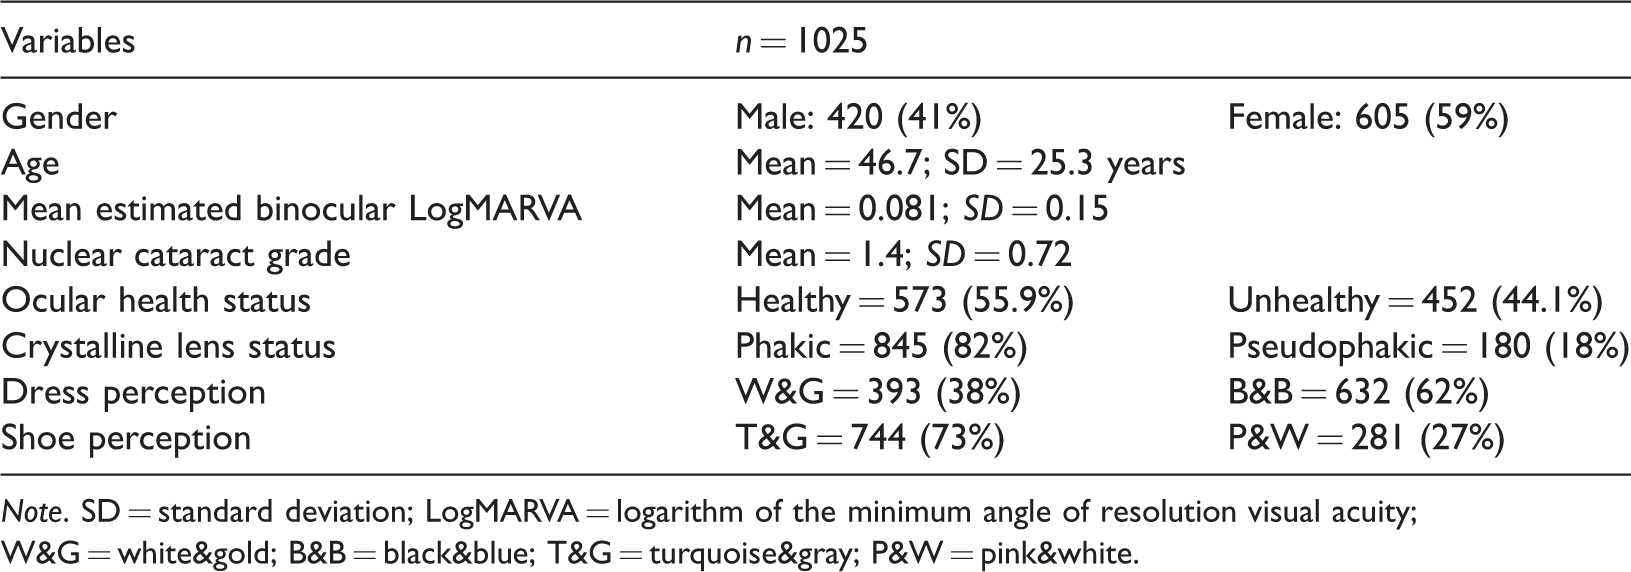
Note. SD = standard deviation; LogMARVA = logarithm of the minimum angle of resolution visual acuity; W&G = white&gold; B&B = black&blue; T&G = turquoise&gray; P&W = pink&white.
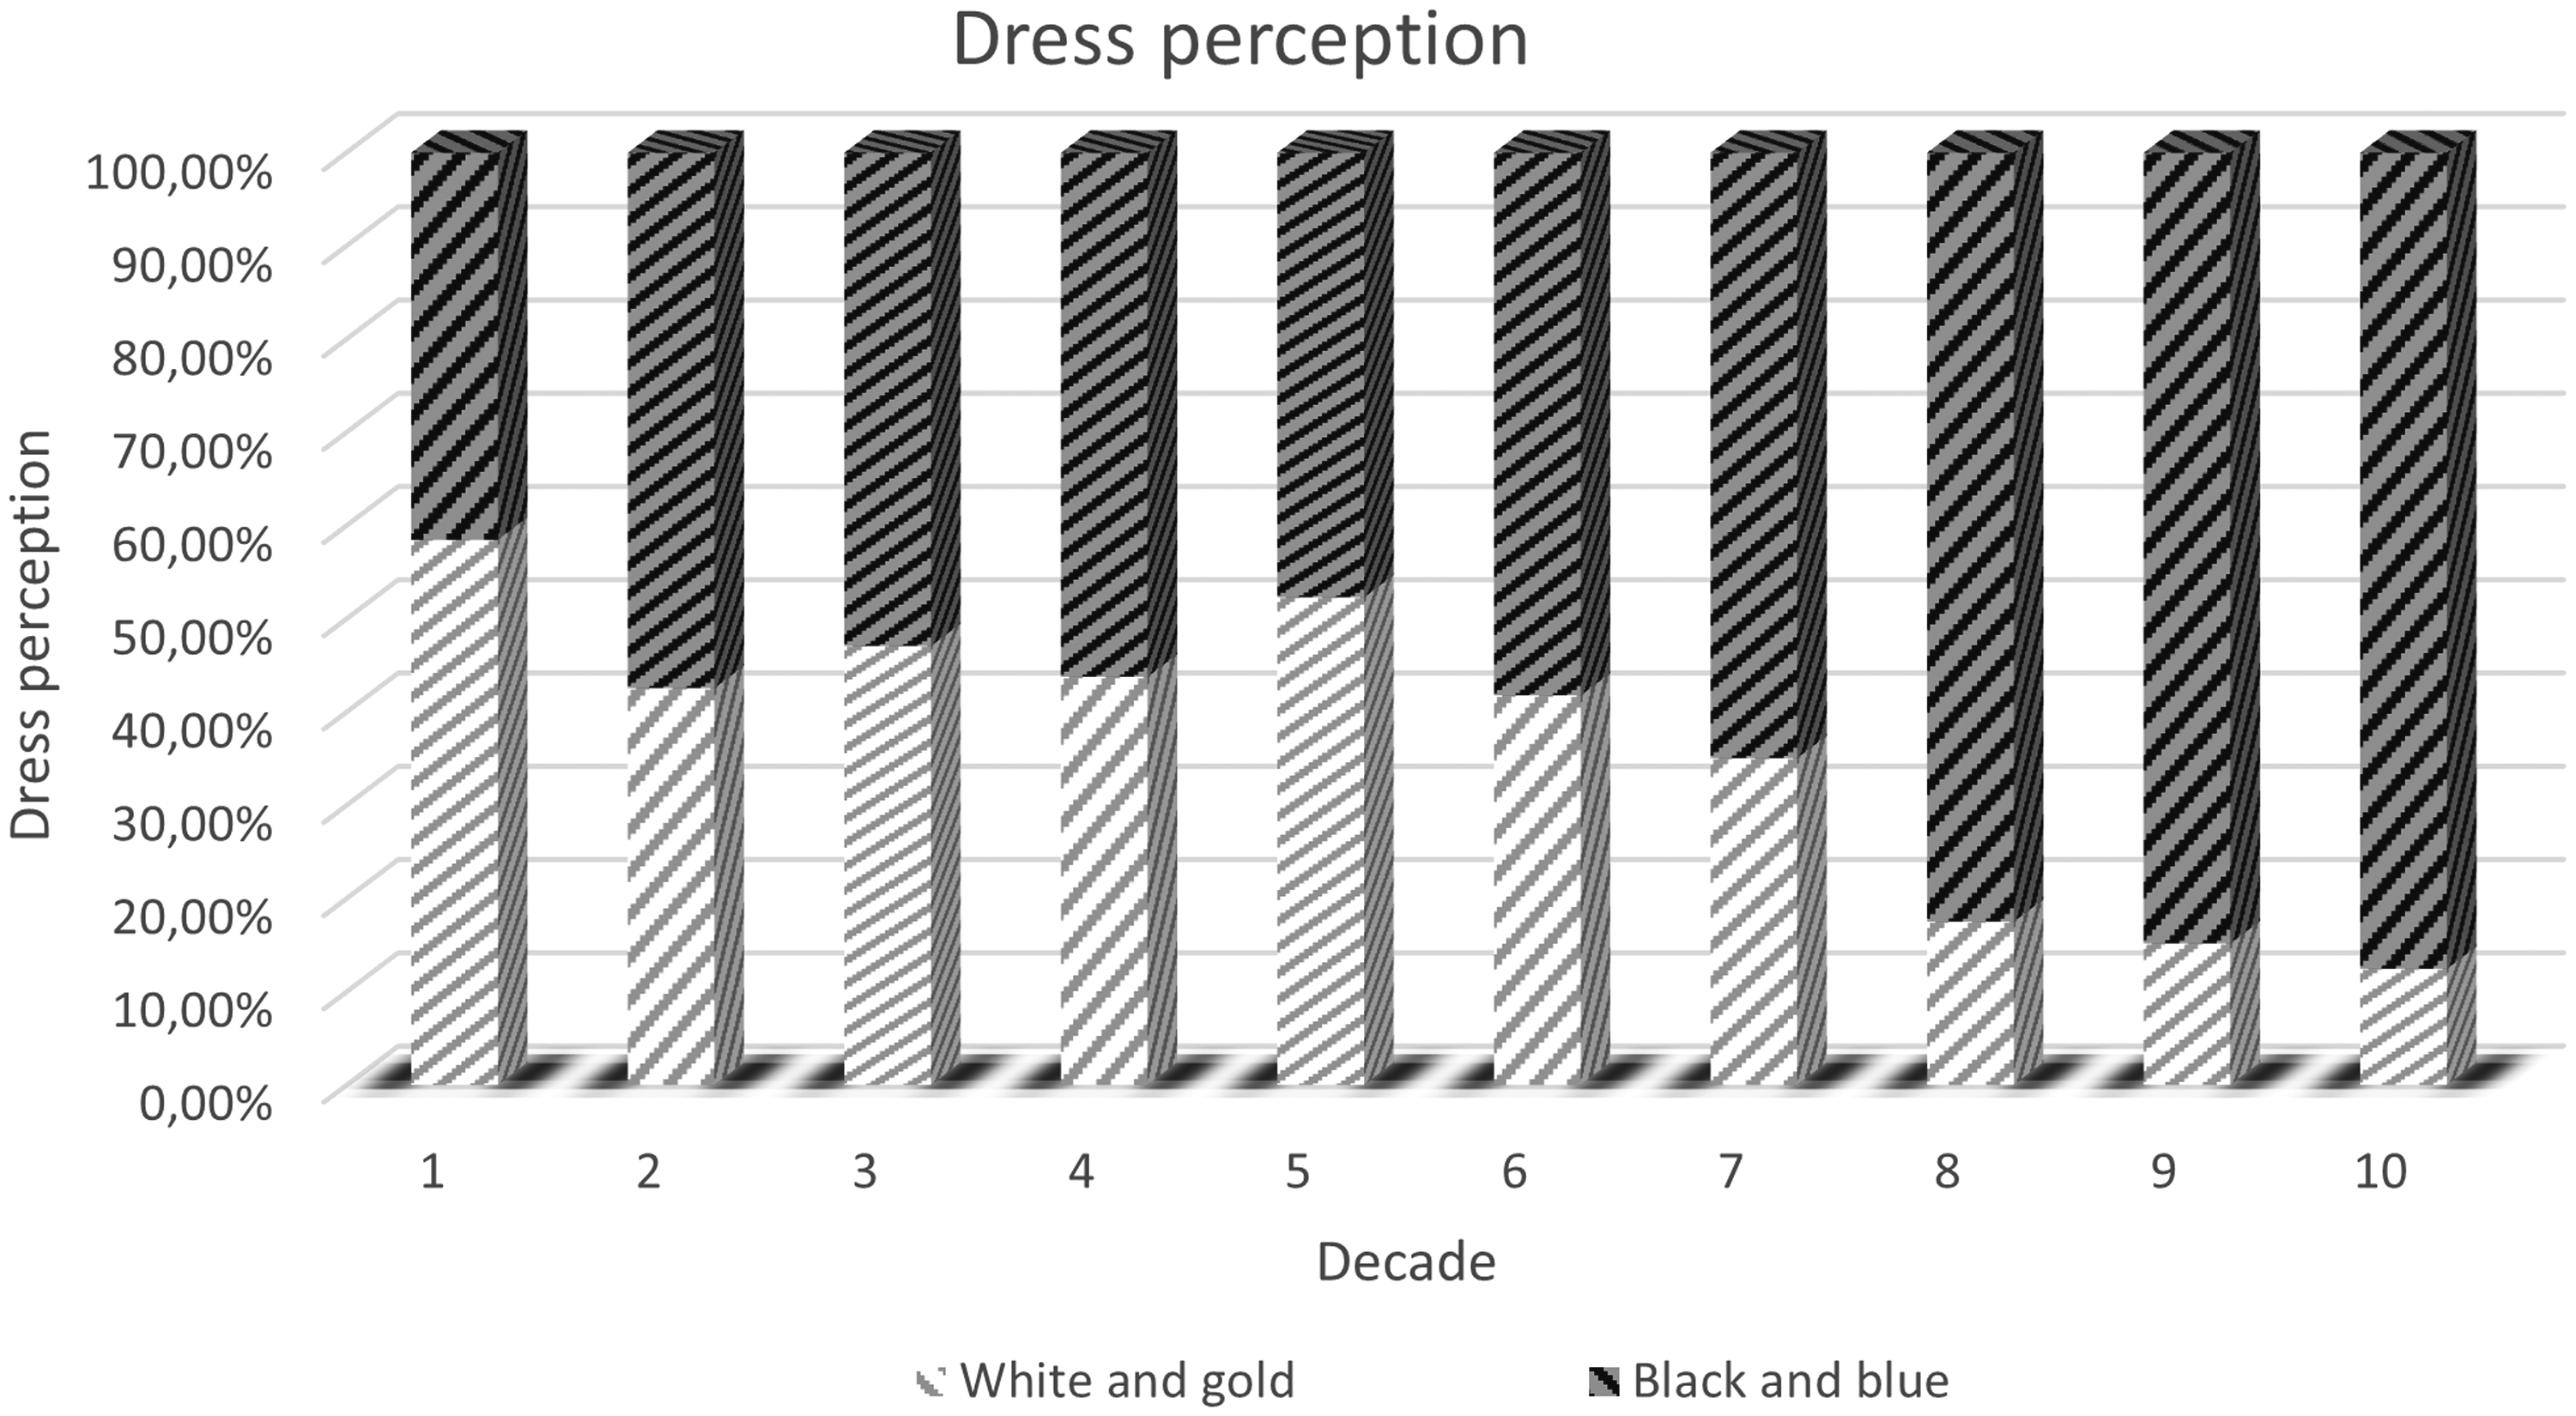
Influence of age on #thedress perception. Patients older than 70 years old are more prone to see the dress as blue and black.
Univariate logistic regression showed that dress and shoe perception were correlated. Subjects who referred the dress as W&G were more prone to describe the shoe as P&W (OR = 0.55 (0.42–0.73))
After performing logistic regression, three variables remained statistically significant in the model: age, grade of nuclear cataract, and spherical equivalent (Table 2). Nevertheless, the predictive capacity value of the model, tested using ROC curves, was low (AUC = 0.62, Figure 4).
Summary of the Multivariate Model.
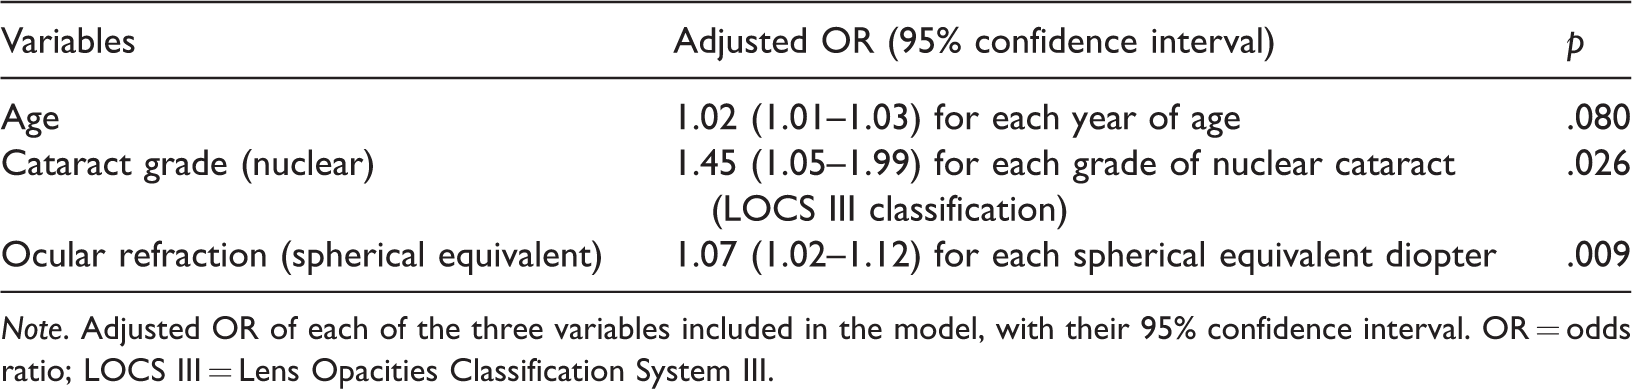
Note. Adjusted OR of each of the three variables included in the model, with their 95% confidence interval. OR = odds ratio; LOCS III = Lens Opacities Classification System III.
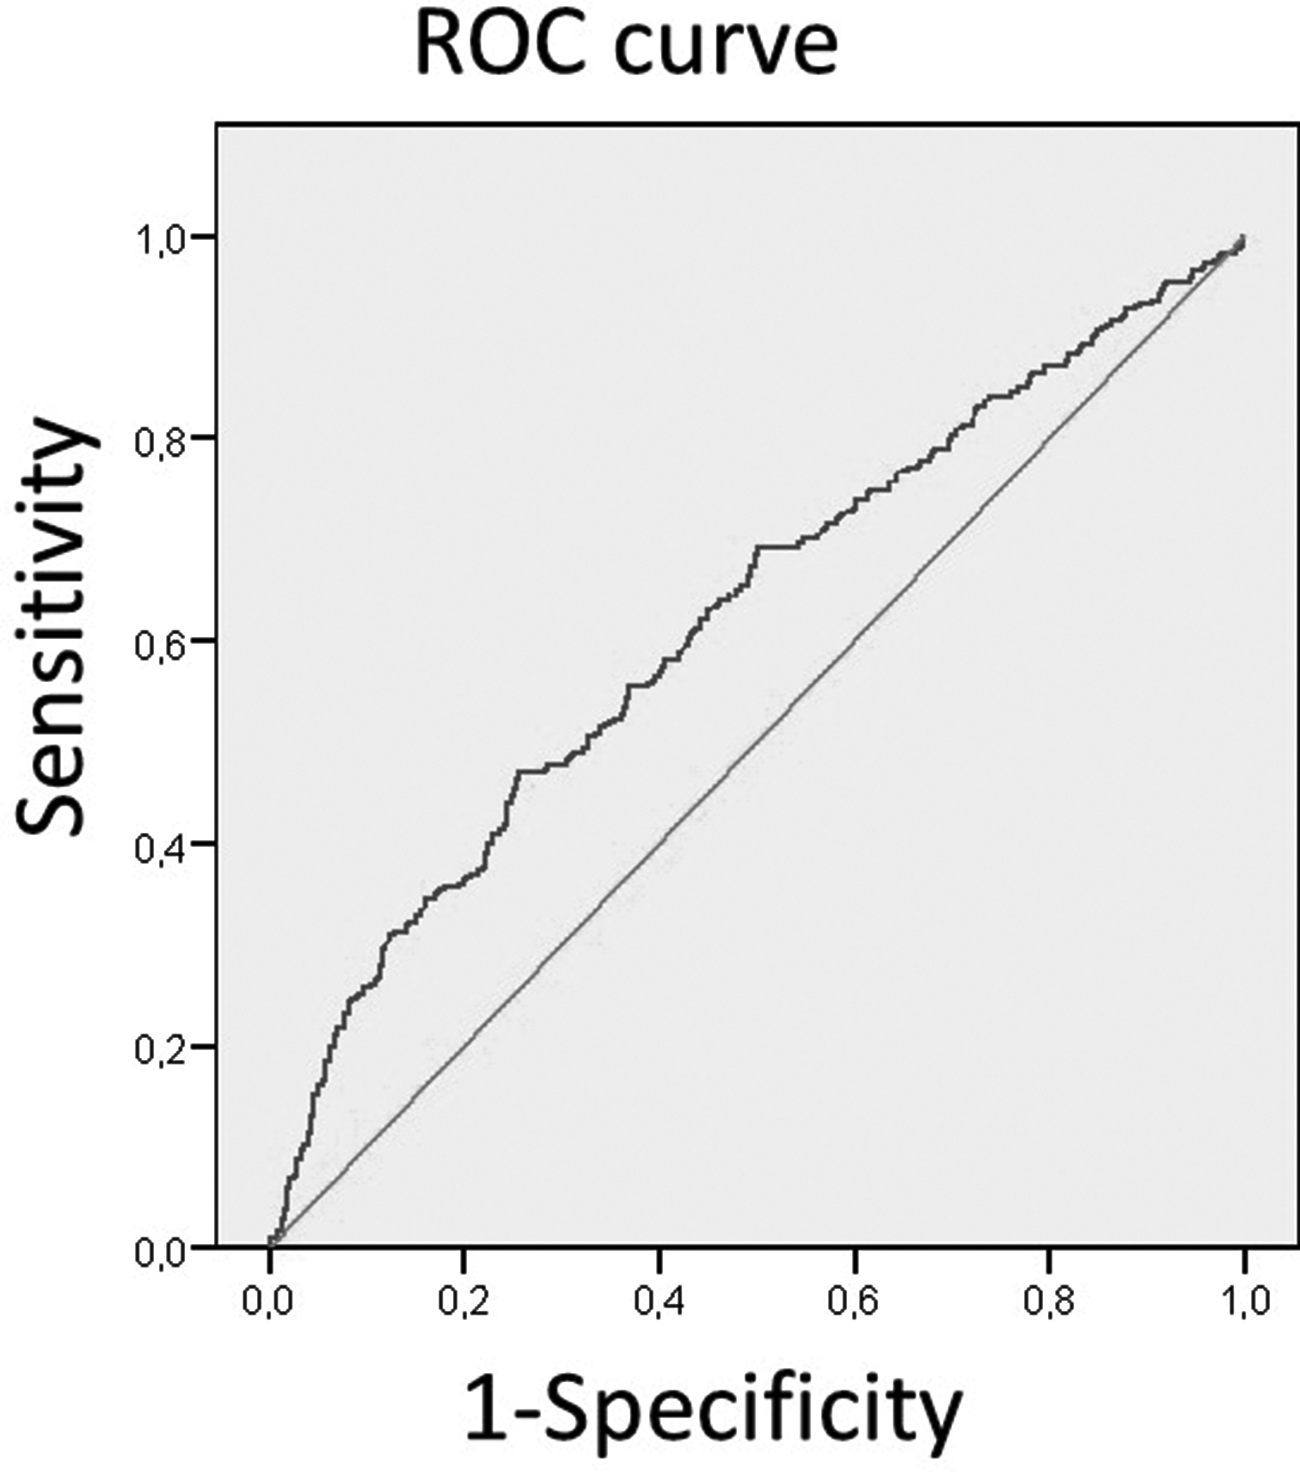
ROC curve summarizing the performance of the developed model. AUC = 0.62 (0.58–0.66).
The observed associations were small. To discard the null hypothesis, the model was tested under Bayesian framework. The probability of null hypothesis for each variable under this Bayesian scenario was 0.038 for age, 0.004 for spherical equivalent, and 0.015 for grade of nuclear cataract.
A subgroup analysis was performed in the different diagnostic clusters of pathologies (Figure 5). B&B perception was more prevalent among subjects with an ocular diagnosis (unhealthy) than among healthy subjects. In this subgroup analysis, age-related macular degeneration (ARMD) was identified as the most associated cluster. Thereby, a second logistic regression was performed including ARMD as an independent dichotomic variable (ARMD vs. no ARMD). This information regarding ocular diagnosis did not modify the model.
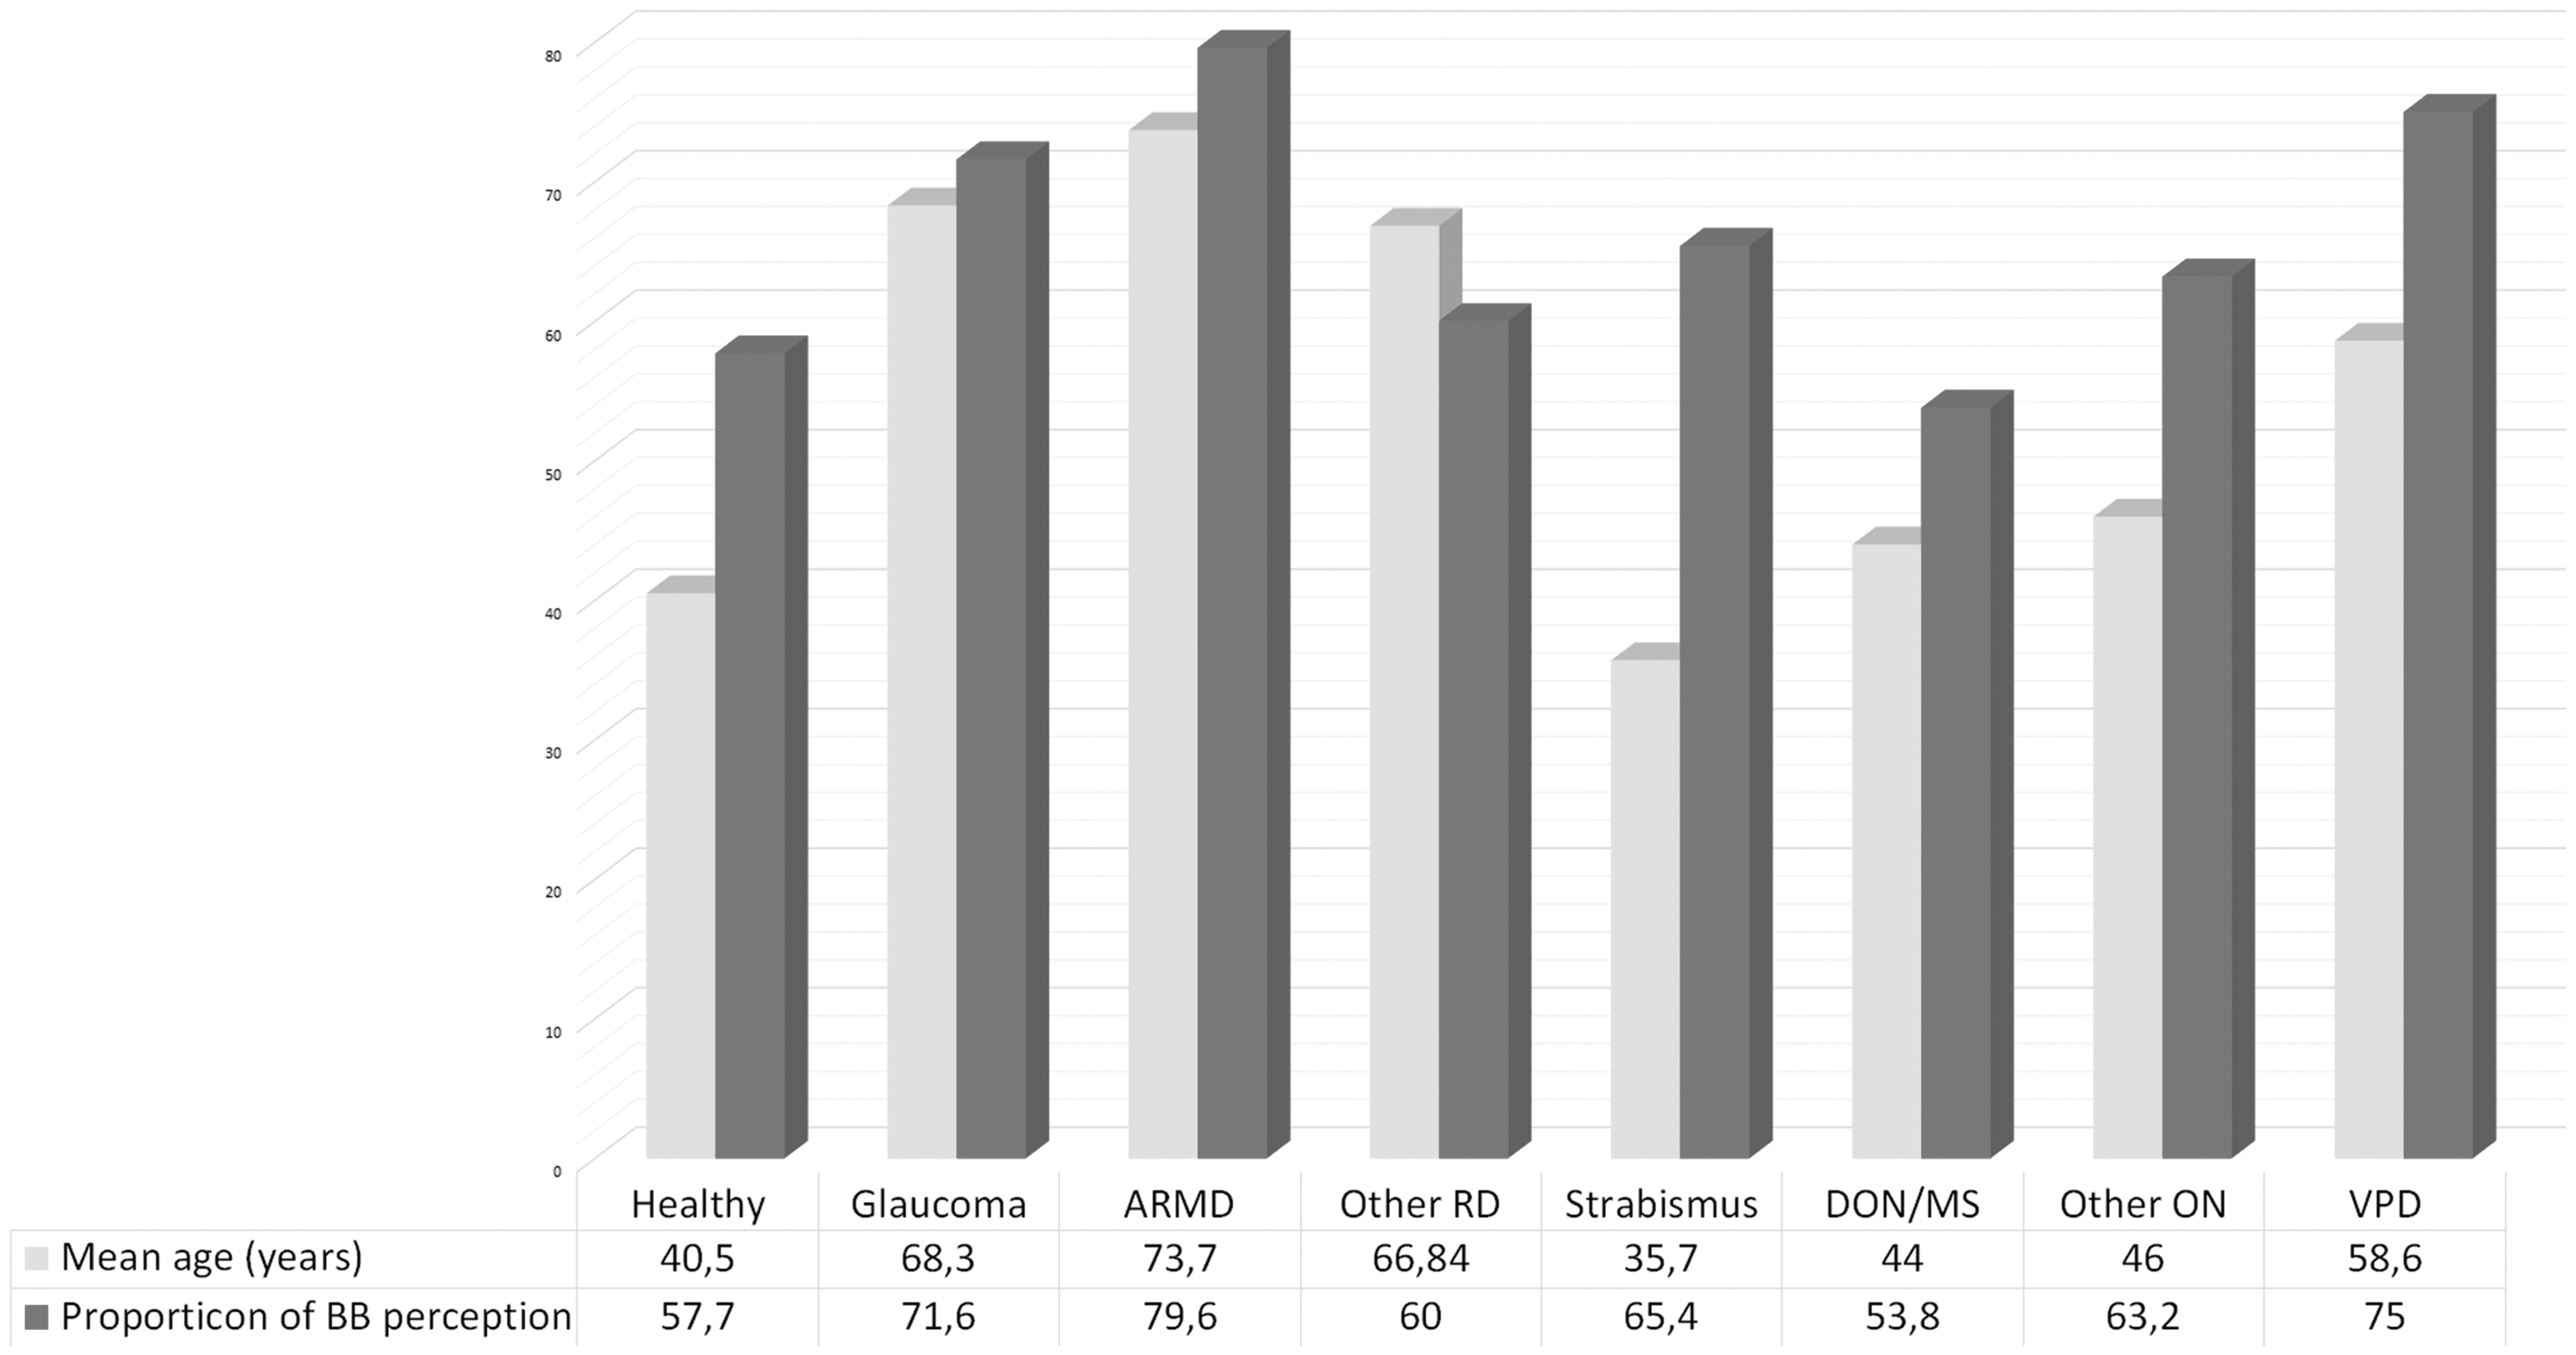
Influence of diagnostic clusters on #thedress perception. A significant correlation was found between age and the mean age of each group (Person’s correlation coefficient = 0.64).
Discussion
In 2015, when the photo appeared in the social media, there were more than four billion cellular phone users. In 2019, the figure was close to five billion (“https://www.statista.com/statistics/274774/forecast-of-mobile-phone-users-worldwide/#:∼:text=The%20statistic%20shows%20the%20total,forecast%20to%20reach%204.68%20billion.&text=The%20number%20of%20mobile%20phone%20users%20in%20the%20world%20is,five%20billion%20mark%20by%202019”). From these figures, we can infer that most subjects around the world have experienced this perception looking at a cellular phone. Therefore, a medium-sized cellular phone was chosen to make the visual experience closer to real life. Nevertheless, Rabin et al. (2016) had reported, using three different screens, that this phenomenon is not dependent on the chosen device. To the best of our knowledge, this is the first paper that has studied the influence of ocular status on the perception of the dress in a wide and varied sample of subjects. Our sample included subjects between 2 and 99 years old. We believe this makes it the sample with the widest age range in which this perceptive phenomenon has been studied. Contrary to most previous studies, the sample included subjects with several ocular conditions.
A bimodal response to dress perception was the main outcome in our series as it was in all the other published series. Only a small number of subjects (around 5%) did not perceive one of the two main perceptions. B&B perception (58.6%) was more prevalent than W&G (36.2%). These figures are similar to those reported by Lafer-Sousa et al. in 2015 (B&B 58% and W&G 30%; Lafer-Sousa et al., 2015). However, in Vemuri et al.’s series, the prevalence of both perceptions was very similar, and Mahroo found a higher prevalence of W&G perception (B&B 27% and W&G 64%; Mahroo et al., 2017; Vemuri et al., 2016). Currently, there is no explanation to these differences among different populations.
In our sample, some variables were found to have a statistical association with the perception of the dress. This association is expressed as adjusted OR in the logistic regression study (Table 2); however, the AUC of the studied model was small, suggesting that this model has a low predictive capacity. Due to the small magnitude of the demonstrated associations, the model was tested on a Bayesian framework. Nevertheless, this analysis did not change our results as the likelihood of the null hypothesis being true in this scenario was small for each of the three significant variables.
Regarding age and gender, our results differ significantly from those reported by other researchers (Lafer-Sousa et al., 2015; Moccia et al., 2016) and replicate those obtained by Wallisch (2017). In our sample, gender was not associated with the perception, but age was, in a complex fashion. As seen in Figure 2, the prevalence of both perceptions was similar among young and middle-aged people, but W&G perception plummeted among sexagenarians and septuagenarians. This behavior resembles that reported by Wallisch in an online survey of 13,000 over 20-year-old subjects. Wallisch suggested that an environmental factor related with the age of retirement could explain this rise in B&B perception.
In our sample, the presence of a higher than expected incidence of B&B perception in teenagers disrupts this trend. A possible explanation for this might be prior knowledge of the true colors of the dress. Teenagers are the age-group most influenced by social media. Therefore, a higher proportion of them may have been nonnaïve to the image, and knowing the real colors of the dress could have influenced their answer. This anomaly could have also arisen from imprecise naming on the group younger than 10 years of age. It is difficult to test both hypothesis since, to the best of our knowledge, ours is the first study that has included a significant number of children and teenagers.
Nevertheless, age seems to have a significant influence in the perception of the dress. If there were a linear behavior, the adjusted OR of having a B&B perception in an 80 year-old subject would be nearly double compared with a 20 year-old subject (OR¼1.016(80–20) = 2.59). It is worth noting that this OR is adjusted by the remaining clinical variables. Like Wallishch, we are not able to explain this association (Wallisch, 2017), but the sensitivity loss of short wave cone pathways that occurs with normal aging might be responsible for this behavior (Haegerstrom-Portnoy & Hewlett, 1989).
Spherical equivalent (an integrated measure of the degree of myopia or hyperopia) was also associated with the perception. Those who had hyperopic spherical equivalent were more prone to see the dress as B&B. The test was performed with the correction that patients wore for near vision. Some patients may have had their hyperopia partially corrected. Chromatic aberration may have played a role in this finding. Since short wavelengths experiment higher refraction, the blue components of the dress may have been more properly focused in undercorrected hyperopic subjects, favoring blue and black perception.
The aged human crystalline lens acquires a yellowish color, and subjects refer significant changes in color perception after cataract surgery (Jordan & Valberg, 1986; Miyata, 2015). After cataract surgery, most subjects refer seeing things bluishly (cataract surgery-induced cyanopsia; Delahunt et al., 2004; Kitakawa et al., 2009; Miyata, 2015). Therefore, we expected to find a significant influence of cataract and cataract surgery on this illusion.
In our sample, the degree of nuclear opacity was associated with B&B perception. Nuclear opacity modifies the color spectrum of the light that reaches the retina, creating a yellow dominant, and thus favoring B&B perception. The reduction in brightness induced by the opacity of the aged lens and the reduction of contrast due to scattering could have also favored this perception.
However, this theory remains speculative as previous cataract surgery (pseudophakia) was not associated with the perception of the dress in our sample. If cataract has such an influence, cataract surgery should have restored W&G perception. We should have observed a significant shift to W&G perception in pseudophakic patients. At this moment, we are unable to explain these admittedly contradictory results.
Taking into account in pseudophakic patients whether the IOL had a blue-blocking filter might have provided a better insight into the influence of cataract and cataract surgery on this phenomenon. Nevertheless, the design of the study did not make it possible. Some of the subjects included had undergone cataract surgery at our hospital, but others had been operated elsewhere, and in many cases, it is not easy to determine the type of IOL on the basis of a biomicroscopic examination. Furthermore, some patients had a blue-blocking implant in one eye and a nonblocking implant in the other, so it was not easy to classify them when studying a binocular phenomenon. Future studies may be designed to include only patients for whom information on the type of IOL they have been implanted is available to study the influence of light-blocking filters.
The influence of the diagnostic clusters on the perception of the images seemed to be more related to the age distribution of the diagnosis, since when each diagnosis was studied as a dichotomic variable it did not seem to influence the distribution of the perception (Figure 4).
Recently, some articles have demonstrated many similarities between the shoe and the dress. In both cases, perception is pretty stable and has a bimodal distribution, and in both cases, one-shot learning is present (Drissi-Daoudi et al., 2020). Thereby, we expected to find high correlation between both perceptions. Nevertheless, although some correlation was present, it was only moderate (OR = 0.55). As Werner et al. (2018) stated, this lack of correlation could be due to a different color distribution in both images.
Another factor that might have influenced the results is the knowledge the subjects may have had at the time of the test about the real colors of both objects. The shoe image was never as popular and well known as the dress. Therefore, many more subjects probably lacked information on the shoe. This might have influenced the correlation between the perception of both images.
Our article has many limitations. First, data collection began 2 years after the photo became mainstream. Thereby, a significant proportion of the participants may have been aware of the real colors of the dress. Second, our study was based on a general ophthalmic examination, and it did not include testing for color vision deficiencies. Third, although the number of pseudophakic subjects that have a blue-blocking implant in our area is low, this information was not available and may have had some influence on the interpretation of the results.
Conclusion
We conclude that there was a statistical association with three ocular variables. Hyperopia could be associated with B&B perception. Cataract density (nuclear grade) was also correlated with B&B perception; however, cataract surgery did not revert this association. Age was strongly associated with B&B perception. This association seems to be independent from cataract density and ocular disease. Future studies may investigate if age influence is mediated by changes in the retinal sensitivity to short wavelengths. However, the logistic regression model that included these variables had low capacity to predict the perception of the dress (AUC = 0.62). Currently, routine ocular examination cannot contribute much to the understanding of this visual phenomenon.
Footnotes
Declaration of Conflicting Interests
The author(s) declared no potential conflicts of interest with respect to the research, authorship, and/or publication of this article.
Funding
The author(s) received no financial support for the research, authorship, and/or publication of this article.