
Abstract
Here, we investigate how body orientation relative to gravity affects the perceived size of visual targets. When in virtual reality, participants judged the size of a visual target projected at simulated distances of between 2 and 10 m and compared it to a physical reference length held in their hands while they were standing or lying prone or supine. Participants needed to make the visual size of the target 5.4% larger when supine and 10.1% larger when prone, compared to when they were in an upright position to perceive that it matched the physical reference length. Needing to make the target larger when lying compared to when standing suggests some not mutually exclusive possibilities. It may be that while tilted participants perceived the targets as smaller than when they were upright. It may be that participants perceived the targets as being closer while tilted compared to when upright. It may also be that participants perceived the physical reference length as longer while tilted. Misperceiving objects as larger and/or closer when lying may provide a survival benefit while in such a vulnerable position.
Introduction
Size perception is a fundamental aspect of spatial perception and is essential for judging distance and thus for daily activities such as reaching for an object or navigation. Despite its importance, people often make errors when determining an object's size which can depend on the size of the observer themselves (Stefanucci & Geuss, 2009), where the object is positioned in the field of view (Bertamini et al., 1998), and the exposure time (Thomas & Cantor, 1976). Misperceived size can result in some undesirable and potentially dangerous errors, for example, when a person needs to quickly evaluate how much to move to avoid an approaching object or to navigate through a narrow doorway (Bourrelly et al., 2014).
When estimating size, people rely on several senses including vision but also, less obviously, the vestibular sense (Ching et al., 1963; Harris & Mander, 2014; Higashiyama & Adachi, 2006; Wood et al., 1968). Perceived body posture (Harris & Mander, 2014), perceived body size (van der Hoort & Ehrsson, 2014), and weightlessness (Clément et al., 2013) all affect the perceived size of objects. Many people work in an environment where they need to be in an unusual body orientation—such as working under a car, underwater, or in space where the vestibular sense is compromised, therefore understanding the effect of body posture on size perception is an important concern.
The mechanism by which the perceived orientation of the body might influence perceived size is unclear. Visual-vestibular interactions can certainly affect how we perceive the world (Barnett-Cowan et al., 2015; Clément et al., 2016; Edwards et al., 2010; Guterman et al., 2012; Harris & Mander, 2014; Jenkin et al., 2004; Kim et al., 2015; Lopez, 2015). One possible way that posture might affect perceived size is by misinterpreting the acceleration of gravity when lying down as indicating motion. When supine or prone, gravity acting on the vestibular system’s otolith organs and other graviceptors in the body including the somatosensory system (Alberts et al., 2016; Bronstein, 1999; Jarchow et al., 2003), is equivalent to accelerating self-motion (forwards when supine, backwards when prone) (Einstein, 1908). As humans have evolved to stand and walk on two legs, their perception of the world has become integrated with an upright body posture with the vestibular system registering the constant downwards pull of 1 g. Indeed, Crane (2014) found that tilting the body and asking participants to cancel out forward/backward physical movement revealed a tendency for the tilt to induce a perception of translation. When tilted forward by 10° people perceived a backward translation and when tilted backward, a forward translation. Could such an illusion cause body-posture-related changes in perceived size?
The retinal size of a given object is determined by its physical size and its egocentric distance and changes continuously as a person moves towards to or away from the object. If the stimulation of the otoliths by body-tilt were at least partially treated as indicating illusory self-motion, then a perceived size change may result from a misperceived distance due to misplaced updating in response to the illusory movement. Under this hypothesis we would expect people to perceive objects as smaller due to an underestimation of distance when supine, and larger due to an overestimation of distance when prone as the observer's otoliths would be stimulated in a way compatible with movement towards or away from the target respectively. That is, the change in perceived translation based on body tilt (Crane, 2014) would create changes in the perceived size of an object.
Supporting this hypothesis, the contribution of the vestibular sense to perceived size has been demonstrated by Wood et al. (1968) in their studies of the moon illusion, in which the moon is perceived as larger when it is close to the horizon compared to when it is at the zenith. In Wood et al.'s (1968) study, participants judged a smaller size disc presented in front of them as matching a larger disc positioned above them (by tilting their head and eyes to look upward). This mismatch is compatible with perceiving a disc as smaller when looking up at it (which would therefore need to be made larger to match the size of the disc seen straight ahead). Similarly, Harris and Mander (2014) found that people needed to make a line projected on a wall about 9% longer to match the length of a physical reference rod held in their hands when tilted onto their backs while sitting in a chair compared to when sitting upright, indicating that they perceived the line as shorter while they were supine. The authors interpreted this error as compatible with misperceiving the distance to the wall on which the line was projected. Interestingly, the participants in Harris and Mander’s (2014) study didn’t actually need to be supine to show an underestimation of target length; they simply had to feel they were supine. When doing the same task in a “Tumbling Room,” a furnished room which could be rotated around an upright person to give the illusion of a supine posture, the participants made the projected line 11% longer when only the room was rotated to merely give them the illusion that they were supine (Harris & Mander, 2014). This result makes it unclear whether the perceived size changes were of direct vestibular origin since a perceived supine orientation of the body was sufficient. Ching et al. (1963) found people perceived the size of a balloon as smaller when their body was supine or prone with their head tilted to be upright which also suggests that it may be the feeling of the horizontal body orientation, rather than the vestibular sense, that created the effect. Similarly, when Crane (2014) tilted just the head with the body vertical, he did not evoke a perceived size change. These findings implicate the perceived orientation of the body as being the driving force behind these distortions of perceived size rather than the signal from the vestibular system.
In the present study, we did the opposite. Instead of having our participants upright but feel supine, we had our participants supine (or prone) but feel upright and quantified the effect of changing physical cues to body orientation (with body and head aligned) on the perception of size. Using virtual reality (VR) to provide a convincing three-dimensional visual scene (Wilson & Soranzo, 2015), we presented participants with a visually upright virtual environment which maintained its orientation relative to the viewer with the horizon in line with their line of sight independent of their body orientation (upright, supine, or prone). With the fixed upright visual scene which created a convincing sense that participants were always upright (McManus & Harris, 2021), there should be no difference in perceived size between the body orientations if the differences in perceived size in past studies were due to their perceived body orientation rather than to their physical body tilt. We hypothesized that the perceived size of an object viewed while supine or prone while maintaining the perception of being upright would differ from the object's perceived size when viewed from an actually upright position. Such differences would mean that perceived size could indeed be affected by physical body orientation alone. We further hypothesized that these vestibular-induced errors in perceived size while supine and prone would be in opposite directions, consistent with our participants misperceiving forward tilt as backward translation and backward tilt as forward translation (Crane, 2014).
Methods
Participants
Twenty-four participants (12 females, aged 17–54 years, mean = 26.2, SD = 8.73) took part in the study. They were either students or faculty at York University, people recruited via personal invitation, or people recruited from the York University Research Participation Pool (URPP). The URPP participants received course credit for taking part in the experiment. All participants gave informed consent. The experiment was approved by the York University's Ethics Review Board and was carried out using the principles of the Declaration of Helsinki.
Apparatus
The experiment was run in VR using an Oculus Rift Developmental Kit 2 Head Mounted Display (HMD) which provides a resolution of 960 × 1080 pixels per eye, maximum 75 Hz refresh rate, ∼95° (horizontally) × 106° (vertically) field of view and weighs 440 g. The display was powered from a Windows 10 Alienware Area-51 R2 with Intel® Core™ i7-5820K Processor, 16.0 GB RAM, and NVIDIA GeForce GTX 980 graphics card. The VR environment was built in Unity (Version 5.8.3) game engine with scripts programmed in C#.
To measure perceived size, the length of a virtual vertical target rod presented in virtual reality was compared to the length of a physical reference rod held in the participants’ hands. The reference rod (see Figure 1) was a rectangular aluminum rod of 0.454 m length, 0.025 m width, and 0.006 m thickness.
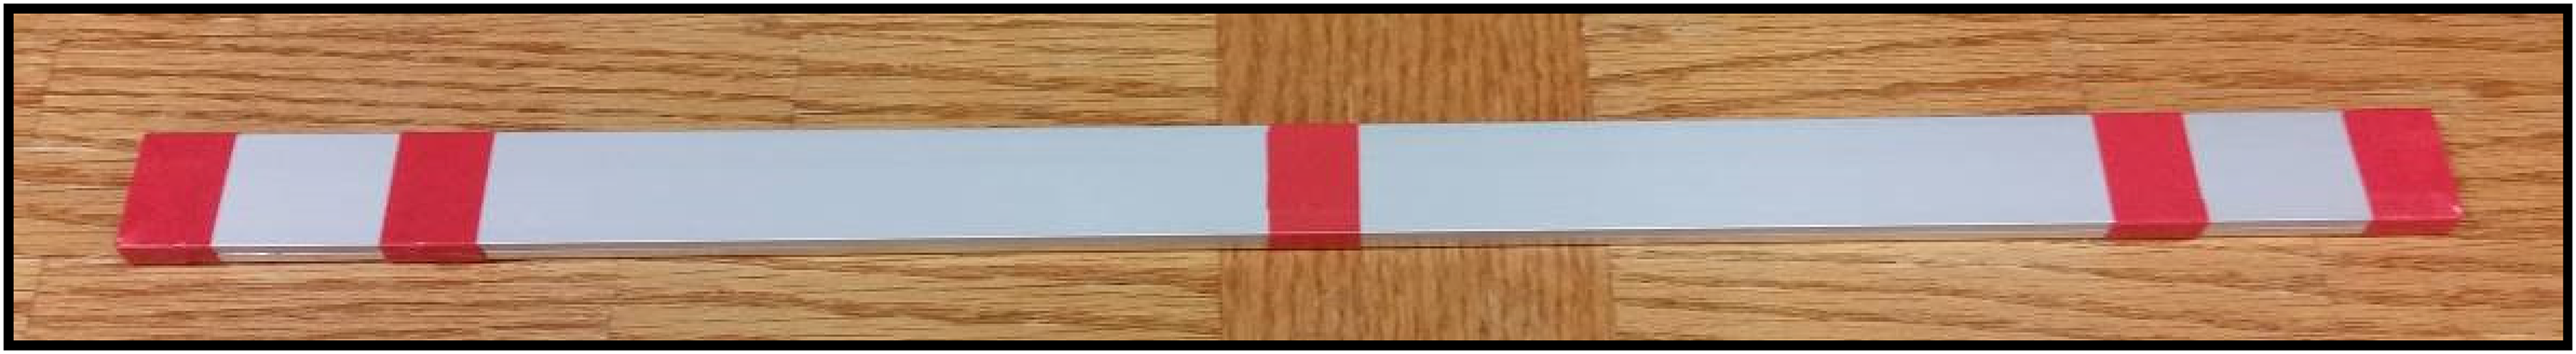
Reference rod.
Visual Stimuli
The virtual target (see Figure 2) was a vertical, dark blue, rectangular rod presented at one of four simulated distances (2, 5, 7, and 10 m) in a VR environment. The VR environment had a grass-textured floor and stone walls to provide a texture gradient that gave a convincing impression of depth. The environment also had a sky-like ceiling with a light source illuminating from above to enhance the sense of environmental orientation. The display was in stereo and dynamically updated with participants’ head movement. The view in the simulation was placed at 1.70 m above the floor to simulate average eye level and presented the environment in the same orientation (upright with the grass surface beneath the participant's feet and the sky above the head) regardless of the participant's physical body orientation.
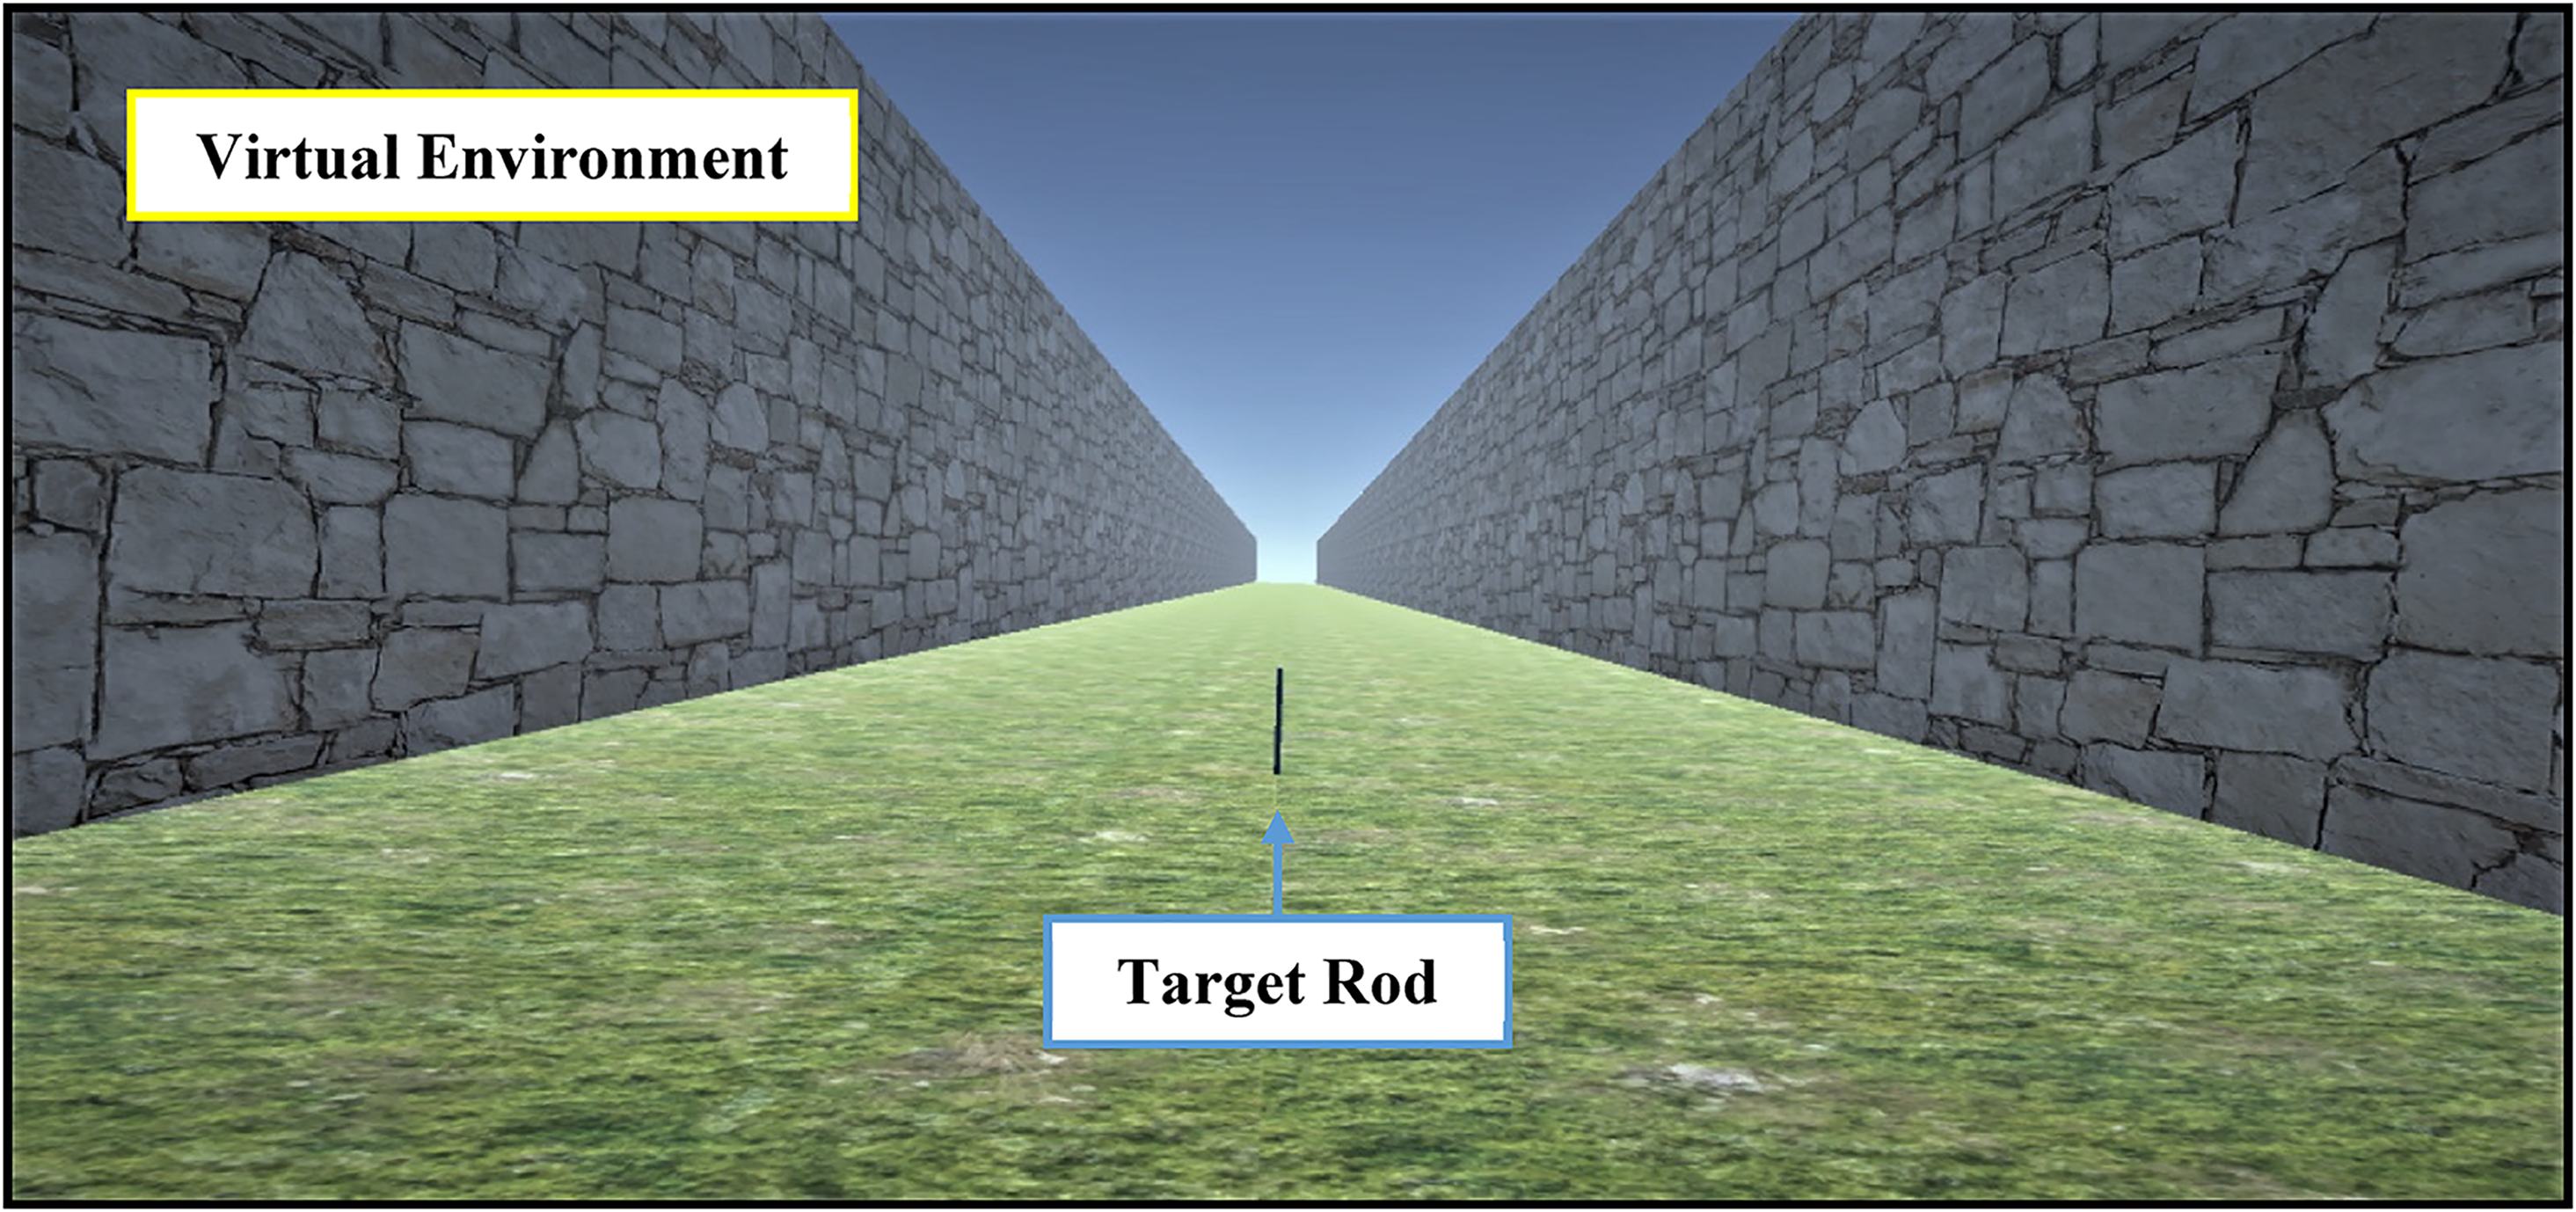
Target rod presented in VR as seen from participant's point of view in the DK2 head-mounted display.
Staircase Method
Participants compared the length of the seen target rod with the reference rod that they held in their hands. Their task was to determine if the visual target rod was longer or shorter than the reference rod. The length of the visual target rod at each of the four distances was adjusted using a staircase method. The length of the target rod presented in each trial was changed based on the participants’ response to the previous presentation of the rod at that distance. As the participants were holding the reference rod and therefore could not use a keyboard, the test administrator entered the participants’ verbal responses (“longer” or “shorter” than the reference rod) into the computer program. The subsequent length of the target rod was determined by the standard rules of the Parameter Estimation by Sequential Testing (PEST) method developed by Taylor and Creelman (1967). At the beginning of the experiment, the simulated length of the visual target rod at each of the four simulated distances started with a random length in between 0.227 and 0.680 m (0.454 m, the length of the reference rod ± 50%) and the initial step size was set to 0.04 m.
There were thus four independent staircases running simultaneously, one for each target distance (2, 5, 7, and 10 m). To provide the equal number of trials for each participant and to prevent tests from running too long, each staircase stopped after 25 trials. This number was determined from a pilot experiment, which generally stabilized within 15–20 trials.
Test Conditions
There were three test conditions: standing upright (control, C), lying supine (S), and lying prone (P). The conditions are shown in Figure 3. Tests were conducted in a block design where all participants were exposed to all three conditions. The order of the blocks was counterbalanced to accommodate all possible combinations among participants.
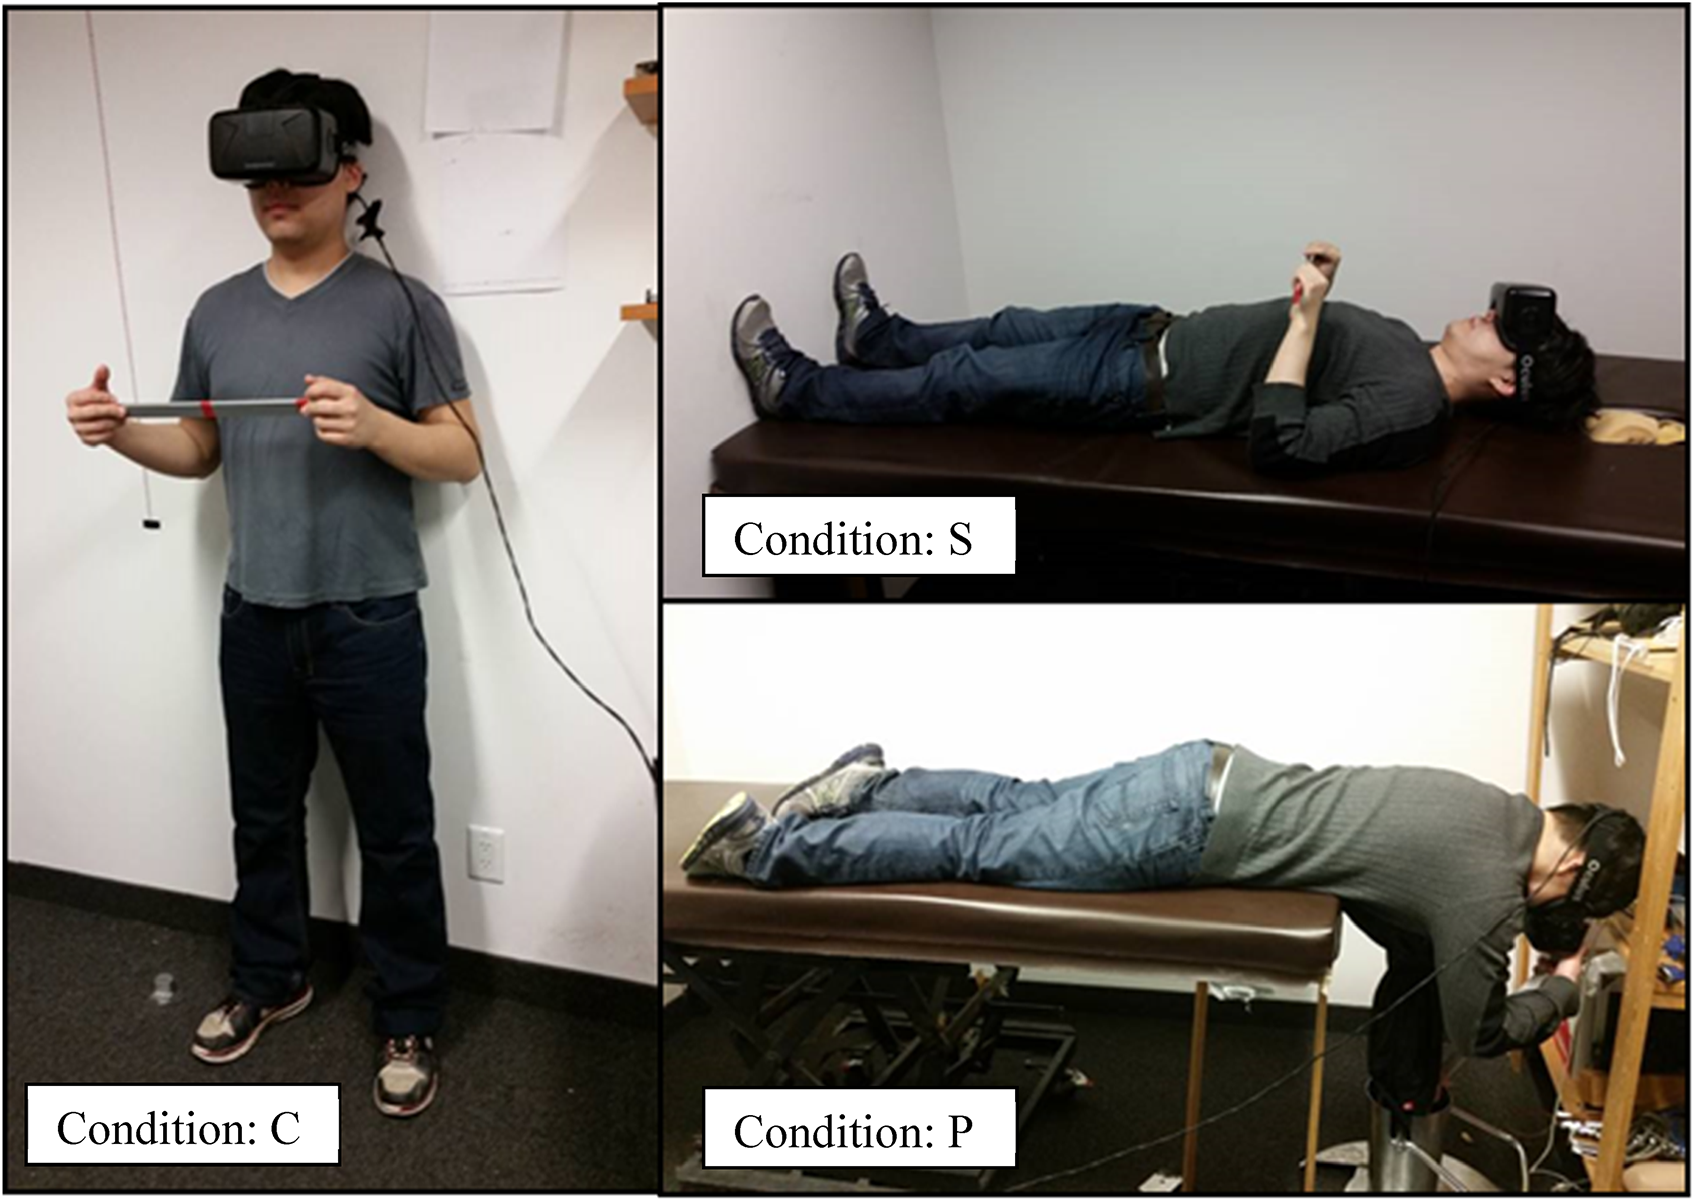
Body orientations—upright (C), supine (S), and prone (P) positions.
Procedure
During the experiment, the participants wore the HMD and held the reference rod with both hands (see Figure 3). This allowed them to explore the length of the reference rod without looking at it throughout the test. They were also allowed to move their head to look around the VR environment. For each trial, participants were instructed to call out whether the target rod on the screen was “longer” or “shorter” than the reference rod they were holding. There was no time limit for the participants to respond in each trial. The test administrator entered the participants’ responses into the test program. Twenty-five trials were carried out for each target distance in each condition, totaling 100 trials per condition. The target rod length and the participant's response were recorded for each trial. The experiment took ∼15 min for each of the three postures, the order of which was varied randomly between participants.
Data Analysis
The staircases honed in on the value at which the length of target rod matched the length of the reference rod held in their hands. In order to obtain the most reliable estimate of this value, a logistic curve (equation (1)) was fitted to participant's responses (using 0 for shorter and 1 for longer)
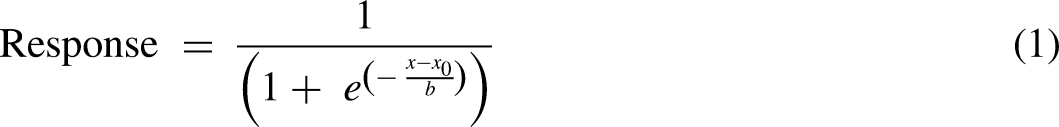
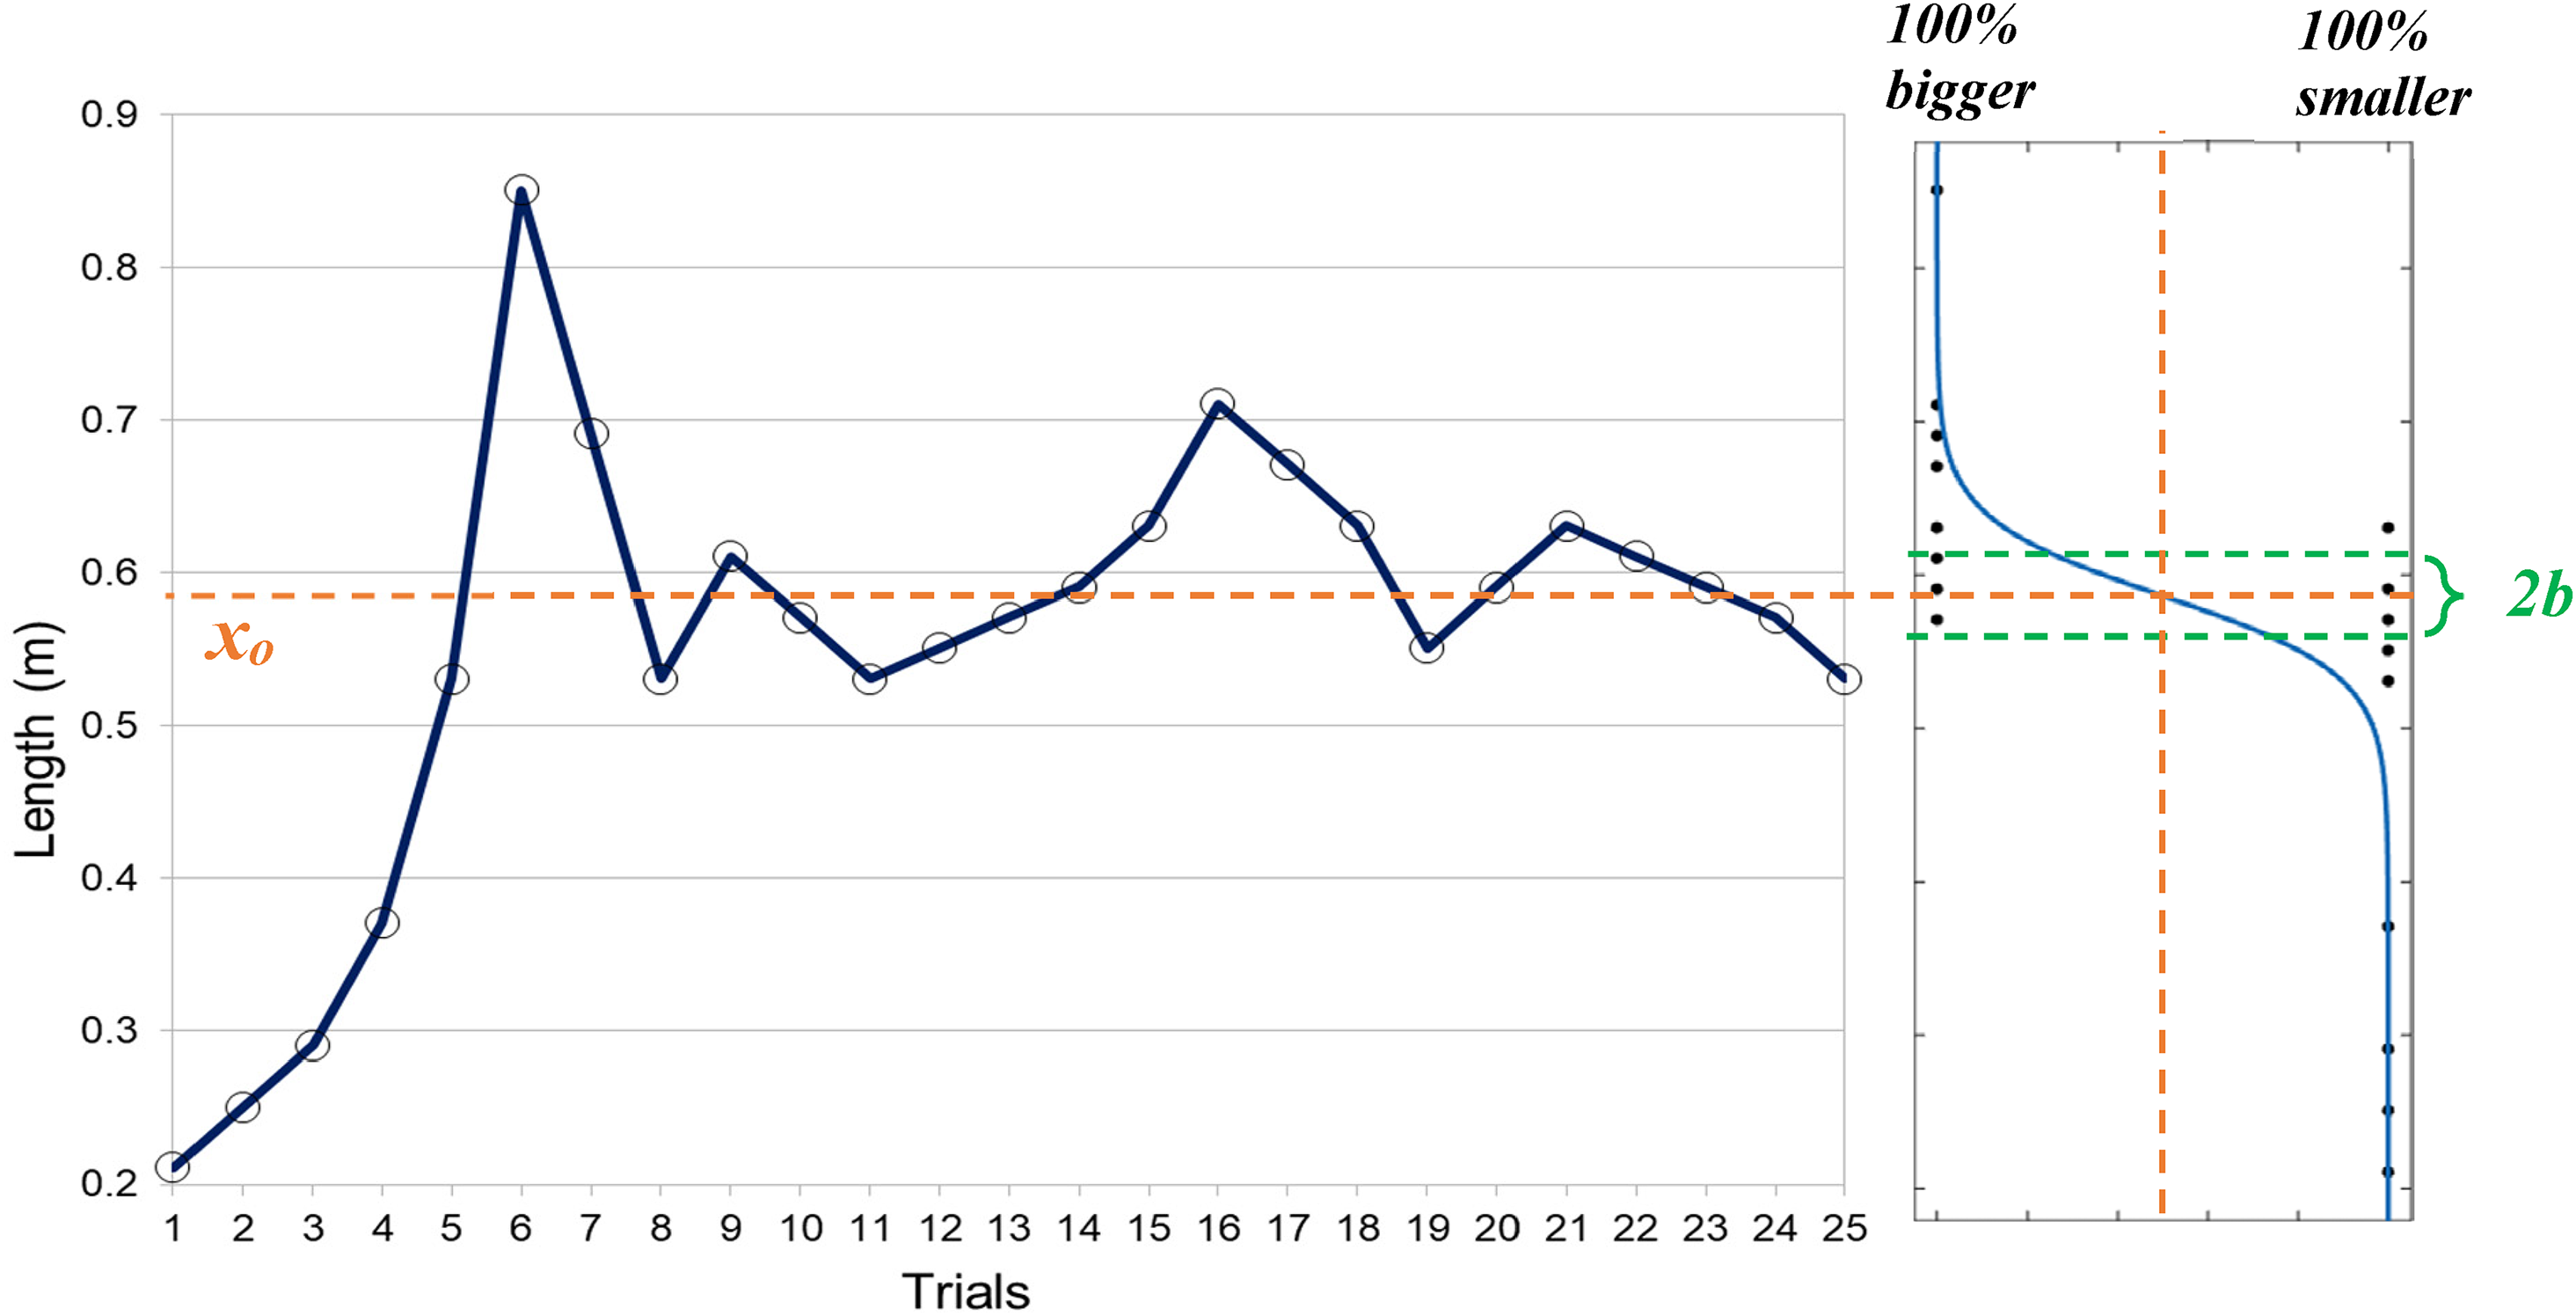
Sample of data collected from a single staircase from a typical subject using the PEST method (left) as a function of trial number, and the best-fit logistic curve fitted using equation (1) (right): x0 = visual rod length judged as equal to the reference rod, 2b = estimate of the standard deviation of the curve (hence the estimation of JND—just noticeable difference). The individual responses for each target rod length are shown as filled circles.
The matching target length estimated from the curve fitting (equation (1)) was compared between conditions using linear mixed model analysis to determine the effect of different body orientations (C, S, and P) and target distances (2, 5, 7, and 10 m). We also compared the standard deviations for each condition to evaluate the precision of participants’ judgements of the target length. For pairwise comparisons, we used the Benjamini-Hochberg procedure for p-value correction.
Outlier Analysis
Any matched target length or standard deviation estimated from curve fitting (see Figure 4) that differed from the overall mean by more than 2.5 standard deviations was identified as an outlying data point. Participants with three or more outlying data points for anybody orientation condition (leaving a matched target length for only one out of four distances for that body orientation) were removed from the analysis as an outlier. As a result, one participant and three outlying data points were removed, leaving 23 participants with a total of 273 data points for the analysis.
Results
Accuracy
When target length errors were calculated (the differences between the target length matched by the participants to the reference rod length and the length of the reference rod), they revealed that the visual targets were made larger than the reference length to match its perceived length on average by 0.061 m (13.5%) in the upright condition (C), 0.086 m (18.9%) in the supine condition (S), and 0.107 m (23.6%) in the prone condition (P). These differences were all larger than the estimated JND of 0.029 m (average 2b of the control condition).
A linear mixed model analysis was run to determine if body orientation (C, S, and P) or target distance (2, 5, 7, and 10 m) had an effect on the accuracy of the matched target length. A significant main effect of body orientation was revealed, F(2, 21.950) = 3.566, p = .046. Pairwise comparisons of the body orientations indicated that participants had to make the target lengths longer in both condition S (supine, M = 0.540 m, SD = 0.135 m), p = .045 and condition P (prone, M = 0.561 m, SD = 0.156 m), p = .045 compared to the control upright condition, C (M = 0.515 m, SD = 0.122 m) to match the physical reference length (see Figure 5).
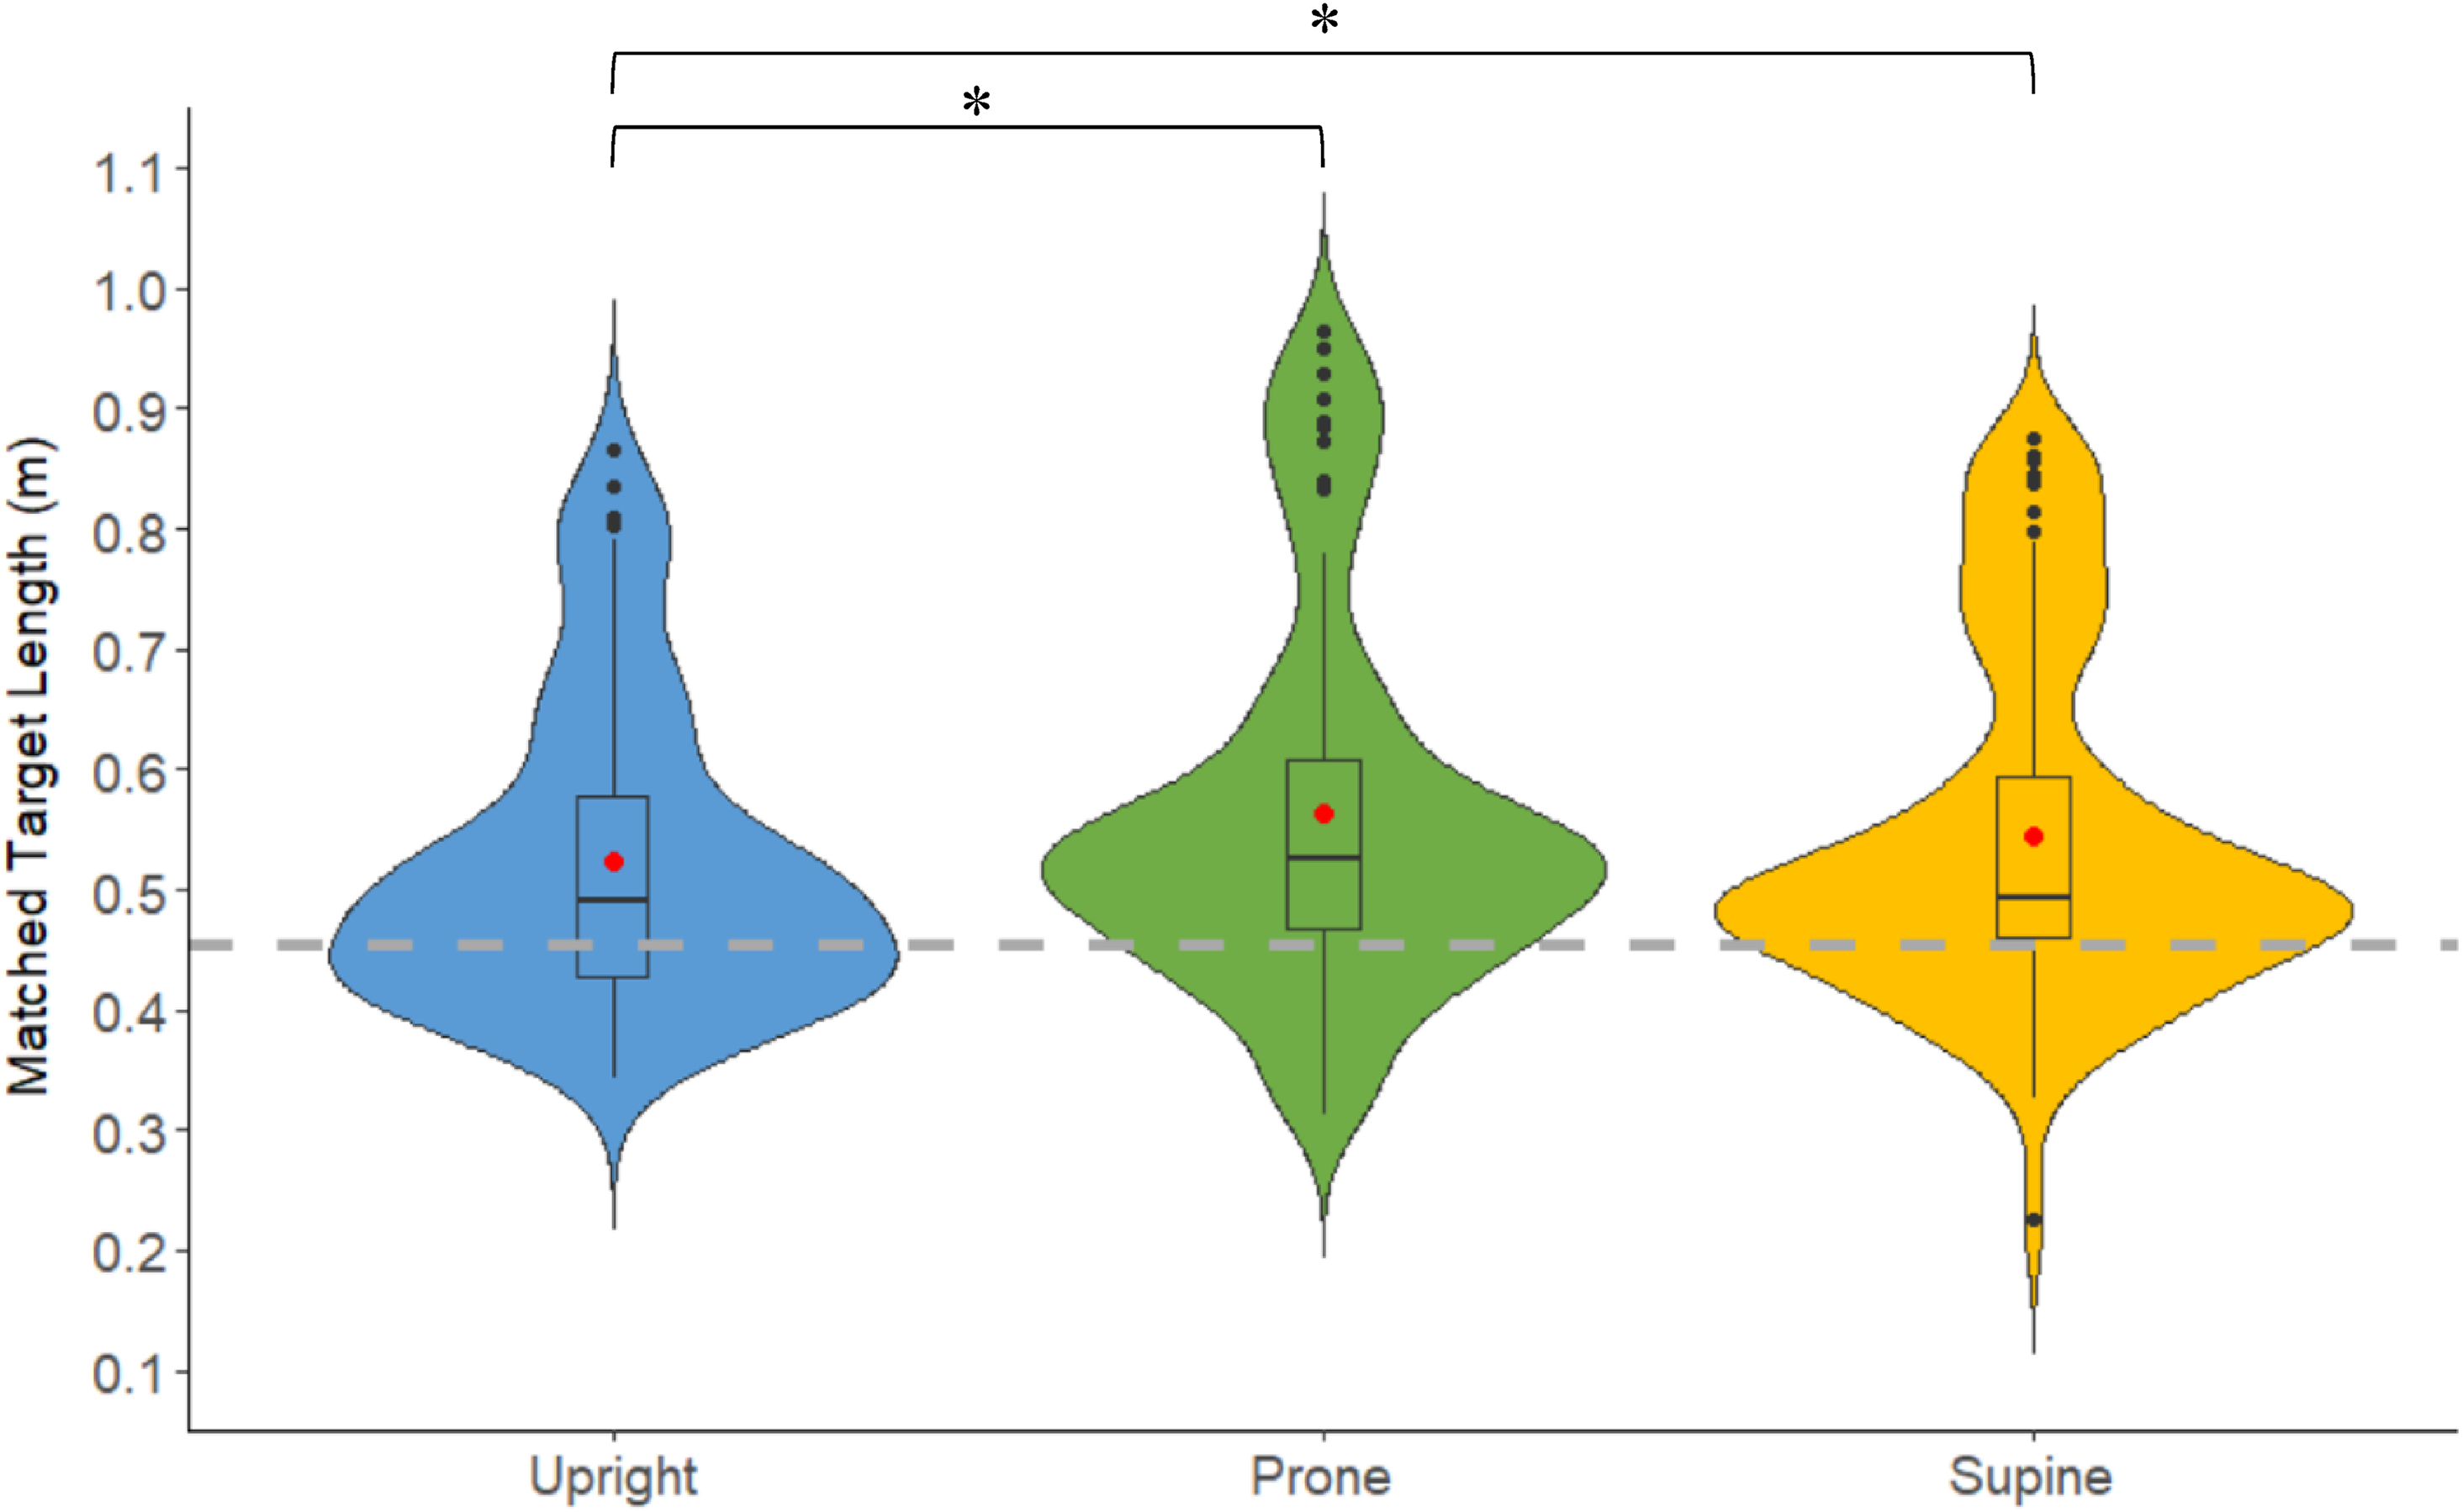
Data for each orientation condition, collapsed across distance is represented by these violin plots with include boxplots at their center: In violin plots, blue (C—upright), green (P—prone), and yellow (S—supine) density curves represent the distribution of data at every matched target length. In boxplots, the red dots represent the mean values for the perceived length for each of the three body orientations pooled across the four target distances. The black dots represent the values 1.5 IQR (interquartile range) below the first quartile (25th percentile) or above the third quartile (75th percentile). The grey dashed line represents the reference rod's length (0.454 m). *p ≤ .05.
Effect of Target Distance on Accuracy
The linear mixed model analysis also showed that there was no significant main effect of target distance found on the participants’ matched target lengths F(3, 20.898) = 0.913, p = .452. See Table 1 for the average matched target length value for each distance and body orientation conditions.
Average target length matched to the reference length in each body orientation at each distance.
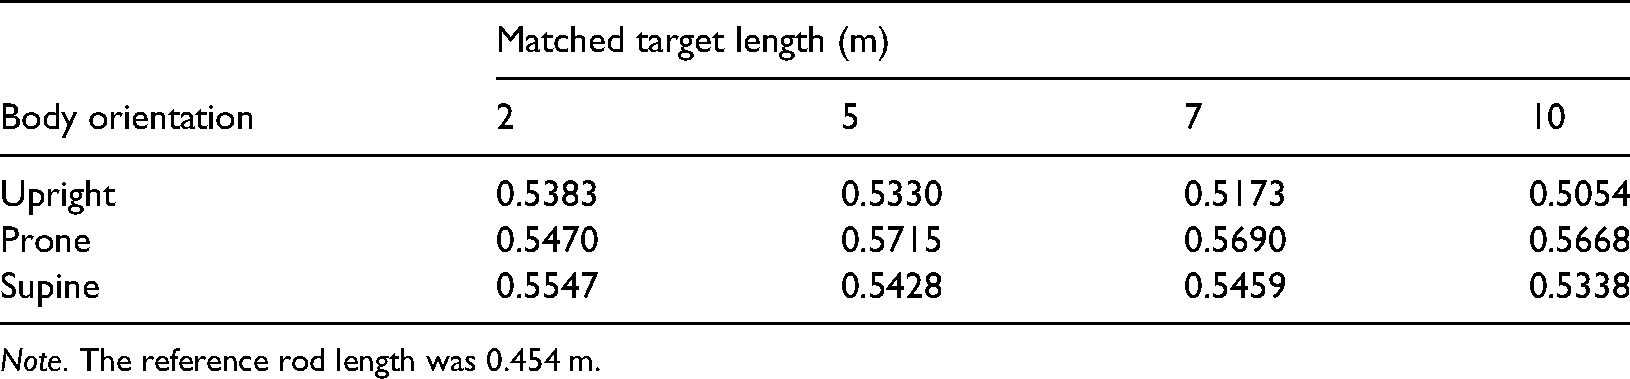
Note. The reference rod length was 0.454 m.
Effect of Body Orientation on Precision
Precision was evaluated by comparing the b values (inversely proportional to precision) using a linear mixed model analysis, of the distribution of participant decisions (i.e., decisions on choosing larger or smaller; see equation (1) and Figure 4 for calculation method) in each condition pooled over target distances. There was no significant main effect of body orientation on the standard deviations of the decisions, F(2, 21.723) = 1.850, p = .181.
Discussion
In the present study, we found that participants made the virtual target rod longer to match its length to a physical reference rod held in their hands while in supine or prone body orientations compared to when viewing the target rod while in upright body orientation. This was true even though the visual environment was always consistent with them maintaining an upright posture throughout (McManus & Harris, 2021). This indicates that the target appeared smaller when viewed lying down than while standing. This finding is consistent with the past studies by Harris and Mander (2014) and Ching et al. (1963), and is consistent with our first hypothesis in which we hypothesized that the perceived size of an object viewed while supine or prone would differ from when viewed while upright. However, the compressed perceived size while supine or prone is incompatible with our second hypothesis which stated that the supine and the prone body orientations would have opposite effects on perceived size. It appears that size perception is not dependent on the direction of gravity but instead is affected in the same way in response to tilt in either direction, as Ching et al. (1963) found.
The target rod had to be longer in general, even when upright, to be judged as to match the length of the physical reference rod held in their hands which suggests that in the virtual environment participants always perceived the virtual rod as smaller than it was simulated as being. Compressed perception of space and egocentric distances in VR has been shown in many past studies (Armbrüster et al., 2008; Knapp & Loomis, 2004; Willemsen et al., 2008). The differences in perceived size found in the present study are compatible with misperceived target distances.
In order to correctly determine an object's size based on its retinal image people need to know an object's egocentric distance. Our results showed that participants made the targets larger to match the reference size in all conditions, which is compatible with either perceiving the targets as smaller than they really were or as closer than they really were. Since all comparisons in this study used data collected in the same VR environment, any global effect of distance compression in VR would have been present for all conditions to the same extent. However, the effect of supine or prone posture introduced an additional error of 5.4% and 10.1%, respectively. Why might participants perceive the targets as smaller while tilted?
During self-motion, visual and vestibular cues can be reweighted based on their relative reliabilities (Fetsch et al., 2009). Perhaps the unusual, conflicting vestibular stimulation of lying while with visual cues indicating they were upright world may be responsible for the changes in size/distance perception noted here and by Harris and Mander (2014) and Ching et al. (1963), as well as the changes in perceived heading noted by Hummel et al. (Hummel et al., 2016) and in the perceived magnitude of vection (Guterman et al., 2012). None of these observations seem to be affected by the polarity of gravity—only by the misalignment or perceived misalignment with body vertical, that is, gravity not acting along the long axis of the body. Future studies on size perception during other body orientations should look at the threshold angle for a tilt that affects both vection and size perception.
Haptic Size Perception of Reference Length
In the present study, participants compared the visually seen target length to a haptically felt reference length. So far, we have been assuming that the perceived length of the reference rod was unchanged and only the perceived length of the target rods was altered. How reliable is this assumption? Atkins et al. (2003) showed that visual perception of size can be recalibrated whereas haptic perception provides a standard for the size felt by the hands. Our results may indicate an underestimation of visual length, an overestimation of haptic length, or both as visual and haptic percepts work closely together to provide the observer with size information of the objects in the world. However, the Atkins et al. (2003) study would seem to indicate that haptic length perception is the more robust.
The Threat Hypothesis
Why might distance and/or size perception be biased when lying down? The biases may be due to the level of vulnerability to a perceived threat. The perceived threat can influence perception. A study by Jung et al. (2016) demonstrated that distance perception can be influenced by another person's body orientation. Observers perceived another person as closer to them when that person was facing them but farther away when that person was facing away from them (Jung et al., 2016). People perceive threat-related stimuli as both larger and closer than they are; for example, spiders are perceived as larger by arachnophobes (Vasey et al., 2012), and the conceptualized size of an angry man, even when not seen, is larger for observers bound to a chair or experiencing postural instability, compared to his size imagined by those who were not so threatened (Fessler & Holbrook, 2013). In the current experiment, a supine or prone posture makes the observer more vulnerable as it might potentially delay the fleeing or fighting response if any threat were encountered. Indeed, the visual-vestibular interactions discussed above may provide a mechanism for this ecologically valid effect. Although underestimating distance may impact efficiency during the performance of a task as it provides the observer with wrong information (Firestone, 2013), it may also enhance the perceiver's ability to act and therefore may sometimes be beneficial to survival. For example, when people whose ability to defend themselves is compromised, they might perceive a spider to be moving faster than those who are in a position to defend themselves (Witt & Sugovic, 2013). Perceiving potentially dangerous targets such as a spider, an approaching car, or other people with unknown intentions as larger or closer when we are in a vulnerable state, such as when lying down, may give us a greater sense of urgency, allowing us to jump-start a fight or flight response. It is still unknown whether the same underestimation of size occurs in body orientations other than supine and prone. Future studies can evaluate this further by incorporating other body postures.
Conclusion
We have shown that, even under conditions when people felt upright, lying down makes objects appear smaller/closer. This indicates a direct influence of physical transducers of posture information on the perception of size/distance which may have some survival value.
Footnotes
Declaration of Conflicting Interests
The author(s) declared no potential conflicts of interest with respect to the research, authorship, and/or publication of this article.
Funding
The authors disclosed receipt of the following financial support for the research, authorship, and/or publication of this article: This work was supported by Discovery grants to LRH from the Natural Sciences and Engineering Research Council of Canada (grant number Discovery RGPIN 2015-46271, Discovery RGPIN 2020-06093) and by the Canadian Space Agency (grant # 15ILSRA1-York).