
Abstract
We used an enumeration task to address the question of whether acute alcohol intoxication reduces cognitive or perceptual capacity. To control for individual differences in cognitive resources, we took a sober record of each participant’s working memory capacity (WMC). Alcohol was expected to impair enumeration performance, either for the automatic parallel counting of small stimulus sets indicating a perceptual impairment, or the controlled counting or estimating of larger sets indicating a cognitive impairment. Enumeration showed an overall decline in accuracy following a vodka beverage and the deficit was negligible for small sets, which is inconsistent with a loss of perceptual capacity. Having a higher WMC facilitated the enumeration of larger sets and the correlation between WMC and accuracy was stronger in the alcohol condition suggesting that low-WMC participants were more impaired by the beverage. Our findings therefore suggest that alcohol diminished cognitive rather than perceptual capacity.
Keywords
According to alcohol myopia theory (AMT), acute intoxication reduces cognitive capacity, restricting the scope and focus of attention to only the most immediate, central, or goal-relevant stimuli (Steele & Josephs, 1990). This is supported by evidence of reduced peripheral awareness following alcohol ingestion shown in measures of scene perception (Harvey et al., 2013; Jaffe et al., 2019; Schreiber Compo et al., 2011), eye movements (Harvey et al., 2013; Harvey, 2014), and spatial attention (Bayless & Harvey, 2017; Canto-Pereira et al., 2007; Harvey, 2016).
Harvey (2016), for example, measured sober and alcohol-intoxicated response times to surprise letter probes presented during a task requiring participants to categorise entire words (wide attention focus) or just the middle-letter of words (narrow attention focus). Consistent with AMT, alcohol slowed responses to probes displayed in peripheral (noncentral) letter positions when attention was narrowed to the central letter. Similarly, Canto-Pereira et al. had sober and intoxicated viewers respond to visual targets while focusing on either a small central frame or on two laterally positioned frames presented on a large display screen. In the latter condition, the alcohol group responded more slowly to peripheral targets than sober controls, suggesting alcohol restricts the scope of attention even when participants are explicitly instructed to distribute it widely.
Alcohol is also known to increase rates of inattentional blindness (IB; Clifasefi et al., 2006; Harvey et al., 2018), defined as the failure to notice a novel stimulus in plain view due to the ongoing demands of a simultaneous visual task (Cartwright-Finch & Lavie, 2007; Mack & Rock, 1998; Most et al., 2001; Simons & Chabris, 1999). In a well-known example, two basketball teams (black shirts and white shirts) each pass a ball among fellow team members. A few seconds into the clip, a gorilla-suited female walks among the players to the centre of the court, turns to camera, thumps her chest then walks off court the other side (Simons & Chabris, 1999). Participants must count the number of ball passes made by the white shirt players then, after the game, state whether they noticed anything unusual about the clip. In the original Simons and Chabris (1999) study, 56% of participants failed to notice the unexpected gorilla, reflecting a surprising level of IB to a highly distinctive stimulus. But Clifasefi et al. (2006) found a gorilla noticing rate of only 18% among alcohol participants (blood alcohol concentration [BAC] ≈ 0.04%), compared to 46% among sober controls. This Presumably reflects the alcohol group’s narrower focus on the pass counting task than that of sober controls.
More recently, Harvey et al. (2018) had local bar drinkers complete an extended version of Clifasefi et al.’s study. This included a task difficulty manipulation for which half the sample were required to keep separate counts of the white team’s aerial and bounce passes, a measure of pass counting accuracy and two further unexpected stimulus events to create an IB scale. As expected, IB increased with rising BACs, but only for the easier single-count task. The dual-count condition was possibly so demanding it left no spare attentional capacity for alcohol to diminish (Bayless & Harvey, 2017; Harvey et al., 2018).
Although these examples support Steele and Josephs’ (1990) alcohol myopia model, it remains unclear whether the apparent narrowing effect reflects a reduction in general cognitive capacity that compromises attentional control, or selective impairment to regions specialised for perception. In a test of AMT, Saults et al. (2007) found that alcohol only impaired working memory for sequential auditory and visual stimuli. Recall accuracy for simultaneously presented sets of auditory or visual items was preserved. Saults et al. therefore concluded that alcohol does not reduce working memory capacity (WMC) but, instead, disrupts the control processes needed for the maintenance of sequential information.
The extent to which sober viewers experience perceptual failures such as IB is influenced by the primary task’s perceptual load, which may be increased either by adding more features to the stimulus scene or, as with the dual pass-counting described above, by having viewers discriminate more than one aspect of it (Cartwright-Finch & Lavie, 2007; Simons & Chabris, 1999; Simons & Jensen, 2009). According to Lavie et al. (2006, 2014), under a low perceptual load, there is spare capacity for processing peripheral information of lesser importance. But this perceptual limit is assumed to be independent of the domain-general constraints of working memory and attentional control, thus high-load tasks leave insufficient capacity for the capture of peripheral information.
Eayrs and Lavie (2018) recently developed the use of subitising as an index of perceptual capacity. This is the ability to instantly and accurately recognise the number of items displayed in a scene without need for sequential counting or estimating. In standard enumeration tasks, response speed and accuracy decline markedly as the number of stimulus items exceeds four, possibly reflecting an upper perceptual capacity limit for the parallel detection of number (Trick & Pylyshyn, 1994). Each item added to the array increases reaction time (RT) by around 40 to 100 ms per item up to set size four, but the increase jumps to 250–350 ms per item beyond this point (Egeth et al., 2008; Jackson & Coney, 2004; Kaufman et al., 1949; Olivers & Watson, 2008; Saltzman & Garner, 1948; Trick & Pylyshyn, 1994).
There are several theoretical accounts of subitising. One is that it is a by-product of the more general perceptual ability to identify multiple objects in parallel and recognise familiar shapes or patterns (Mandler & Shebo, 1982; Trick & Pylyshyn, 1994; Wagemans et al., 2000). This is an automatic and capacity limited feat of visual working memory known to break down for scenes containing more than four items (Luck & Vogel, 2013). An alternative view suggests that subitising is driven by a dedicated enumeration mechanism that declines in accuracy as the number of array items increases (Dehaene & Changeux, 1993; Dehaene & Cohen, 1994). Evidence for this account emerged from a clinical dissociation shown by patients with simultanagnosia—the inability to recognise more than one object at a time. These individuals show preserved subitising yet deficits in the ability to recognise the familiar geometric shapes stimulus items are arrayed in (Dehaene & Cohen, 1994). However, this position is challenged by the dissociation in enumeration accuracy and response times between small and large item sets (Piazza et al., 2011; Revkin et al., 2008).
Interestingly, subitising (but not counting/estimating) accuracy is preserved when simultaneously performed with a verbal working memory task (Tuholski et al., 2001) but not with a concurrent perceptual task, such as object tracking (Chesney & Haladjian, 2011) or line and shape judgement (Railo et al., 2008; Vetter et al., 2008). This suggests subitising is underpinned by a limited-capacity perceptual mechanism independent of the cognitive (i.e., working memory) processes needed for the counting or estimation of large item sets (Eayrs & Lavie, 2018; Moscoso et al., 2020).
In this study, we tested AMT by examining the influence of acute alcohol consumption and individual differences in cognitive capacity on enumeration performance. We used the operation span (OSPAN) task to index cognitive capacity. This is a well-established attentionally demanding measure of WMC that requires participants to store letter sequences while simultaneously validating simple mathematical equations (Unsworth et al., 2005). If the basis of AMT is a reduction in cognitive capacity, as argued by Steele and Josephs (1990), then alcohol should impair the enumeration of stimulus sets outside the subitising range (i.e., >4 items) but leave subitising unharmed. Furthermore, this deficit should be larger for participants with a low- rather than high-WMC. On the other hand, if alcohol reduces only perceptual capacity, then it should impair subitising accuracy only, regardless of WMC. It is of course possible that alcohol reduces both perceptual and cognitive capacity. If so, it should impair enumeration accuracy across all set sizes, with a higher WMC facilitating performance beyond the subitising range (i.e., for set sizes > 4).
Method
Participants
A total of 40 undergraduate psychology students (30 females and 10 males) aged 18 to 21 years (M = 18.89, SD = 0.99) participated for course credit. Any applicants below 18 years of age (legal UK drinking age), with medical concerns precluding the consumption of alcohol, or who were not regular alcohol drinkers were declined from the study. All participants had normal or corrected-to-normal vision.
Design
The experiment conformed to a 2 (Beverage Treatment: Alcohol vs. No Alcohol) × 2 (WMC Group: High vs. Low) × 9 (Set Size: 1–9) mixed-design with WMC being the only between-subjects variable. Dependent variables were response accuracy (% correct) and reaction time (ms).
Apparatus and Materials
Breath alcohol concentrations were measured using a Dräger Alcotest 3000 breathalyser and recorded in milligrams of alcohol per litre of breath (mg/L). For ease of interpretation, we converted the breath unit to a BAC percentage based on a blood-to-breath partition ratio of 2,300:1.
We used Unsworth et al.’s (2005) computerised operation span (OSPAN) test to measure WMC. This starts with an immediate serial recall practice phase for which a short sequence of letters is displayed for 800 ms. Viewers then try to recall the sequence in the order presented by mouse-clicking the appropriate letters in a 4 × 3 array (F, H, J, K, L, N, P, Q, R, S, T, and Y). A second practice task follows in which viewers must quickly validate a series of maths equations. Once the equation is read (e.g., (8–2)/3 = ?), the viewers click a button to reveal a number (e.g., 2) with a true/false box beneath it. They record a response with a single click and accuracy feedback follows. The third and final practice session is the OSPAN task in which the letter recall and maths test are combined. For this complex span task, viewers are given their average practice equation solution time plus 2.5 SD to solve each equation. If this elapses without a response, the program records an error for that trial and proceeds to the next equation. When a response for an equation is recorded, the to-be-recalled letter associated with it appears onscreen. Viewers complete three practice trials each of set size 2. These are followed by the experimental trials proper, with set sizes ranging from 3 to 7. Viewers receive 75 equation/letter combinations in total, three at each of the five set sizes, presented in a randomised order (Unsworth et al., 2005). The automated OSPAN task takes approximately 20 to 25 minutes to complete and the program terminates with the production of five scores: (1) the sum of all perfectly recalled letter sets (“OSPAN score”), (2) the total number of letters recalled in the correct position (“total number correct”), (3) the total number of equation errors (“math errors”), (4) the total number math errors attributed to a time-out (“speed errors”), and (5) the total number of math errors attributed to miscalculation (“accuracy errors”).
For the enumeration task, we adapted Eayrs and Lavie’s (2018) computerised procedure (see Figure 1). On each trial, the viewer fixates on a cross in the centre of a computer screen for 1,000 ms. A number of randomly positioned squares of different sizes are then displayed for 200 ms, ranging in quantity from 1 to 9. These are replaced by a 400 ms black and white noise mask, followed by a central “?” for 2,400 ms, at which point participants use the keyboard number pad to indicate quickly how many squares they thought they saw. The task began with a practice block of six trials followed by three blocks of 54 trials with a 3-minute rest break between blocks.
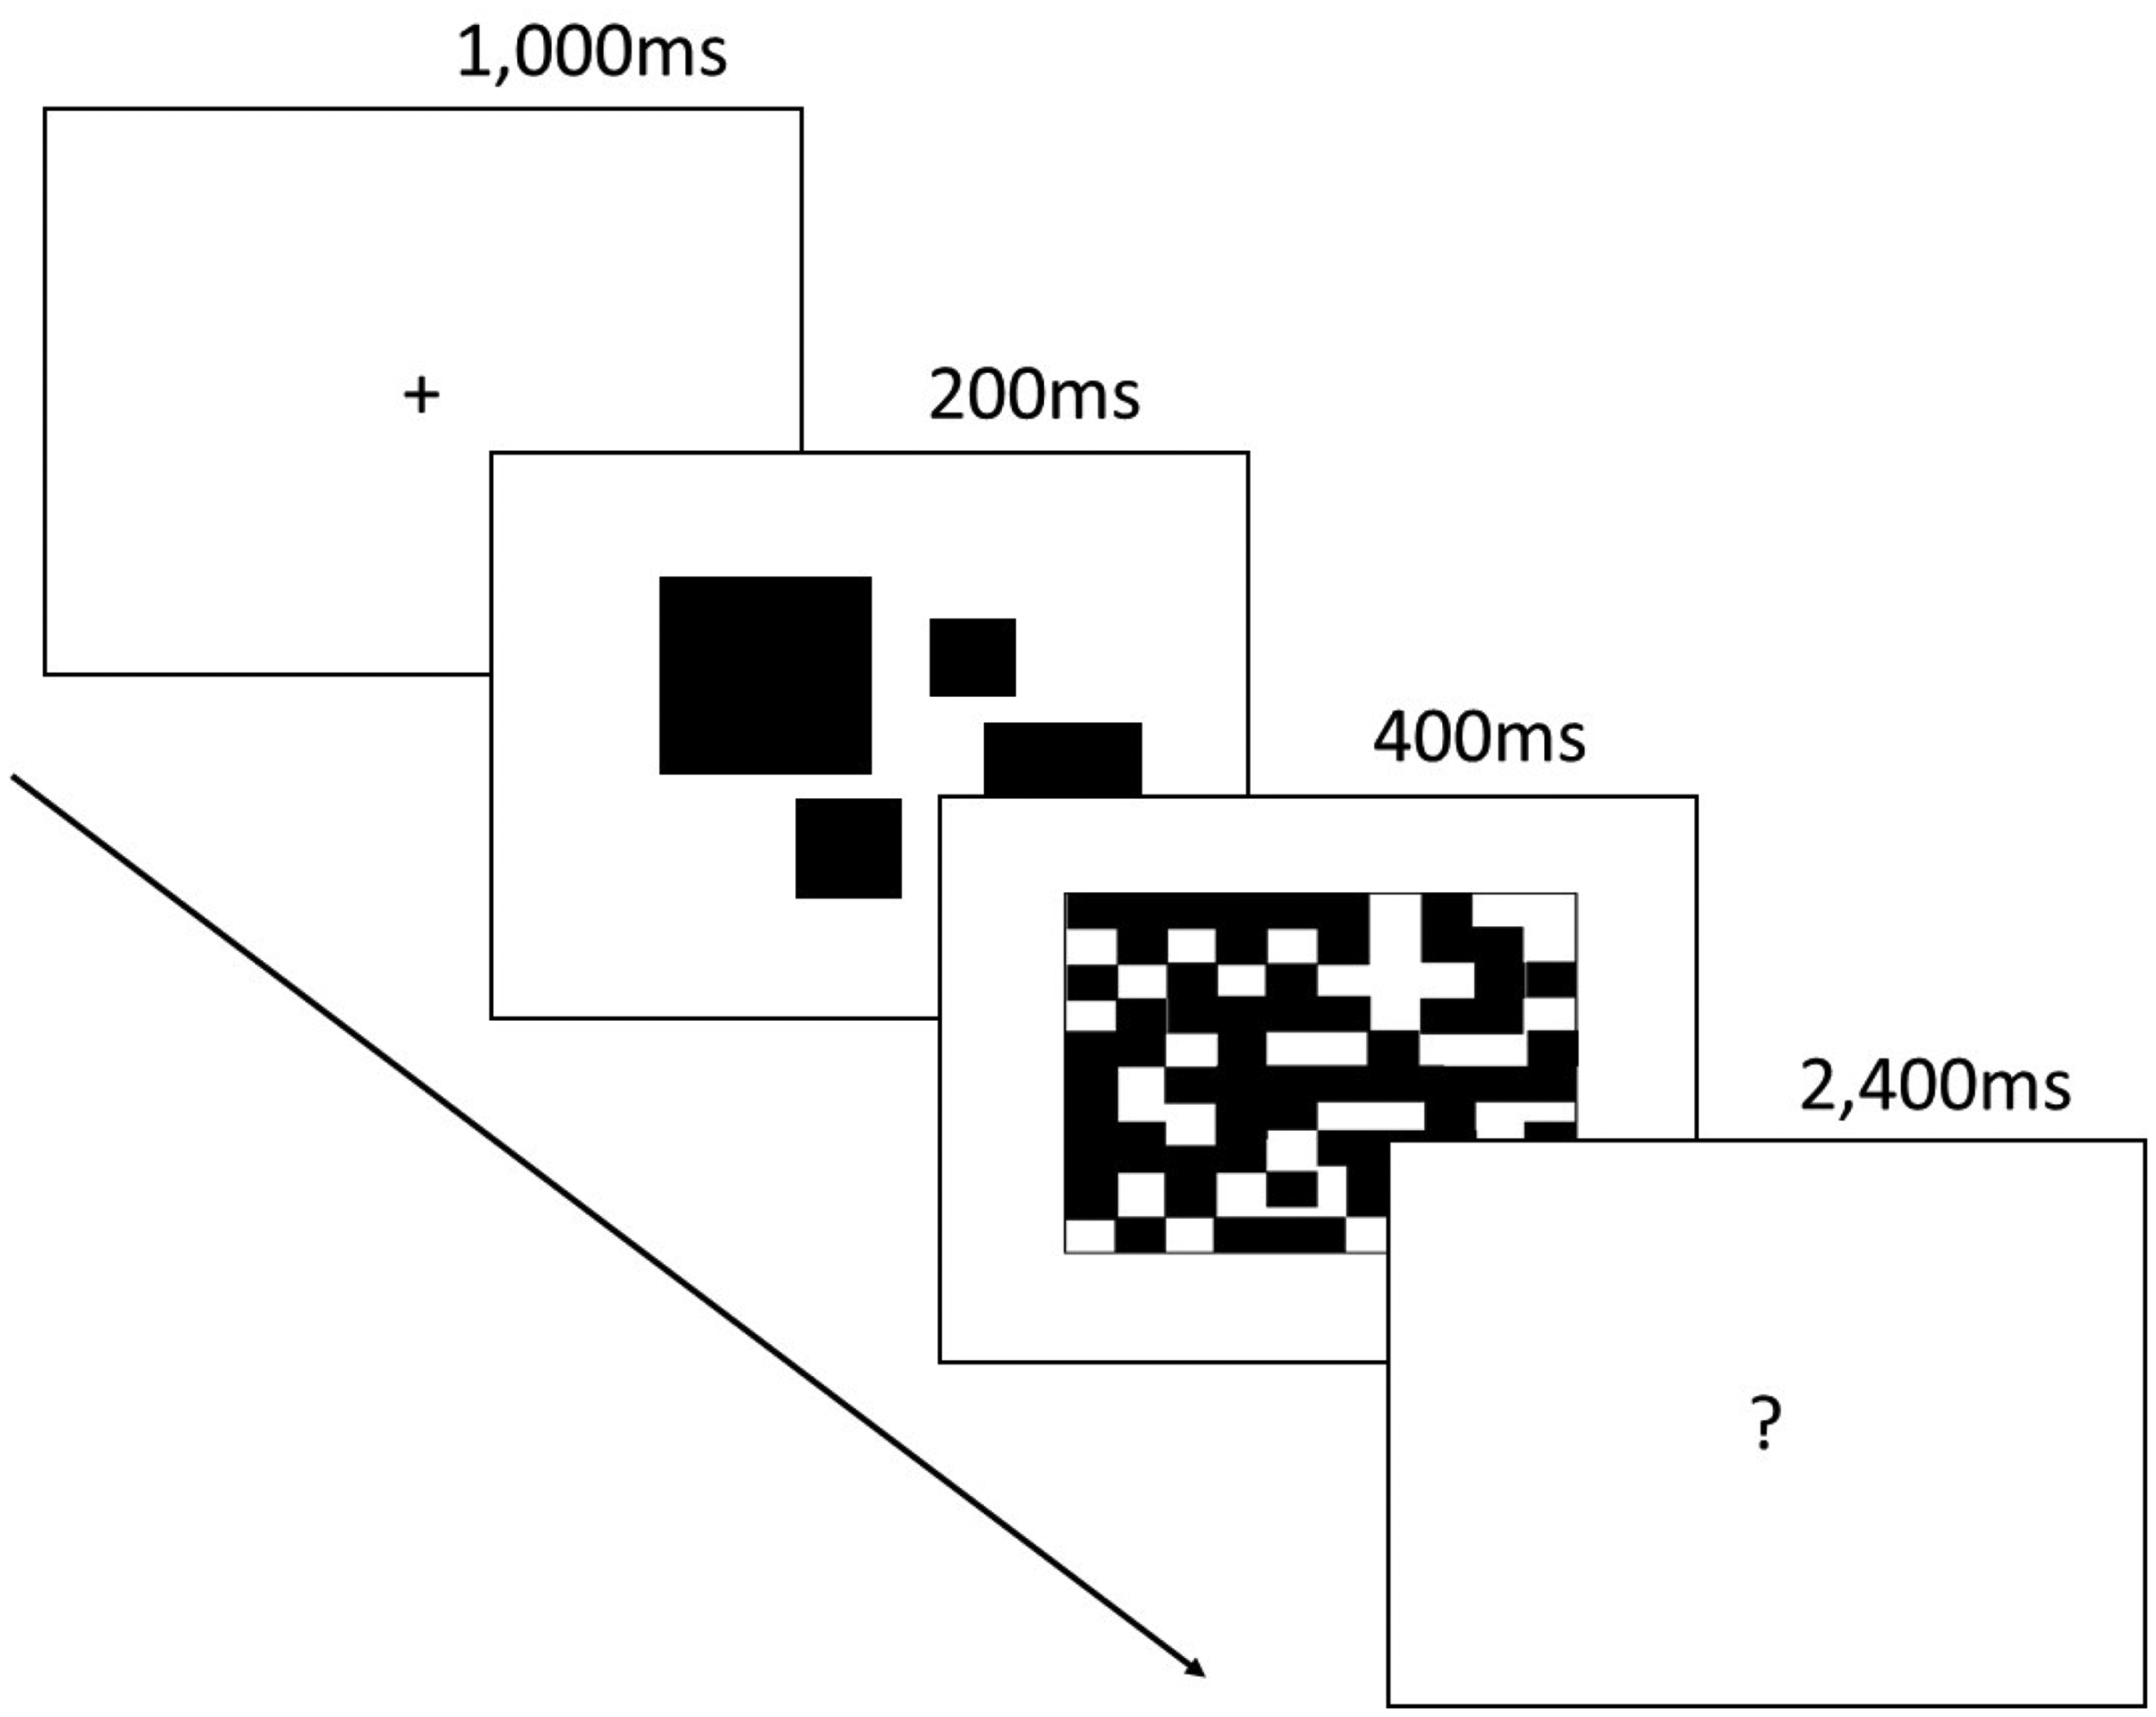
The computerised subitising task adapted from Eayrs and Lavie (2018). The fixation cross was followed by a set of randomly positioned blocks (1–9) presented for 200 ms. These were replaced by a 400 ms noise mask then a 2400 ms “?”, during which time the viewer used the keypad to enter the number of blocks presented, as quickly as possible.
Procedure
Participants were emailed an alcohol screening form and the brief Michigan Alcohol Screening Test (Pokorny et al., 1972) prior to the experiment timeslot. These instruments were designed to ensure eligibility for study inclusion. Exclusion criteria were (a) participants under the age of 18, (b) female participants who were or may have been pregnant, and (c) respondents who reported drinking less than three units of alcohol in an average week. To ensure sobriety at test and to optimise the rate of alcohol absorption, the email also included a request to not consume alcohol 24 hours prior to test and to avoid eating 4 hours prior to test.
Upon arrival at the lab, participants were welcomed and told they were to take part in an experiment investigating the effects of mild alcohol intoxication on visual perception. Details of the study were provided on a participant information sheet. After reading this, they signed a consent form, gave a breath reading to ensure an initial BAC of 0.00%, and then weighed to determine their alcohol dose. While in a sober state, participants completed the OSPAN task followed by the enumeration task both described earlier. The alcoholic beverage followed. Males received 1.5 ml of Absolut Vodka (40% alcohol by volume) per kilogram of weight, and females 1.35 ml per kilogram of weight—a 10% reduction as women are known to show higher blood alcohol concentrations than men following the same dose (Frezza et al., 1990; Mumenthaler et al., 1999). All drinks were mixed with enough sugar-free Indian tonic water to fill a 440 ml glass, the content of which was consumed within 15 to 20 minutes. This was followed by a 15-minute rest period for alcohol absorption, a glass of water to rinse the mouth of residual alcohol, and then a breath test before completion of the subitising task for a second time, as described earlier.
Once the second testing phase was complete, participants were debriefed, given the full aims of the study, and invited to stay behind in the lab until their BAC dropped below the legal limit for driving. However, no-one wished to wait, so all participants signed a disclaimer confirming their awareness of having consumed alcohol and reminding them not to drive or engage in any other activity compromised by alcohol consumption, such as cycling and sport.
Results
Intoxication Levels
The amount of vodka administered to participants in the alcohol condition ranged from 57 ml to 161 ml (M = 96 ml; SD = 23) producing BACs ranging from 0.03% to 0.08% with a mean of 0.05% (SD = 0.07), somewhat lower than the legal limit for driving in England and Wales, which is currently 0.08%.
Working Memory Capacity
Automated OSPAN scores ranged from 6 to 75 (M = 33.78, SD = 18.00) and a median (28.5) split was used to categorise participants as having either a low (range 6–28) or high (range 29–75) WMC. The low-WMC group (n = 20) had a mean OSPAN of 19.30 (SD = 7.14), and the high-WMC group (n = 20) a mean OSPAN of 48.25 (SD = 13.15), t(29.31) = 8.66, p < .001, equal variances not assumed. These measures are comparable to those presented by the task authors. Unsworth et al. (2005) observed an overall mean of 39.16 (SD = 17.41) and a median of 37.5 in their normative sample (n = 252). Furthermore, those in the lower quartile (M = 28) had a mean OSPAN higher than the present low-WMC group and those in the upper quartile had slightly higher OSPANs (M = 51) than our high-WMC group.
Enumeration Accuracy
Data for three participants were excluded from analysis due to peculiar response patterns producing outlying scores. One of these individuals only made counting responses within the 2 to 4 range regardless of set size. The other two used the full range but gave seemingly arbitrary counts that showed no systematic relationship with set size, even for small sets, which ordinarily show much lower error rates.
Data for the remaining 47 participants were entered into a 2 (Alcohol Condition) × 2 (WMC) × 9 (Set Size) mixed-design analysis of variance (ANOVA) with WMC group serving as the only between-subjects variable. Unsurprisingly this revealed a large and significant main effect of set size on enumeration accuracy, F(5.22, 182.70) = 319.69, p < .001,
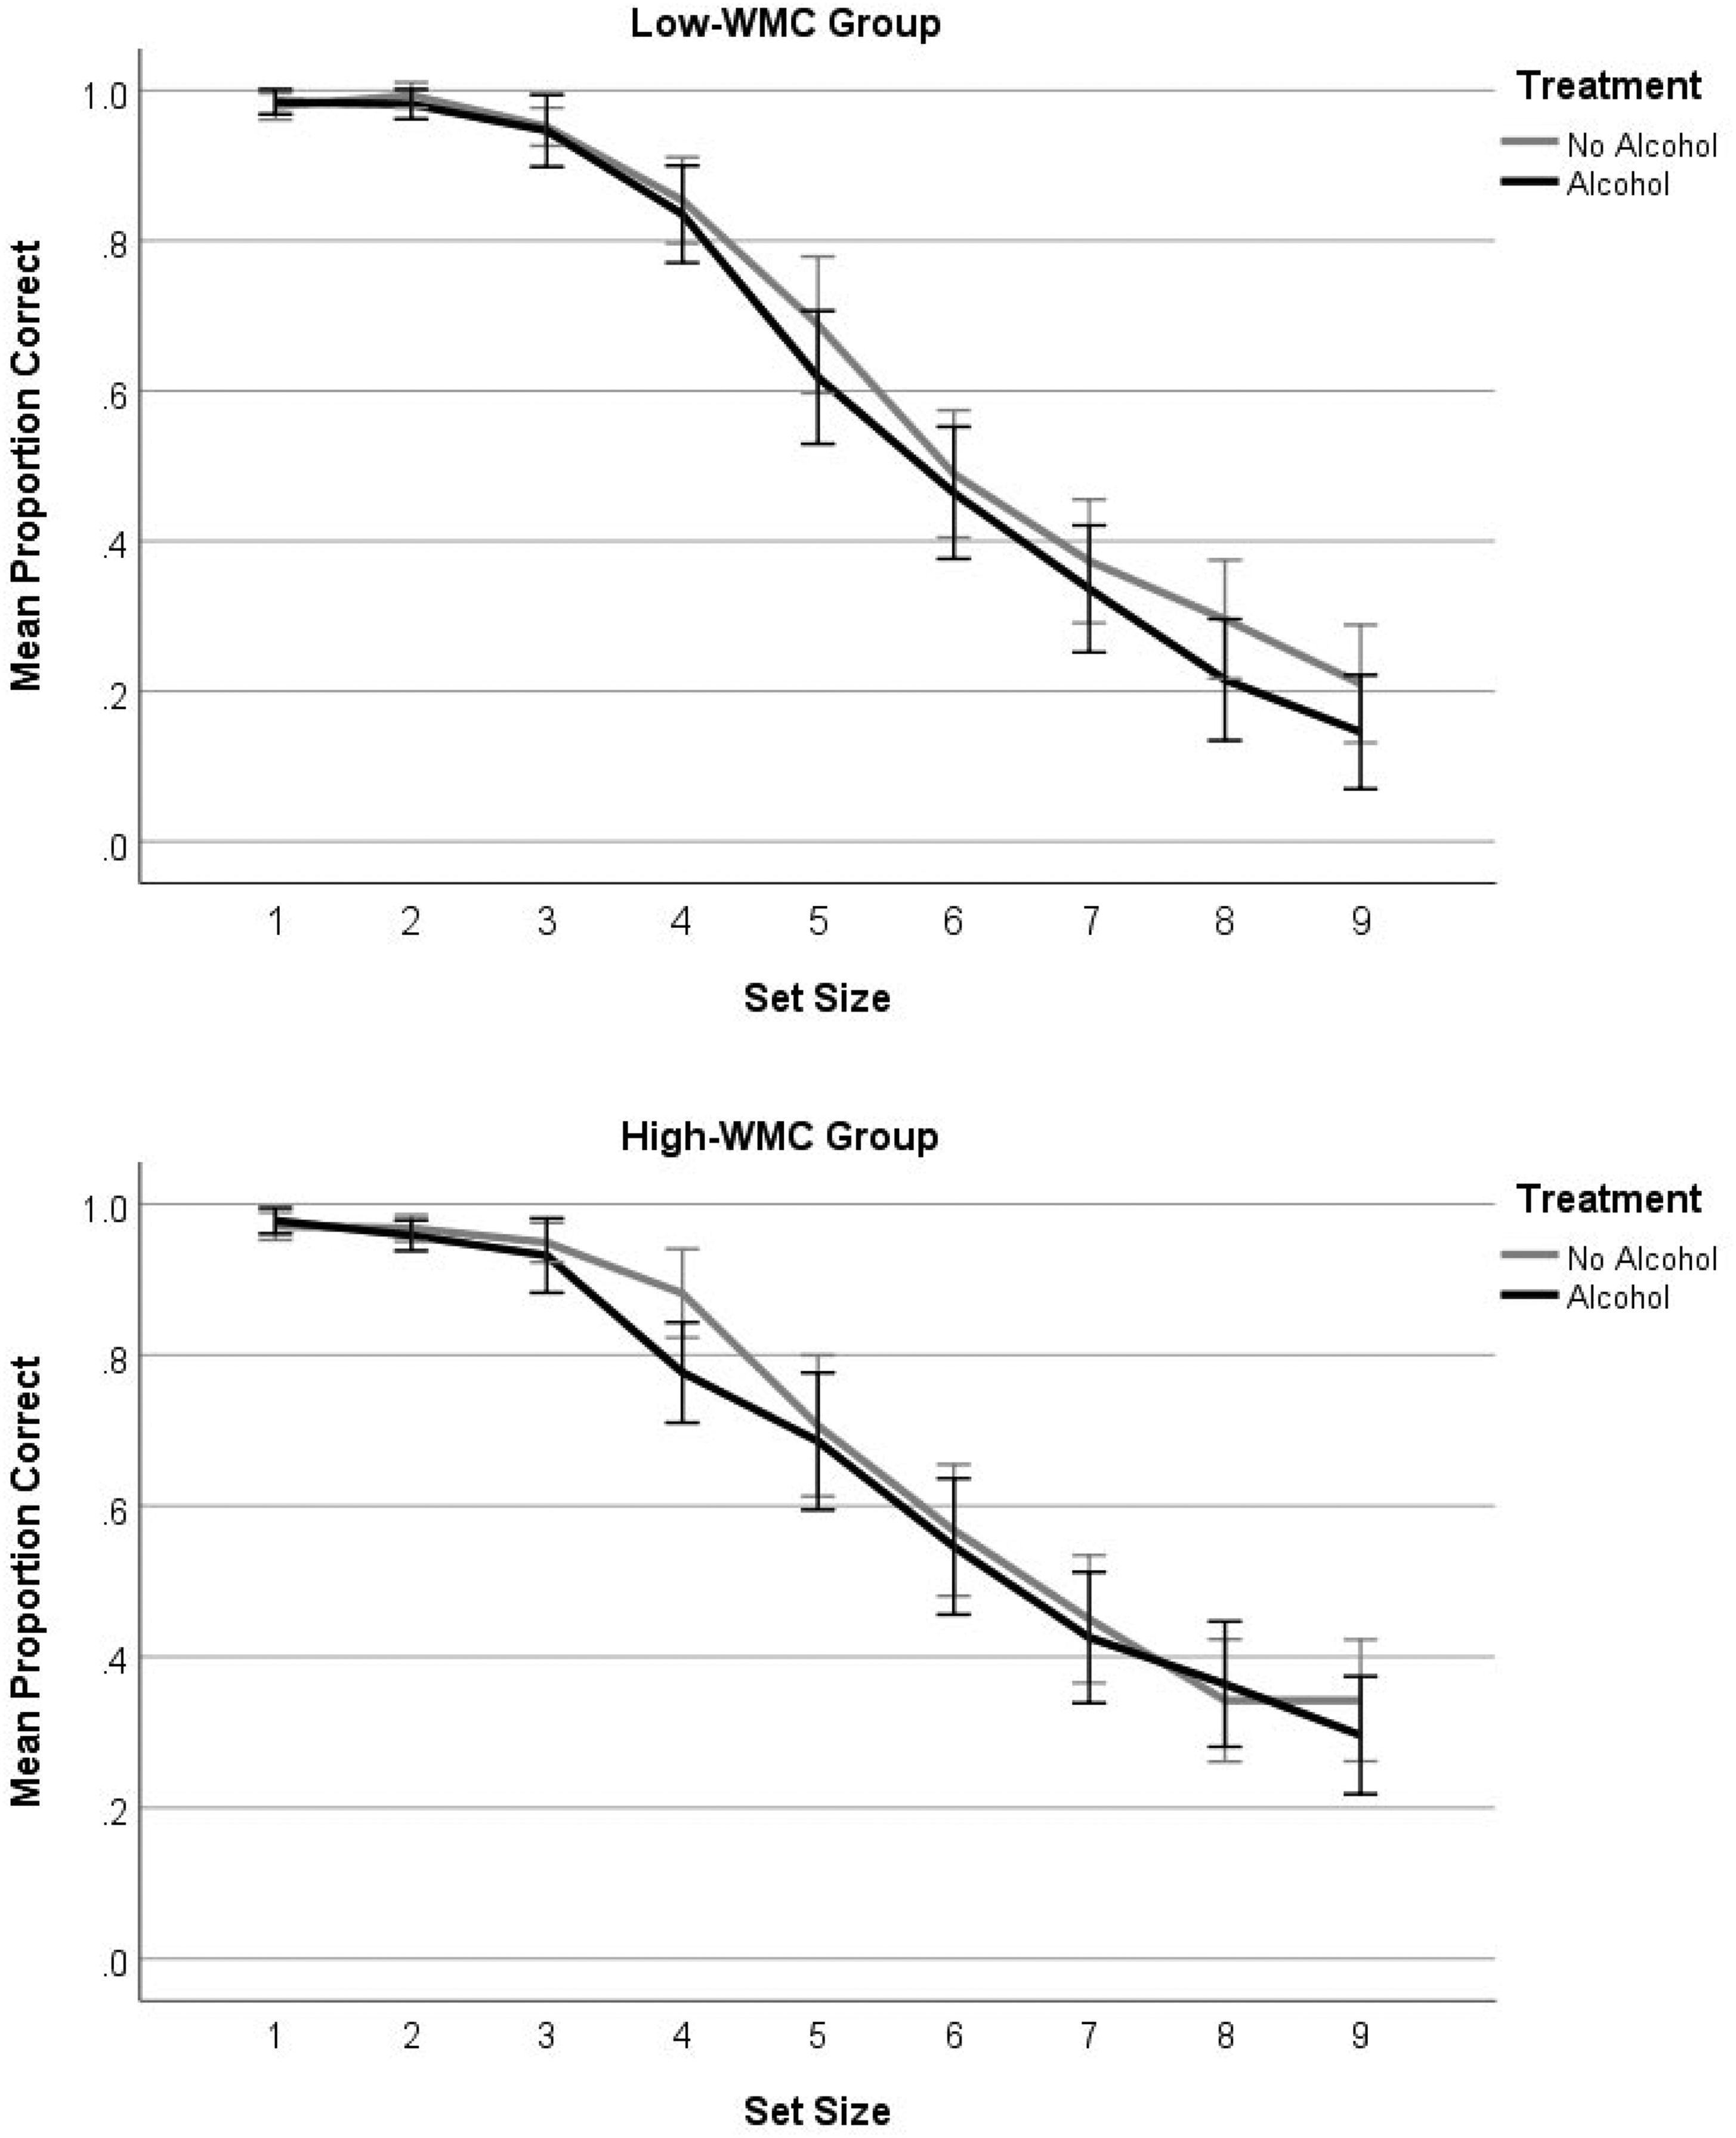
Mean proportion of correctly enumerated arrays as a function of alcohol treatment, working memory capacity, and set size. Error bars show 95% confidence intervals.
Using a median-split to convert OSPAN scores into a categorical WMC variable is not ideal as it involves a loss of statistical power and sensitivity. To address this limitation we ran correlation analyses on the accuracy data to explore the relationship between OSPAN scores, alcohol consumption, and set size. If a higher WMC offers protection against the cognitive resource sapping effects of alcohol and large sets require cognitive effort to enumerate, then we would expect stronger correlations between OSPAN and accuracy for larger sets following alcohol than in the sober condition, and this is what we observed. In the sober condition, there were no statistically significant correlations between OSPAN score and enumeration accuracy for any sets, but in the alcohol condition, OSPAN correlated strongly with accuracy for sets of size 6 (r = .398, p = .015), 7 (r = .426, p = .009), 8 (r = .432, p = .008), and 9 (r = .484, p = .002).
Enumeration Precision
As the accuracy data only indicate whether responses were correct or incorrect, we computed Weber fractions (Wf) to measure the magnitude of errors at each set size. This is simply the standard deviation of the perceived number of items reported on each trial of a given set size divided by the average number of items perceived across those trials (Moscoco et al., 2020). We entered the Wf data into a 2 (Alcohol Condition) × 2 (WMC) × 9 (Set Size) mixed ANOVA but found only a significant main of effect of alcohol treatment, F(1, 35) = 4.92, p = .033,
Enumeration Response Time
The standard response time effect for this task was observed, with fast and flat RTs at set size 1 to 3 followed by a sharply rising function for each additional item added to the array (see Figure 3). We expected RTs to be slowed by alcohol relative to sober performance and for this slowing effect to be more pronounced for larger sets and among the low-WMC group. Surprisingly, however, alcohol hastened response for larger sets, and this effect was larger for low- rather than high-WMC participants. A 2 (Alcohol Condition) × 2 (WMC) × 9 (Set Size) mixed ANOVA, confirmed a significant interaction between alcohol treatment and set size, F(5.50, 192.64) = 4.58, p < .001,
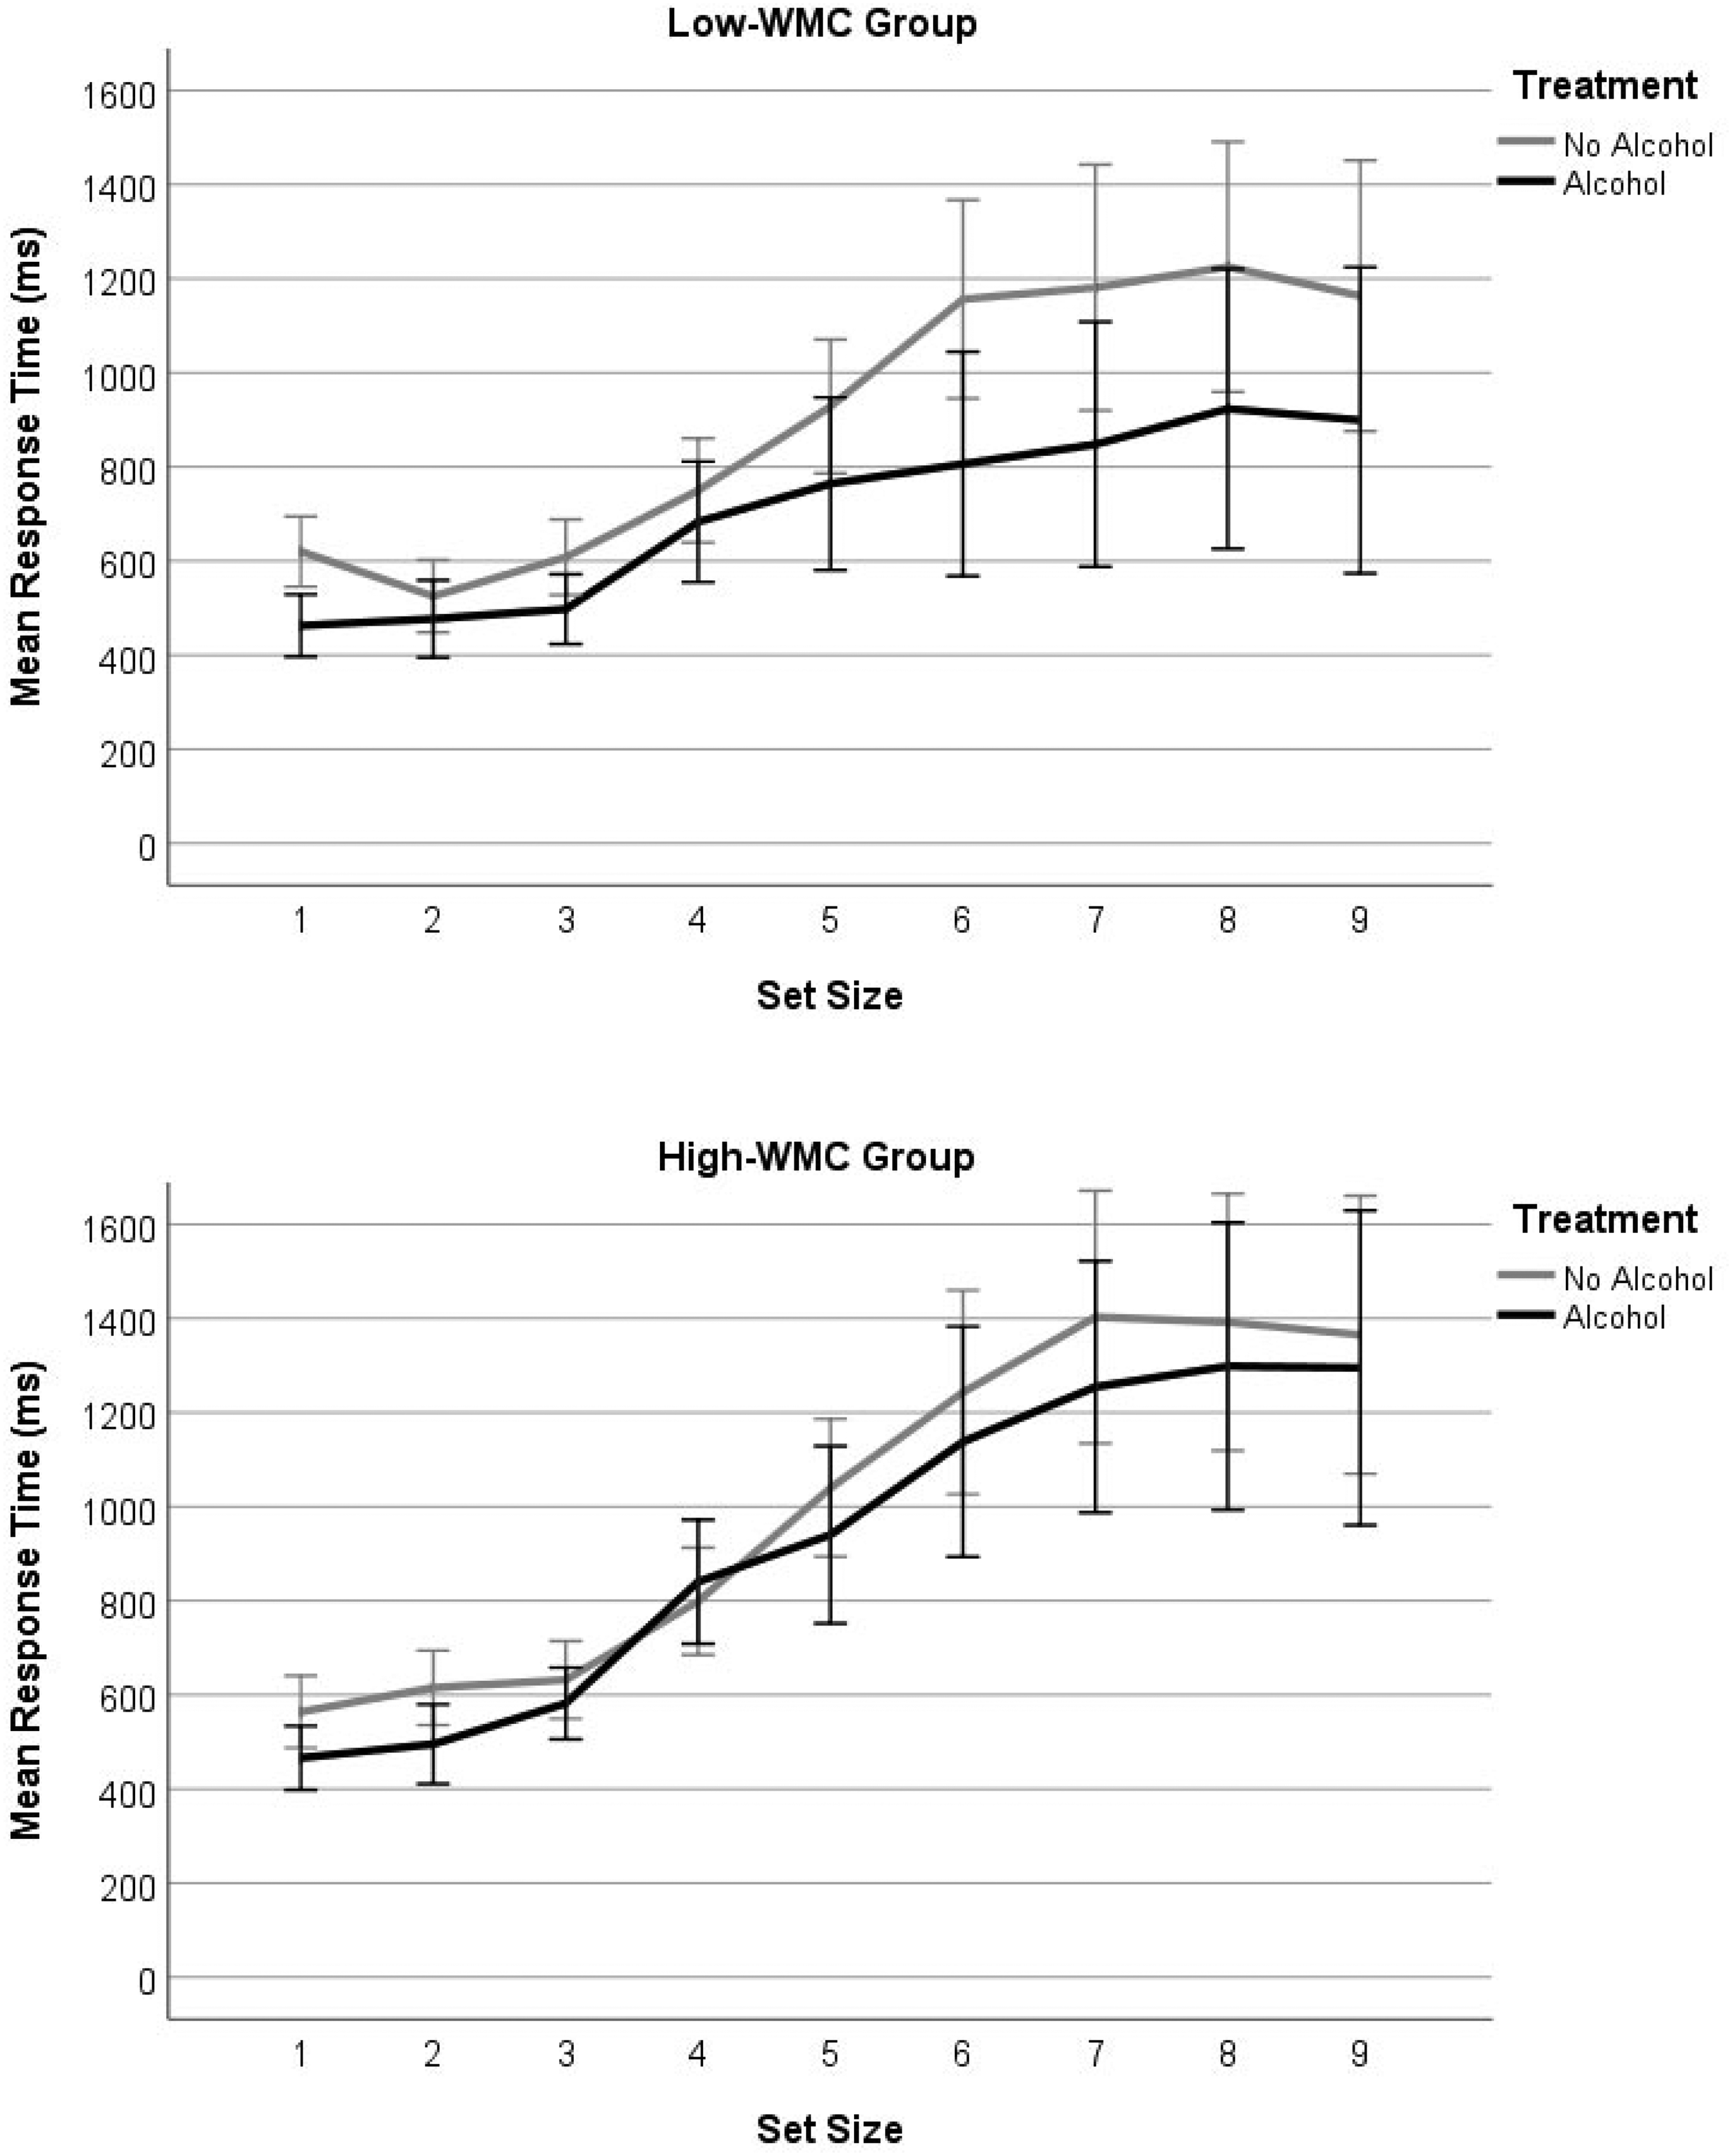
Mean reaction time for low- (upper panel) and high- (lower panel) WMC groups as a function of alcohol treatment and set size. Error bars show 95% confidence intervals.
As in the aforementioned accuracy analysis, we used individual OSPAN scores to examine the relationship between WMC (i.e., as a continuous variable), alcohol treatment, and set size. If larger sets require more cognitive effort and alcohol depletes cognitive resources, we should see stronger correlations between OSPAN and RTs for larger sets in the alcohol condition than in the sober condition. The large-set correlations in the alcohol condition were stronger than those of the sober condition, though only the correlation for set size 7 was significant (r = .328, p = .048).
Discussion
We explored the influence of acute alcohol consumption on cognitive and perceptual capacity by having participants perform an enumeration task sober and again following a vodka beverage. In line with AMT (Steele & Josephs, 1990) and evidence alcohol narrows the scope of visuospatial attention (Bayless & Harvey, 2017; Canto-Pereira et al., 2007; Harvey, 2016), we expected intoxication to reduce task accuracy and slow response times. To consider whether any drug deficits were due to a loss of cognitive rather than perceptual capacity, participants provided a sober OSPAN measure prior to the beverage treatment.
As expected, alcohol impaired performance with mean accuracy falling from 67% sober to 64% following a vodka drink. This is a small effect but caused by a mild state of intoxication (M BAC = 0.05%) lower on average than the current legal limit for driving in England and Wales (0.08% BAC). It also occurred after participants had completed the enumeration task in a sober state, practice which might otherwise have facilitated a second attempt. If alcohol had reduced only perceptual capacity it should, presumably, have disrupted the enumeration of sets in the subitising range 1 to 4. But accuracy for small sets was close to ceiling (see Figure 2) and alcohol did not slow responses to them (see Figure 3). The idea that it reduces perceptual capacity is therefore inconsistent with our findings, and we identify two earlier studies that also failed to support this hypothesis. Weissenborn and Duka (2003) found no effect of alcohol on pattern recognition, and Saults et al. (2007) found no effect of alcohol on the immediate recall of simultaneous visual arrays, tasks that should each require perceptual capacity.
That the present alcohol deficit emerged across larger sets suggests, instead, that it was a loss of cognitive capacity that weakened enumeration accuracy. Three aspects of our findings are consistent with this view. First, high-WMCs were better than low-WMCs at enumerating larger sets, underlining the importance of cognitive capacity for visual counting/number estimation beyond the subitising range. Second, although the interaction between alcohol, WMC and set size is not statistically significant, the trend in Figure 2 is of a more consistent alcohol deficit across the 5–9 set range among the low- rather than high-WMC group. Third, positive correlations between individual OSPAN scores and accuracy are significant only for larger sets and only when participants had consumed alcohol—conditions under which those with more cognitive capacity stand to gain.
Unfortunately, the response time data do not reinforce this view, which prevents us from drawing a firmer theoretical conclusion. Although reaction times were influenced by WMC and differentiate sober from intoxicated performance, they did not fall in a direction predicted by either the cognitive or perceptual theory. Alcohol was expected to slow reaction times, particularly for low-WMC participants, yet it hastened them, with low-WMCs showing the fastest responses of all. There are no relevant enumeration studies available for comparison, but alcohol response latencies have been studied across other perceptual and cognitive tasks. Zoethout et al. (2011) reviewed seventy studies published between 1980–2008 and found alcohol slowed responses in 53% of these and had no effect in the rest. Interestingly, however, Weissenborn and Duka (2003) found acute alcohol intoxication significantly shortened response latencies in the Tower of London task and a test of spatial recognition. They suggest that this reduced thinking time prior to responding reflects increased impulsivity under alcohol. The same may be said of our participants, but it is unclear why the effect was larger among the low-WMC group. It is possible that low-span participants lacked the ability to sustain attention on the task so, come the second attempt following alcohol, their patience may have waned producing a faster and more impulsive pattern of responses. Although tentative, this view is supported by previous studies revealing a strong association between reduced WMC, poorer cognitive control (including increased impulsivity and a reduced inhibition), and even the misuse of alcohol itself (e.g., Finn et al., 2002; Gunn & Finn, 2013, 2015; Hinson et al., 2003).
Future attempts to use the enumeration task to clarify the role of alcohol on perceptual and cognitive mechanisms should employ a counterbalanced alcohol treatment that precedes the first enumeration attempt for half the participants and the second attempt for the remainder. We also recommend a dual-task approach in which enumeration is performed concurrently with either a perceptual task or an orthogonal cognitive task. If alcohol drains perceptual rather than cognitive resources subitising should be worse with a simultaneous perceptual-perceptual task (e.g., object-tracking) than with a simultaneous cognitive task (e.g., serial recall). This alcohol challenge would shed much needed light on the mechanisms underpinning focal narrowing now demonstrated across numerous studies of visuospatial attention and memory (e.g., Bayless & Harvey, 2017; Canto-Pereira et al., 2007; Clifasefi et al., 2006; Harvey, 2014, 2016; Harvey et al., 2013, 2018; Jaffe et al., 2019; Schreiber Compo et al., 2011).
Footnotes
Acknowledgement
We thank Paul Waby for programming assistance.
Declaration of Conflicting Interests
The author(s) declared no potential conflicts of interest with respect to the research, authorship, and/or publication of this article.
Funding
The author(s) received no financial support for the research, authorship, and/or publication of this article.