
Abstract
Previous studies show that pilots sometimes make roll reversal errors (RREs) when responding to the aircraft bank angle shown on the attitude indicator (AI). This is suggestive of a perceptual ambiguity in the AI. In the current study, we investigated whether expectation contributes to such misperception. Twenty nonpilots performed tasks in a fixed-base flight simulator. Their expectation about the bank angle was manipulated with a flying task using outside view only. When flying at a bank angle, the outside view disappeared, a moving-horizon type AI was shown, and participants had to roll the wings level, trusting the AI. The AI often matched the previously flown turn. However, in some runs, it showed an opposite bank direction (Opposite condition), which was hypothesized to facilitate a misperception. In some other runs, it showed level flight (Level condition), which should not facilitate this. In a second session, participants rolled wings level without preceding flying task (Baseline condition). Participants made 11.2 times more RREs in the Opposite condition (75% error rate) compared to Baseline condition (6.7%), and 2.5 times more compared to the Level condition (30%). This indicates that RREs were in many cases caused by expectation-induced misperception of the AI bank angle.
Introduction
It has previously been shown that both novice and experienced pilots sometimes make errors when quickly reading the direction of the aircraft bank angle (i.e., the roll angle with respect to the horizon) from the conventional, moving-horizon (or inside-out) attitude indicator (AI; see Figure 1; also see a review by Previc & Ercoline, 1999). This can lead to a roll control input towards the incorrect side, which is known as a roll reversal error (RRE). In fixed-based simulators, there was an RRE incidence of 3.9% to 8.7% for pilots (Beringer, Williges, & Roscoe, 1975; Müller, Sadovitch, & Manzey, 2018). Pilots performed better in in-flight experiments (1.5%–3.1%; Beringer et al., 1975; Hasbrook & Rasmussen, 1973), although these error rates are still high from a safety perspective. Nonpilots perform typically worse than pilots, both in fixed-base simulators (15%–20% RREs; Ince, Williges, & Roscoe, 1975; Müller et al., 2018) and in-flight (21.9%; Roscoe & Williges, 1975).
In each of these studies, error rates were obtained in baseline conditions, from participants who responded to a static bank situation displayed on a moving-horizon AI, without additional instruments besides the Primary Flight Display, and without additional tasks (except for a tapping task to measure workload in Roscoe & Williges, 1975). Performance in these baseline conditions was then compared with that in other conditions, featuring, for instance, different types of displays. In each experiment, the researchers attempted to prevent participant expectations of the bank angle direction. An equal number of left and right turns were presented in a randomized order. In the in-flight studies, additional measures were taken in order to account for possible effects of motion cues. Beringer et al. (1975) had the safety pilot roll the aircraft at an unspecified rate to a bank angle after blinding the participants. According to the authors, inadvertent motion cues sometimes caused incorrect assumptions about the bank angle direction, although the incidence and effect of such assumptions on RREs was not reported. Hasbrook and Rasmussen (1973) used equal numbers of runs with coordinated turns, slipping turns, and skidding turns (adding sideways motion cues), to confuse the participants about the direction of the bank angle. Whether this had an effect on expectation and RREs is not reported. Roscoe and Williges (1975) reported that the angular accelerations used to enter the turn were “with a few exceptions subliminal” (p. 348). However, again no information on expectation and its effect on RREs was reported.
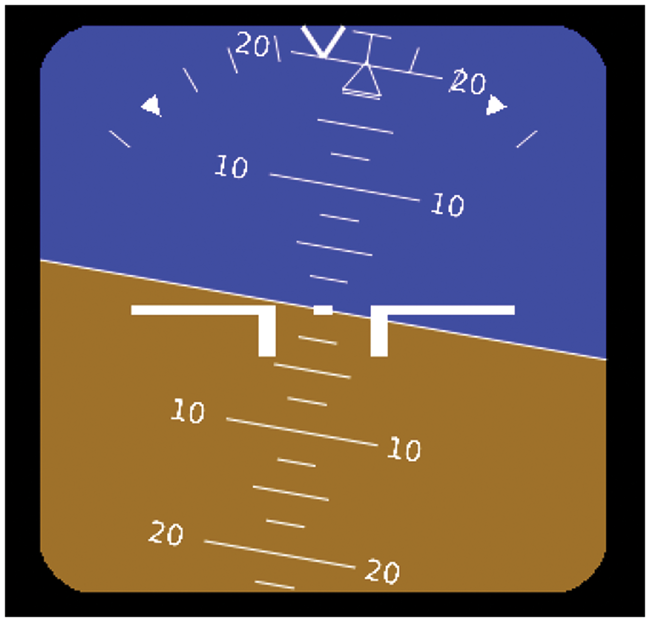
The moving-horizon type AI indicating an aircraft turning to the left, tilting the horizon to the right. The aircraft symbol (white wings) remains static in the center of the display; the horizon rotates and moves up with the aircraft roll and pitch angles, respectively. The figure shows the display format used in the experiment, which is a simplified version of the AI used in large jet airliners.Note: Please refer to the online version of the article to view the figures in colour.
A suggested cause of RREs is that the bank angle indication on the AI is somewhat ambiguous, which may cause pilots to mistake the horizon symbol for the aircraft symbol and attempt to control the horizon symbol as if it was the aircraft symbol (i.e., a horizon control reversal; Johnson & Roscoe, 1972; Roscoe, 2004; Wickens, 2003). The AI pictured in Figure 1, showing an aircraft turning to the left, would then be perceived as indicating a turn to the right. The standard AI adheres to the display design principle of “pictorial realism,” as the AI horizon is pictured to reflect the real horizon as seen from the cockpit window. But it does not adhere to the design principle of “the moving part”, which states that people prefer the moving part of a display to move in the same direction as control inputs. In the AI, the horizon symbol is the moving part, and it rotates into the opposite direction of the column or stick roll control inputs (Johnson & Roscoe, 1972; Wickens, 2003). In addition, the horizon symbol is clearly distinguishable, it occupies the same space as the aircraft symbol, and the horizon line is not very clearly being overlapped by the aircraft symbol, as both symbols consist of lines instead of solid shapes. These factors are hypothesized to hinder the correct interpretation of the horizon symbol being the background (Johnson & Roscoe, 1972). Another explanation for the occurrence of errors is that objects in close proximity (e.g., the AI) are processed by a different neurological system than those far away (e.g., the real horizon; see Previc & Ercoline, 1999). Thus, although pictorial realism is regarded to be generally a good principle for display design (Roscoe, 1968), designing the AI to represent the outside view may not be optimal.
As mentioned earlier, previous tests of RRE incidence were performed while pilots’ expectations about the bank angle direction were prevented as much as possible. However, when a pilot is spatially disoriented, an incorrect expectation could be present. The most frequently reported form of spatial disorientation is “the leans” (Holmes et al., 2003), which is an erroneous perception of the aircraft bank angle (Previc & Ercoline, 2004). Spatial disorientation is a persistent hazard in aviation safety and is estimated to be a factor in 12% of loss of control accidents in commercial aviation between 1996 and 2010 (Belcastro et al., 2017). It also contributes to about 30% of all fatal accidents in military aviation (Gibb, Ercoline, & Scharff, 2011). Accident reports suggest that spatial disorientation may have induced misperception of the AI in the accidents of Flash Airlines Flight 604 (Ministry of Civil Aviation, 2004), Kenya Airways flight 5Y-KYA (Cameroon Civil Aviation Authority, 2010), and Crossair flight 498 (Aircraft Accident Investigation Bureau, 2002).
If spatial disorientation causes an expected bank angle that is opposite to the actual bank angle, the expectation matches with the tilt of the artificial horizon and not with that of the aircraft symbol, which may contribute to the occurrence of an RRE. It is known that perception can be modulated by expectations and beliefs, especially when the presented information is ambiguous (see Vetter & Newen, 2014). For instance, an object is judged as being more red if it has the shape of a heart than if it has the shape of a square (Delk & Fillenbaum, 1965). Observers also reported seeing shapes in white noise, or a smile on a neutral face, when experimenters told them that this information was present (Gosselin & Schyns, 2003). And prior knowledge of the dual interpretability of figures made it more likely that participants reported both interpretations (Girgus, Rock, & Egatz, 1977). According to Bayesian statistical decision theory (see Clark, 2013; Knill, Kersten, & Yuille, 1996; Maloney & Zhang, 2010), the brain uses presuppositions to create a prediction of what the incoming sensory information likely means, which influences low-level perceptual processing.
The current study was aimed to investigate the effect of incongruent expectation on the perception of the AI in a ground-based flight simulator. The participants were nonpilots, and the flight simulator did not have a motion platform, as this was a first step toward better understanding the contribution of expectation on perception of a possibly ambiguous display system. We hypothesized that participants would be more vulnerable to making horizon control reversals when the expected aircraft bank angle direction matched with the AI horizon tilt angle direction. In addition, we expected that responding correctly while having a mismatching expectation would take longer than when there was no expectation. Different conditions were included to test the occurrence of spontaneous misperceptions (without expectation), misperceptions due to the expectation, or spontaneous responses (due to an expectation but not due to a misperception).
Method
Participants
Participants included 20 nonpilots who were invited from the Faculty of Aerospace Engineering at the Delft University of Technology (18 men and 2 women; mean age = 25.0 years, standard deviation [SD] = 3.2). Participants were right-handed, reported no vestibular issues, had normal or corrected-to-normal vision, and reported being well-rested. Six participants had controlled a fixed-wing aircraft (in Visual Flight Rules) on some occasions in flight lessons or demonstration flights (mean = 3.5 occasions, maximum = 6 occasions) and thus had experience with controlling an aircraft bank angle. The participants rated experience with fixed-base simulated flying on average at 1.9 (around “some”), median = 2, SD = 1.6, on a 1 (very little) to 5 (very much) point Likert-type scale. This study complied with the tenets of the Declaration of Helsinki, the experiment was approved by the research ethics review board of the university and informed consent was obtained from each participant.
Apparatus
The experiment was performed in a fixed-base simulator at the Faculty of Aerospace Engineering in the Delft University of Technology (see Figure 2). Participants were seated in an adjustable aircraft seat, in front of a (head-down) liquid crystal display monitor presenting the AI (500 × 500 pixels; 14 × 14 cm; 4.4 degrees visual angle; see Figure 1 for a screenshot) and no other instruments. They controlled a control-loaded (i.e., providing force feedback) hydraulic side stick with their right hand, with a length of 9 cm, and 30 degrees roll and 22 degrees pitch excursion space. Three digital light processing projectors presented the outside view (head-up) rendered with FlightGear on three screens. This resulted in a 180 degrees field of view. The sun and moon were not visible. The aircraft model had a fixed speed of 120 knots, with controllable pitch and roll rate, whereas yaw rate was coupled to the bank angle. No rudder was used. The simulator data were logged at 100 Hz.
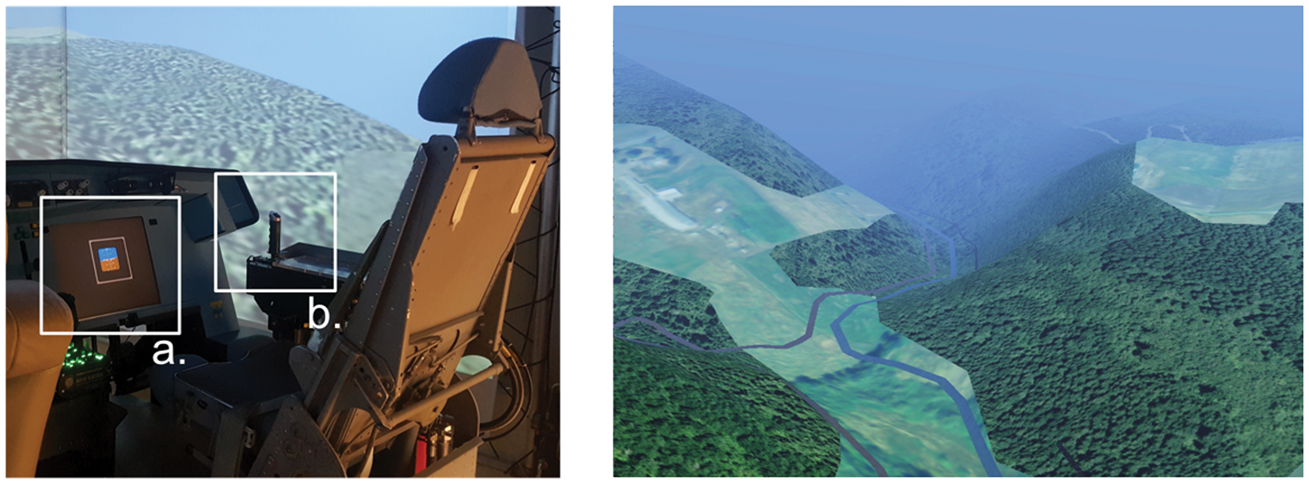
The simulator (left) with the AI on the head-down display (a), the sidestick on the right-hand side (b), and the head-up visual projection of two of the three screens in the background. The outside view (right), of which only the front screen is shown.Note: Please refer to the online version of the article to view the figures in colour.
Procedure
After a briefing, participants familiarized themselves with the simulator and the AI by flying a winding trajectory (indicated by a river) for 3 minutes while both the outside view and the AI were visible. Halfway in, participants were reminded to use the AI. They then performed two test sessions in a counterbalanced order: one session without a flying task before each AI presentation (Baseline condition, no manipulated expectation), and one session with a flying task before each AI presentation (other conditions, with manipulated expectation).
Tasks and Conditions
The session with a flying task consisted of 22 runs preceded by 2 practice runs. The location and characteristics of each run are listed in the Appendix. The order of events in each of these runs is graphically presented in Figure 3. In each run, the participant was flying along a winding trajectory while the AI was not shown. After approximately 1 minute, when in a turn, the experimenter instructed the participant to “hold steady,” that is, maintain the flown bank angle by moving the stick to neutral. When flying steady, as checked by the experimenter, the outside view was removed (turned black). After 2 seconds, the AI was shown, and the participant was to roll the wings level based on the AI. The shown AI could exactly match the previously shown turn (Matching condition), show a bank angle in the opposite direction (Opposite condition), or show level flight (Level condition, in which case no input was required).
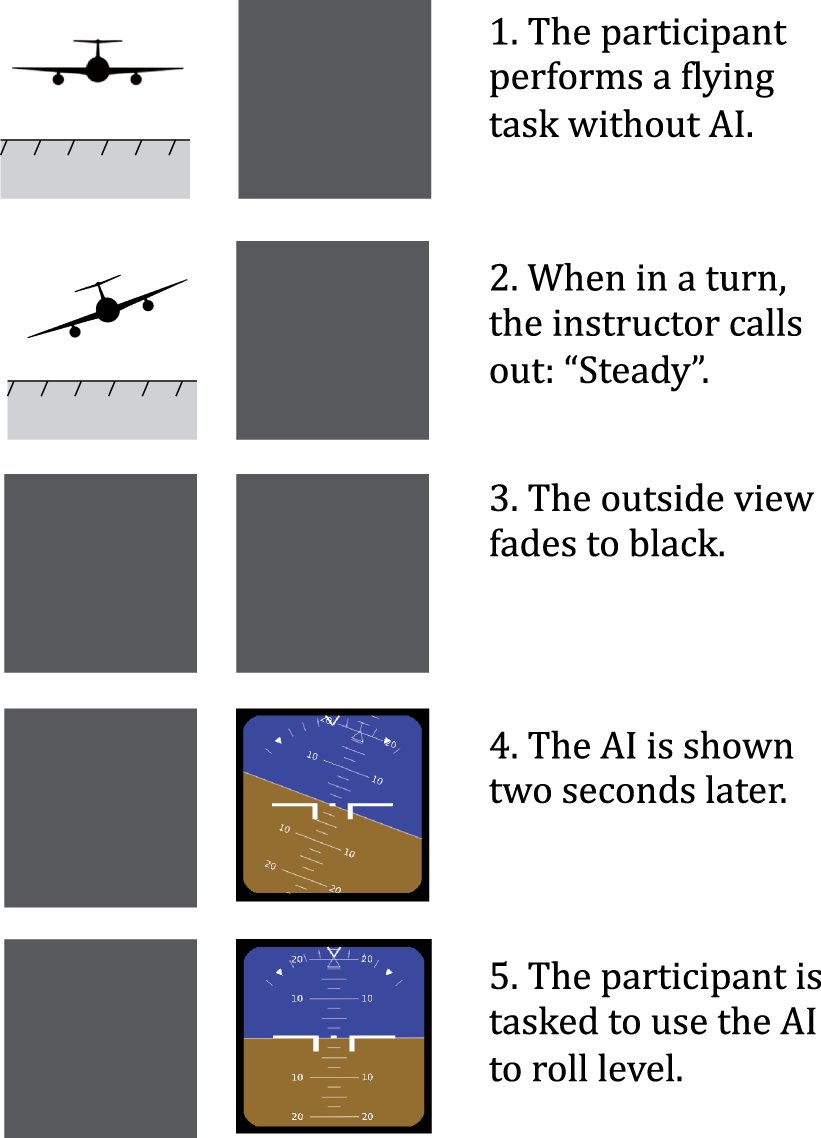
A timeline of the events in each run in the session with the flying task. The aircraft is pictured from behind.Note: Please refer to the online version of the article to view the figures in colour.
Several measures were taken to improve the participants’ involvement in the flying task and to instill a strong spatial model of the bank angle in the simulated world. The participants flew in a challenging mountainous area with poor visibility (2,000 meter, see Figure 2). The trajectory in each run was different (although each participant performed the same general flights), and the moment of the “steady” command varied between the runs (mean = 60 seconds, SD = 17 seconds). The exact bank angles at which participants flew when the “steady” command was given are reported in the results. Until the outside view disappeared, small disturbances (“gusts”) lasting for 0.5 seconds were added to or subtracted from the roll rate and pitch rate with 1 to 5-second random time intervals. These disturbances stopped when the outside view disappeared, to make sure that participants responded to a steady AI.
The time of 2 seconds between presentation of the outside view and the AI, as well as the hilly landscape and poor visibility, were used to reduce the possibility that iconic memory of the horizon affected the responses, instead of the assumption of the bank angle flown in the simulated environment.
Participants were instructed to immediately react to the shown AI by rolling wings level, in order to offset their increased vigilance due to the experimental setting. No instructions were given on the use of specific interpretation strategies of the AI. It was emphasized that they should trust the AI and wait for it to appear before responding. When rolling to level, pitch angle was to be ignored by participants. To motivate participants to respond quickly and intuitively, their response time (time from AI presentation to steady level flight) was given as feedback after each run.
In 18 of the 22 runs, the AI bank angle matched the bank angle exactly as flown (Matching condition). These runs were used as “filler runs” to set up an expectation of a normal situation. However, in 4 of the 18 runs, the AI was manipulated to mismatch with the actually flown turn. In the Opposite condition (two runs), the AI indicated a bank angle of 20 degrees into the opposite direction of the preceding turn (Figure 4). In the Level condition (two runs), the AI indicated level flight (Figure 4). The number of runs in these test conditions was kept low, to increase the element of surprise and to reduce potential effects of changes in response strategy. These 4 runs were distributed semirandomly over the total 22 runs, with the following rules: (a) One run of each test condition occurred in the first and one in the second half of the 22 runs. (b) The runs of the test conditions were always preceded by at least three matching filler runs (with at least one of these runs ending left and one right). (c) The order of the four test runs was counterbalanced between participants. (d) The final run was a test run. There were an equal number of runs ending with a left and right turn in the Matching, Level, and Opposite conditions.
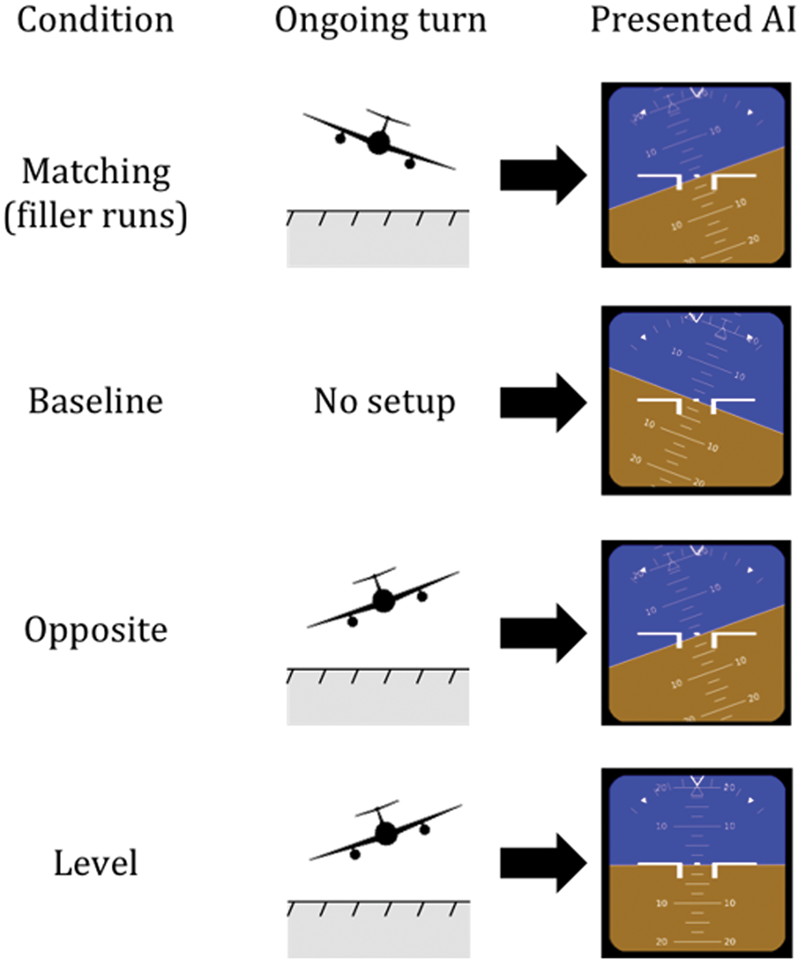
Examples of situations and corresponding AI configurations in each condition. The aircraft is pictured from behind.Note: Please refer to the online version of the article to view the figures in colour.
The session without a flying task before AI presentation (Baseline condition) consisted of 18 runs, with 5 practice runs at the start. These runs consisted only of the presentation of the AI (4–5 in Figure 3). An equal number of runs in this condition were presented with bank angles of 10, 20, and 30 degrees left and right, and pitch angles of 0, 5, and –5 degrees. The runs with 20 and 30 degrees bank were later excluded from analysis, leaving six runs. The pitch angle variations were included in the Baseline condition since these can also be expected to occur in the other test conditions. The order of the runs was randomized. There was approximately 5 to 10 seconds of time in between the runs.
Simulator Sickness
Because visual flow can induce simulator sickness, which can in turn influence participant responses, participants rated their simulator sickness symptoms on the 11-point Misery Scale (Wertheim et al., 1998) halfway into the session with the flying task and at the end of this session. A participant was excluded from analysis (and a new one was recruited) if they rated their simulator sickness 4 (i.e., medium symptoms but no nausea) or higher at one of these moments.
Dependent Measures
Outcomes were compared between the Baseline, Opposite, and Level conditions. The Matching condition could not be used to either confirm or disconfirm our hypotheses. Nevertheless, the results in this condition will be reported, as it is interesting to see whether a matching expectation can also prevent errors from occurring.
Error rate
An input was registered if a stick input in the roll axis exceeded 1.5 degrees. In the Level condition, an error was registered if an input in the first 2.0 seconds following the AI presentation caused a roll rotation away from level, and into the opposite direction of the final turn in the flying task. The error rate was the ratio of the number of errors to the total number of runs in each condition (i.e., 2 runs in Opposite and Level, and 6 in Baseline).
Response time
After an erroneous input was detected in the data (see, Error rate), the start of this input was defined as the moment the stick started moving (>.06 degrees/second or .001 radians/second) toward the direction of this input. The time from presentation of the AI to the start of the first input was the response time. Only the response times of correct responses were measured. The Level condition cannot be included in this comparison because the correct response in this condition is to make no input.
Learning effect
Using more than one run per mismatching condition increases statistical power, but the surprise effect in the second run may be weaker. Therefore, we tested whether making an error was less likely in the second run of the Level and Opposite conditions.
Following the flying task, participants were also asked whether they noticed “if the AI was sometimes incorrect”. If they had noticed this, they rated whether they changed their response strategy because of this on a 5-point Likert-type scale ranging from 1 (not at all) to 5 (very much).
Run parameters
To test whether there were inadvertent systematic differences between the conditions, the pitch angle, absolute bank angle, and absolute roll rate at AI presentation were compared between the test conditions. Furthermore, the absolute bank angle when the “steady” command was given was compared between the Opposite and Level conditions.
Data Analysis
Nonparametric tests for ordinal data were used to analyze error rates, as the Opposite and Level conditions featured three performance categories (0%, 50%, or 100% error rate). The main effect of condition (Baseline, Opposite, and Level) on error rates was tested using a Friedman test, and post-hoc tests were performed with Wilcoxon signed-rank with Holm–Bonferroni correction.
The response time of correct responses was, after checking for normality with Shapiro–Wilk tests, compared between the Opposite and Baseline conditions with a paired-samples t test.
It was checked whether the run parameters were different between the conditions using one-sample (if compared with a set value) or paired-samples t tests without correcting for multiple comparisons.
The likelihood of whether an error was made was compared between the first run and the second run of the Level and Opposite conditions with Pearson χ2 tests.
Results
Performance Example
Figure 5 shows the control inputs and the bank angle of an RRE in the Opposite condition. At t = 0 seconds, the experimenter activated an event and the outside visibility started to decrease until it was zero at t = 1 second. The participant was flying steadily at a 20 degrees left bank. Immediately before t = 2 seconds, unnoticeable for the participant, the bank angle was adjusted from 20 degrees left to 10 degrees right. At t = 2 seconds, the AI was presented, showing the new bank angle. The participant then responded by increasing the bank angle to the right before rolling back to level.
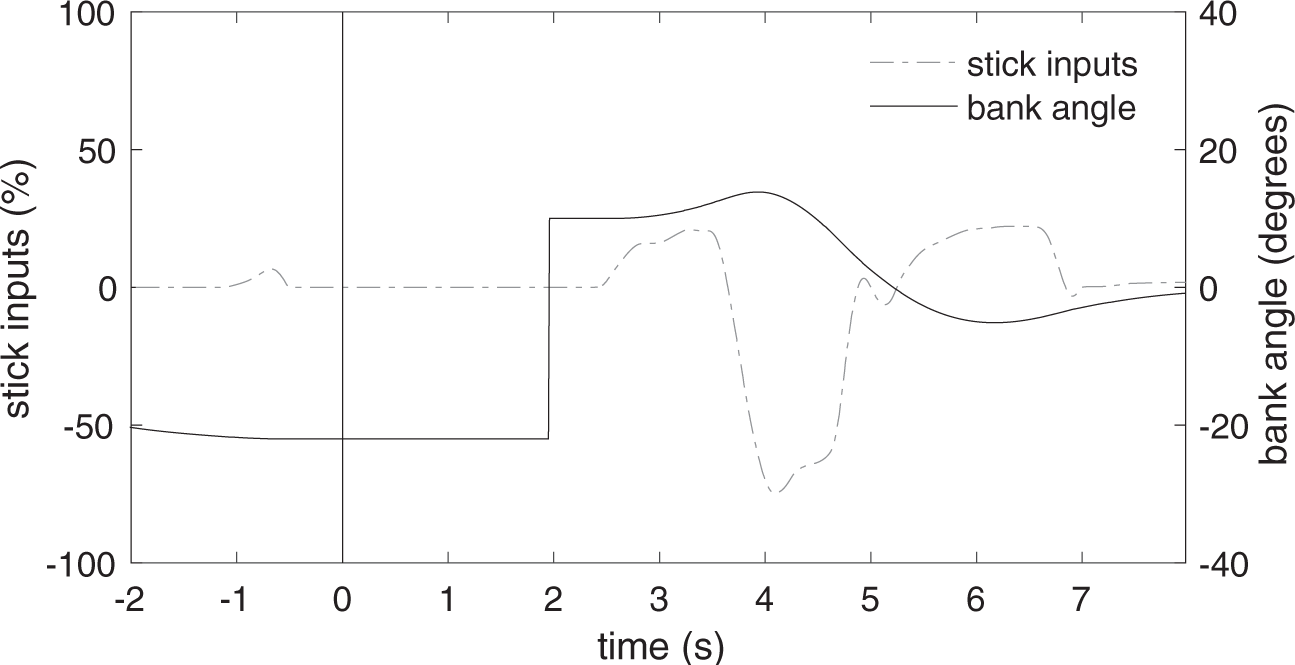
Stick inputs and bank angle (AI and aircraft model) in an example of an RRE in the Opposite condition. See the text for description.
Error Rate
The Error rates in all conditions are visualized in Figure 6 and are listed in Table 1. There was a significant main effect of condition on error rate, χ2(2,20) = 28.09, p < .001. The error rate was significantly higher in the Opposite condition compared to the Baseline condition (11.2 times as high), Z = 3.96, p < .001, and the Level condition (2.5 times as high), Z = 3.22, p = .001. All participants made at least one RRE (50%) in the two runs of the Opposite condition. There were also significantly more errors in the Level condition than in the Baseline condition, Z = 2.10, p = .035.
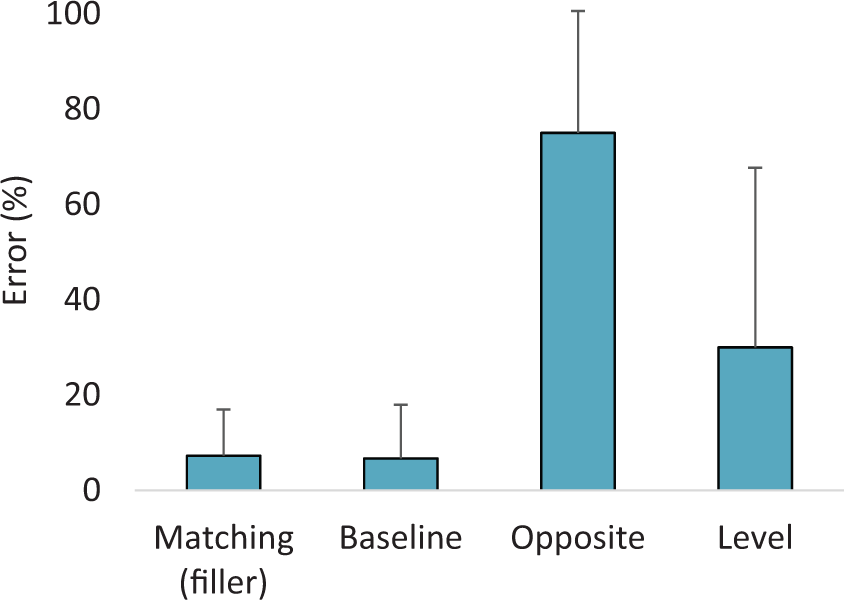
The mean error rates with standard deviations in the four conditions.Note: Please refer to the online version of the article to view the figures in colour.
Means and Standard Deviations of the Performance Variables and the Run Parameters.
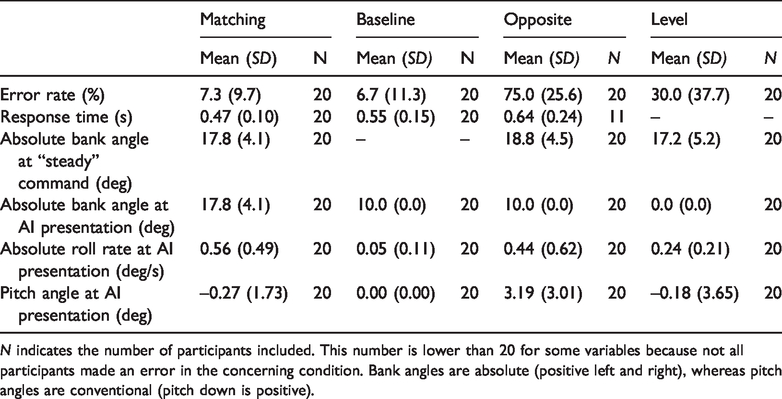
N indicates the number of participants included. This number is lower than 20 for some variables because not all participants made an error in the concerning condition. Bank angles are absolute (positive left and right), whereas pitch angles are conventional (pitch down is positive).
Response Time
There were 11 valid pairs to compare between the Opposite and Baseline conditions. The data in the Opposite condition as well as in the Baseline condition were not normally distributed, W(11) = .820, p = .017 and W(11) = .785, p = .006, respectively. Therefore, a Wilcoxon signed-rank test was used for nonparametric data. It indicated that the mean response time of correct responses was significantly longer in the Opposite condition, median = .64 seconds, than in the Baseline condition, median = .48 seconds, Z(10) = -2.05, p = .041.
Learning Effect
Participants were more likely to make an error in the first run compared to the second run in the Level condition (40% vs. 20%) and Opposite condition (80% vs. 65%); however, these differences did not reach significance, χ2 = 2.55, p = .110 and χ2 = 2.69, p = .101, respectively. Eighteen (90%) participants indicated that they noticed that the AI was sometimes different from the preceding turn. These participants rated the extent to which they changed their response strategy on average with 2.1, median = 2, SD = 1.2, on the 5-point scale, which is around very little. Reported changes in strategy included waiting a moment before responding, and not assuming a roll direction of the AI. The two participants who had not noticed the mismatches reported that they had mentally “decoupled” the flying task from the recovery task.
Run Parameters
There was a small roll rate present when the AI was shown after the flying task, meaning that the bank angle was not perfectly stable (see Table 1). Thus, there was a significant difference between the mean roll rate in the Baseline condition and that in the Opposite, t(19) = 3.14, p = .005, and Level conditions, t(19) = 5.02, p < .001. The mean pitch angle at AI presentation differed significantly between the Baseline and Opposite conditions, t(19) = 4.75, p < .001, but not between the Baseline and Level conditions. There was no significant difference between the Opposite and Level conditions in absolute bank angle when the “steady” command was given.
Simulator Sickness
No participants were excluded due to simulator sickness. Sickness symptoms were rated on average at .6, SD = .8, halfway in, and at 1.1, SD = .9, at the end of the session with the flying task. The maximum score was 3 (i.e., some symptoms but no nausea).
Discussion
The results of the Level and Opposite conditions show that RREs occur at much higher rates than previously known, when an incongruent expectation is present. Our Baseline condition, which did not involve a flying task to induce an expectation, produced an RRE rate of 6.7%. This is somewhat lower, but still in the same order of magnitude as the 15%–20% found in nonpilots in other studies (Ince et al., 1975; Müller et al., 2018). In contrast, the error rates in the Level (i.e., 30%) and Opposite conditions (i.e., 75%) were, respectively, 4.5 and 11.2 times higher than in the Baseline condition.
The observation that the error rate was significantly higher in the Level condition than in the Baseline condition suggests that participants sometimes responded before truly perceiving the AI. However, when the expected direction of bank matched with a horizon control reversal (i.e., confusing the aircraft and horizon symbols; Opposite condition only), 2.5 times more errors occurred than in the Level condition. This indicates that a large number of RREs in the Opposite condition were due to misperception of the AI. It therefore seems that the manipulated expectation served as a prior, influencing the perception of the AI. This is in line with current theories which state that lower level perception is modulated by cognition (Clark, 2013; Knill et al., 1996; Maloney & Zhang, 2010; Vetter & Newen, 2014).
Participants also took longer to make correct inputs in the Opposite condition than in the Baseline condition. This suggests that with an incongruent expectation (Opposite condition) participants required more time to collect information before giving a correct response (see also, Summerfield & Egner, 2009). Another interesting observation is that participants still made 7% RREs in the “matching” filler runs, showing that a matching expectation did not always prevent an RRE.
Although there are important differences between simulated flight and real flight, our results suggest that the RRE rates previously reported in experiments with pilots (1.5–3.1% in-flight; Beringer et al., 1975; Hasbrook & Rasmussen, 1973) are likely lower than RRE rates in conditions of spatial disorientation. However, several factors may safeguard pilots from making RREs, such as experience with using the AI, additional knowledge (e.g., about spatial disorientation) and the use of different response strategies (e.g., mapping oneself onto the aircraft icon; see, e.g., Federal Aviation Administration, 2012, pp. 8–5). In contrast to pilot training, participants did not receive specific instructions on how to use and interpret the AI. These differences make it problematic to extrapolate the current findings with nonpilots to pilots. Nevertheless, the previous studies with pilots show that they are not impervious to making RREs, even though they make fewer errors than nonpilots. Further research is needed to determine which strategies are most effective when pilots need to correct incorrect expectations.
Besides the use of nonpilots, there were some other limitations to the current study. The incongruent expectation was set up in an artificial manner, so that responses could be accurately measured. There were no vestibular, tactile, or proprioceptive motion cues, as there would be in-flight. Thus, care should be taken to generalize the current results to in-flight performance. The design was aimed to keep the participants’ attentional focus as natural as possible, which caused there to be slight variations between the stimuli in each run. For instance, there were small but significant roll rates present in the Opposite and Level conditions, but not in the Baseline condition. The number of test runs in the Opposite and Level conditions was deliberately kept low compared to the matching “filler runs”, to ensure that participants were still surprised in the second Opposite or Level run. Even though 18 of the 20 participants reported after the experiment that they became aware that the AI did not always match with their expectation, we found no significant decrease in errors in the second run of these conditions. Thus, it seems that perhaps more runs with a mismatch could be included in future experiments, provided that the task is to respond immediately, to offset a potential increase in vigilance in later runs.
The results of this study show that incongruent expectation increases the probability of a false perception of the ambiguous moving-horizon type AI, resulting in about eleven times more RREs compared to the Baseline condition without prior expectation. Further research is needed to test whether misperceptions due to expectation are also an underlying issue of RREs which occur in pilots. And, if so, whether certain response strategies or display aides (e.g., Ewbank, Mumaw, & Snow, 2016) are effective in preventing RREs in these conditions. There were indications that more time was needed to make a correct input when incongruent expectation was present, confirming the notion that it is wise to “look twice” or cross-check before acting when one suspects that one is disoriented.
Footnotes
Declaration of Conflicting Interests
The author(s) declared no potential conflicts of interest with respect to the research, authorship, and/or publication of this article.
Funding
The author(s) received no financial support for the research, authorship, and/or publication of this article.