
Abstract
When intercepting a moving target, we typically rely on vision to determine where the target is and where it will soon be. The accuracy of visually guided interception can be represented by a model that combines the perceived position and velocity of the target to estimate when and where to hit it and guides the finger accordingly with a short delay. We might expect the accuracy of interception to similarly depend on haptic judgments of position and velocity. To test this, we conducted separate experiments to measure the precision and any biases in tactile perception of position and velocity and used our findings to predict the precision and biases that would be present in an interception task if it were performed according to the principle described earlier. We then performed a tactile interception task to test our predictions. We found that interception of tactile targets is guided by similar principles as interception of visual targets.
Introduction
Interception is a common action in daily activities such as trying to hit a moving ball when taking part in various sports. It can be defined as attempting to reach a specific place at a specific time in the future, coinciding with the arrival of another object at that point so that one makes contact with the object. Previous work has shown that the movements that we make when trying to intercept targets are constantly updated (Brenner & Smeets, 2018; Brenner, Smeets, & de Lussanet, 1998; de la Malla & López-Moliner, 2015; Smeets & Brenner, 1995). It has been suggested that doing so results in the final error mainly being determined by the visual information that is available about 100 ms before (Brenner & Smeets, 1997; Franklin & Wolpert, 2008; Oostwoud Wijdenes, Brenner, & Smeets, 2011; Smeets, Wijdenes, & Brenner, 2016). While much of the available research on interception is about using visual information to guide motor actions, it stands to reason that interception using information from other sensory modalities should also be possible (e.g., Shaffer et al., 2013). A common interception task within the animal kingdom is catching prey. Various species of animals employ a variety of senses to catch prey, including the use of electroreception, olfaction, and judgment of hydrodynamic flow in some species of fish (M. E. Nelson & MacIver, 1999; Tricas, 1982) and echolocation in bats and whales (Johnson, Madsen, Zimmer, Aguilar de Soto, & Tyack, 2004; Surlykke & Kalko, 2008). Shooing an insect that is moving along our arm on a dark night also requires that we have some sense of where the insect currently is and possibly where it will be in the near future. We here confirm that tactile information can be used to intercept a target that one feels moving across one’s arm and examine whether such interception is controlled in a similar manner to interception of visual targets. Contrary to many studies that try to determine how movements are controlled by evaluating trajectories (e.g., Arzamarski et al., 2007; Fajen & Warren, 2007; Slupinski, de Lussanet & Wagner, 2018), we do so by evaluating the errors that people make.
When evaluating whether people intercept haptic targets according to the same principles as they do visual targets we must consider both precision and systematic errors. The precision of interception is limited by the resolution of the sensory and motor signals (Körding & Wolpert, 2006). For visual targets that people are tracking with their eyes, the sensory resolution depends on the resolution of the fovea and on how well people know the orientation of their eyes. When intercepting haptic targets, the sensory resolution depends on the part of the skin that is stimulated. In addition to the random errors due to limited sensory resolution, systematic perceptual errors are also common both when using virtual targets (Rossi, Montanaro, & de’Sperati, 2018) and in real life (Troscianko, Wright, & Wright, 1999). They may be particularly evident under unnatural circumstances (La Scaleia, Zago, Moscatelli, Lacquaniti, & Viviani, 2014). Misjudging acceleration (Senot et al., 2012) influences interception, as does relying on otherwise biased visual information (de la Malla, Smeets, & Brenner, 2018). When judging positions from touch alone, judgments of the position on the arm are likely to be biased (Brooks, Seizova-Cajic, & Taylor, 2019; Green, 1982). When relying on proprioception to guide the hand that is used to intercept the target, the position of the moving hand is likely to be biased in a subject-specific manner that is highly stable over time (Kuling, Brenner, & Smeets, 2016; Smeets, van den Dobbelsteen, de Grave, van Beers, & Brenner, 2006). The haptic percept of target speed might be biased as well because we know that the reproduction of a haptic percept of length is biased (J. S. Nelson et al., 2018) and that the size of holes is judged differently with different effectors (Drewing, 2018).
To evaluate whether errors in the judgments that we consider to be essential for interception can account for the accuracy of interception, we must consider how the judgments are used to control interception. Based on our knowledge of the accuracy of the perceptual judgments of putative underlying information, we can make model predictions for the accuracy of interception and compare these with that of actual performance. For visual targets, we have done so both for the precision and the bias (Brenner & Smeets, 2015; de la Malla et al., 2018). The simple model for interception that we use is based on continuously updating the perceived position and extrapolating this position over the remaining time to interception on the basis of the perceived velocity. The position at which people aim to intercept a moving target is based on the sensed position

The bias in interception follows directly from systematic differences between the perceived and actual position and velocity. For the precision of interception, we base our prediction on the assumption of normal distributions of uncorrelated random errors in judging position and velocity (Brenner & Smeets, 2015):

We devised a series of three experiments to examine whether this interception principle that was developed to account for the interception of visual targets also applies to haptic interception. We probed biases and the precision of judgments about the position and velocity of a tactile stimulus on the arm and measured people’s ability to intercept a target moving along the arm. The first experiment presented participants with a moving stimulus on the arm, whose speed participants were instructed to reproduce by moving their finger through the air. The second experiment required participants to use their right fingertip to touch the location of a stationary tactile stimulus on the left arm. The third experiment required participants to intercept the target as it moved along their left arm. We examined whether performance on the first two experiments was consistent with performance on the third, as it should be if interception were controlled similarly to how it is done visually.
Methods
Participants
We performed three experiments: Position, Velocity, and Interception. Fifteen young healthy adults were recruited to take part in the Position and Velocity experiments. One participant stopped after a few trials because the participant had sensory deficits that made it impossible to feel the stimulus. The remaining 14 participants completed the Position and Velocity experiments in random order in a single sitting. Seventeen young healthy adults took part in the Interception experiment. Three participants were excluded from analysis because the LED marker of the finger was hidden from the measurement cameras’ views in too many trials (see data analysis), and a fourth was excluded because of technical difficulties with saving data during the experiment. The remaining 13 participants completed the Interception experiment in one sitting. All participants provided their written informed consent before the start of the respective experiments.
Setup
We used a tapping task to measure how well people could match the position of a static tactile stimulus on their arm and intercept it when it was moving along the arm. We used a reproduction task to measure how well they could match the target’s speed. Participants sat at a table in a room illuminated by a single lamp and rested their left arm palm-down on a platform on the table (Figure 1). The height of the far end of the platform was adjusted for each participant such that the top of the forearm was approximately parallel to the table. The tactile stimulus, delivered to the top of the forearm, was a bearing ball (4 mm diameter) which was free to roll within a fixture attached to a haptic device (an omega.3, Force Dimension, Nyon, Switzerland). The haptic device, capable of performing precise closed-loop movements, rolled the target along the participant’s forearm. As each person’s forearm has a different size and shape, the starting height of the fixture was calibrated for each participant individually. The position of the participant’s forearm was such that the middle of the forearm corresponded to the middle of the haptic device’s range of motion; the target never traveled farther than 10 cm in either direction from this central position.
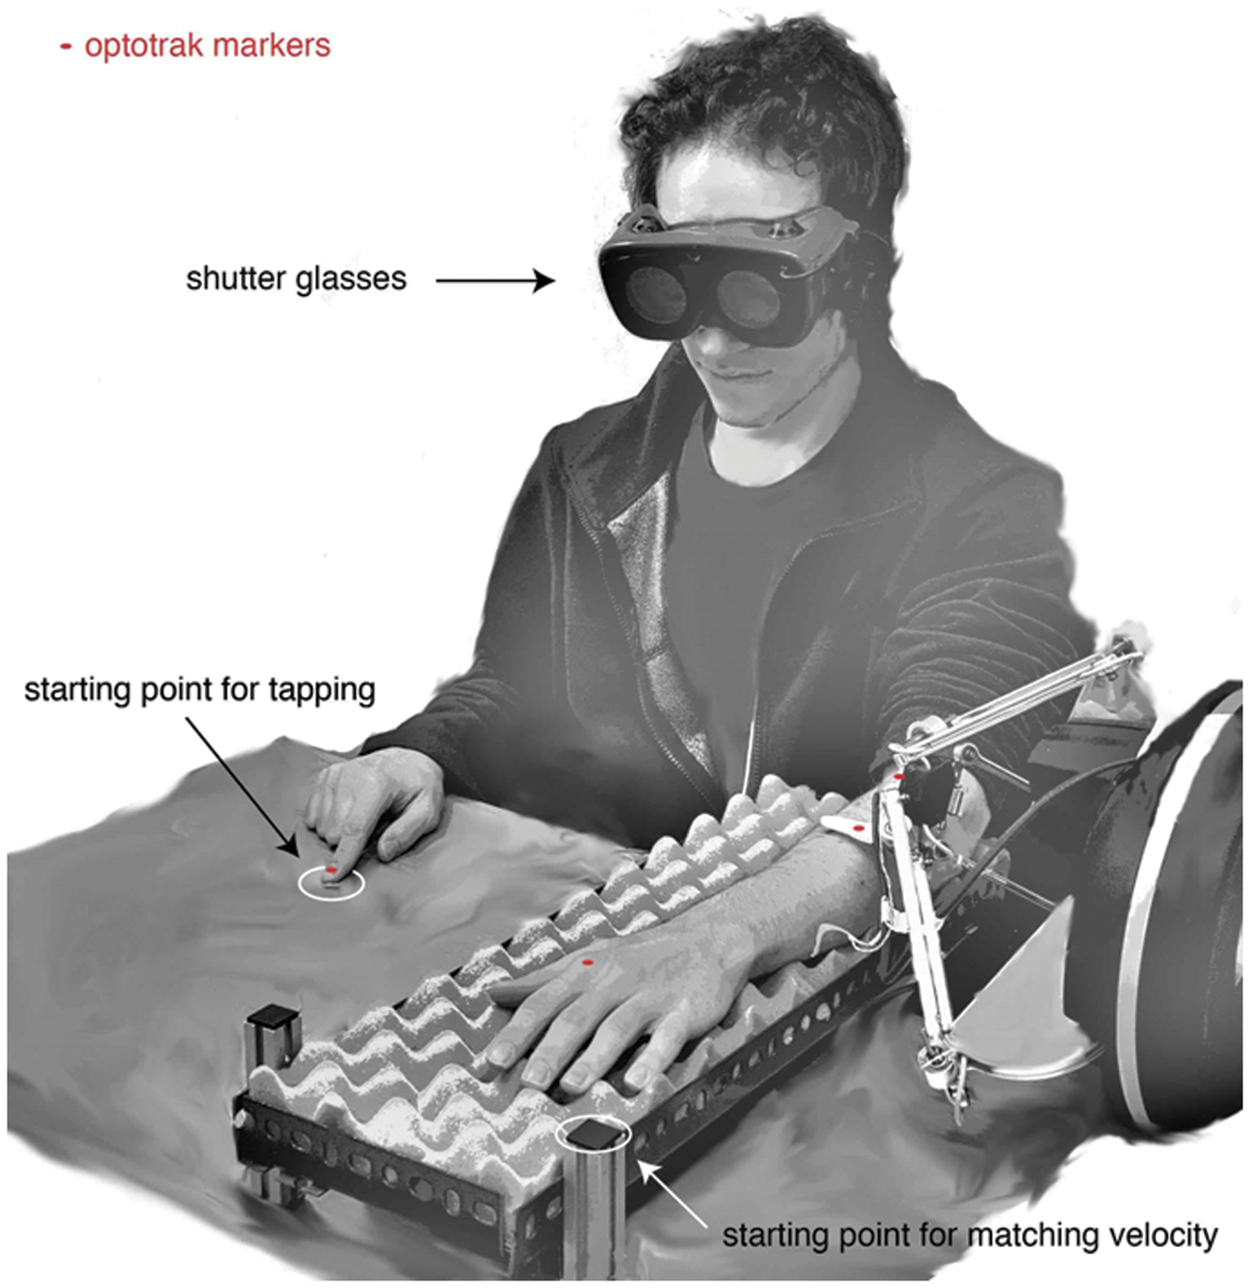
The experimental setup. Red dots indicate the position of the Optotrak markers, and white circles indicate the two starting points for the finger, one for the tapping movements of the Position and Interception experiments and the other for the movements in the Velocity experiment.Note: Please refer to the online version of the article to view this figure in colour.
Infrared LED markers were attached to the fixture and to the participant’s right index finger to measure the interception error. To relate this error to the position on the left arm, we attached markers to the left elbow and major knuckle of the left index finger. The positions of these four markers were recorded at 400 Hz using an Optotrak Certus movement registration system (Northern Digital International, Waterloo, Ontario, Canada). Participants wore shutter goggles for the duration of the experiments. The experiments each consisted of multiple short trials. At the start of a trial, the shutter goggles turned opaque and the lamp that illuminated the room switched off. This ensured that during the trial participants would have no visual information about either the target or their own body. Shortly after the shutter goggles turned opaque, a stimulus was applied and the participant responded. Eight seconds after the start of the trial, the lights turned back on and the shutter goggles cleared. Eight seconds was long enough to ensure that the participants had always finished their response before they could see again.
Procedure
Position experiment
Our first step was to measure how accurately and precisely participants could move their right fingertip to the location of a static tactile stimulus on their left arm. They started with their right index finger at the starting point on the table (Figure 1). The target moved to one of the 21 positions above the arm (between −10 and 10 cm from the center, in increments of 1 cm) and then descended on the arm. The target then remained at this position for the duration of the trial. Participants were instructed to tap the target as soon as they felt it. Participants were instructed that corrective movements were not allowed. Because the target remained in place on the arm, participants touched the target in the case of a successful tap and the arm otherwise. In this way, they received feedback on their performance. For each position on the arm, there were two trials, resulting in 42 trials per participant. In addition, there was a calibration trial at the very beginning and end of a session. During the calibrations, the participants had full vision and placed their finger directly on the visible target to ensure alignment between the finger and target markers. We considered the resulting separation between the marker positions as our definition of an error of zero in the data analysis.
Velocity experiment
Our second step was to estimate how well people could judge and reproduce the speed of a target moving across their arm. Participants were instructed to pay attention to the velocity of the target moving across their forearm while resting their right index finger at a starting point in front of and to the left of the arm platform (Figure 1). At the start of each trial, the target would move into position above the participant’s forearm, then descend, and immediately begin traveling along the arm. The target started moving at one of the six positions, 6, 8, or 10 cm from the center of the forearm in either direction. If the target started closer to the wrist, it always traveled in the direction of the elbow and vice versa. The target trajectory always ended 10 cm from the center of the forearm. The target could travel at one of the three speeds: 10, 15, or 20 cm/s (henceforth referred to as slow, medium, and fast). It moved for 0.8 to 2 s, depending on the speed. For participants whose forearm was shorter than 20 cm, a scaling factor was applied to both the distances traveled and the durations such that the target never moved past the elbow or wrist but still achieved the same velocities. Once the target completed its movement, participants were to move their right index finger rightward at a speed matching that of the target they just felt. They moved their finger to the right (orthogonal to the target’s motion) and were instructed to keep moving as far as they comfortably could. In this way, we ensured that they did not reproduce the target’s motion rather than its velocity (for instance, by matching the distance that it traveled). They moved in the same direction for all trials to minimize possible motor-related differences in reproduction across trials. Once the participant had completed the movement, they returned their finger to the starting point. There were five trials for each condition (categorized by one of the six starting points and one of the three speeds), resulting in a total of 90 trials per participant.
Interception experiment
Finally, we tested participants’ ability to intercept a moving tactile target. As in the Velocity experiment, the target moved along the participant’s arm. Again, the target could start 6, 8, or 10 cm from the center of the forearm in either direction and traveled at 10, 15, or 20 cm/s, resulting in 18 unique conditions. The task for the participants was the same as that in the Position experiment: They started with their right index finger at the starting point on the table (Figure 1) and were instructed to tap the target as soon as they felt it. As a form of feedback, the haptic device stopped moving if it detected a sudden increase in force, such that a successful interception would halt the target’s movement for the trial. If the participant tapped behind the target, the target continued its trajectory. If the participant tapped ahead of the target so that the target bumped into the finger, the collision triggered the device to stop. Corrective movements of the hand were not allowed. Trials were presented as 10 blocks, each consisting of one trial from each condition in a random order. The first block served as a familiarization phase and was excluded from analysis. This resulted in a total of 162 trials that could be used for the analysis. Participants were not explicitly informed of the blocking or of the familiarization phase, but they were informed when they had made it halfway through the experiment and were free to take a break whenever they wished. As in the Position experiment, a calibration trial took place at the very beginning and end of each participant session, and the offset that was considered to represent perfect interception was calculated from these trials.
Analysis
Position experiment
We started the analysis by correcting the finger position for the difference between the finger LED marker and the fixture LED marker, averaged across the two calibration trials. The time of tap was defined as the point in time at which a sharp upward acceleration peak was observed for the finger, while the finger was not moving upward (see Schot, Brenner, & Smeets, 2010). We considered the location of participants’ initial tap on the arm as their tap location. Any subsequent movements or corrections were ignored in line with the instructions to the participants. Positions were defined relative to the midpoint of the arm, which corresponded to the midpoint of the positions at which the targets appeared. Positive values were toward the wrist. We defined the participants’ tap errors as the one-dimensional offset (along the path of the target) between the locations of the participants’ finger and the target at the time of the tap. Errors were positive if the tap was too close to the wrist, in accordance with the coding of positions. To determine the bias and precision of the tap for each participant, we determined the slope and residuals of a linear regression of their tap errors as a function of target position (see “Model predictions” section for further details). Movement times were also determined for each trial.
Velocity experiment
Because finger velocity is not constant over time, we had to pick the segment of the finger velocity profile that we believed would best represent the participant’s attempt to reproduce the perceived target velocity. We defined the velocity used to match the target as the average rightward speed (i.e., only considering movement in one dimension) during the time that the participant’s finger passed through the middle 10 cm of their trajectory. This segment often, but not always, included the participant’s maximum velocity. To check whether the actual velocity of the target corresponded to the programmed velocity, we determined the velocity of the infrared marker on the target by differentiating the marker’s position with respect to time, again over the middle 10 cm. The actual velocity of the target always matched the programmed velocity (mean ± standard deviation across trials: 10.0 ± 0.02 cm/s, 15.1 ± 0.04 cm/s, and 20.1 ± 0.1 cm/s for slow, medium, and fast targets, respectively).
We determined this measure of perceived velocity for each trial. We then calculated a Weber fraction (the standard deviation divided by the mean) for each participant’s velocity reproductions for slow, medium, and fast targets in order to get a measure of the precision of their velocity reproduction that is independent of the velocity of the target (Westheimer, 1999). Finally, for each participant, we calculated the slope of velocity reproductions as a function of target speed to quantify any bias in reproducing felt velocities. We focused on target speed, rather than velocity, as we found that the target’s movement direction had no influence on participants’ reproduction speeds.
Interception experiment
As in the Position experiment, we considered the initial tap location and defined participant’s tap errors as the offset between the locations of the participant’s finger and the target at the time of the tap. We calculated the slope and residuals of the participants’ tap errors, now taking the target’s movement direction into account. The slope was constrained to be the same for both directions of target motion, but the intercept was allowed to differ. As in the position experiment, movement times were determined for each trial.
Model predictions
We will compare our results from the Interception experiment with predictions based on the Velocity and Position experiments with the help of the model of Equations 1 to 2. However, before doing so, we must introduce a commonly observed bias in the responses: a contraction bias (Poulton, 1979). We assume that the perceived position (


We can determine w experimentally from the slope of the tapping error as a function of the target position.
Assuming that p and x are combined optimally and that their errors are independent, so that:
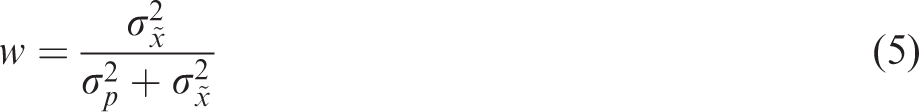
The variance of the participants’ tapping errors (assuming that motor noise is negligible so that the variability corresponds with the variability in the perceived position

Equations 5 and 6 can be combined to give


Thus, we can use the measured variability in the participants’ tap locations (σ
E
; the standard deviation of the residuals of the fit in the Position experiment) and the weight given to the prior (w; slope of error as a function of position) to estimate the standard deviation of the position judgments (

Assuming that the velocity is misjudged proportionally (


In Equation 11, we have neglected uncertainty in judging the visuomotor delay. We assume that the additional variability due to the motion of the target is a product of uncertainty in the perceived velocity and the delay itself (
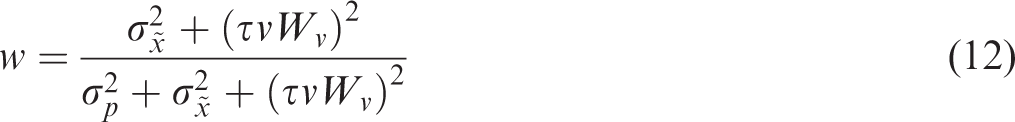
The higher weight given to the prior when intercepting moving targets, because σ
xm
>σ
x
, corresponds with a steeper slope of lines fit to the tapping errors as a function of the target position at the time of the tap. When intercepting moving targets, we expect that the variance in participants’ tapping errors will be:

Results
Position Experiment
When our example participant attempted to tap the stationary target’s position on the arm, the taps were biased in the direction of the center of the forearm (Figure 2). This pattern corresponds to the expected contraction bias: the farther away the target was from the center of the forearm, the larger this error, reaching values of up to 7 cm. We performed such a regression for each of the 14 participants. The (negative) median value of −0.22 for the slopes of these linear regressions (Figure 3(a)) corresponds to a weight w of 0.22. The median standard deviation of the residuals of these regressions σ T is 1.5 cm (Figure 3(b)). On average, participants took 737 ms to tap on the target (from the moment the hand started to move).
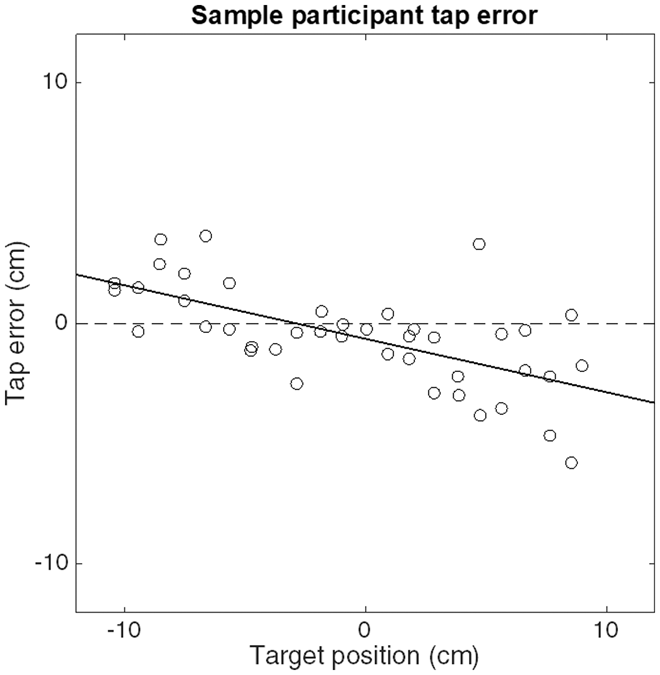
A single participant’s tap errors as a function of the location of the target. The solid line is a fit to the participant’s data. The negative slope corresponds to a contraction bias.
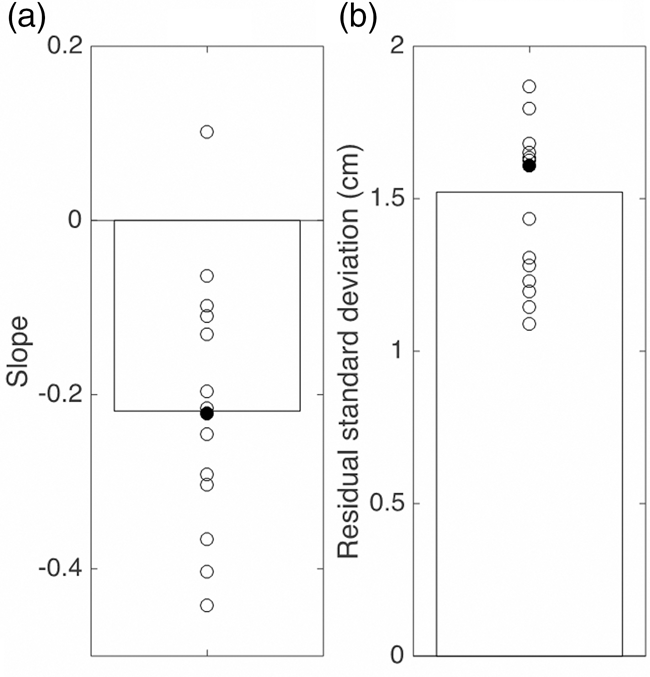
The bias (a) and precision (b) in the Position experiment. Circles: values for individual participants (the filled circles indicate the participant whose data are shown in Figure 2). Bars: median of all participants’ values.
Velocity Experiment
All except one participant clearly moved faster in response to faster targets. The direction of the target’s motion had no effect on participants’ speed reproductions, so we henceforth group the targets by speed rather than velocity. The data of a single participant (Figure 4) show that this participant (a different one than for the Position experiment) scaled the speed of the hand movement to the speed of the target. The variability in the reproduction was quite large. Moreover, the reproduction was not veridical (far from the dashed unity line): the reproduced speed for this participant was more than 4 times the speed of the target. This participant was no exception: all participants produced a speed that was more than twice that of the target (slope larger than 2, Figure 5(a)). The medians of the participants’ average produced speeds were 35, 61, and 86 cm/s for the three conditions, with respective median standard deviations of 11, 16, and 19 cm/s. Participants differed by up to a Factor 5 in their mean reproduced speed for a single condition. Participants’ speed reproduction performance showed a median Weber fraction of 0.25 (Figure 5(b)). The median Weber fractions were 0.26, 0.25, and 0.21 for the slow, medium, and fast targets, respectively.
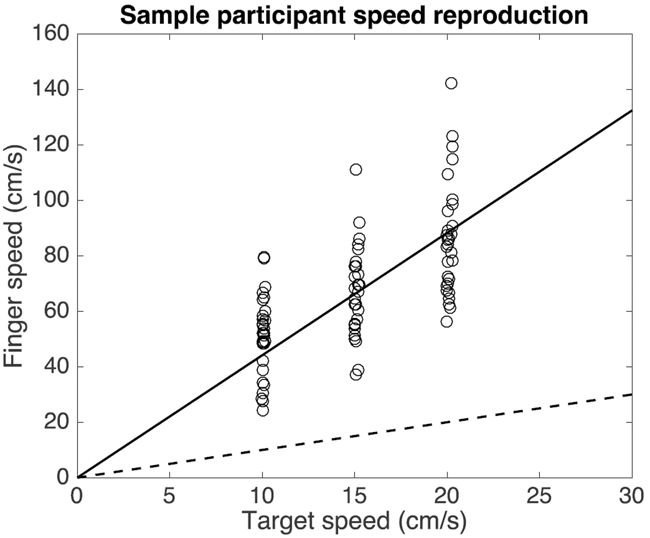
A single participant’s reproductions of the target speed in the Velocity experiment. The solid line is a fit constrained to pass through the origin. The dashed unity line indicates where points would be if the participant reproduced the target speed veridically. This is a different participant from the one whose data are shown in Figure 2.
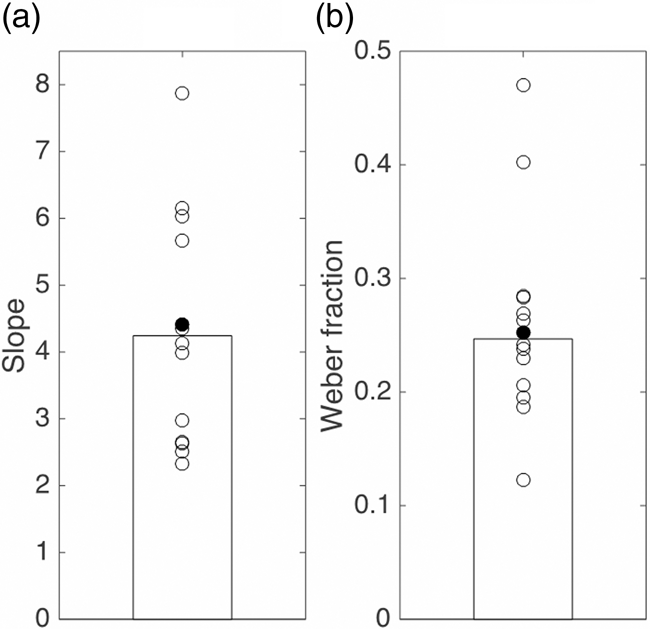
The bias (a) and precision (b) in the Velocity experiment. Circles: values for individual participants (the filled circles indicate the participant whose data are shown in Figure 4). Bars: median of all participants’ values.
Interception: Model Prediction and Experiment
On average, participants took 464 ms to tap on the target (from the moment the hand began to move). Using the median values obtained from the Velocity and Position experiments, we predicted a typical participant’s performance in the interception task (Figure 6(a)). The predicted behavior resembles that of an example participant (Figure 6(b)). Two similarities with the predictions are remarkable. The first is the effect of the direction of target motion (separation between blue and green lines), which is introduced to the model by the overestimation of target velocity. The second is the steeper slope than in the Position experiment (Figure 2), which is due to the larger uncertainty about where to tap, and thus a larger reliance on the prior.
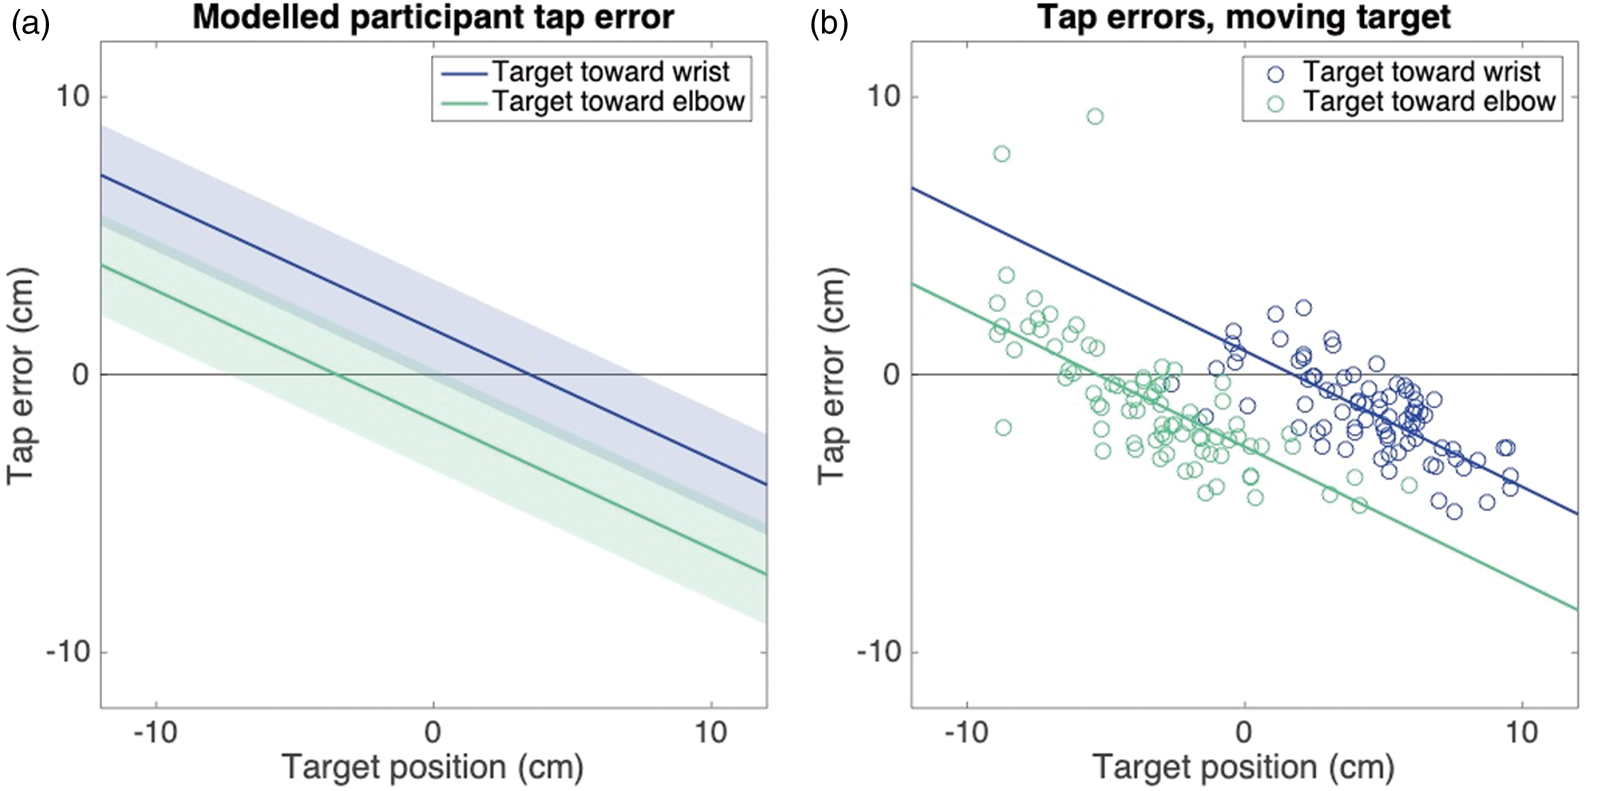
(a) Interception performance as predicted by the model for the medium speed targets based on the median performance in the Velocity and Position experiments. Color indicates the direction of target motion. Shaded areas indicate one standard deviation from the mean. (b) A single participant’s performance in all trials of the Interception experiment (circles) and the best parallel linear fit (lines).Note: Please refer to the online version of the article to view this figure in colour.
If we look at the three parameters for which we made predictions, we see that the predictions are very similar to the values observed in the Interception experiment (Figure 7), despite being based on a different set of participants and the parameters differing considerably across participants. Our model predicts a median slope of −0.47 for the bias toward the center of the forearm, which is considerably steeper than what was observed for static targets. This predicted slope is very similar to what we observed in the Interception experiment (Figure 7(a)). The model also correctly predicts the effect of target direction on performance, estimating a median intercept shift of 3.1 cm, essentially equal to the observed shift of 3.0 cm (Figure 7(b)). One prediction is incorrect: our model predicted that participants would be less precise in the Interception experiment than in the Position experiment, which was not the case. The model slightly underestimates participants’ precision for Interception, predicting a precision of 1.9 cm, compared with 1.4 cm in the experiment (Figure 7(c)).
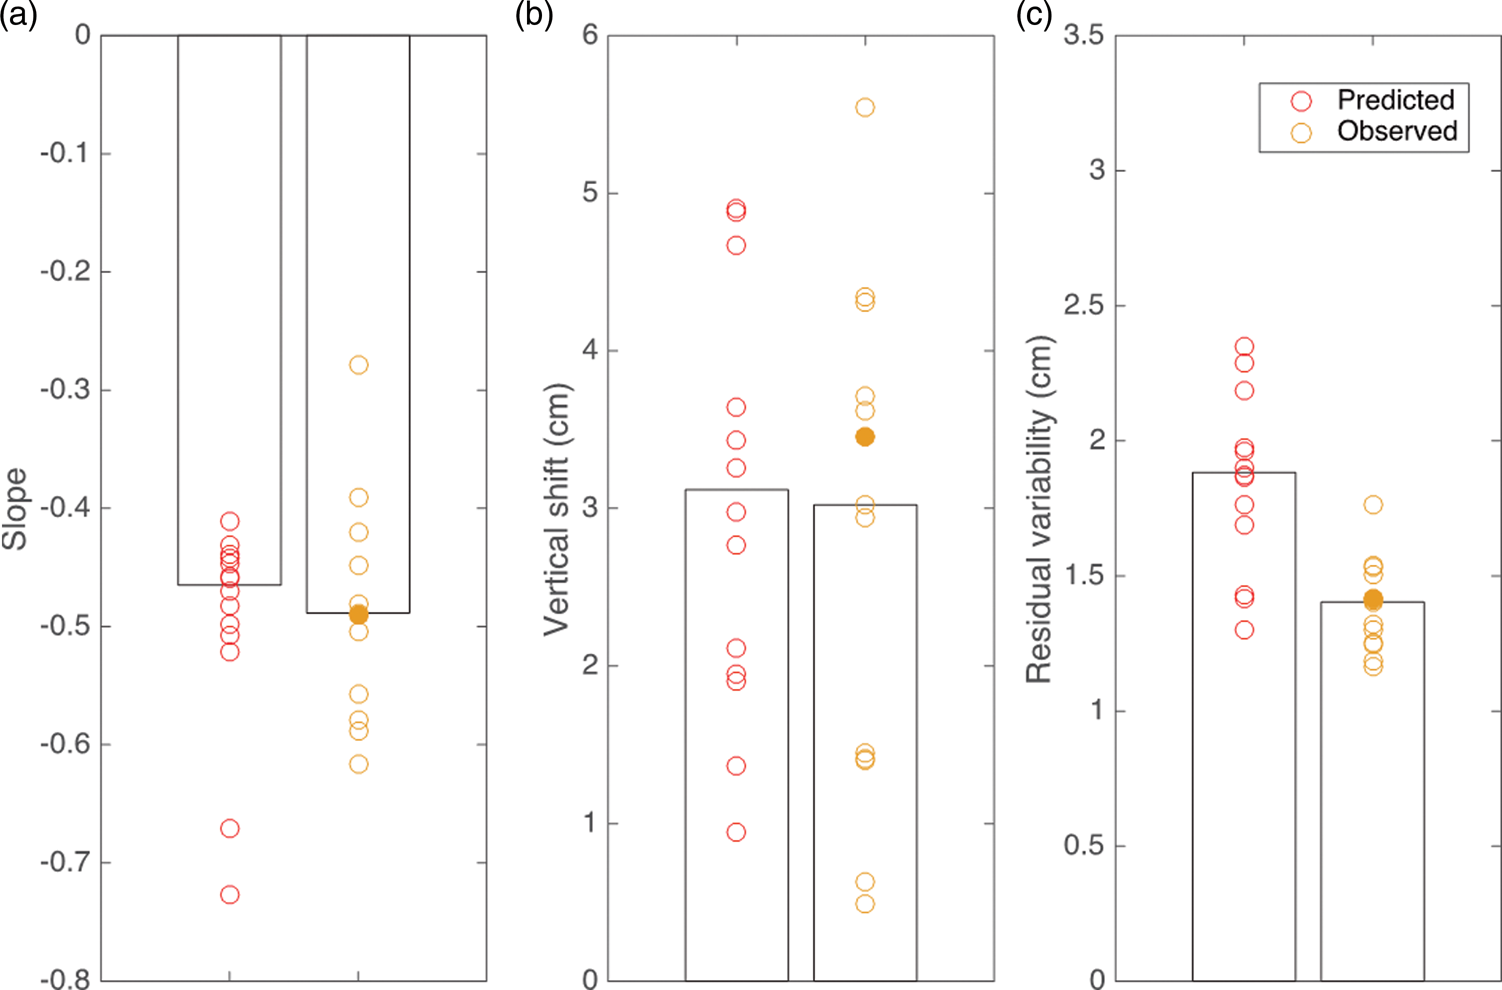
Comparison of model predictions of interception performance (red symbols) with the experimental results of the Interception experiment (orange symbols). The bias (a), influence of direction (b), and precision (c) as predicted by the model based on the results of each participant’s performance in the Velocity and Position experiments and as determined for each participant in the Interception experiment. Bars indicate median values. The filled orange symbols indicate the values for the participant whose data are shown in Figure 6(b).Note: Please refer to the online version of the article to view this figure in colour.
Discussion
In this article, we demonstrated that interception of a tactile target can be modeled in a similar way to interception of visual targets. The Position experiment demonstrated that participants can locate a static target on their arm using the index finger of the other hand, but that participants exhibit a tendency to aim toward the center of the forearm. The Velocity experiment showed that participants are able to distinguish between different target speeds as perceived by touch, although the reproduction speeds were consistently far too high. The Interception experiment revealed that the biases that were found in the other two experiments influence interception and showed that participants can intercept a target that is moving along the arm with remarkable precision.
The fact that our prediction for the influence of the direction of motion was so accurate was a surprise to us. When we observed that the target’s velocity was overestimated by a Factor 4, we doubted whether our measure was adequate. In principle, it could be the case that the results did not indicate an overestimation of perceived tactile speed but an underestimation of the produced hand speed. However, considering our results, it is probably the target’s velocity that is misperceived. This might be because the produced hand speed is reasonably well calibrated as it is not unusual to want to move one’s hand at a certain speed, whereas people do not often need to judge tactile speed.
In our model, we assumed that people have a prior for the target’s position at the time of the hit that is combined with the extrapolated position based on the sensed position and velocity some time before the tap to determine where to tap. We therefore determined a weighted average of the anticipated target position and this prior. However, one could argue that the prior does not affect the extrapolated position but affects the sensed position. If so, we would have to replace Equation 9 by:

This corresponds with determining a weighted average of the sensed position and the prior, as in the Position experiment, and extrapolating from the resulting position with the perceived velocity. This alternative model differs from our original model in that the weight given to the prior (and thus the dependence of the tapping error on position) is the same in the Interception experiment as in the Position experiment, which is not consistent with our data (different slopes in Figures 2 and 6). Equation 14 also predicts a larger influence of the direction of target motion, but this is less convincing evidence against this option because some of the overestimation of the speed in the Velocity experiment may be the result of underestimating the arm movement velocity after all.
One uncertainty in all our comparisons is that the value that we use for the sensorimotor delay might not be correct for tactile information. The fact that both our prediction for the change in the bias toward the center of the arm and our prediction for the systematic influence of the target’s motion on participants’ tap locations were correct when using this value supports the value of 100 ms for the delay. We do not have a direct independent estimate of how quickly people can react to tactile location information, but it takes people about 90 ms to adjust their grip strength in response to the sensation of finger slip (Brandes & Heed, 2015; Pruszynski, Johansson, & Flanagan, 2016) so a value of 100 ms is not unrealistic. If the delay is indeed about 100 ms, it is unlikely that the correspondence between the bias in reproducing the target’s speed and the systematic influence of the target’s motion is a coincidence, so the velocity indicated with the hand in the Velocity experiment is probably the perceived velocity.
The results of the Interception experiment showed that participants’ performance in a tactile interception task can be modeled on the basis of performance in a speed reproduction task and a static target task. Our model fits the biases in the data best when we consider participants’ speed reproductions rather than the target speed. This confirms that participants take the perceived speed of the target into account rather than simply paying attention to an updating percept of target position. Interestingly, our model predicts poorer tap precision than actually exhibited by participants. In its current form, our model cannot produce precisions of interception that are better than those of the Position experiment because the added variability introduced by the target moving can only cause the precision to decrease. A possible explanation for having found better precision for moving targets is that participants receive more feedback in the Interception experiment than in the Position experiment: They do not only know whether they missed but also whether they tapped in front of or behind the target. Another possibility is that as tactile receptive fields on the forearm are large, the sequential motion over several adjacent receptive fields allows for better localization of the moving target. The fact that participants showed considerably smaller movement times is also interesting. All participants were instructed in both the Position and Interception experiments to move as quickly and accurately as possible, but participants still moved faster in response to a moving target. It is possible that participants prioritized speed over accuracy when hitting a moving target so as to ensure that they arrive in time. This makes it even more surprising that participants’ precision is better for moving targets.
One conspicuous difference between the results of this study on intercepting tactile targets and those of the earlier studies on intercepting visual targets is that we find substantial biases for tactile targets whereas studies with visual targets found modest biases, mainly arising from illusions (de la Malla, Smeets, & Brenner, 2017; de la Malla et al., 2018) or from ignoring acceleration (Brenner et al., 2016; Brenner & Smeets, 2015). This difference is easy to understand. When moving a visible hand to a visible target, one can simultaneously see both the hand and the target, so any visual bias will affect the localization of both hand and target (Smeets et al., 2006). Visual biases will therefore not affect interception. When moving to a tactile target without seeing one’s hand, any tactile bias will affect the perceived location of the target but not that of the hand. Tactile biases will therefore affect interception. There are many potential origins of biases when dealing with tactile targets, for instance, because tactile localization depends on posture (Sadibolova, Tamè, & Longo, 2018).
Both the bias and the precision in the Position experiment were quite similar to those reported for manually indicating short touches with a von Frey filament (Brooks et al., 2019). The precision values are a combination of perceptual and motor errors. Previous work examining how well people can detect the direction in which a stimulus is displaced along the back of their forearm suggests that the spatial precision of touch corresponds with a standard deviation of about 0.5 cm under those circumstances (Cody, Garside, Lloyd, & Poliakoff, 2008). Our participants’ precision of about 1.5 cm when tapping a static target can therefore probably largely be attributed to motor errors. This would be consistent with the fact that we did not observe a systematic difference in tap precision along the arm.
Considering the persistent bias in the direction of motion that we find in the Interception experiment, it is evident that the feedback that we provided is not enough to quickly learn to avoid biases such as the bias toward the center of the arm or the bias that is introduced by misjudging the velocity. Similar lack of adaptation was found for temporal errors (“spatial feedback” condition in de la Malla et al., 2014).
For the model in the article, we made many simplifying assumptions in comparison to the model that we previously proposed to account for the errors when hitting visual targets (Brenner & Smeets, 2015). For instance, we considered motor variability and uncertainty in the remaining duration to have negligible influences on tactile interception. Considering how much poorer position and velocity judgments are for tactile targets (standard deviation of about 15 mm and Weber fraction of about 25%; Figures 3(b) and 5(b)) than for visual targets (standard deviation of about 3mm and Weber fraction of less than 9%; Brenner & Smeets, 2015), these simplifying assumptions seem to be justified. There are of course many more differences between the visual and tactile modality. Despite these differences, stimulus position and motion can be perceived by both the skin and the eyes, and our experiment shows that interception relies similarly on such percepts for visual and tactile targets. Thus, the current findings provide support for the previously proposed mechanism of guiding interception (Brenner & Smeets, 2015, 2018), extending its validity to include tactile targets.
Footnotes
Acknowledgements
The authors would like to thank Qinqi Xu for her help with recruiting participants as well as Fabio Tatti for his help with setting up the experimental system.
Data
Declaration of Conflicting Interests
The author(s) declared no potential conflicts of interest with respect to the research, authorship, and/or publication of this article.
Funding
The author(s) disclosed receipt of the following financial support for the research, authorship, and/or publication of this article: This work was supported by the Horizon 2020 grant 642961: “PACE.”