
Abstract
One of the most relevant prognostic indices for tumors is cellular proliferation, which is most commonly measured by the mitotic activity in routine tumor sections. The goal of this systematic review was to analyze the methods and prognostic relevance of histologically measuring mitotic activity that have been reported for canine tumors in the literature. A total of 137 articles that correlated the mitotic activity in canine tumors with patient outcome were identified through a systematic (PubMed and Scopus) and nonsystematic (Google Scholar) literature search and eligibility screening process. Mitotic activity methods encompassed the mitotic count (MC, number of mitotic figures per tumor area) in 126 studies, presumably the MC (method not specified) in 6 studies, and the mitotic index (MI, number of mitotic figures per number of tumor cells) in 5 studies. A particularly high risk of bias was identified based on the available details of the MC methods and statistical analyses, which often did not quantify the prognostic discriminative ability of the MC and only reported P values. A significant association of the MC with survival was found in 72 of 109 (66%) studies. However, survival was evaluated by at least 3 studies in only 7 tumor types/groups, of which a prognostic relevance is apparent for mast cell tumors of the skin, cutaneous melanoma, and soft tissue tumor of the skin and subcutis. None of the studies using the MI found a prognostic relevance. This review highlights the need for more studies with standardized methods and appropriate analysis of the discriminative ability to prove the prognostic value of the MC and MI in various tumor types. Future studies are needed to evaluate the influence of the performance of individual pathologists on the appropriateness of prognostic thresholds and investigate methods to improve interobserver reproducibility.
Dogs with malignant tumors exhibit a variable clinical course based on certain tumor and patient characteristics. 94 One of the most relevant tumor characteristics regarding prognostication is cellular proliferation.43,94 While most measurement methods of tumor proliferation require immunohistochemistry (such as the Ki67 index) or special stains (such as the AgNOR score), the most practical approach is to measure mitotic activity in routine hematoxylin and eosin–stained tumor sections. 142
The histological measurement methods for mitotic activity (quantification of mitotic figures, ie, cells in the M phase of cell division with histologically distinct features) vary widely in previous studies. 94 Two broad categories can be distinguished: (1) the mitotic count (MC) represents the absolute number of mitotic figures per tumor area and (2) the mitotic index (MI) represents the proportion of mitotic figures among all tumor cells per tumor area. 95 While there have been efforts, starting in 2016, to standardize the measurement method of the MC,43,94,95 many studies were published before those guidelines were available. An overview of the previously applied methods is needed to better understand current practice and to direct future recommendations.
A vast number of studies have evaluated mitotic activity (mostly the MC) as a prognostic test in several canine tumor types. While mitotic activity is generally considered to be associated with the biological behavior of tumors and outcome of tumor patients,43,94 there are currently no recommendations on which tumor types mitotic activity should be assessed routinely as a solitary prognostic test. Due to the methodological differences in prognostic studies and the intrinsic bias of observational studies, validation of research findings and summaries through systematic review (and ideally meta-analysis) are needed for each tumor type.18,93
The goal of this systematic review was to analyze the methods and prognostic relevance of histologically measuring mitotic activity in canine tumors that have been reported in the literature. We provide an overview of the literature, as well as recommendations for routine diagnostic practice and future research goals.
Material and Methods
This systematic review was conducted similar to a previous systematic review on mitotic activity in feline tumors using the same literature search protocol (with modified search terms and a single literature reviewer), data extraction, and article evaluation (risk of bias) criteria. 15
Literature Search
References were identified by 1 author (CAB) through systematic (predetermined search terms) and nonsystematic (with numerous search terms) searches to ensure literature saturation (Fig. 1), consistent with the recommendations by the Preferred Reporting Items for Systematic Reviews and Meta-Analyses (PRISMA) statement. 110 Eligibility screening was performed by a single author (CAB) using a 2-step procedure (Fig. 1).
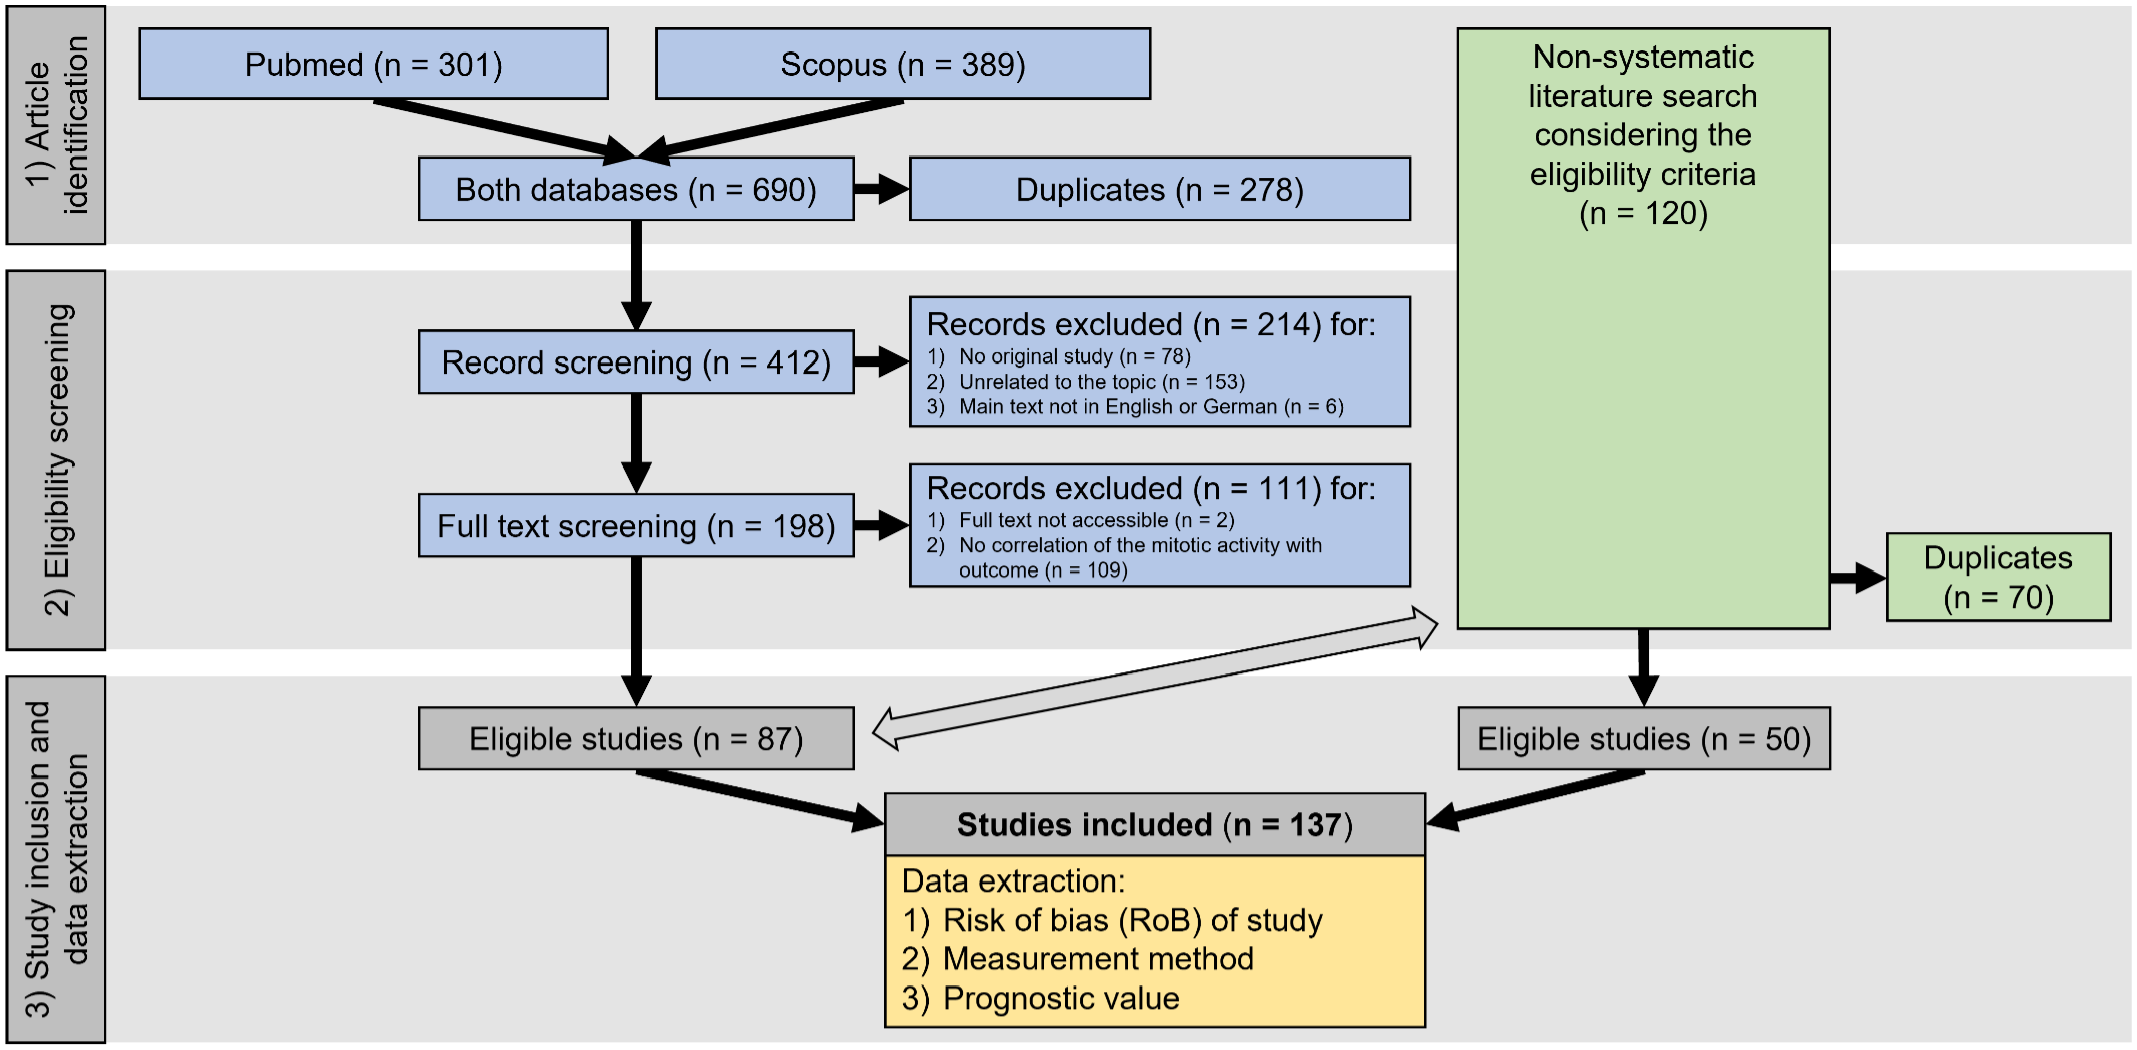
PRISMA flow diagram 110 of the literature search divided into systematic (blue boxes) and non-systematic (green boxes) article identification and eligibility screening, followed by study inclusion with subsequent data extraction. The double-sided arrow indicates comparison of the identified articles for removal of duplicates.
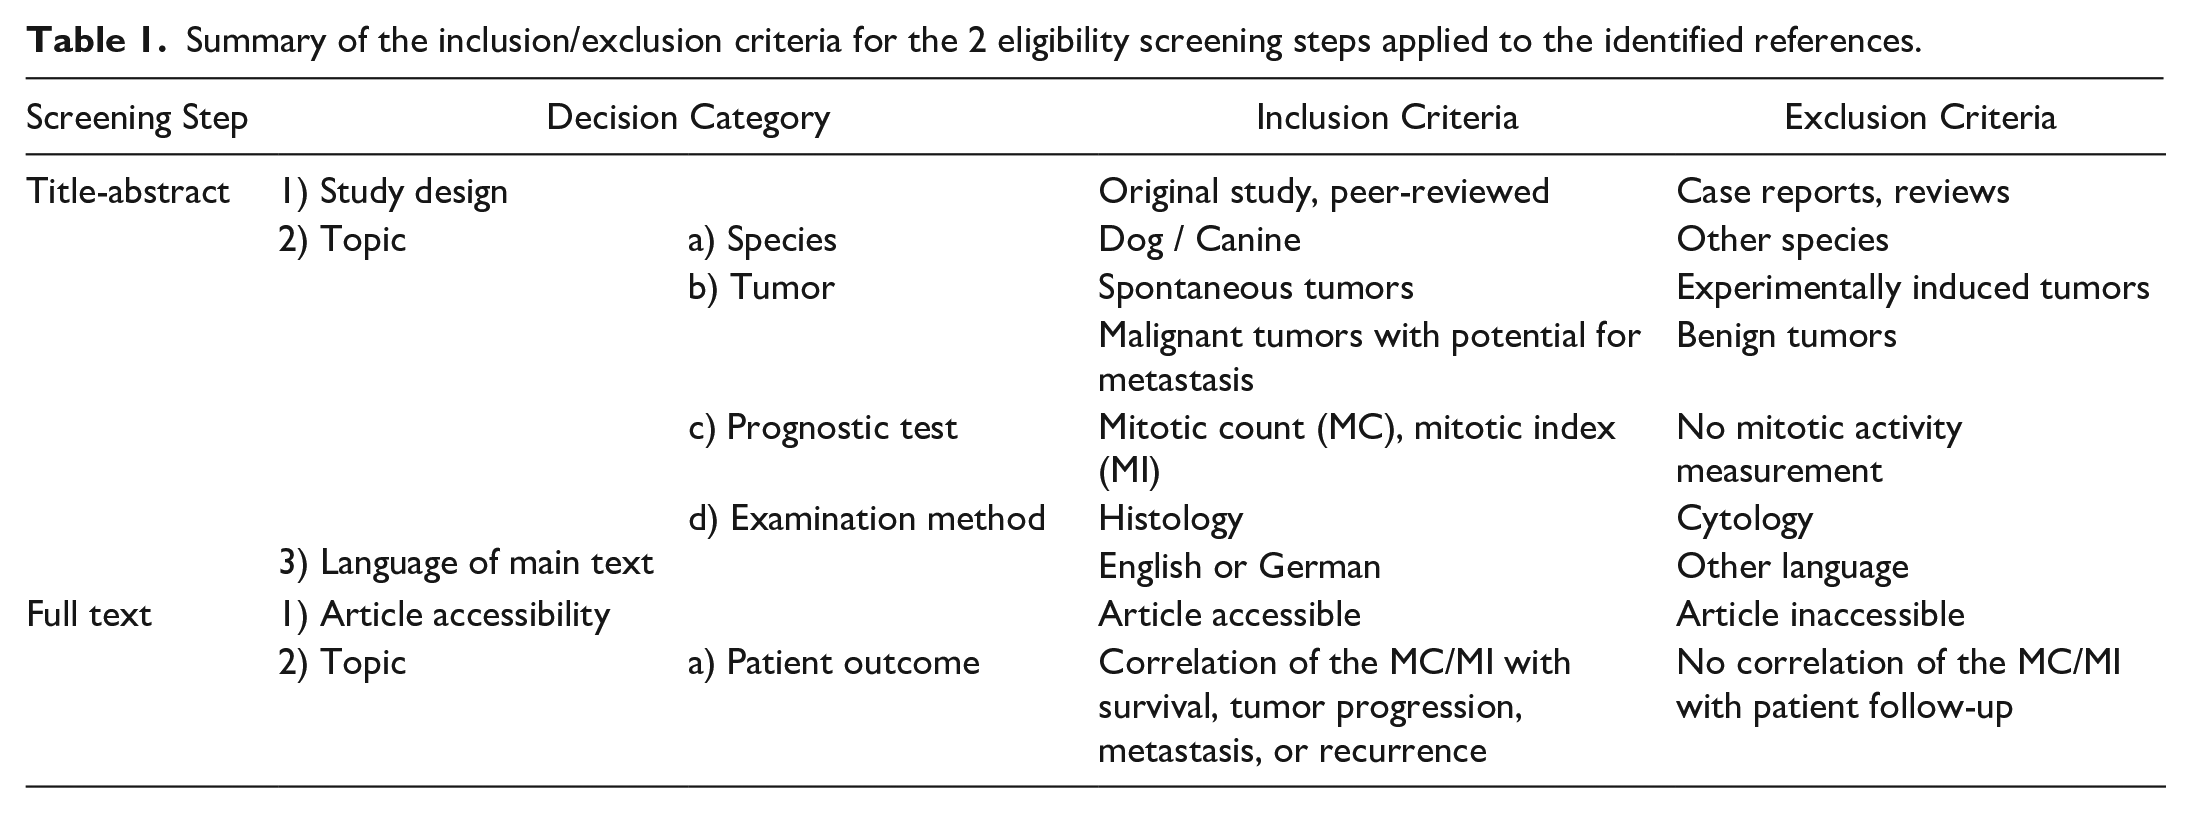
Systematic literature identification was carried out in 2 databases, namely PubMed (1950 to present) and Scopus (1970 to present), on 30 April 2022 using the following predetermined search terms to build search strings on 2 topics for who (animal) and what (prognostic test): (dog OR dogs OR canine) AND (mitotic count OR mitotic index). Duplicates were removed using the literature management software Endnote X9.3.3 after sorting the articles alphabetically by their title. Subsequently, the 2-step eligibility screening was carried out in Rayyan, 109 a Web app for collaborative systematic literature reviews, using the inclusion/exclusion criteria as provided in Table 1. Articles that had reported the prognostic value of the MC or MI (histologically determined) as a solitary prognostic test for potentially malignant tumor types in dogs were included. The artificial intelligence application in Rayyan was not used for this systematic review.
Summary of the inclusion/exclusion criteria for the 2 eligibility screening steps applied to the identified references.
A nonsystematic literature search in Google Scholar and the perusal of citing references (“cited by” search in Google Scholar) and cited references were conducted in 2022 for several weeks until 30 April 2022, resulting in a thorough evaluation of the available literature on prognostication of canine tumors. The nonsystematic literature search intended to find articles that were missed by the systematic search due to the lack of search terms being included in the title, abstract, or keywords of some articles. The search terms for Google Scholar were numerous and included “outcome,” “prognosis,” “survival,” and relevant tumor types such as “mast cell tumor,” “soft tissue sarcoma,” “melanoma,” and so on. The title and abstract of relevant articles (as sorted by Google Docs) were screened. The full text of articles of potential interest were downloaded and evaluated for the aforementioned eligibility criteria. Only articles that met these criteria were included. Finally, duplicates to the systematic literature search were excluded.
Data Extraction and Analysis
Information regarding the publication (paper identification, year of publication, journal), tumor type evaluated, measurement methods of the MC or MI, and prognostic value of mitotic activity was extracted from each article in the same way as previously described. 15 Statistical significance of the prognostic value was based on the reported P values with P ≤ .05 being indicative of significant results.
Risk of bias of each study was evaluated (low, moderate, and high) specifically for the information regarding the mitotic activity using a previously developed protocol 15 (Supplemental Table S1) for objectivity and transparency. The overall risk of bias was based on 4 domains: (1) study population, (2) outcome assessment, (3) mitotic activity methods, and (4) data analysis. As detailed in Supplemental Table S1, domain 1 (study population) was mostly based on the sample size per outcome event with a minimum of 7 events for a moderate risk of bias and 15 events for a low risk of bias, as well as the presumed representativeness of the study population and the availability of descriptions of the patient and tumor characteristics. The thresholds for the sample size were modified from the recommendations for multivariable statistical models (at least 10 cases per event for each variable), 158 considering that this systematic review evaluated mitotic activity as a solitary test and accounting for the small sample size available for studies on rare tumor types. Domain 2 (outcome assessment) evaluated the methods of obtaining patient outcome information (type of outcome metrics, follow-up method and period, and confirmation of events), as well as the potential bias resulting from treatment regimens of the patients. Domain 3 (mitotic activity method) was based on completeness of the methods description and the assumed consistency of the applied measurement methods for evaluation of the study cases. Domain 4 (data analysis) focused on the use of appropriate statistical analysis to measure prognostic accuracy of the MC and MI. 18
Results
Study Selection
The article identification and eligibility screening process are summarized in Fig. 1. Through the systematic literature search, 87 eligible articles out of 412 unique references were identified. Fifty additional articles were found during nonsystematic literature search, adding up to a total of 137 articles evaluated in this systematic review.1–3,5,7–11,17,19–21,23–29,31–37,39–42,44–49,52–65,69–75,78–84,86–92,96–108,111–123,125–141,143–151,153–157,159–166
Study Characterization
All of the included articles were written in English. One-third (42/137, 31%) of the publications were published in journals focused on veterinary pathology (Veterinary Pathology, Journal of Comparative Pathology, and Journal of Veterinary Diagnostic Investigation).
Based on the described methods, 126 articles evaluated the MC (number of mitotic figures per tumor area),2,3,5,7–11,17,19–21,23–29,31–37,39–42,44–49,52–65,69,70,72–75,78–84,86–92,96,99–108,114–123,125–127,129–132,134–137,139–141,143–151,153–157,159–163,165,166 5 evaluated the MI (proportion of mitotic figures per number of tumor cells),98,113,128,138,164 and 6 did not specify the mitotic activity method in their paper.1,71,97,111,112,133 We assume that the articles without method specification performed the MC based on the mitotic activity values reported in the “Results” section,71,111 the prognostic threshold used to classify cases,112,133 or because the mitotic activity was likely determined as part of a grading system, which uses MC (based on the original method descriptions).1,97 For 3 of those 6 studies, confirmation of the MC method was obtained through personal communications with the authors.1,111,112 Thus, these 132 articles (96.4%) were used for analysis of the MC. The number of articles published per year included in this review increased over time with more than 10 articles published per year between 2018 and 2021 (Fig. 2).
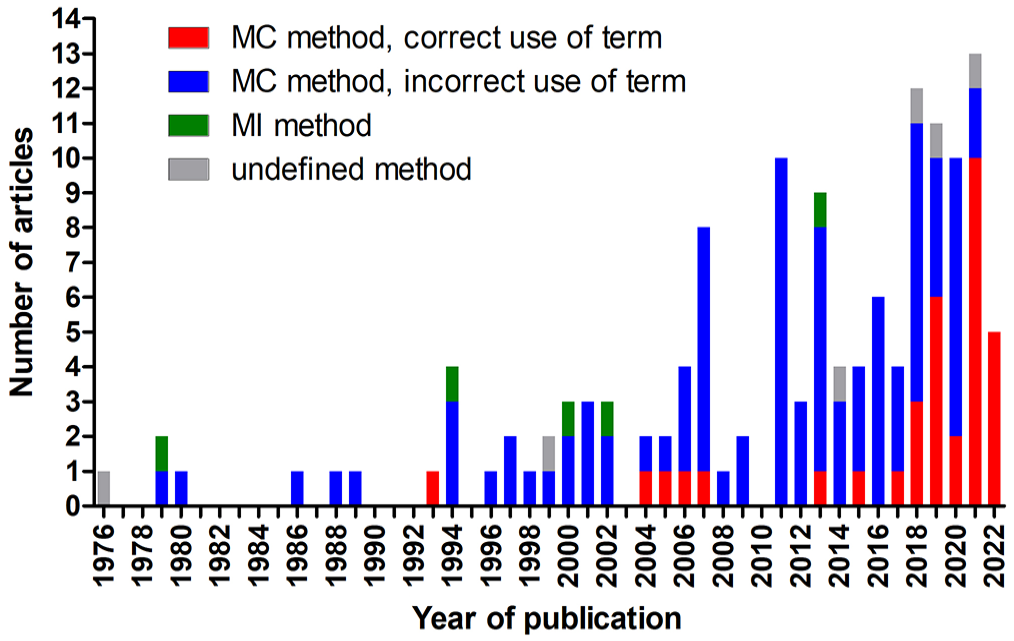
Stacked bar chart of the number of publications included in this systematic review per year of publication. The year 2022 includes publications until 30 April. MC, mitotic count; MI, mitotic index.
While the 5 references that determined the MI always used the preferred term “mitotic index,” the other 132 articles employing the MC used various and sometimes multiple terms, including mitotic index (N = 83), mitotic count (N = 40), mitotic rate (N = 13), number of mitoses (N = 3), number of mitotic figures (N = 1), number of mitotic cells (N = 1), mitotic figures (N = 1), and mitoses (N = 1). Since publishing recommendations on the terminology for MC in 2016, 95 the frequency of the use of correct terminology has improved. While only 12 of the 82 articles (15%) published before 2017 used the correct term, 28 of the 55 articles (51%) after 2016 used the recommended terminology (Fig. 2). Usage of the correct term after 2016 was even higher when the journal had a veterinary pathology focus (12/14, 86%) compared with other journals (16/41, 39%). Similarly, articles published in the journal focused on veterinary oncology (Veterinary and Comparative Oncology) reported the correct term for the MC more often after 2016 as compared with before 2017 (9/18 vs 0/10 studies, respectively).
Mitotic Count
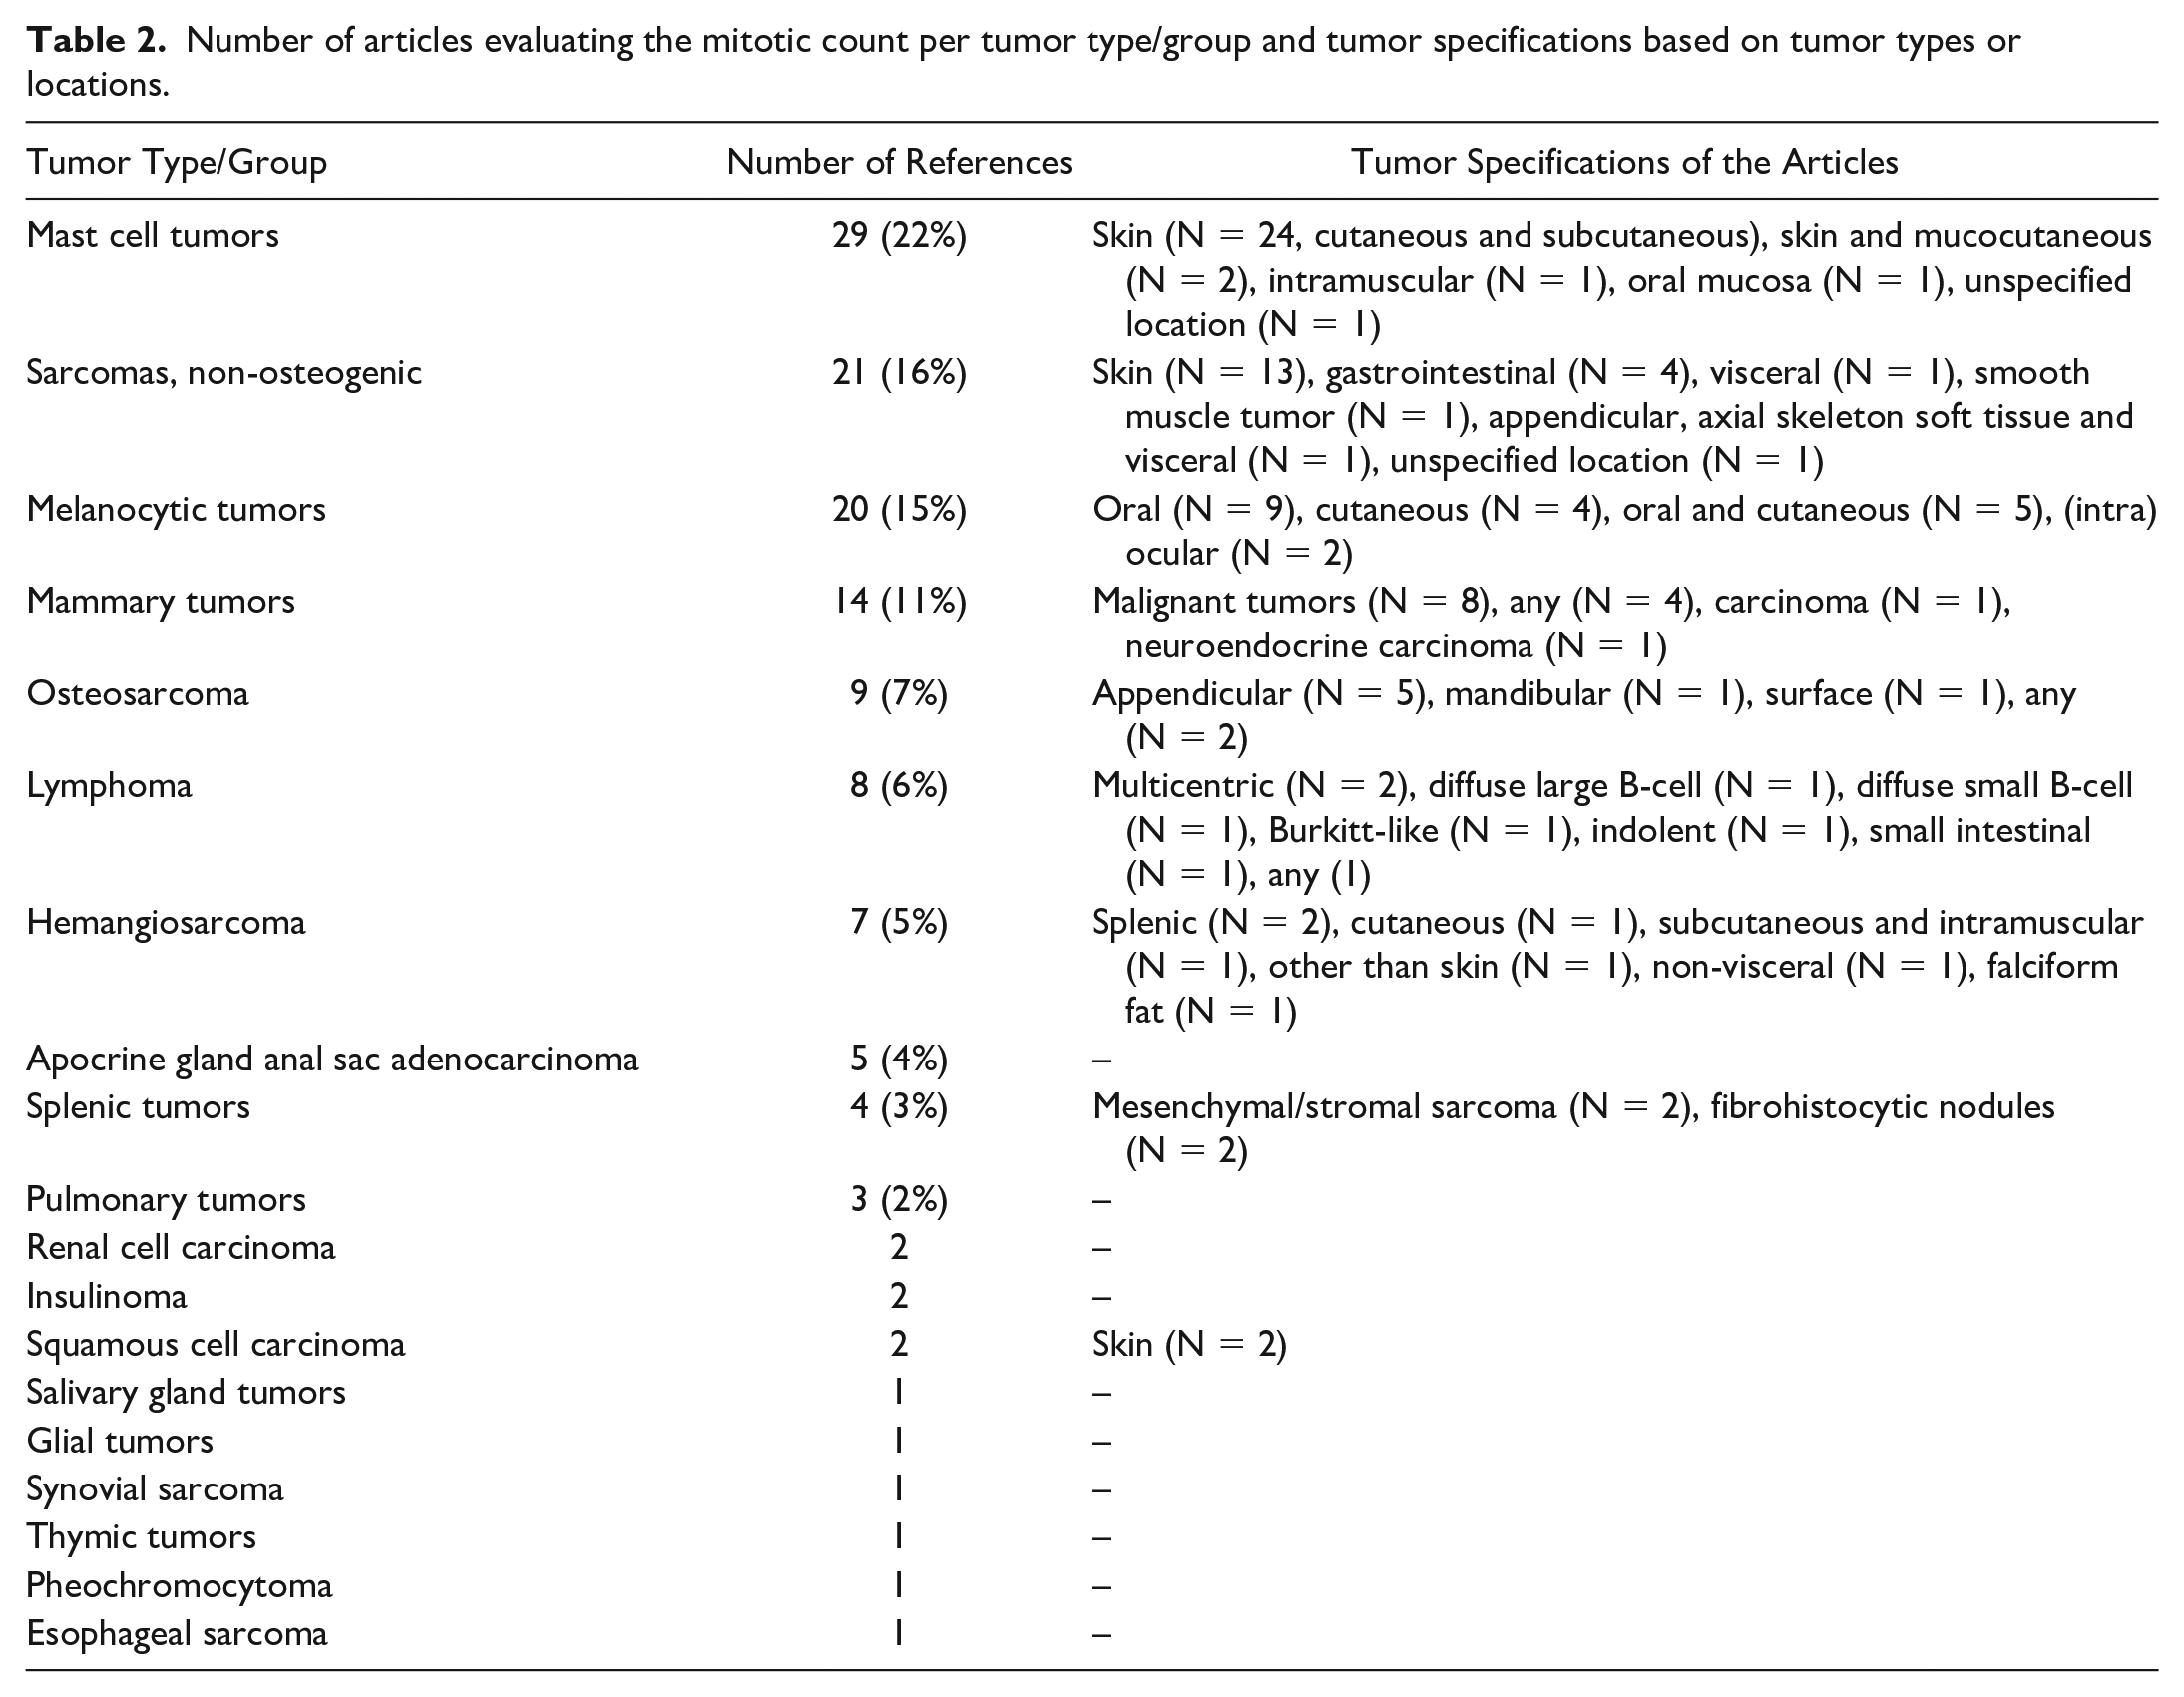
The 132 studies using MC evaluated numerous tumor types, while some studies included several tumor types or tumor locations or lacked relevant information on these tumor specifications (Table 2).
Number of articles evaluating the mitotic count per tumor type/group and tumor specifications based on tumor types or locations.
Risk of Bias
The risk of bias of each of the 4 domains and the overall risk of bias is summarized in Table 3 and listed for each reference in Supplemental Table S2. Most studies (70/132, 53%) had a high overall risk of bias based on a high risk in at least 1 of the 4 domains. One study included some feline cases in the study population, 132 which poses a high risk of bias as equality in the extent of the association of the MC with outcome between different species should not be expected. Data analysis (domain 4) was often restricted to a statistical test of significance, and in many studies, nonsignificant results were reported as “P > .05” or as “not significant,” while the actual P values were not provided (Supplemental Tables S5–S7).
Summary of the risk of bias evaluation for 132 studies on the mitotic count (MC) based on 4 risk of bias domains (D1—D4).
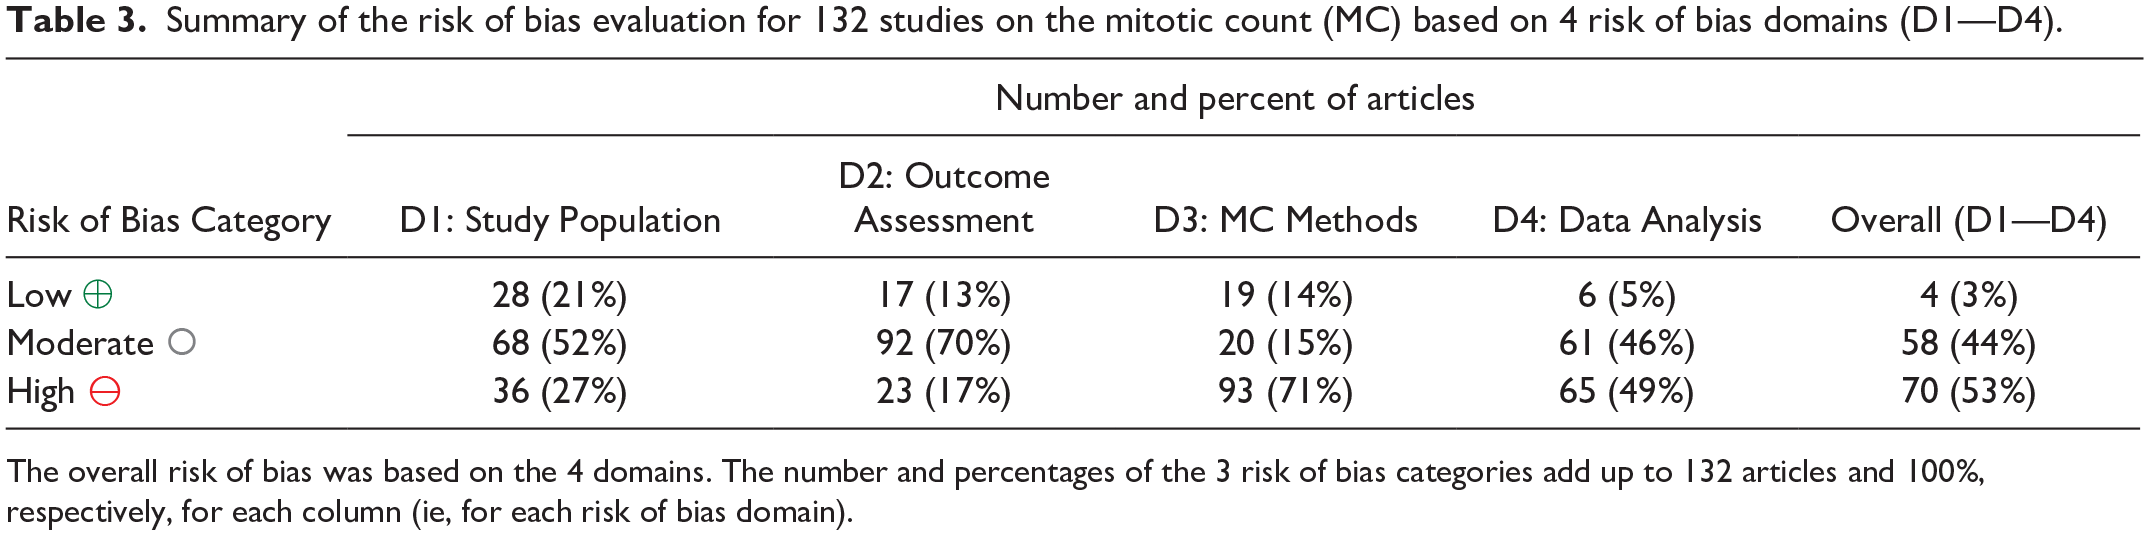
The overall risk of bias was based on the 4 domains. The number and percentages of the 3 risk of bias categories add up to 132 articles and 100%, respectively, for each column (ie, for each risk of bias domain).
Methods
The MCs were taken from pathology records in 19 of the 132 studies (14%), partially taken from pathology reports and newly determined in 2 of the 132 studies (2%), and likely newly determined by the same pathologist(s) for the study following the study protocol in the remaining 111 studies (84%). Multiple pathologists assessed all study cases in 20 of the 111 studies, most of which aggregated the multirater evaluations using various methods, including averaging and consensus. One study employed semi-quantitative scoring for assessing mitotic density, 92 while the rest enumerated mitotic figures. Special staining methods were used in 1 study (toluidine blue). 116 Seven of the 20 studies (35%) on melanoma specified that they used bleached slides (for all cases or for heavily pigmented cases), and 2 studies (10%) assigned an MC of 0 when nuclei were obscured by pigmentation. One study evaluated the MC in digital whole-slide images (20× and 40× scan magnification) and glass slides, 159 while the remaining studies are presumed to have used light microscopy. The use of automated image analysis was not reported in any study.
A summary of the key methodical aspects of the MC applied in the 132 studies is depicted in Fig. 3 and detailed for each study in Supplemental Table S3. Generally, the proportion of studies that reported the details on the MC methods increased for studies published after 2016 and in journals with a focus on pathology (see summary of Supplemental Table S3).
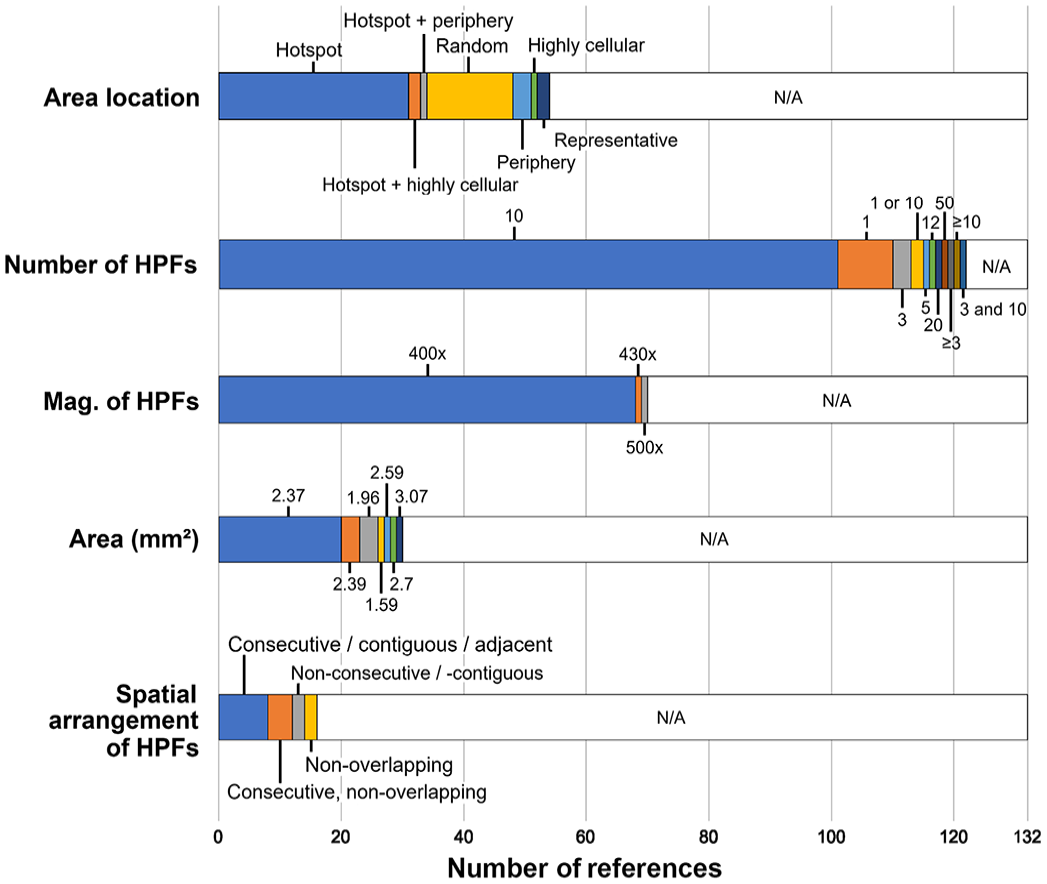
Stacked bar chart for the key methodical aspects of the mitotic count applied in the 132 studies. HPFs, high-power fields; Mag., magnification; N/A, not available.
Prognostic Value
The outcome metrics evaluated in the 132 studies were overall or tumor-specific survival (N = 113, 86%), disease progression (occurrence of metastasis or local recurrence; N = 40, 30%), metastasis (N = 26, 20%), recurrence (N = 22, 17%, particularly for soft tissue tumors), and recurrence of hypoglycemia in insulinoma (N = 2, 2%). The number of complete cases varied between 6 and 384 (median: 50 cases; mean: 64 cases). The prognostic relevance of the MC determined by different pathologists was only ascertained in 1 study, 130 whereas the other studies used MC values by 1 study pathologist or a consensus of pathologists.
For all tumor types/groups combined, a prognostic value (mostly determined using statistical significance) of mitotic activity was found in 55% to 63% of the studies regarding the different outcome metrics (Table 4 and Supplemental Tables S4–S7). The association of the MC with survival for the tumor types/groups with 3 or more studies is summarized in Fig. 4. However, the discriminant ability of the prognostic test could not be properly evaluated for many studies due to the lack of appropriate statistical analysis.
Summary of the prognostic significance (mostly comprising the P value approach) of 132 studies on the mitotic count regarding survival, disease progression (metastasis or recurrence), metastasis, and recurrence.
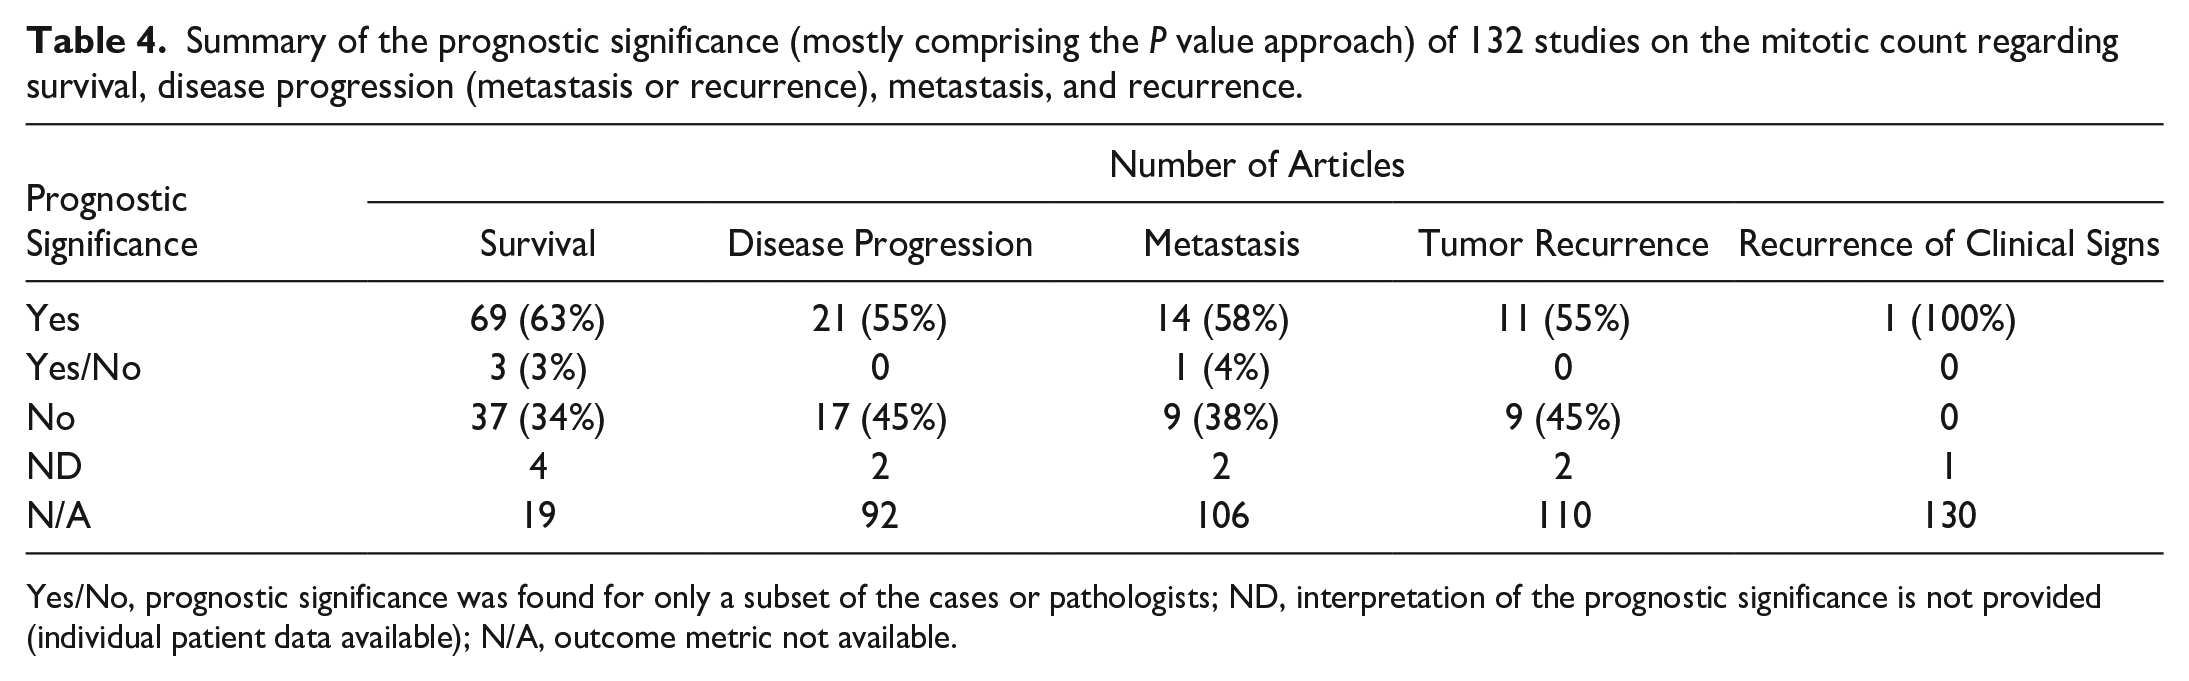
Yes/No, prognostic significance was found for only a subset of the cases or pathologists; ND, interpretation of the prognostic significance is not provided (individual patient data available); N/A, outcome metric not available.
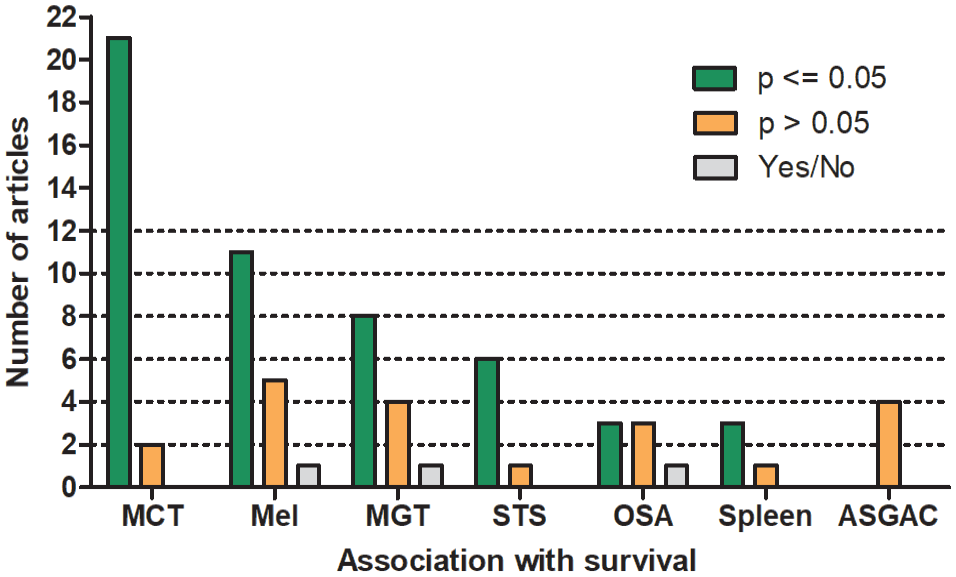
Number of studies that did or did not reach prognostic significance regarding the association of the mitotic count with survival for tumor types with more than 3 studies. Yes/No describes studies with significant association in only a subset of cases or pathologists. MCT, mast cell tumor of the skin (cutaneous and subcutaneous); Mel, cutaneous and oral melanoma; MGT, mammary gland tumors; STS, soft tissue sarcoma of the skin; OSA, osteosarcoma; Spleen, splenic stromal sarcoma and fibrohistiocytic nodules; ASGAC, anal sac gland adenocarcinoma.
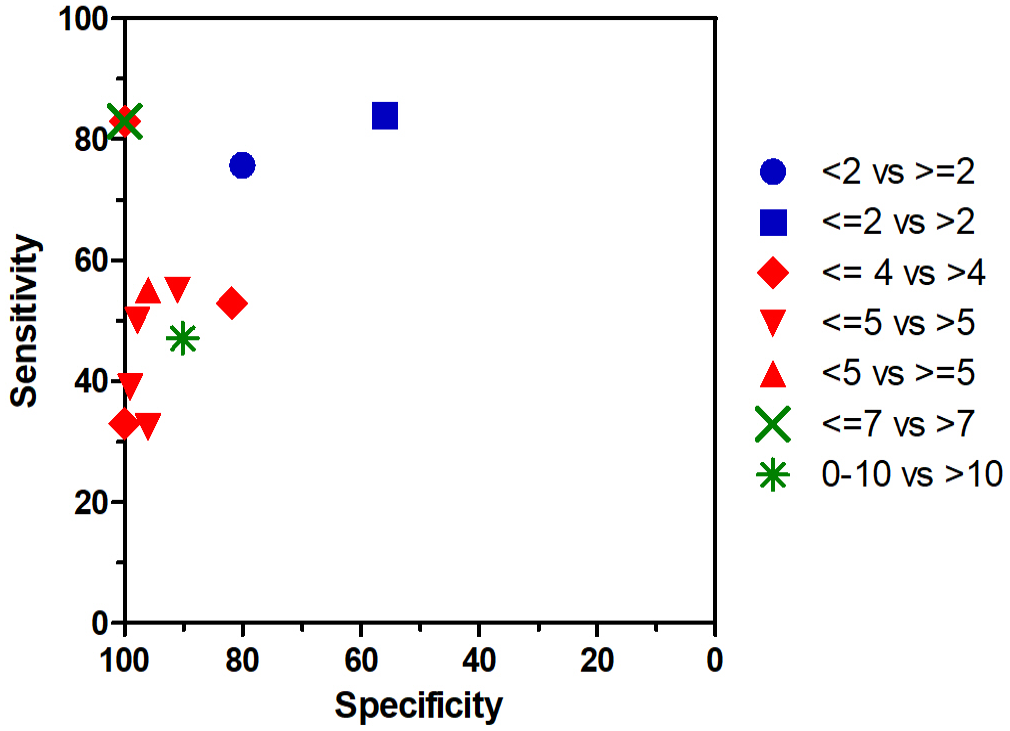
Survival was evaluated in 23 studies on mast cell tumors of skin (cutaneous and subcutaneous). A shorter survival was found for cases with higher MCs in 21 of 23 studies (91%), while the results in 2 of 23 studies (9%) did not reach statistical significance. A relevant discriminant ability of the MC is suggested by the area under the receiver operating characteristic curve values of 0.78, 0.79 and 0.82.10,62,155 The sensitivity and specificity values for the different proposed cutoff stratifications, reported in 9 individual studies, are illustrated in Fig. 5. Higher MCs were significantly associated with shorter disease-free intervals in 8 of 10 studies (80%) and with occurrence of metastasis or recurrence in 4 of 6 studies (67%).
For cutaneous and oral melanoma, higher MCs indicated shorter survival in 11 of 17 studies (65%). Interestingly, a prognostic significance was found in the analysis of only cutaneous melanoma in 4 of 5 studies (80%), analysis of only oral melanoma in 4 of 9 studies (44%), and analysis of both locations in 4 of 4 studies (100%). For cutaneous and oral melanoma, a good discriminant ability of the MC is inferred, based on the provided area under the curve values of 0.78 and 0.86.9,114 Shorter disease progression was significantly associated with higher MCs in 3 of 5 studies (60%).
Studies on soft tissue tumors of the skin and subcutis reached statistical significance regarding higher MCs and shorter survival in 6 of 7 studies (86%). The discriminant ability of the MC is not well demonstrated in these studies. Recurrence was associated with higher MCs in 7 of 10 studies (70%).
Studies on splenic stromal sarcoma and the former broader category “fibrohistiocytic nodules” found a significant prognostic association of higher MC values with shorter survival in 3 of 4 (75%) instances. The failure to reach significance in 1 study could be due to a small study population of 8 tumors.
MI: Risk of Bias, MI Methods, and Prognostic Value
The MI was determined in 5 studies that each evaluated a different tumor type: skeletal osteosarcoma, 98 multicentric lymphoma, 113 malignant mammary tumors, 128 mast cell tumors of the skin, 138 and aortic body tumors. 164 The overall risk of bias of these articles was judged to be high (n = 4) or moderate (n = 1), particularly pertaining to the data analysis domain (Supplemental Table S8).
The MI determination methods varied among studies. Four studies described the staining method, of which 2 used hematoxylin and eosin,113,164 1 employed toluidine blue, 128 and 1 utilized anti-Proliferating Cell Nuclear Antigen (PCNA) immunolabeled slides. 138 The proportion of mitotic figures was calculated among various numbers of tumor cells: 500, 113 1000 (in PCNA hotspot 138 or peripheral areas 98 ), at least 10,000, 164 and all cells within 10 hotspot high-power fields (at 25× magnification). 128 Two studies created photomicrographs for counting,128,164 with 1 also using software for cell number estimation. 128
None of the studies reached statistical significance for the association of the MI with survival time (N = 2), metastasis (N = 3), or relapse-free interval (N = 1; Supplemental Table S9). Only 1 study on mast cell tumors of the skin determined that higher MIs were significantly associated with tumor recurrence. 138
Discussion
The prognostic relevance of mitotic activity has been evaluated in many studies on canine tumors, enabling this extensive systematic review. Canine studies on this topic were more numerous than feline studies, encompassing more than 3 times the numbers of articles, 15 and studies for other animal species are almost nonexistent.6,67 This underscores an apparently greater research interest in canine tumors. Nevertheless, the findings of this systematic review on canine tumors were similar to the findings of the previous systematic review on feline tumors regarding the risk of bias in the studies. 15 For many tumor types, the prognostic relevance of mitotic activity is still not convincingly proven, considering the study limitations and lack of validation studies, as will be discussed below. Since our literature search for this systematic review, several articles on the MC have been published,14,22,30,38,50,51,66,76,77,85,124,152 and the number of new references is expected to markedly increase with time, given the enormous increase of research interest over the last decade. Repetition of this systematic review will be required when new evidence-based literature allows new conclusions to be drawn on the prognostic value of the MC and MI in canine tumors.
The MC reflects the routine method of measuring mitotic activity with microscopic tumor evaluation. However, a wide variety of MC methods have been applied in previous studies, and often the methods have not been described in sufficient detail. Each study should describe the key aspects of the MC methods, including the selection of the region of interest, the area (in mm2) assessed, and the spatial arrangement of fields evaluated. While the best method regarding reproducibility and prognostic ability is currently unknown, standardization, as previously proposed, 94 may improve comparability between studies and unify the diagnostic workflow for different tumor types, that is, diagnostic pathologists need to apply the MC methods described in the study upon which they base their prognostic interpretation. However, future studies are needed to determine which of these methods have the highest prognostic value and reproducibility between pathologists. 130
Many laboratories have completely switched to digital microscopy 16 and despite the lack of fine focus in digital images (unless scanned with z-stacking), high consistency with light microscopy has been shown for MCs by several studies. 43 Nevertheless, only a few prognostic studies on canine tumors have used digital microscopy and associated the digital counts with outcome.14,159 Digital microscopy has particular requirements when quantifying mitotic activity formerly based on light microscopy, such as the differences in size of high-power fields, which is dependent on the monitor size and display resolutions.16,68 Further studies are needed to determine the minimum quality of digital images (resolution and so on) to ensure that mitotic figures are not confused with imposters (such as necrotic cells) and whether the established prognostic thresholds are appropriate. However, digital images also introduce new possibilities for standardized assessment of mitotic figures, such as counting tools in viewing software and image analysis algorithms.12,13 In particular, deep learning–based algorithms are considered promising for improving time efficiency, reproducibility, and accuracy for this task (computer-assisted MCs),4,12 and further research on the reliable application of these algorithms and the prognostic benefit as compared with the routine approach is needed.
Tumor cell proliferation is 1 key driver of tumorigenesis, and thus, the MC is often assumed to correlate with outcome. However, a surprisingly high proportion of studies did not find a prognostic value (using hypothesis testing) for the MC in canine tumors. It should be noted that interpretation of these results is difficult because many studies restricted their analysis to tests of significance (P value approach), which cannot be used to establish a prognostic value (effect size) or lack thereof. 18 A P value above .05 could still indicate a useful prognostic value, particularly if the study population and/or event rate available for analysis was low. Not providing the actual P value (instead “not significant” or “P > .05” is often reported) hinders interpretation and comparison of the data. We recommend correlating the MC with relevant endpoints by multiple statistical methods including the Kaplan-Meier curves, hazard ratios, sensitivity, and specificity. Cutoff agnostic methods, like receiver operating characteristic curves and their area under the curves, are particularly preferred. 18
Of note, conflicting findings between studies were found for most of the evaluated tumor types/groups. This highlights the general high risk of bias of observational studies and the need for several validation studies before sufficient evidence of the prognostic value of the MC can be guaranteed. Possible explanations for the lack of prognostic relevance in these studies include small study populations, heterogeneous tumor groups (different tumor entities or locations), variable MC methods, and, as discussed above, flawed statistical methods. While we used uniform thresholds to evaluate the risk of bias of the size of the study population, an appropriate sample size used for a study may vary from our criteria based, among others, on the incidence of the tumor. A small study population (defined as including <7 events for our risk of bias criteria) will have the risk of not being representative for the tumor type regarding the association between histological features and biological behavior. However, even studies with a larger study population (defined as including ≥15 events for our risk of bias criteria) have potential sources of bias and the results need to be validated by subsequent studies that use an independent study population.
We have noted that the results for the prognostic relevance of the MC were quite variable between different studies (as demonstrated for mast cell tumors). Besides the aforementioned limitations, the differences in the results can be explained by variability between pathologists in assessing the MC. While a high degree of inconsistency between pathologists has been shown by several studies,4,12,13,159 the influence on prognostication is largely unexplored. 130 For example, it has been determined that some pathologists have a higher sensitivity (as opposed to precision) when distinguishing mitotic figures from imposters resulting in higher MCs, whereas other pathologists have a higher precision (as opposed to sensitivity) resulting in lower MCs.4,12 We argue that this variability between pathologists might have an important influence on the prognostically most meaningful cutoff values, possibly resulting in unexpected performance of the prognostic test when applied routinely by various pathologists in a diagnostic setting. A particularly high degree of divergence in prognostic classification can be expected for tumors with borderline mitotic activity and a patchy distribution throughout the tumor section. 13 Several studies included in this systematic review used multiple pathologists to determine the MC values for each case; however, only 1 study compared the prognostic ability of the individual pathologists’ evaluations. 130 Further studies on this topic are needed to better understand the impact of a realistic routine diagnostic setting as compared with a standardized research setting with 1 pathologist. We strongly recommend the appropriateness of prognostic thresholds be validated by multiple pathologists and new approaches/methods to improve interobserver reproducibility, such as interlaboratory training and ring trials or computer-assisted assessment, be developed and evaluated. 12
Based on our systematic review, we conclude that the MC has a prognostic value for canine mast cell tumors of the skin, cutaneous melanoma, soft tissue tumors of the skin and subcutis, and splenic stromal sarcoma. Thus, determination of the MC is recommended during routine diagnostic evaluation of these tumor types. While the discriminant ability seems to be good for mast cell tumors of the skin10,62,155 and cutaneous melanoma, 114 it requires further evaluation for the other tumor types. The results for oral melanomas are inconsistent between studies; however, those studies with a lower risk of bias and appropriate analysis of discriminant ability suggest a prognostic value of the MC.7,24,59,117,118,156,159 For anal sac gland adenocarcinoma, the MC truly seems to have little prognostic value based on several studies.103,115,141,147 The results for the prognostic value of the MC are conflicting and not sufficiently supported by statistical analysis of discriminant ability for mammary tumors,25,26,28,29,40,41,45,81,84,98,119,126,127 and osteosarcoma2,34,35,58,99,123,130 and unproven for all the other tumor types considering the lack of validation studies.
In contrast to the MC, the MI has been rarely evaluated in the literature, which is most likely explained by the inability to apply this to routine diagnostic service. Improved time efficiency of the MI assessment, and thus applicability for routine diagnostics, may be achieved in the future through the use of automated image analysis for tumor cell enumeration. It seems logical that the mitotic activity measurement is more representative for the case when set in relation to the cellular density, particularly in tumor types (such as mammary carcinoma) that exhibit variable cellular density due to extensive extracellular matrix, cystic spaces, inflammation, or edema. Surprisingly, the few studies on canine tumors that evaluated MI did not find a significant association with survival or metastasis, in contrast to the studies on feline mammary tumors. 15 However, the canine studies did not compare the MI with the MC, and validation studies for each tumor type are not available.
Conclusions
Mitotic activity is a relevant prognostic test that has been evaluated in many studies on canine tumors. While the MI is rarely determined and its prognostic value is largely unexplored, the discriminant ability of the MC with regard to patient outcome has been well demonstrated in some canine tumors (particularly mast cell tumors of the skin, cutaneous and oral melanoma, and soft tissue tumors of the skin and subcutis). Limitations of current studies include small case numbers, combined evaluation of heterogeneous tumor groups, unavailable details of the MC methods, statistical analysis restricted to the P value approach (often without reporting the actual P value), and prognostic cutoffs based on single pathologist’s evaluations. Repetition of this systematic review will be needed in several years to update conclusions and recommendations. We highlight the need for development and validation of methods that improve observer reproducibility, such as deep learning–based algorithms (computer-assisted prognosis).
Supplemental Material
sj-pdf-1-vet-10.1177_03009858241239565 – Supplemental material for Mitotic activity: A systematic literature review of the assessment methodology and prognostic value in canine tumors
Supplemental material, sj-pdf-1-vet-10.1177_03009858241239565 for Mitotic activity: A systematic literature review of the assessment methodology and prognostic value in canine tumors by Christof A. Bertram, Taryn A. Donovan and Alexander Bartel in Veterinary Pathology
Footnotes
Authors’ Contributions
CAB, TAD, and AB designed the experiment; CAB performed the systematic review; CAB performed data extraction from the articles; and the manuscript was written by CAB with contributions by all authors.
Declaration of Conflicting Interests
The author(s) declared no potential conflicts of interest with respect to the research, authorship, and/or publication of this article.
Funding
The author(s) received no financial support for the research, authorship, and/or publication of this article.
Supplemental material for this article is available online.
References
Supplementary Material
Please find the following supplemental material available below.
For Open Access articles published under a Creative Commons License, all supplemental material carries the same license as the article it is associated with.
For non-Open Access articles published, all supplemental material carries a non-exclusive license, and permission requests for re-use of supplemental material or any part of supplemental material shall be sent directly to the copyright owner as specified in the copyright notice associated with the article.