
Abstract

Mitotic activity is a widely used criterion for assessing cancers in animals and humans. The value of counting mitotic figures in a histologic section to estimate mitotic activity has withstood the test of time and new techniques. It is a common component of most tumor grading systems and, for a few tumors, may be an independent prognosticator. Aggressive neoplasms have a high proliferation rate, and this is reflected in high numbers of mitotic figures in histologic sections; of course, there are exceptions (eg. cutaneous histiocytoma). Most studies in veterinary oncology report mitotic index (MI) when counting mitotic figures, but MI is defined imprecisely and at times incorrectly. Counting the number of mitotic figures in 10 consecutive high-power fields (hpf) results in a mitotic count (MC). Mitotic activity index (MAI) is reported as an index (the MC/area counted). 7,10 Mitotic count is determined most frequently in veterinary pathology, usually at 400× magnification, but the area counted is seldom defined, and the term often reported is mitotic index. Mitotic index is defined as the number of cells undergoing mitosis divided by the number of cells not undergoing mitoses. This can be determined in histologic sections or cell suspensions and is reported as a percentage, or mitoses per 1000 neoplastic cells. Mitotic activity can also be determined in a specified area or volume of tumor and is expressed as number of mitotic figures per given volume of tumor. MI correlates with other proliferative indices better than MC or MAI. 7 However, determining MI would require counting cells not in mitosis.
We should use MC since this will align our estimates of mitotic activity with the most frequently used parameter reported in human cancers and with automated imaging systems. Furthermore, it is what we presently do. Automated systems report mitotic activity as MC or MAI. 4 If we wish to compare results of mitotic counts, we need to standardize the area in which mitotic figures are counted. The specification of the final magnification (400×) does not adequately define the area of cells counted as the total field area could vary by a factor of 33% or more depending on the field number (FN) of the ocular. The area in which mitotic figures are counted is one of the factors that can be standardized. 1,4,7,10 We prefer the term MC for a static descriptor and propose that MC be determined and reported for 2.37 mm2. Furthermore, publications in the veterinary literature need to define more precisely the area in which MC was determined using these terms.
The actual size of the field seen with a high-power objective (40×) varies with the field number (FN) of the ocular. The diameter in a field of view (FOV) with a light microscope is calculated by: FN (mm on ocular)/objective magnification = mm diameter of one field (Table 1). The limiting factor that determines the diameter width in the FOV is the narrowest diaphragm (stop) in the path of vision (light). In light microscopes this is the ocular eyepiece. If other devices are added to the eyepiece or the path of light (tube lens) this will change the FOV. For light microscopes manufactured in the last 20 years for pathologist use infinity lenses with no tube lens and ocular of FN 22 mm or 20 mm are standard. Using an ocular FN 22 mm (most common) the area of a “high power (40×) field” = 0.237 mm2. Therefore 10 hpf = 2.37 mm2 as our proposed area for MC. Table 1 illustrates calculation of the field area of 10 high-power fields using these parameters and provides guidelines to adjust counts made with different oculars to obtain an area of 2.37 mm2. An online source for this information is footnoted with the references.
Standardized Area for Mitotic Counts Using a Microscope (Replacing 10 High-Power Fields With a Consistent Area).
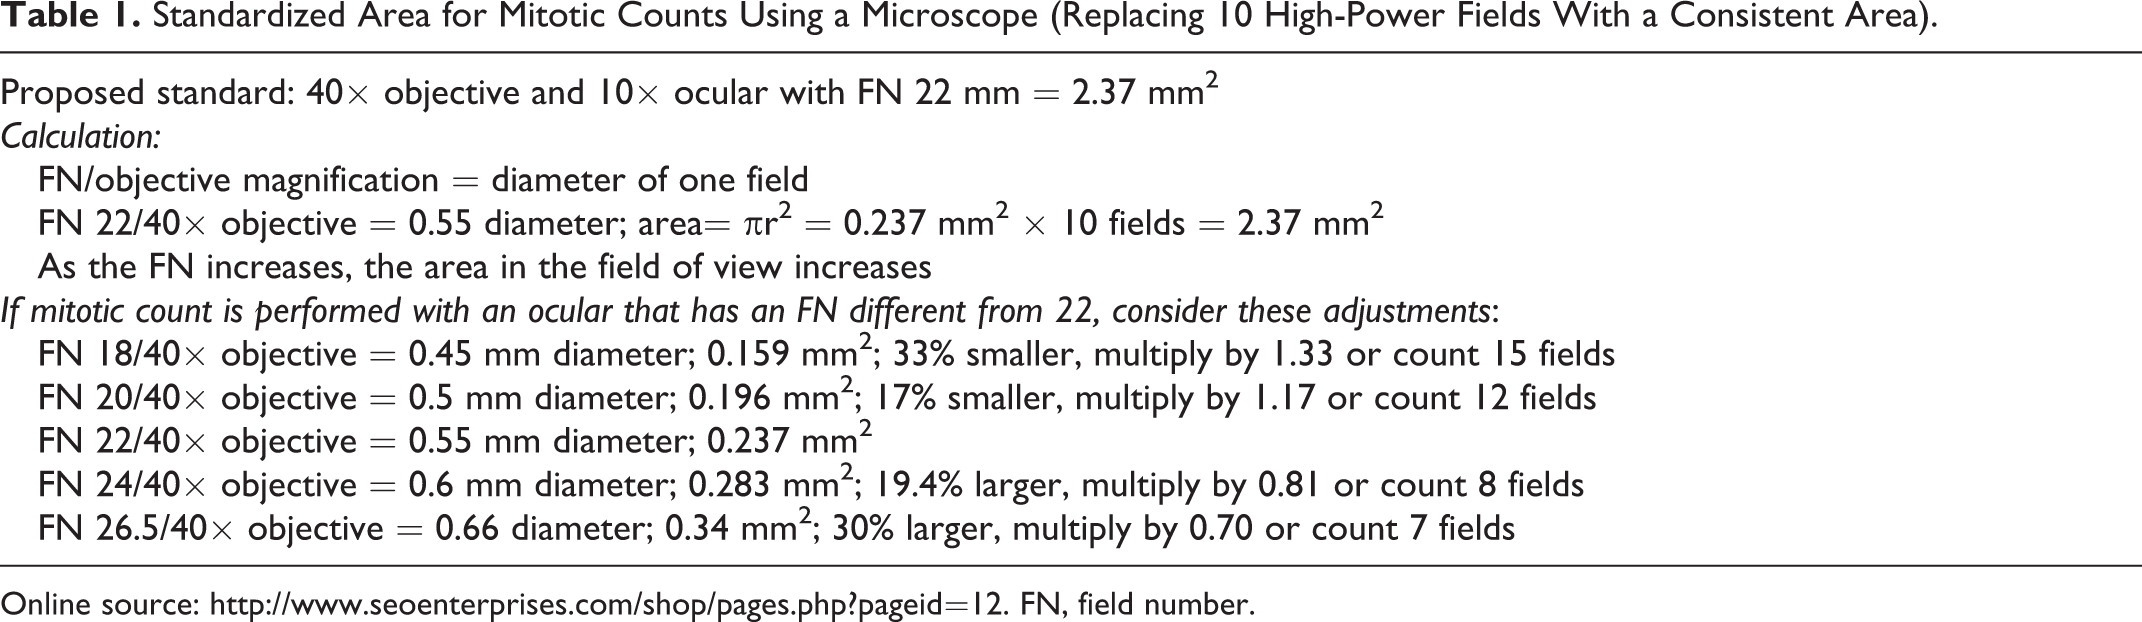
Online source: http://www.seoenterprises.com/shop/pages.php?pageid=12. FN, field number.
In newer microscopes, the 2 most common FNs are 20 and 22, and the difference in area with these 2 oculars, with a 40× objective, is approximately 17%. If 10 mitoses were seen in 10 fields with a 40× objective and a 10× ocular that has an FN of 20, then mathematically there would be 11.7 in 10 fields with a 40× objective and a 10× ocular that has an FN of 22. For oculars with FNs that are close, such as 20 and 22, the difference in the field of view area is not great, but if the FN in one ocular was 18 and another was 26.5, the difference is approximately 0.159/0.34 = 47%. The area in an ocular with an FN of 18 is 47% smaller (half) than the area in an ocular with an FN of 26.5 and 40× objective. In theory, one would see half as many mitotic figures in 10 hpf with an ocular FN of 18 compared with 10 hpf with an FN of 26.5. Obviously, the impact on MC would be large. This confounder can be controlled for by standardizing the field of view area in which mitoses are enumerated.
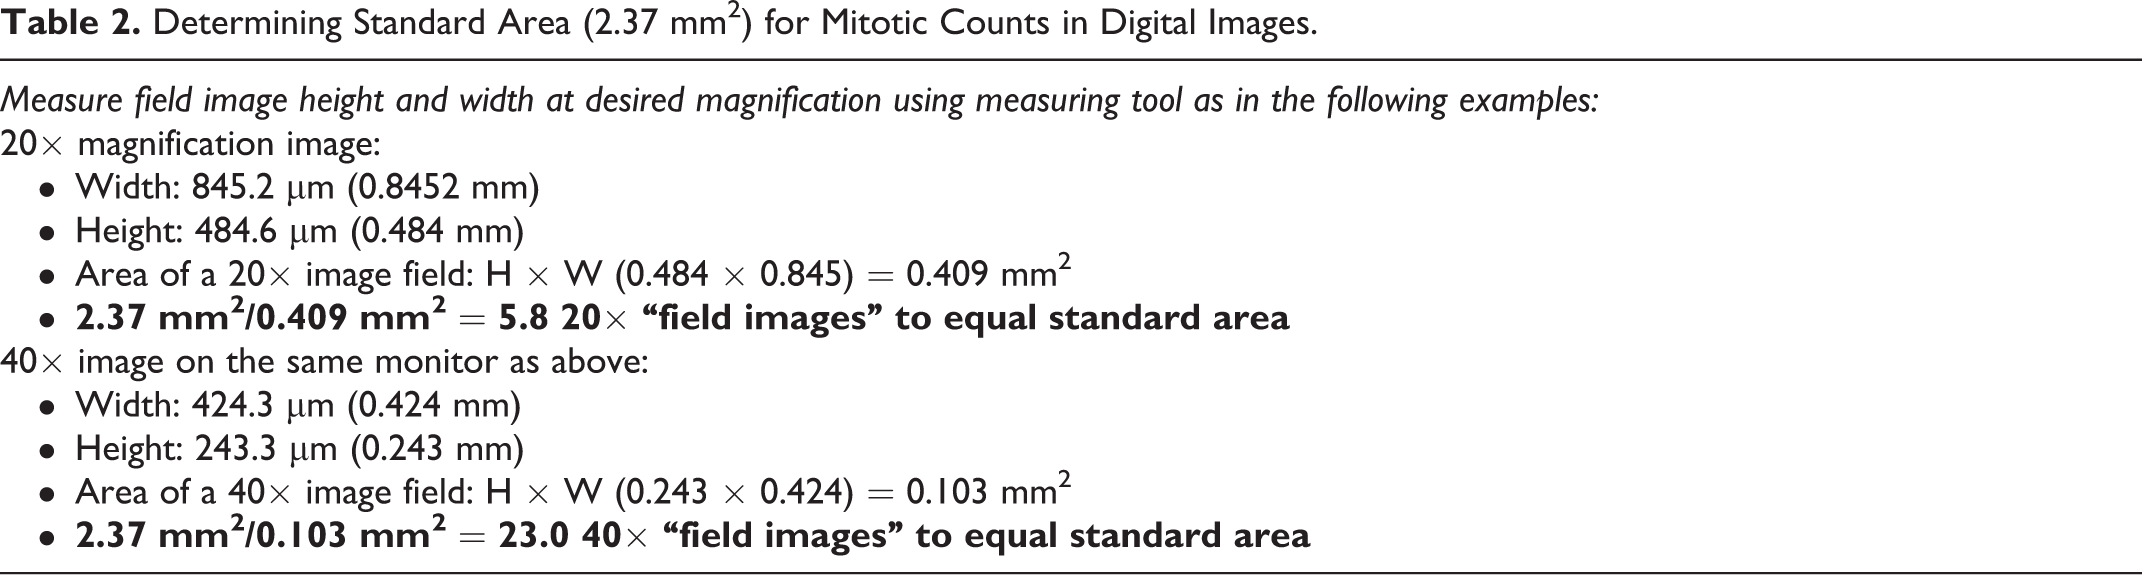
As review of digital images in place of microscopic sections has become commonplace, establishment of a standard area in place of “high-power field enumeration” has become even more imperative. The field of view of digital images depends not only on the magnification but also on the size of the viewing monitor. Calculation of field of view area is fairly simple (Table 2). The slide micrometer or measuring tool provided in the software program can be used to measure the length and width of the field of view and using the calculation for area of a rectangle (length times width = area). Measure the image on your screen, multiply H × W, convert to millimeters, and divide 2.37 by the number you get to equal the number of fields that equate to the standard area (2.37 mm2) at that particular magnification (see Table 2 for examples). The measuring tool or slide micrometer can be validated by measuring a standard area by both the measuring tool and a standard micrometer or by capturing an image of a micrometer for comparison with the slide micrometer displayed on the image.
Determining Standard Area (2.37 mm2) for Mitotic Counts in Digital Images.
The criteria for inclusion of mitotic figures in MC needs clarification. 9 Mitotic figures include nuclear aggregates that do not have a nuclear membrane and that have definite hairy projections of nuclear material (chromosomes). 10 If the chromosomal aggregates are closely situated in 2 distinct clumps (telophase), count as 1, but automatic systems may count telophase mitotic figures as 2. The latter depends on how far apart the chromosomal aggregates are and how the automated imaging system is “trained.” 4 Apoptotic and pyknotic structures should not be enumerated.
In addition to standardizing the size of the area counted, the histologic features of the counting area need definition. The MC should reflect the most densely cellular areas of the neoplasm and not include areas made cell poor by necrosis, hemorrhage, cysts, edema, artifacts, or fibrosis. If an adjacent field has considerable amounts of one of these features, then skip to another field. Multiple references suggest counting near the periphery of the tumor as this region has better fixation and should be the more proliferative and invasive. 2,3,10 When strict criteria of field area, counting regions, and mitotic figures are used, consistent results for MC can be obtained. 5,9,10
Each technique that estimates cell proliferation has advantages and disadvantages. MC is easy, rapid, and economical for diagnostic pathologists to determine and has been shown to have predictive clinical value as part of grading schemes. 5 –8 Standardization of MC may increase the utility of this parameter. However, all proliferative indices are only estimates of in vivo proliferation, a fact that needs to be emphasized to clinicians and oncologists who may apply too much influence to the MC, especially when it is close to an established cutoff. Thresholds (cutoffs) for MC were derived from and are used to help predict how a population of the same tumor may behave but cannot predict how an individual tumor in an individual animal will behave, a version of theranostics. There are no guarantees that the data from a study population will be applicable to reference populations. Thresholds for MC are the result of statistical models. These models may not be sufficiently sensitive to control for the many confounders within a population of animals, owners, and pathologists, each of which may affect the data and clinical outcomes (eg, the MC can be 3-fold higher in a resected specimen of breast cancer compared with a biopsy specimen from the same tumor). 2
If the MC is 0 or if a MC is very high (30), there will be little or no impact of using an ocular FN of 20 or FN of 22. The grade based on MC is not likely to change significantly in these extremes. Furthermore, there are exceptions such that a tumor with an MC of 0, or one that was designated low grade 8 behaved in an aggressive fashion; and the reverse is true, tumors with a high MC and/or high grade designation have long survival times. 5 This is biology, and other factors besides MC influence tumor behavior. These estimates of MC are of the greatest concern when the MC is close to a published threshold/cutoff, warranting caution in the use of any one criterion in assessing tumor grade. The count should be repeated 3 times for “uniformity,” and if the final number remains close to a cutoff, then consider other parameters established for that tumor. Staging is considered the best criterion for prognosis or selection of treatment plans, and staging is performed by the clinician from additional data.
If MC is to remain an integral part of tumor grading schemes, it is long past time to standardize this process. 1 –4,7,10 “Agreeing” to a field area of 2.37 mm2 is a start.