
Abstract
Objective
This study aimed to compare bone metabolism markers between patients with hip fracture who had and did not have type 2 diabetes mellitus (T2DM).
Methods
A total of 743 patients with hip fractures were enrolled in this case–control study and were further divided into T2DM and non-T2DM groups. Biochemical parameters, including fasting blood glucose, triglycerides, and total cholesterol, and bone metabolism parameters, including total serum procollagen type N-terminal propeptide and age-related type I cross-linked C-telopeptide, were collected and compared. Correlations between fasting blood glucose and triglyceride levels and bone metabolism parameters were assessed via Spearman correlation analysis.
Results
The fasting blood glucose and triglyceride levels in the T2DM group were significantly higher than those in the non-T2DM group. In addition, the total serum procollagen type N-terminal propeptide and age-related type I cross-linked C-telopeptide levels in the T2DM group were significantly lower than those in the non-T2DM group.
Conclusions
The fasting blood glucose levels were negatively correlated with the total serum procollagen type N-terminal propeptide and age-related type I cross-linked C-telopeptide levels. In addition, our study speculated that good glycemic control may be beneficial for bone metabolism.
Introduction
Type 2 diabetes mellitus (DM) (T2DM) is one of the most prevalent endocrine metabolic disorders, characterized by impaired insulin secretion and chronic hyperglycemia. The increasing prevalence of T2DM has imposed a substantial burden on the social and financial systems. 1 It has been reported that approximately 1.3 million deaths worldwide were associated with DM in 2008, with approximately 347 million individuals affected globally. 2 Meanwhile, osteoporosis is another chronic metabolic disease characterized by deterioration of bone microstructure, reduced bone mass, imbalance in bone metabolism, increased bone fragility, and an elevated risk of fractures. 3 Although each disease has been extensively studied, increasing attention has been directed toward their interconnection.
Numerous studies have demonstrated a close association between T2DM and osteoporotic fractures.4–9 Vestergaard 8 reported that the relative risk of hip fracture was 1.38 in patients with T2DM compared with that in controls. A recent multistate cohort study demonstrated that patients with T2DM had an increased risk of hip fracture and post–hip fracture mortality. The hazard ratio for hip fracture was 1.24 in men and 1.48 in women with T2DM compared with that in controls. 9 In addition, increased bone fragility in patients with T2DM may be attributed not only to reduced bone mineral density but also to imbalances in bone metabolism. 10
Bone metabolism is a dynamic process involving osteoblast-mediated bone formation and osteoclast-mediated bone resorption.11,12 Physiologically, bone tissue is constantly renewed through a balance between osteoblastic bone formation and osteoclastic bone resorption. Bone fragility and osteoporosis occur when bone formation is suppressed and bone resorption is excessively activated. After the occurrence of an osteoporotic fracture, osteocytes at the fracture site, damaged periosteum, and surrounding cells undergo necrosis, after which osteoclasts resorb necrotic bones and generate new bones to promote fracture healing. During these physiological processes at the fracture site, bone metabolism markers reflect the overall dynamics of fracture healing. Bone metabolic indices are some metabolites generated during bone remodeling and are classified into markers of bone formation and bone resorption. As markers of bone formation and bone resorption, their serum concentrations reflect bone remodeling and bone remodeling activity and are often associated with an increased risk of fracture.
Various bone metabolism markers have been used to reflect the current state of bone metabolism. Among these markers, total serum procollagen type N-terminal propeptide (TP1NP), age-related type I cross-linked C-telopeptide (CROSSL), and 25-hydroxyvitamin D (25OHD) are classic and commonly used parameters. 13 In addition, numerous studies have demonstrated the association between glucose and bone metabolism.14–16 A recent study reported that young and middle-aged men with T2DM exhibited a lower bone turnover state compared with controls. 14 Another study confirmed decreased levels of both bone metabolism markers—TP1NP and CROSSL—in patients with DM. 8
Most studies have focused on the effects of T2DM on osteoporotic fractures and bone metabolism. However, the impact of T2DM on bone metabolism after hip fractures remains unclear. In this study, patients with hip fractures were enrolled. This study aimed to compare bone metabolism markers between T2DM and non-T2DM patients following hip fracture, which may allow for improved treatment and management of hip fractures.
Materials and methods
Participants
This study was a retrospective study that enrolled 1011 patients with hip fracture between August 2014 and August 2020. Participants with missing data (n = 164) on basic clinical information were excluded. An additional 101 patients were excluded according to the following exclusion criteria: (a) bone metastases; (b) osteochondropathy; (c) rheumatic diseases; (d) endocrine disorders such as primary hyperparathyroidism and thyroid dysfunction; and (e) use of medications, such as glucocorticoids and alendronate sodium, that influence bone metabolism intake. The final study population comprised 743 patients with hip fracture (Figure 1). According to the presence of a history of DM, patients were classified into T2DM group (n = 118) or non-T2DM group (n = 625). This case–control study was approved by the Ethics Committee and Institutional Review Board of the First Affiliated Hospital of Soochow University (NO. SUDA2023078). All patient details were fully deidentified. This study was conducted in accordance with the Declaration of Helsinki (1975, as revised in 2024). The reporting of this study conformed to the Strengthening the Reporting of Observational Studies in Epidemiology (STROBE) guidelines. 17
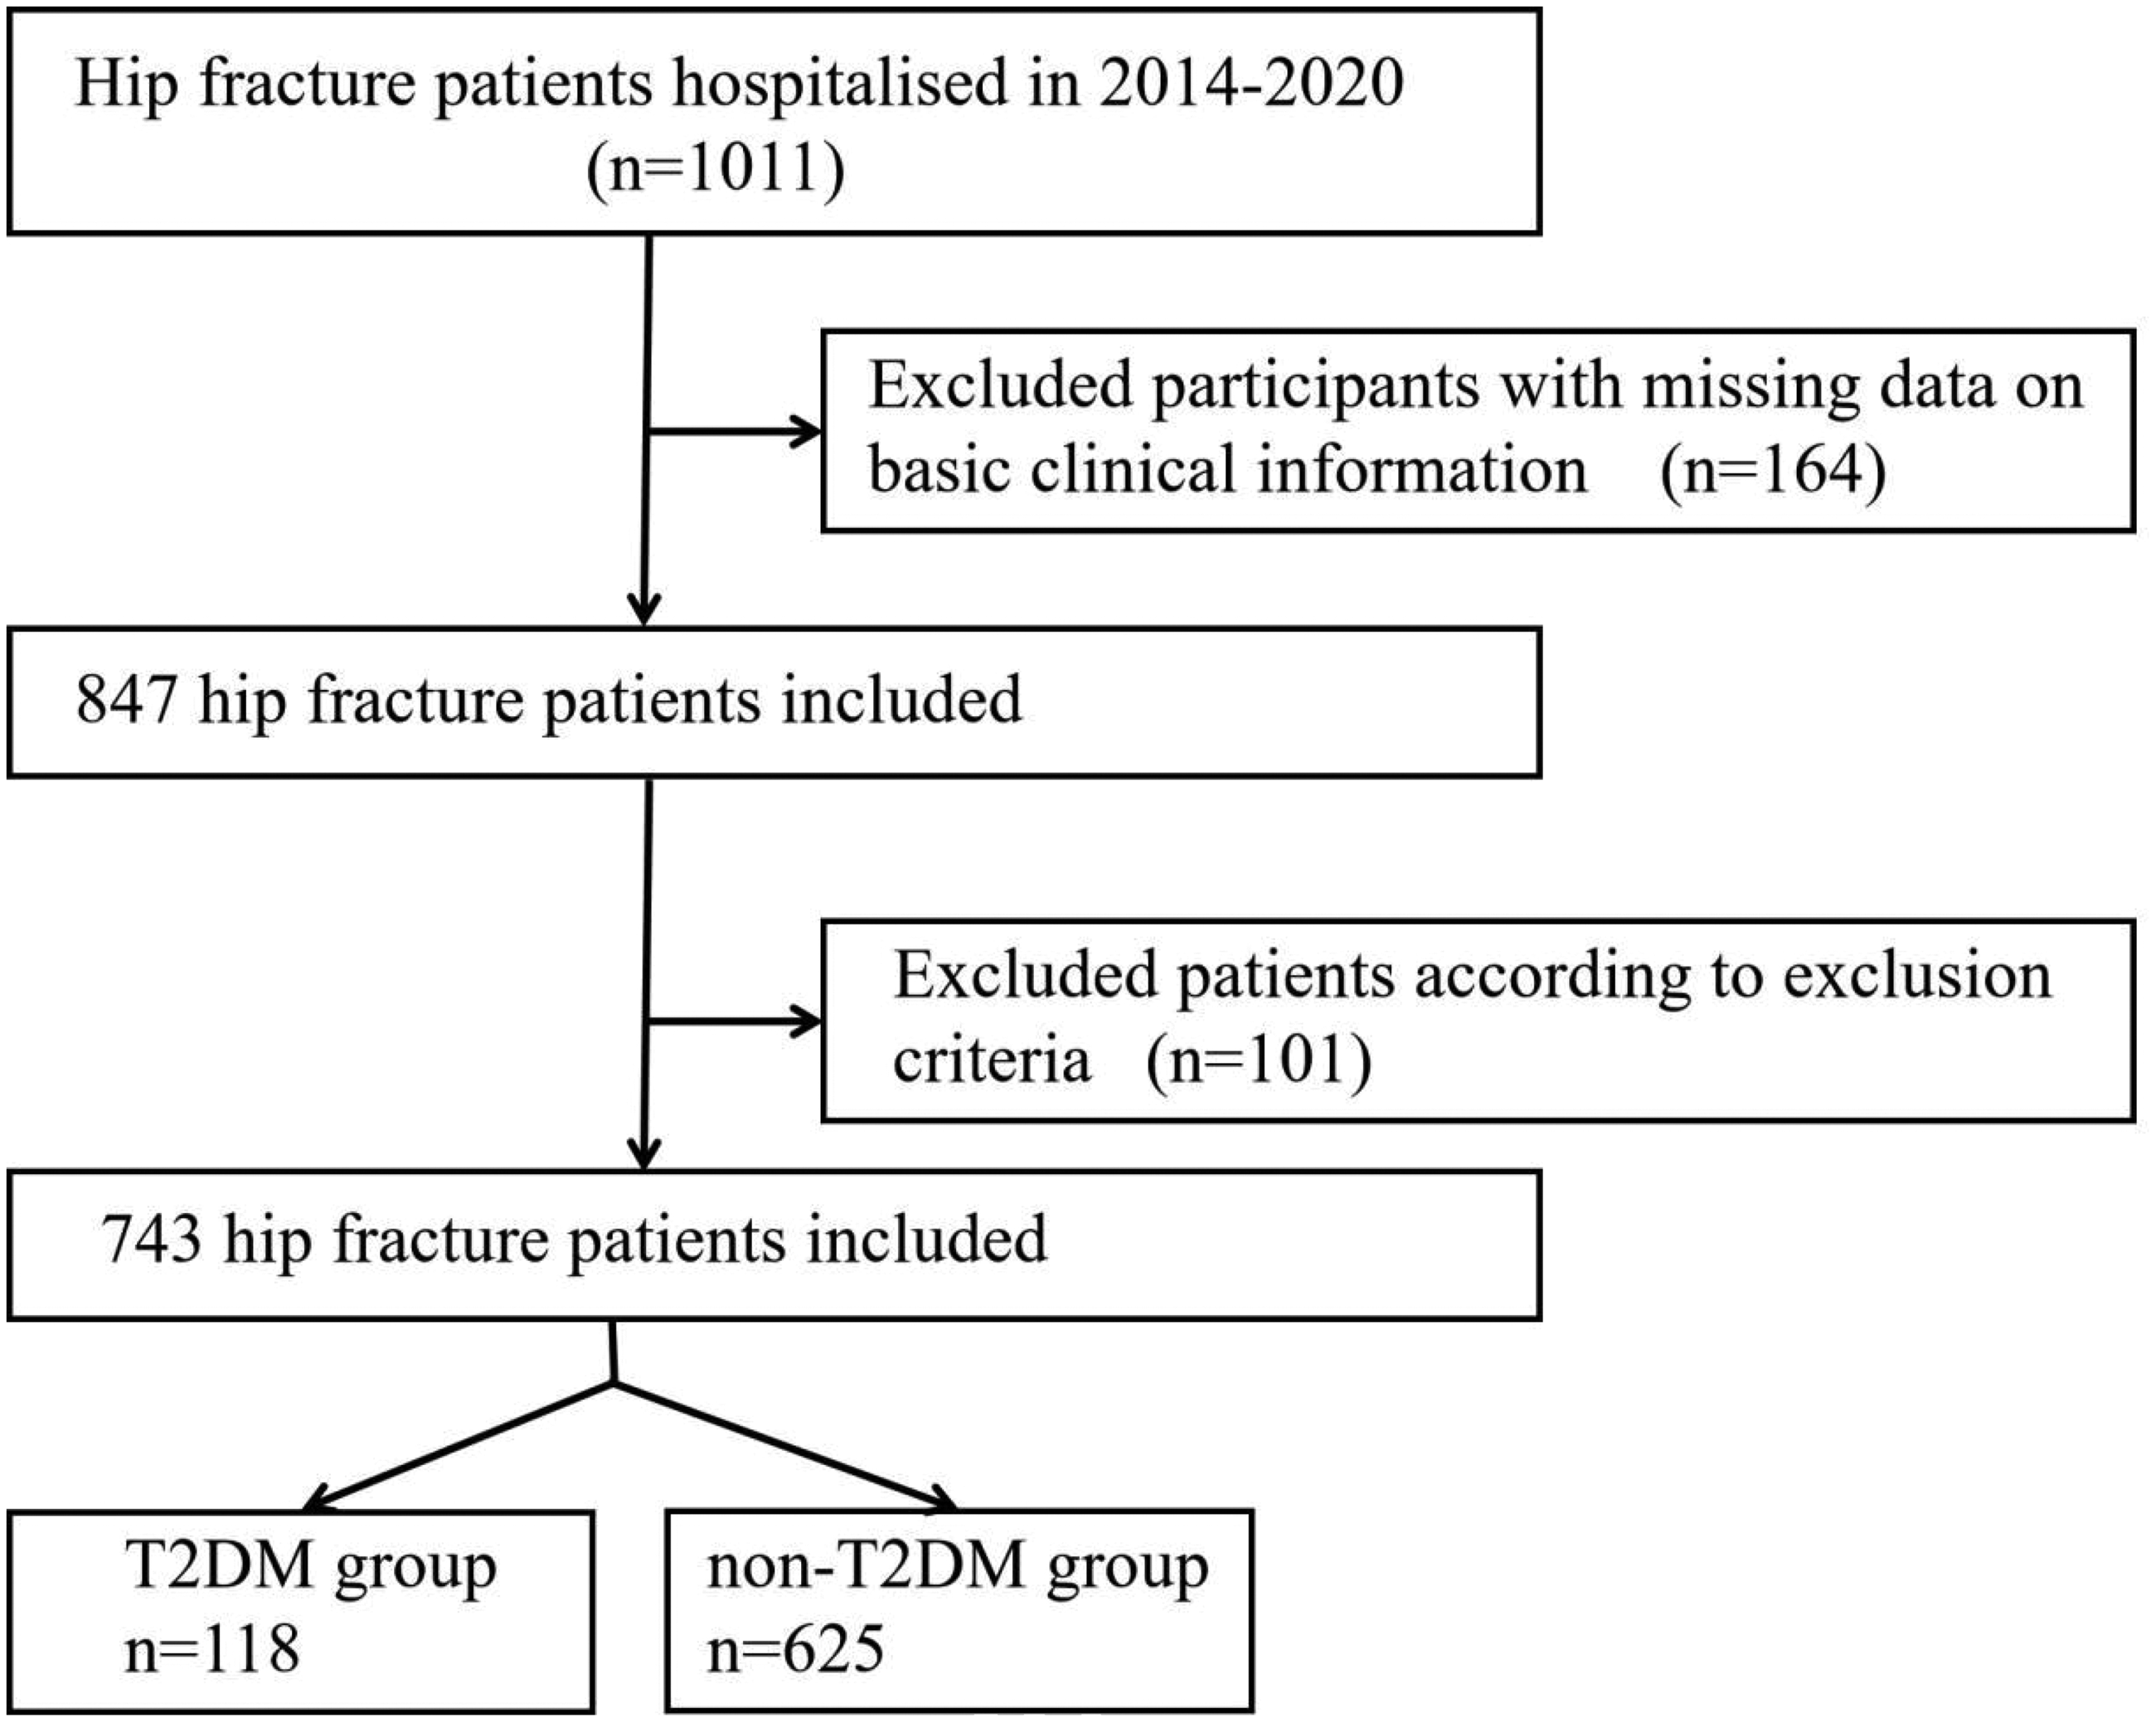
Flowchart of the population included in this study.
Demographic data and biochemical parameter measurement
Sex and age were collected and calculated for all participants. Fasting blood glucose (FBG), alkaline phosphatase (ALP), triglyceride (TG), total cholesterol (TC), low-density lipoprotein cholesterol (LDL-c), high-density lipoprotein cholesterol (HDL-c), blood calcium (Ca), and blood phosphorus (P) from a fasting blood sample collected on the second hospital day were measured using standard laboratory methods.
Bone metabolism parameter measurement
TP1NP, CROSSL, and 25OHD were measured in blood samples collected on the second day after hospital admission using enzyme-linked immunosorbent assay. Subsequently, all patients underwent surgical treatment.
Statistical analyses
All statistical analyses were performed using Sigmaplot 14.0 (SystatSoftware, Inc.). Variables with a normal distribution (age and Ca) were expressed as mean ± standard deviation. Variables with a skewed distribution (FBG, ALP, TG, TC, LDL-c, HDL-c, P, CROSSL, TP1NP, and 25OHD) were expressed as median (25th and 75th percentiles). Differences in normally distributed variables were analyzed using the unpaired Student’s t-test, while differences in skewed variables were analyzed using the Mann–Whitney rank-sum test. Correlations between FBG or TG and bone metabolism parameters were assessed using the Spearman correlation analysis. A p value <0.05 was considered statistically significant.
Results
As shown in Table 1, the T2DM group included 89 female and 29 male patients, with a mean age of 75.7 ± 9.7 years. The non-T2DM group comprised 432 female and 193 male patients, with a mean age of 76.7 ± 11.8 years. There were no significant differences between the T2DM and non-T2DM groups with respect to sex (p = 0.170) and age (p = 0.135).
Comparison of demographic data and biochemical parameters between the T2DM group and non-T2DM group.

ALP: alkaline phosphatase; Ca: blood calcium; F: female; FBG: fasting blood glucose; HDL-c: high-density lipoprotein cholesterol; LDL-c: low-density lipoprotein cholesterol; M: male; P: blood phosphorus; T2DM: type 2 diabetes mellitus; TC: total cholesterol; TG: triglyceride.
The median values of FBG, ALP, TG, TC, LDL-c, HDL-c, and P in the T2DM group were 8.31 (6.76, 10.92), 79.70 (61.45, 106.53), 1.04 (0.79, 1.31), 4.26 (3.32, 4.98), 2.42 (1.80, 3.07), 1.24 (0.98, 1.49), and 1.07 (0.93, 1.25), respectively. The median value of FBG, ALP, TG, TC, LDL-c, HDL-c, and P in the non-T2DM group were 5.94 (5.42, 6.49), 76.00 (62.00, 95.00), 0.86 (0.66, 1.13), 4.14 (3.56, 4.74), 2.29 (1.88, 2.80), 1.30 (1.09, 1.54), and 1.04 (0.92, 1.19), respectively. As shown in Figure 2, no significant differences were noted between the T2DM and non-T2DM groups in ALP (p = 0.174), TC (p = 0.531), LDL-c (p = 0.220), HDL-c (p = 0.098), and P (p = 0.083). Contrarily, FBG levels in the T2DM group were significantly higher than those in the non-T2DM group (p < 0.001). Similarly, TG (p < 0.001) and Ca (p = 0.040) were significantly higher in the T2DM group than in the non-T2DM group.
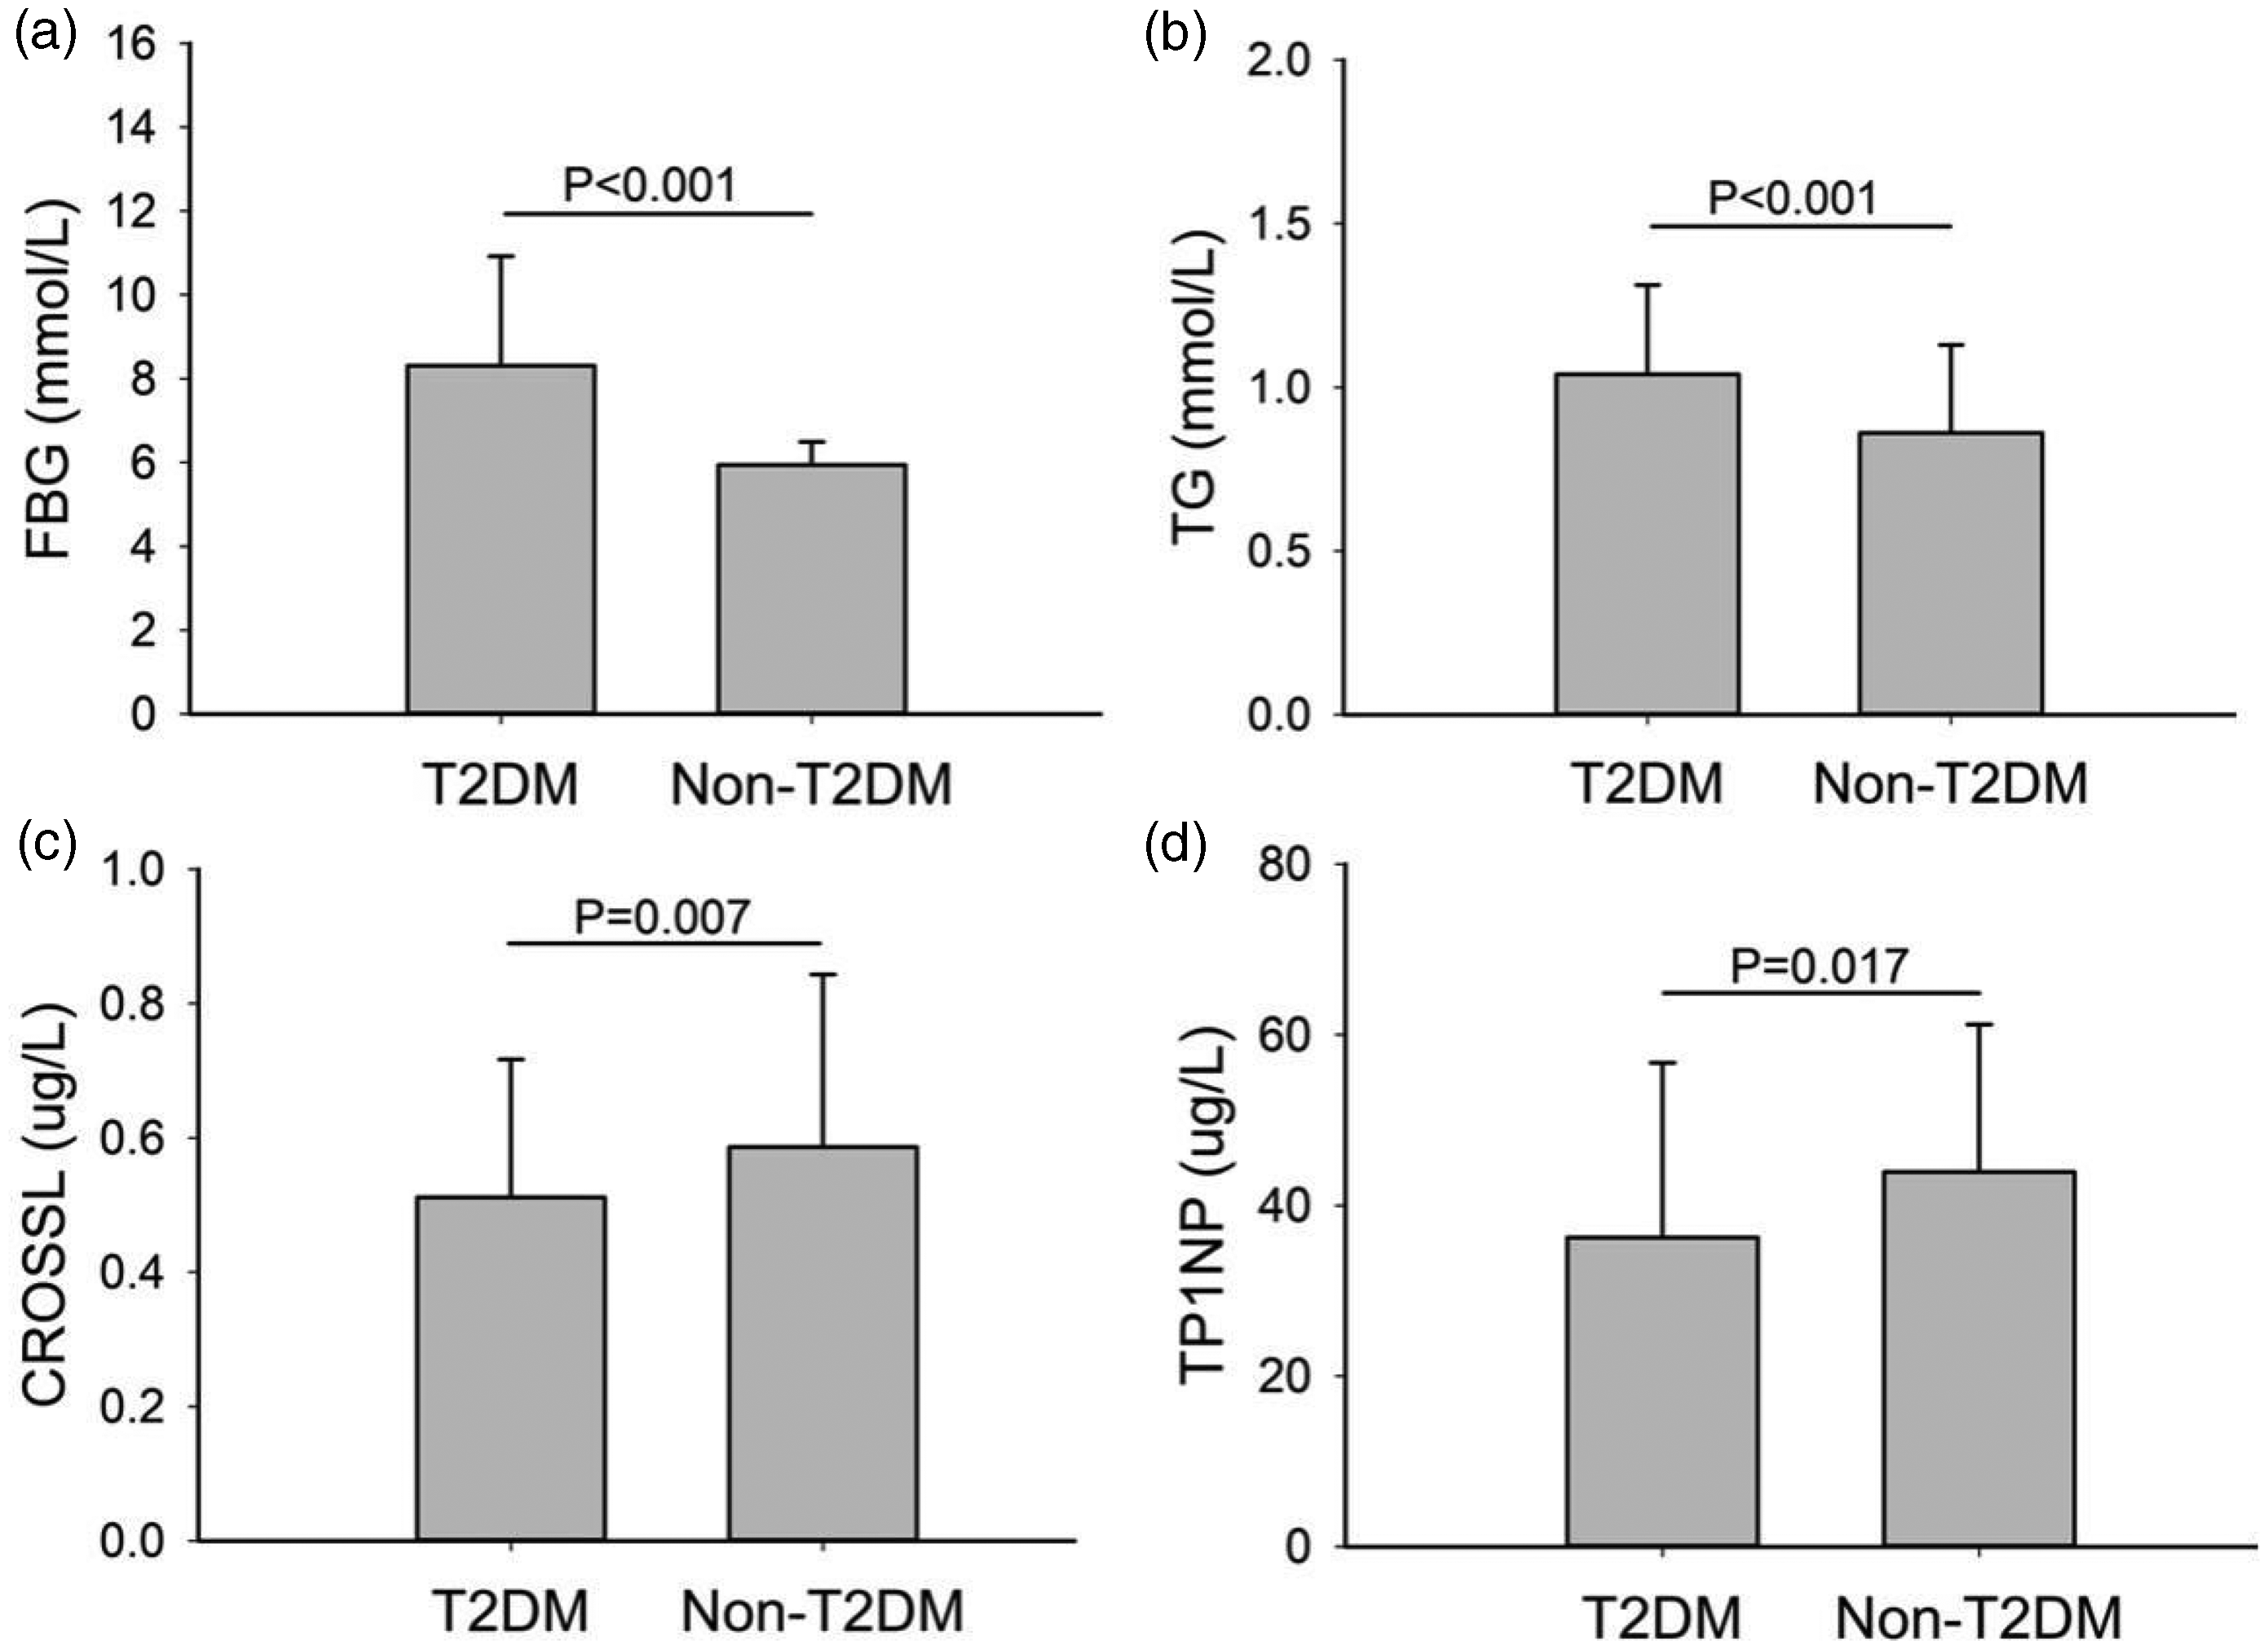
Comparison of FBG, TG, CROSSL, and TP1NP between the T2DM and non-T2DM groups.
Comparisons of bone metabolism parameters between the T2DM and non-T2DM groups are presented in Table 2. The median values of CROSSL, TP1NP, and 25OHD in the T2DM group were 0.51 (0.31, 0.72), 36.26 (25.82, 56.73), and 12.80 (9.38, 16.05), respectively. The median values of CROSSL, TP1NP, and 25OHD in the non-T2DM group were 0.59 (0.38, 0.84), 43.94 (31.09, 61.20), and 13.00 (9.38, 18.70), respectively. CROSSL (p = 0.007) and TP1NP (p = 0.017) levels were significantly lower in the T2DM group than in the non-T2DM group. In addition, there was no statistical difference in 25OHD (p = 0.179) between the T2DM and non-T2DM groups.
Comparison of bone metabolism parameters between the T2DM group and non-T2DM group.

25OHD: 25-hydroxyvitamin D; CROSSL: the age-related type I cross-linked C-telopeptide; T2DM: type 2 diabetes mellitus; TP1NP: total serum procollagen type N-terminal propeptide.
The correlations between glucolipid metabolism parameters (FBG and TG) and bone metabolism parameters are shown in Figure 3. The correlation coefficients between FBG and CROSSL, FBG and TP1NP, TG and TP1NP, Ca and 25OHD were −0.124 (p < 0.001), −0.174 (p < 0.001), 0.075 (p = 0.04), and 0.108 (p = 0.003), respectively. There were no significant correlations between FBG and 25OHD, TG and CROSSL, TG and 25OHD, Ca and CROSSL, or Ca and TP1NP.

Correlation between glucolipid metabolism parameters (FBG and TG) and bone metabolism parameters. (a) Correlation between FBG and CROSSL. (b) Correlation between FBG and TP1NP. (c) Correlation between TG and TP1NP and (d) correlation between Ca and 25OHD. 25OHD: 25-hydroxyvitamin D; CROSSL: age-related type I cross-linked C-telopeptide; FBG: fasting blood glucose; TG: triglyceride; TP1NP: total serum procollagen type N-terminal propeptide.
Discussion
According to the World Health Organization, it is estimated that 422 million people are affected by DM, with T2DM accounting for the majority of cases and demonstrating a gradually increasing prevalence. 18 The complications of T2DM involve multiple organ systems, including diabetic nephropathy, diabetic retinopathy, diabetic foot disease, and diabetic neuropathy. 19 Recent studies have demonstrated that patients with T2DM are more prone to fractures, particularly hip fractures.4,5,20,21 It is generally believed that osteoporosis and osteoporosis-related fractures represent additional complications of T2DM.
Osteoporosis is characterized by the deterioration of bone microstructure and a reduction in bone mass, resulting in decreased bone strength, increased bone fragility, and increased risk of fractures in patients. The gold standard for diagnosing osteoporosis is dual X-ray absorptiometry for the measurement of bone mineral density (BMD). Patients with a T-score ≤ −2.5 are diagnosed with osteoporosis. 22 Although BMD can predict femoral bone strength and fracture risk to some extent, it cannot assess the status of bone tissue metabolism, which is used in the evaluation of bone metabolic state and the curative effect evaluation of antiosteoporosis treatments. 23 Bone metabolism is a dynamic process involving osteoblast-mediated bone formation and osteoclast-mediated bone resorption. Various bone metabolism markers, including TP1NP, CROSSL, and 25OHD, are used to clinically assess the recent bone metabolism status. 25OHD and CROSSL are closely related to bone resorption, and TP1NP is closely related to bone resorption. The TP1NP concentration in the blood is primarily used to reflect the bone transformation and type I collagen synthesis speed; elevated levels suggest that bone collagen type conversion and type I synthesis are accelerated significantly. 11 In addition, TP1NP demonstrates high specificity and sensitivity in predicting osteoporosis, evaluating bone mass, and monitoring the effects of antiosteoporosis therapy. TP1NP levels are relatively stable and minimally influenced by hormonal fluctuations, making this marker highly valuable for clinical research and application. Therefore, fasting serum TP1NP is recommended as a highly sensitive marker of bone formation. The level of CROSSL reflects the osteoclast-mediated bone resorptive activity, and CROSSL is an effective marker of metabolic bone diseases characterized by significantly enhanced osteoclast activity. Measurement of serum CROSSL levels can indicate the active degree of bone conversion and serve as an important reference index for the clinical evaluation of bone conversion–related bone metabolic diseases. Fasting serum CROSSL is recommended as a sensitive marker of bone resorption. Therefore, TP1NP is closely associated with bone formation, while 25OHD and CROSSL are closely related to bone resorption. 24
In this study, the median values of CROSSL, TP1NP, and 25OHD in the T2DM group were 0.51 (0.31, 0.72), 36.26 (25.82, 56.73), and 12.80 (9.38, 16.05), respectively. The median values of CROSSL, TP1NP, and 25OHD in the non-T2DM group were 0.59 (0.38, 0.84), 43.94 (31.09, 61.20), and 13.00 (9.38, 18.70), respectively. The TP1NP (p = 0.017) and CROSSL (p = 0.007) levels in the T2DM group were significantly lower than those in the non-T2DM group. Meanwhile, there was no statistically significant difference in 25OHD levels between the two groups (p = 0.179). These results indicate a low bone turnover state, involving both bone formation and bone resorption, in patients with T2DM after hip fractures. Liu et al. 14 reported reduced bone turnover markers, including procollagen type I N-terminal propeptide (PINP) and osteocalcin, in young and middle-aged male patients with T2DM. In contrast, β-CTX (a bone resorption marker) showed no difference between patients with T2DM and nondiabetic controls (p = 0.826) in a previous study. Another study similarly reported decreased levels of PINP and β-CTX in patients with DM, consistent with our results. 25 These controversial results may be attributable to the differences in age, sex, race, and fracture state.
Moreover, the median values of FBG and TG in the T2DM group were 8.31 (6.76, 10.92) and 1.04 (0.79, 1.31), respectively. The median values of FBG and TG in the non-T2DM group were 5.94 (5.42, 6.49) and 0.86 (0.66, 1.13), respectively. Patients with T2DM exhibited higher FBG and TG levels than those without T2DM after hip fractures, which indicated a probability of lipid metabolism disorders in patients with T2DM. However, the levels of other lipid metabolism markers, including TC, LDL-c, and HDL-c, in the T2DM group were comparable to those in the non-T2DM group. Liu et al. 14 reported an increase in TG, TC, and LDL-c levels and a decrease in HDL-c levels in patients with T2DM. These inconsistent results may be attributable to differences in age, baseline lipid levels, and antilipid drug usage. The correlation analyses between glucolipid metabolism parameters (FBG and TG) and bone metabolism markers revealed a negative correlation between FBG and TP1NP levels (r = −0.124, p < 0.001), a negative correlation between FBG and CROSSL levels (r = −0.174, p < 0.001), a positive correlation between TG and TP1NP levels (r = 0.075, p < 0.001), and a positive correlation between Ca and 25OHD levels (r = 0.108, p < 0.001). These results further indicate the effect of FBG on bone formation and bone resorption. Early glycemic control may contribute to fracture healing following hip fractures. In addition, a positive correlation between TG and TP1NP levels was observed in our study, while no correlation was observed between TG and TP1NP levels in Liu et al.’s 14 study. These controversial results may be attributable to differences in baseline lipid levels, sex, and age.
This study focused on the effect of T2DM on bone metabolism markers in patients with hip fractures, a topic that has been rarely reported. However, some limitations of this study should be acknowledged. First, this cross-sectional study fails to evaluate the changes in bone metabolism markers after glycemic control or blood lipid level control. Second, this was a single-center study with a relatively small sample size. In addition, important variables such as the duration and severity of T2DM (e.g. glycated hemoglobin (HbA1c) levels), presence of diabetic complications, and body mass index were not included. Further studies, including retrospective and prospective studies beyond cross-sectional analyses, are warranted to explore the effects of T2DM on bone metabolism after hip fractures.
Conclusion
Our cross-sectional study demonstrated a low bone turnover state (both bone formation and bone resorption) in patients with T2DM after hip fractures. The FBG levels were negatively correlated with TP1NP and CROSSL levels. In addition, our study speculated that good glycemic control may be beneficial for bone metabolism.
Footnotes
Acknowledgments
We would like to thank The First Affiliated Hospital of Soochow University for their support.
Author contributions
Fanqi Kong and Bin Meng designed the study and contributed the original data. Shaofeng Yang and Pengrui Jing conducted the statistical analyses and prepared the initial draft of the manuscript. The final version of the manuscript has been read and approved by all authors.
Data availability statement
The datasets used and/or analyzed during the current study available from the corresponding author on reasonable request.
Declaration of conflicting interests
The authors declare that the research was conducted in the absence of any commercial or financial relationships that could be construed as a potential conflict of interest.
Funding
This work was supported by China Health Medical Development Foundation and National Natural Science Foundation of China (82402797).