
Abstract
Objective
To examine the association between metabolic abnormalities and liver fibrosis in patients with chronic hepatitis B and develop a simple predictive index.
Methods
In this retrospective cross-sectional study, 288 patients with chronic hepatitis B were evaluated. Significant fibrosis was defined as fibrosis-4 index ≥ 1.45 or liver stiffness ≥ 7.5 kPa. Variables with P < 0.10 in the univariate analysis were entered in a backward stepwise logistic regression. A fibrosis risk index was calculated from the constant term and β coefficients of significant predictors. Diagnostic performance was assessed using receiver operating characteristic curve analysis.
Results
Body mass index; fasting plasma glucose, triglyceride, uric acid, and gamma-glutamyl transferase levels; and presence of fatty liver and diabetes were independent predictors of fibrosis. The fibrosis risk index showed excellent discrimination (area under the curve = 0.928, 95% confidence interval: 0.898–0.954). The optimal cutoff (0.000148) yielded 91.6% sensitivity and 76.4% specificity.
Conclusion
Metabolic abnormalities are independently associated with liver fibrosis in patients with chronic hepatitis B patients. The fibrosis risk index is a simple, noninvasive tool that identifies high-risk patients for timely intervention.
Keywords
Introduction
Chronic hepatitis B (CHB) remains a major public health challenge in China, where it accounts for a significant proportion of global hepatitis B virus (HBV) infections.1–5 Despite advances in antiviral therapy, many patients with CHB continue to experience disease progression, particularly the development of liver fibrosis, which is a pivotal step toward cirrhosis and hepatocellular carcinoma.6,7 Early identification of patients at risk of fibrosis is therefore essential for timely intervention and management.
However, accurately predicting liver fibrosis in patients with CHB patients remains challenging in clinical practice due to the complex interplay of viral, host, and environmental factors.8–10 In recent years, increasing attention has been given to the role of metabolic abnormalities, including increased body mass index (BMI), hyperglycemia, hyperuricemia, and dyslipidemia, in exacerbating hepatic inflammation and fibrogenesis. These metabolic disturbances may accelerate liver injury through mechanisms such as insulin resistance, oxidative stress, and chronic low-grade inflammation.11–13
Despite the growing recognition of the role of metabolic factors, there is a lack of simple and effective models that incorporate metabolic parameters to predict liver fibrosis risk in patients with CHB. Most existing noninvasive indices, such as fibrosis-4 index (FIB-4) and aspartate aminotransferase (AST) to platelet ratio index (APRI), focus primarily on routine laboratory and demographic data, with limited consideration of metabolic risk profiles.14,15
In this study, we aimed to comprehensively evaluate the metabolic characteristics of patients with CHB and explore the association between metabolic abnormalities and the progression of liver fibrosis. Furthermore, we sought to develop a clinically applicable predictive model that integrates key metabolic indicators to enable early detection of fibrosis in this population.
Methods
Study participants and design
This retrospective cross-sectional study included patients diagnosed with CHB who underwent clinical evaluation at the Ganzhou People’s Hospital between January 2021 and December 2024. All the included patients had complete laboratory records and had undergone noninvasive liver fibrosis assessment. Patients were selected consecutively according to the eligibility criteria during the study period.
Patients were eligible if they were aged ≥18 years and tested positive for hepatitis B surface antigen for more than 6 months. Individuals were excluded based on the following criteria (Figure 1): (a) coexisting chronic liver diseases, including chronic hepatitis C, autoimmune hepatitis, or alcoholic liver disease; (b) history of malignancy or missing essential clinical data (including weight, height, HBV serological markers such as hepatitis B e-antigen (HBeAg) and HBV DNA levels); (c) use of glucose-lowering, uric acid (UA)-lowering, or lipid-lowering medications that could potentially affect metabolic indicators or liver fibrosis status; and (d) prior or ongoing antiviral therapy for HBV infection.

Flowchart of participant inclusion and exclusion in the study.
The sample size was determined by including all eligible patients with complete data during the study period. Eligible participants were divided into two groups according to the presence or absence of metabolic abnormalities. Clinical characteristics, metabolic indicators, and liver fibrosis markers were compared between the groups, and relevant predictive models were constructed accordingly. The reporting of this study conforms to the Strengthening the Reporting of Observational studies in Epidemiology (STROBE) guidelines. 16
Clinical examination, biochemical analyses, and liver fibrosis assessment
Systolic blood pressure (SBP), diastolic blood pressure (DBP), body height, and weight were measured by trained physicians using standardized protocols. BMI was calculated as weight in kilograms divided by height in meters squared (kg/m2). All patients underwent routine clinical evaluation and venous blood sampling after at least 8 hours of overnight fasting.
Biochemical parameters were measured using an automated analyzer (AU5800, Beckman Coulter, Brea, California, USA) in accordance with the manufacturer's instructions. The following serum indices were evaluated: fasting plasma glucose (FPG), triglycerides, total cholesterol (TC), high-density lipoprotein cholesterol (HDL-C), low-density lipoprotein cholesterol (LDL-C), alanine aminotransferase (ALT), AST, gamma-glutamyl transferase (GGT), albumin, glycosylated hemoglobin (HbA1c), and serum UA (SUA).
Serologic markers of HBV infection, including HBeAg and hepatitis B e-antibody (anti-HBe), were determined using a commercial chemiluminescence immunoassay (Architect i2000SR, Abbott Laboratories, IL, USA). Serum HBV DNA levels were quantified by real-time polymerase chain reaction using the COBAS TaqMan HBV Test (Roche Molecular Systems, USA), with a lower limit of detection of 30 IU/mL.
Noninvasive liver fibrosis assessments included liver stiffness measurement using transient elastography (FibroScan®, Echosens, Paris, France) as well as serum-based indices such as the FIB-4 and APRI. All FibroScan procedures were conducted by experienced operators following standardized protocols. Reliable measurements were defined as those with ≥10 valid shots and an interquartile range/median ratio of <30%.
The following formulas were used to calculate the FIB-4 and APRI:
FIB-4 = (age × AST)/(platelet count ×√ALT) APRI = ((AST/upper limit of normal)/platelet count) × 100
Significant liver fibrosis was defined as either a FIB-4 index ≥1.45 or liver stiffness ≥7.5 kPa, based on previously validated diagnostic thresholds for CHB-related fibrosis.
Statistical analyses
Patients were stratified into two groups according to the presence or absence of metabolic abnormalities. Continuous variables are presented as mean ± standard deviation or median (interquartile range) values and were compared using the unpaired Student’s t-test or Mann–Whitney U test, as appropriate. Categorical variables are expressed as numbers and percentages and were compared using the chi-square test or Fisher exact test. Variables with a P value <0.10 in univariate logistic regression were included in the multivariate analysis. To avoid multicollinearity, correlated variables were excluded based on clinical relevance and correlation analysis. A backward stepwise logistic regression model was then performed using the remaining variables. The fibrosis risk index (FI) was calculated for each patient using the following formula:

Ethics statement
This study was conducted in accordance with the Declaration of Helsinki (1975, as revised in 2024). The Institutional Review Board of Ganzhou People’s Hospital determined that ethical approval and patient consent were not required for this retrospective analysis of deidentified data. All patient data were completely deidentified prior to analysis to ensure patient confidentiality.
Results
Baseline characteristics of the study population
In total, 288 patients with CHB were included in the final analysis, of whom 131 (45.5%) had at least one metabolic abnormality. The clinical and biochemical characteristics of patients with and without metabolic abnormalities are summarized in Table 1. Patients with metabolic abnormalities were older (48.37 ± 14.30 vs. 45.45 ± 14.98 years, P = 0.365), had significantly higher BMI (26.35 ± 2.55 vs. 24.47 ± 2.80 kg/m2, P < 0.001), and exhibited elevated SBP and DBP levels compared with those without metabolic abnormalities (P < 0.001 for both). In terms of liver function, the metabolic abnormality group showed significantly higher AST (44.74 ± 12.77 vs. 37.69 ± 11.96 U/L, P < 0.001) and GGT (52.67 ± 20.46 vs. 41.36 ± 16.01 U/L, P < 0.001) levels. Albumin levels were lower in the metabolic group (40.63 ± 6.97 vs. 42.18 ± 6.64 g/L, P = 0.019), whereas ALT and total bilirubin did not differ significantly between the groups. Regarding metabolic parameters, the metabolic abnormality group had significantly elevated FPG (6.23 ± 1.01 vs. 5.09 ± 0.99 mmol/L), HbA1c (6.28% ± 1.95% vs. 5.69% ± 1.16%), triglyceride (2.01 ± 0.53 vs. 1.54 ± 0.51 mmol/L), SUA (415.38 ± 91.78 vs. 340.92 ± 87.35 µmol/L), TC, and LDL-C levels (all P < 0.01). HDL-C levels were comparable between the groups (P = 0.350). Markers of liver fibrosis, including FIB-4 (2.11 ± 0.75 vs. 1.68 ± 0.73, P < 0.001), APRI (0.93 ± 0.30 vs. 0.68 ± 0.19, P < 0.001), and liver stiffness (7.89 ± 2.76 vs. 6.70 ± 1.74 kPa, P = 0.017), were significantly higher in the metabolic group. Comorbidities such as fatty liver (61.07% vs. 18.47%), hypertension (40.46% vs. 19.11%), and diabetes (29.77% vs. 8.86%) were significantly more common in patients with metabolic abnormalities (all P < 0.001). Similarly, the prevalence of obesity, hyperuricemia, hypertriglyceridemia, and low HDL-C was significantly higher in the metabolic group. Baseline virological parameters, including serum HBV DNA levels (log10 IU/mL), HBeAg positivity, and anti-HBe positivity, were comparable between patients with and without metabolic abnormalities (all P > 0.05).
Baseline clinical characteristics of patients with CHB.
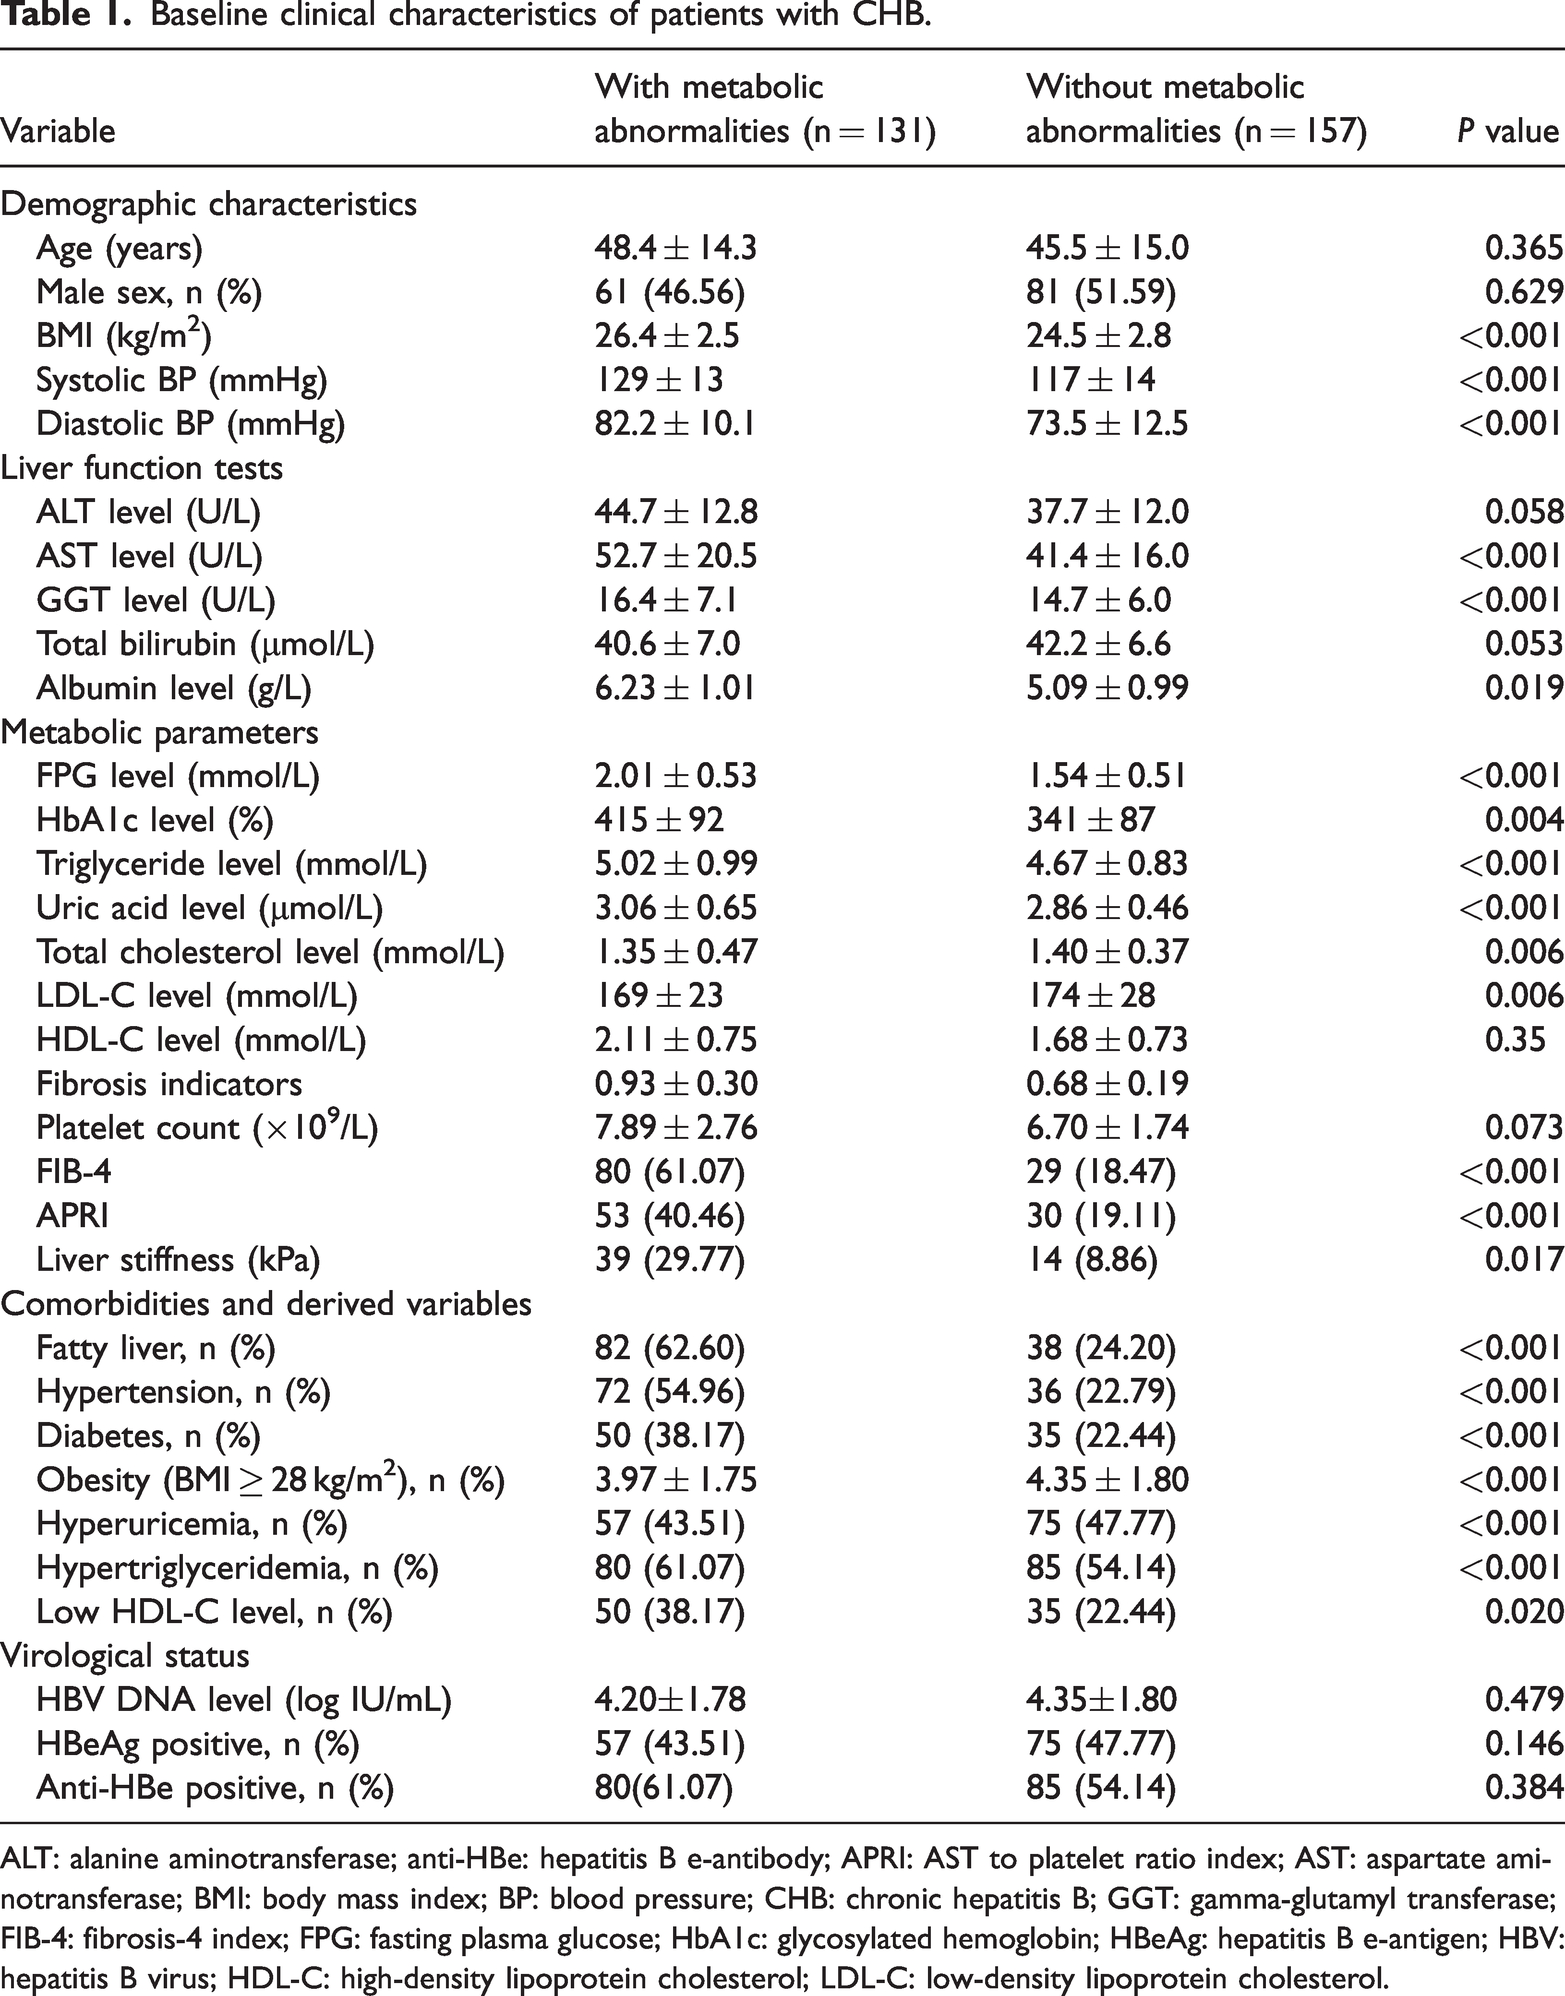
ALT: alanine aminotransferase; anti-HBe: hepatitis B e-antibody; APRI: AST to platelet ratio index; AST: aspartate aminotransferase; BMI: body mass index; BP: blood pressure; CHB: chronic hepatitis B; GGT: gamma-glutamyl transferase; FIB-4: fibrosis-4 index; FPG: fasting plasma glucose; HbA1c: glycosylated hemoglobin; HBeAg: hepatitis B e-antigen; HBV: hepatitis B virus; HDL-C: high-density lipoprotein cholesterol; LDL-C: low-density lipoprotein cholesterol.
Comparison of metabolic indicators between patients with and without significant liver fibrosis
As shown in Figure 2, we compared the metabolic indicators between patients with and without significant liver fibrosis. The FIB-4 was significantly higher in patients with significant fibrosis compared with that in those without fibrosis (P < 0.0001), indicating more advanced liver injury in this group. The observation of significantly higher BMI in the fibrosis group (P < 0.0001) supports a potential link between obesity and the progression of liver fibrosis. In terms of lipid metabolism, the triglycerides levels were significantly higher in patients with significant fibrosis (P < 0.01), supporting the role of dyslipidemia in fibrosis development. The fibrosis group exhibited significantly higher SUA concentrations (P < 0.0001), supporting the role of hyperuricemia in hepatic fibrogenesis. These results suggest that metabolic abnormalities, including obesity, dyslipidemia, and hyperuricemia, are closely associated with the presence of significant liver fibrosis.
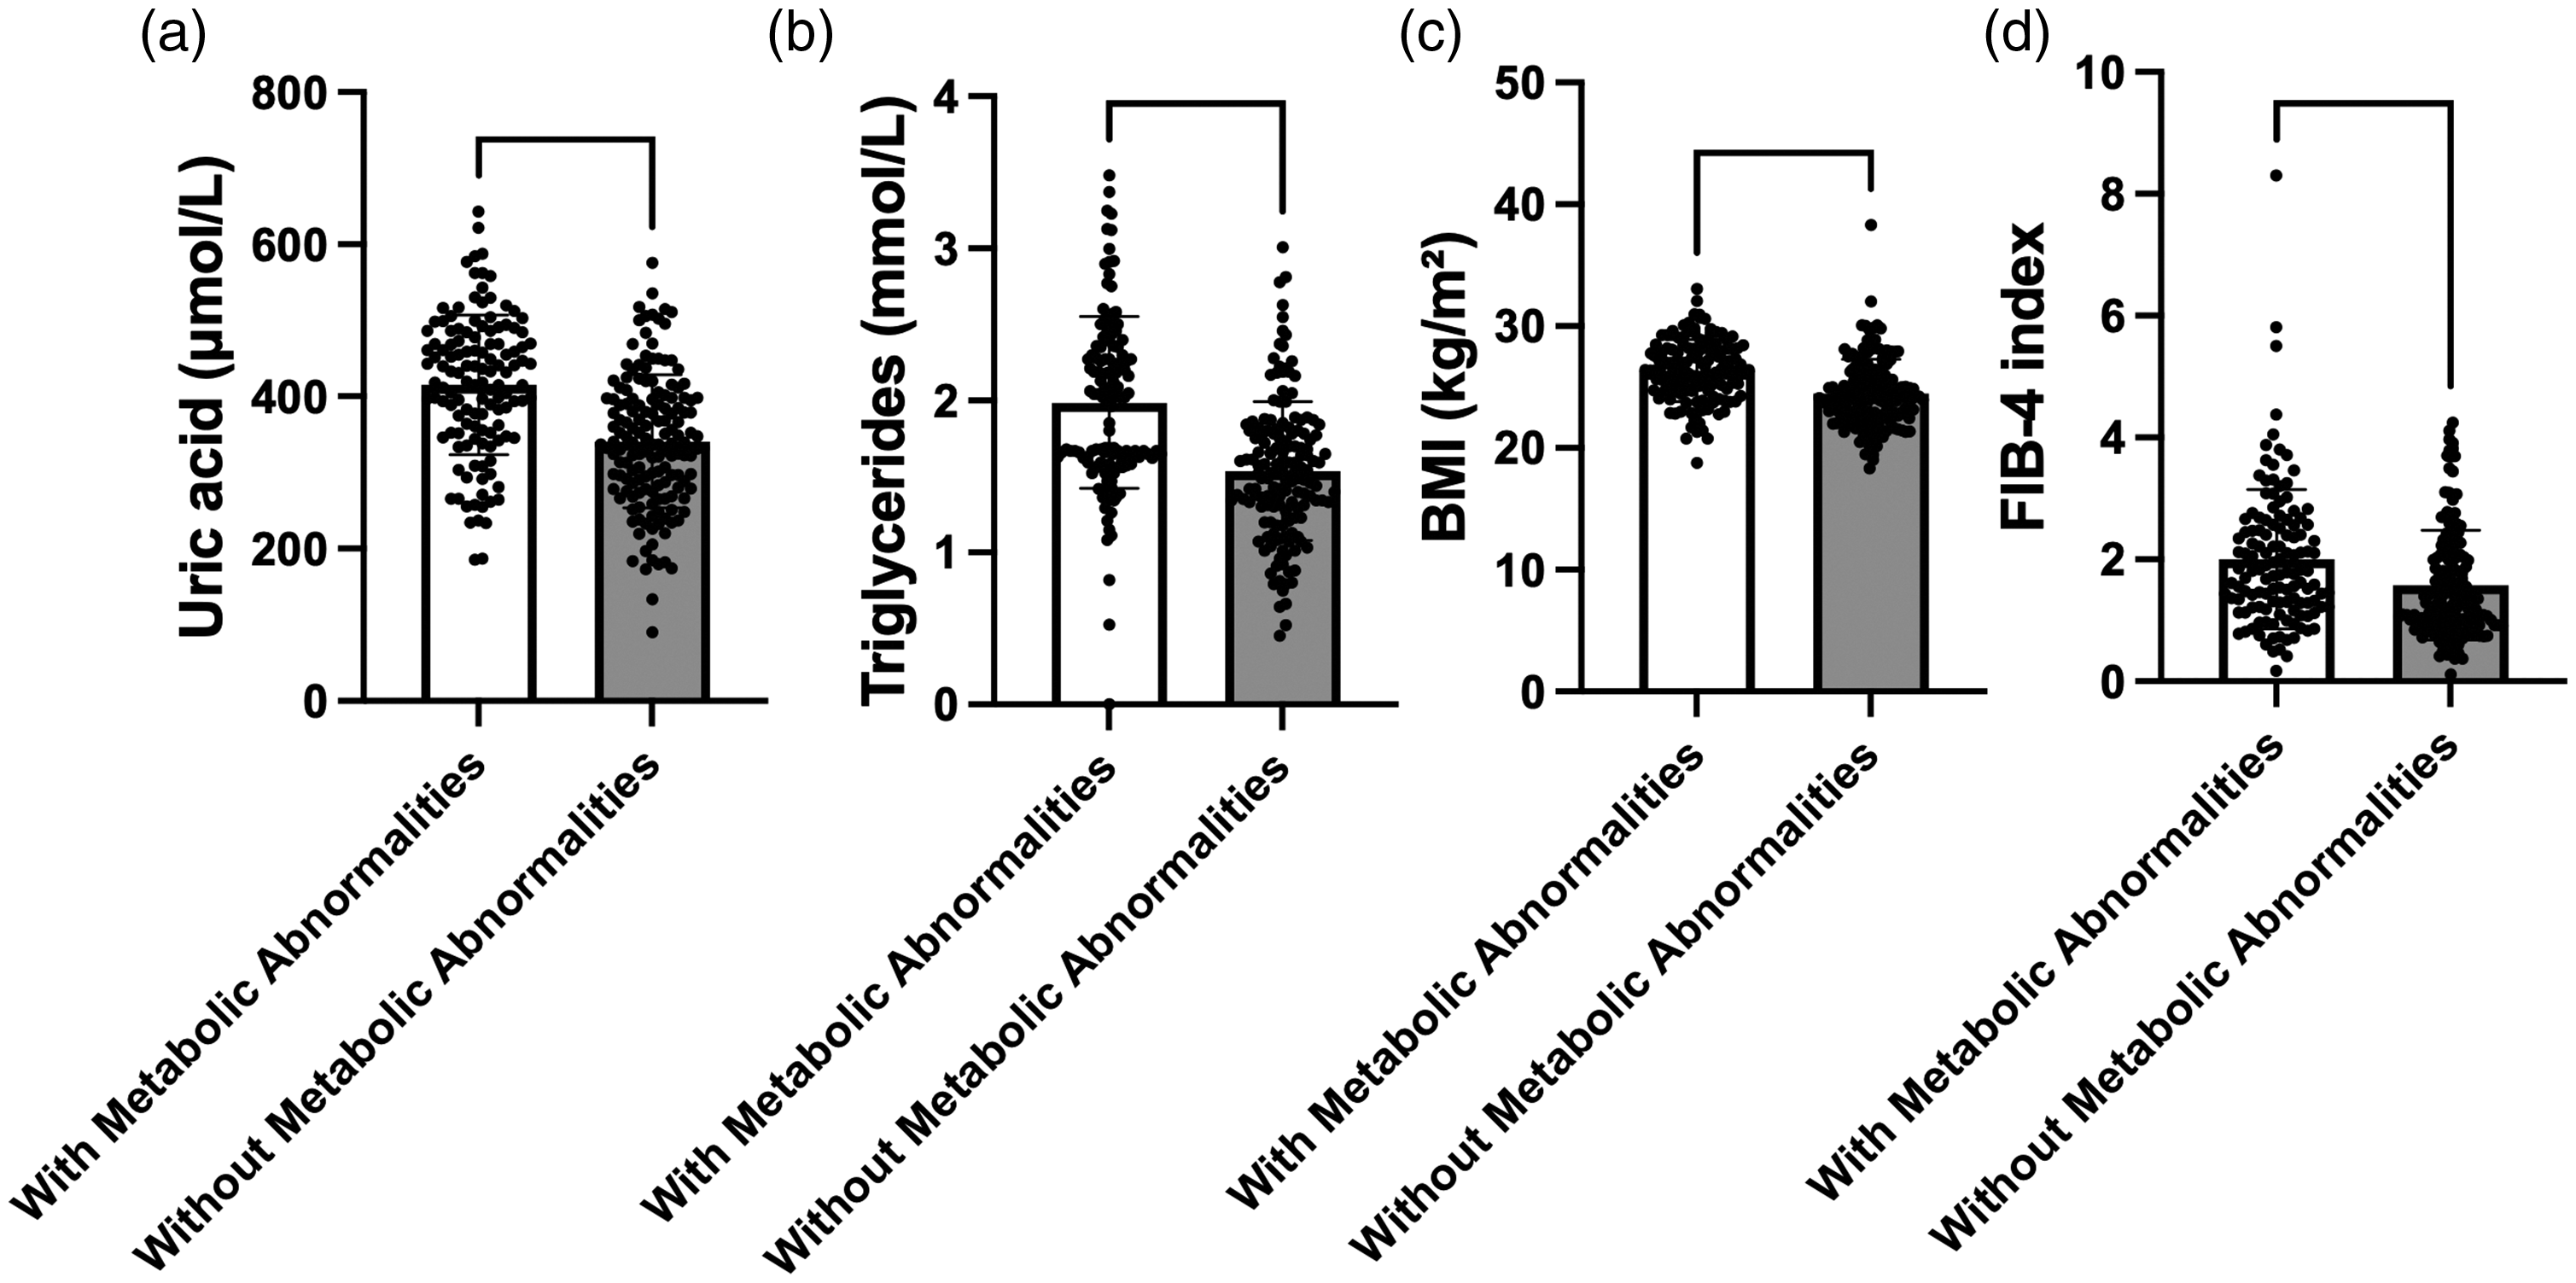
Comparison of metabolic indicators between patients with and without significant liver fibrosis.
Univariate logistic regression analysis of risk factors for significant liver fibrosis
To identify clinical and metabolic risk factors associated with significant liver fibrosis (defined as FIB-4 ≥ 1.45), we performed univariate logistic regression analysis (Table 2, Figure 3). Several metabolic parameters were strongly associated with a risk of fibrosis. Each unit increase in BMI was associated with 30% higher odds of significant fibrosis (odds ratio (OR): 1.30, 95% CI: 1.19–1.44, P < 0.001). In addition, hypertension (OR: 2.02, 95% CI: 1.21–3.50, P = 0.011) and FPG level (OR: 3.19, 95% CI: 2.39–4.37, P < 0.001) showed a significant association with the risk of fibrosis. Among all variables, triglycerides had the highest odds ratio (OR: 7.11, 95% CI: 4.05–13.2, P < 0.001), indicating a particularly strong relationship between hypertriglyceridemia and fibrosis. Other significant risk factors included HbA1c, TC, LDL-C, SUA, and GGT levels as well as the presence of fatty liver. In contrast, age (OR: 1.01, P = 0.095) and sex (OR: 0.82, P = 0.396) were not significantly associated with fibrosis risk. Overall, these findings support the role of metabolic abnormalities, including obesity, hypertension, dysglycemia, hyperuricemia, and dyslipidemia, as important risk factors for significant liver fibrosis in CHB patients.
Univariate logistic regression of risk factors for liver fibrosis.
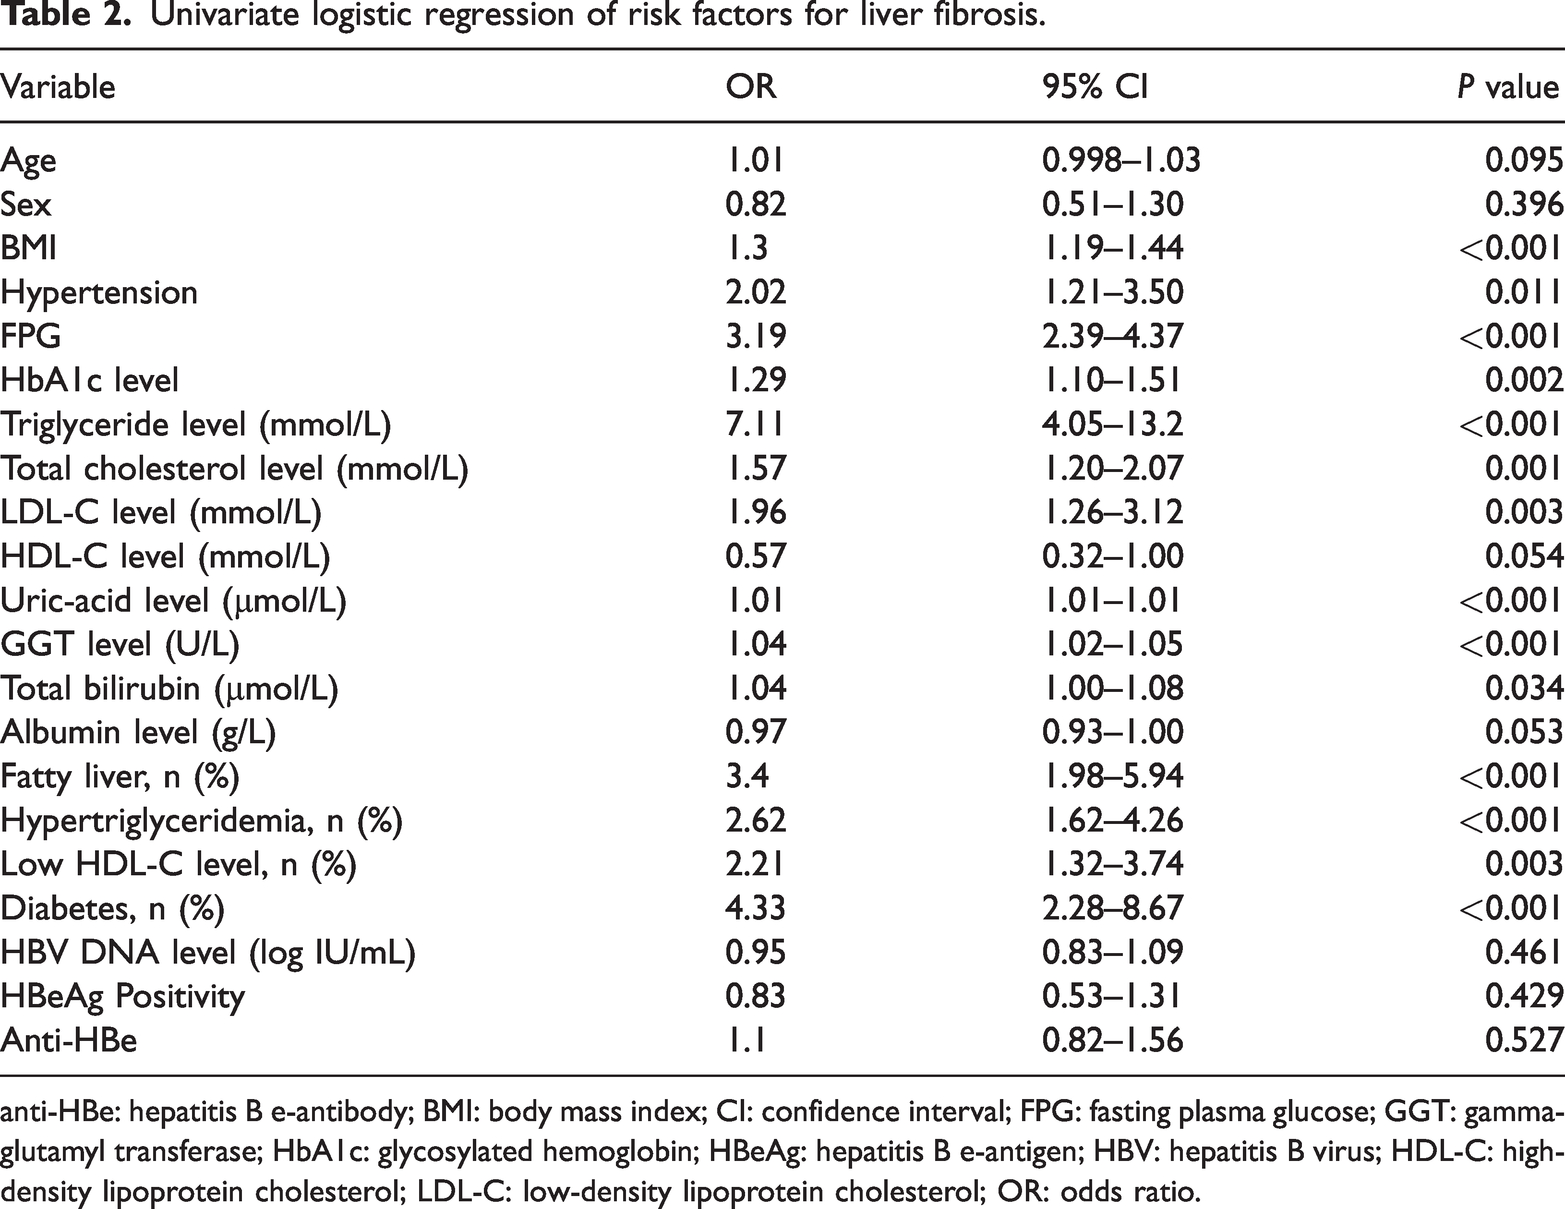
anti-HBe: hepatitis B e-antibody; BMI: body mass index; CI: confidence interval; FPG: fasting plasma glucose; GGT: gamma-glutamyl transferase; HbA1c: glycosylated hemoglobin; HBeAg: hepatitis B e-antigen; HBV: hepatitis B virus; HDL-C: high-density lipoprotein cholesterol; LDL-C: low-density lipoprotein cholesterol; OR: odds ratio.
Univariate logistic regression analysis of risk factors for significant liver fibrosis.
Multivariate logistic regression analysis of risk factors for liver fibrosis
Backward stepwise multivariate logistic regression analysis identified several independent risk factors for liver fibrosis (Table 3). Higher BMI (OR = 1.40, 95% CI: 1.20–1.63, P < 0.001) as well as elevated levels of FPG (OR = 3.59, 95% CI: 2.31–5.58, P < 0.001), triglycerides (OR = 7.44, 95% CI: 3.13–17.69, P < 0.001), SUA (OR = 1.009, 95% CI: 1.004–1.014, P = 0.002), and GGT (OR = 1.035, 95% CI: 1.012–1.059, P = 0.004) were significantly associated with an increased risk of fibrosis. In addition, the presence of fatty liver (OR = 3.28, 95% CI: 1.37–7.86, P = 0.008) and diabetes (OR = 7.43, 95% CI: 1.51–36.63, P = 0.013) were also independent predictors.
Multivariate logistic regression of risk factors for liver fibrosis.

BMI: body mass index; FPG: fasting plasma glucose; GGT: gamma-glutamyl transferase.
The predictive formula was as follows:

A FI incorporating these variables demonstrated excellent discriminatory ability, with an AUC of 0.928 (95% CI: 0.898–0.954). The optimal probability cutoff value determined by the Youden index was 0.000148, yielding a sensitivity of 91.6% and a specificity of 76.4% (Figure 4).

Receiver operating characteristic (ROC) curve for the multivariate model predicting significant liver fibrosis.
Discussion
In this cross-sectional study, we evaluated the impact of metabolic abnormalities on liver fibrosis among CHB patients. Our findings revealed that elevated BMI as well as FPG, triglyceride, and SUA levels were significantly associated with an increased risk of significant liver fibrosis, as defined by FIB-4 ≥ 1.45 or liver stiffness ≥ 7.5 kPa. These results underscore the crucial role of metabolic dysregulation in the progression of liver fibrosis in CHB and highlight the potential of metabolic parameters as early predictive markers of liver fibrosis.
Obesity has increasingly been recognized as a risk factor for liver fibrosis in various chronic liver diseases, including CHB.17–19 In our cohort, higher BMI was independently associated with a 1.4-fold increase in the odds of developing fibrosis. This association may be driven by adipose tissue-induced chronic inflammation and insulin resistance, which contribute to hepatocellular injury and fibrogenesis. Notably, our findings are consistent with those of previous studies that have demonstrated a synergistic interaction between metabolic syndrome components and HBV infection that acts to exacerbate liver disease severity.
Similarly, hyperglycemia was a strong predictor of fibrosis in our study. Patients with higher FPG levels exhibited a more than 3-fold increase in fibrosis risk, even after adjusting for other variables. Chronic hyperglycemia may promote oxidative stress, increase hepatic stellate cell activation, and impair hepatic microcirculation, all of which can accelerate fibrosis.20–23 These findings support earlier evidence linking diabetes or prediabetes with worse liver outcomes in HBV-infected populations.
Hypertriglyceridemia also emerged as a powerful independent risk factor for fibrosis development. Elevated triglyceride levels have been implicated in hepatocyte lipotoxicity and mitochondrial dysfunction that could lead to hepatocyte apoptosis and inflammation, ultimately triggering fibrosis.24,25 Our data suggest that lipid metabolism disturbances should be given greater attention in the clinical management of CHB patients even in the absence of overt steatosis.
UA, conventionally believed to be a marker of renal function and gout, has recently been associated with liver injury and fibrosis.26–28 Our findings confirmed that elevated SUA levels were independently associated with fibrosis, with an OR of 1.009. The pathogenic role of UA may involve the activation of nucleotide-binding oligomerization domain-like receptor family pyrin domain-containing three inflammasomes and an increased production of proinflammatory cytokines in the liver, contributing to a pro-fibrotic milieu.
Our results, together with previous studies, suggest that metabolic factors exert a stronger influence on fibrosis progression than virological factors in CHB patients. For example, a large prospective cohort study demonstrated that coincidental metabolic syndrome significantly increased the risk of liver fibrosis progression in treatment-naïve CHB patients, independent of viral load and hepatitis activity. 29 Similarly, a recent case–control study in biopsy-proven metabolic dysfunction-associated fatty liver disease patients found that hypertension, type 2 diabetes, and elevated GGT levels, rather than HBV-related parameters, are independently associated with significant fibrosis, highlighting the prominant role of metabolic rather than viral factors in fibrosis development. 9
Importantly, age, sex, and hypertension were not independently associated with fibrosis in multivariate analysis despite their associations in univariate models. In addition, other factors such as the total bilirubin and low HDL-C levels as well as and diabetes also did not retain statistical significance in the multivariate analysis. This suggests that metabolic parameters may have a more direct and robust impact on fibrosis risk compared with demographic or traditional cardiovascular factors in the context of CHB.
The multivariate model incorporating metabolic indicators achieved a high predictive performance (AUC = 0.928), indicating its potential utility as a noninvasive tool for fibrosis risk stratification. These findings align with recent calls for integrating metabolic screening into liver disease management guidelines, especially in the context of CHB, where traditional fibrosis indices such as FIB-4 and APRI may not fully reflect metabolic influences.
Limitations
This study has certain limitations. First, the cross-sectional design precludes causal inference. Second, fibrosis was assessed by noninvasive indices rather than with biopsy, which may have led to misclassification. Third, it was a single-center study; therefore, the findings cannot be generalized and require external validation in broader populations.
Conclusion
In conclusion, our study demonstrates that metabolic abnormalities, specifically elevated BMI and high FPG, triglycerides, and SUA levels, are significantly and independently associated with liver fibrosis in CHB patients. Incorporating metabolic indicators into routine fibrosis assessment may improve early detection and guide targeted interventions to halt fibrosis progression in this population.
Footnotes
Acknowledgments
The authors thank all the clinicians and staff at Ganzhou People’s Hospital for their assistance in data collection.
Author contributions
Li Liu and Yingfeng Wei designed the study and were responsible for the submission of the manuscript. Peng Ye, Qiuping Gu, Ling Zeng, and Lijuan Liang contributed to data collection and interpretation. Li Liu drafted the manuscript. Yingfeng Wei provided critical revision and overall supervision. All authors reviewed and approved the final version of the manuscript.
Availability of data and materials
The datasets used and analyzed during the current study are available from the corresponding author upon reasonable request.
Declaration of conflicting interests
The authors declared no potential conflicts of interest with respect to the research, authorship, and/or publication of this manuscript.
Funding
This research received no specific grant from any funding agency in the public, commercial, or not-for-profit sectors.