
Abstract
Objective
This retrospective cohort study aimed to develop and validate a nomogram for predicting in-hospital mortality among patients with community-acquired pneumonia admitted to the intensive care unit.
Methods
Data of patients meeting the inclusion criteria were extracted from the Medical Information Mart for Intensive Care-IV database, and the patients were randomly allocated into training (n = 3798, 70%) and validation (n = 1629, 30%) cohorts. First-day intensive care unit admission parameters were averaged. Least Absolute Shrinkage and Selection Operator regression and multivariate logistic regression analyses were used to identify mortality risk factors in the training cohort, followed by nomogram construction. Model performance was evaluated based on discrimination (area under the curve), calibration (Hosmer–Lemeshow test and bootstrap resampling), and clinical utility (decision curve analysis). Data from emergency intensive care unit were used to perform external validation of the value of the model.
Results
In total, 5427 patients were included. Age, red cell distribution width, Sequential Organ Failure Assessment, Acute Physiology Score-III, blood urea nitrogen-to-serum creatinine ratio, anion gap, osmolarity, and sepsis were identified as independent risk factors for hospital mortality. The nomogram demonstrated superior discrimination compared with Sequential Organ Failure Assessment and Acute Physiology Score-III in the validation (area under the curve: 0.772 vs. 0.685–0.724) and training (area under the curve: 0.787 vs. 0.708–0.740; p < 0.05) sets. Calibration and decision curve analyses confirmed robust performance (Hosmer–Lemeshow p = 0.11; net benefit threshold: 20%–80%). In both cohorts, calibration and decision curve analyses showed that the nomogram had good calibration degree, discriminative ability, and clinical benefits. Data from emergency intensive care unit showed that the area under the curve of the model was 0.7864 (95% confidence interval, 0.76–0.81), area under the curve of Sequential Organ Failure Assessment was 0.7217 (95% confidence interval, 0.69–0.75), and area under the curve of Acute Physiology Score-III was 0.7055 (95% confidence interval, 0.68–0.73).
Conclusions
This nomogram provides moderate predictive accuracy for hospital mortality in critically ill patients with community-acquired pneumonia and may aid prognosis assessment.
Keywords
Background
Community-acquired pneumonia (CAP) is the fourth leading cause of death due to infectious diseases. 1 Among its various manifestations, severe CAP poses the greatest threat due to its high incidence and mortality rates.2,3 Specifically, patients with severe CAP admitted to the intensive care unit (ICU) have a hospital mortality rate of approximately 30%, 4 and the 1-year mortality rate can reach 50%. 5 Furthermore, CAP poses significant social and clinical burdens. 6 Early identification of risk factors for mortality can empower clinicians to intervene promptly, thereby potentially reducing CAP-related mortality. 7
CAP guidelines recommend the use of CURB65 and Pneumonia Severity Index (PSI) scores for assessing CAP severity. The PSI scoring system incorporates both acute and chronic disease variables to predict CAP prognosis and evaluate pneumonia severity. 8 However, due to the extensive number of statistical variables required, its application can be cumbersome and time-consuming. 9 In contrast, CURB65, with its simpler criteria, lacks precision and is not an ideal tool for predicting in-hospital mortality among patients with CAP admitted to the ICU.
Clinical prediction models are pivotal in identifying high-risk factors for mortality, enabling timely interventions by healthcare providers. Nevertheless, predicting hospital mortality is a multifaceted task that cannot be accomplished using a single variable. Therefore, the objective of this study was to develop a nomogram for predicting hospital mortality among patients with CAP admitted to the ICU.
Methods
Data source
This retrospective observational study used data from the open database Medical Information Mart for Intensive Care (MIMIC)-IV, and the database was approved by the Institutional Review Board (IRB) of Beth Israel Deaconess Medical Center (2001-P-001699/14). 10 Patient consent was not required as this was a retrospective study.
We completed the training course and then obtained approval to extract data from MIMIC-IV (Certification Number: 62208734). In the database, patients with CAP were identified based on the International Classification of Diseases (ICD)-9 and ICD-10 codes. Our study was conducted in accordance with the Helsinki Declaration of 1975, as revised in 2013. Patient information in the MIMIC-IV database has been de-identified so that the patients may not be identified in any way. The reporting of this study conforms to the Strengthening the Reporting of Observational Studies in Epidemiology (STROBE) guidelines. 11
Research participants
When patients had multiple ICU admissions, we selected the first one for inclusion in our study. Only adult patients admitted to the ICU, defined as individuals aged ≥18 years, were eligible for participation. Additionally, if the proportion of missing values within a patient’s dataset was >20%, then the patient was excluded.
Data extraction
Data regarding demographic characteristics (sex, age) and disease factors (hypertension) were collected. Simultaneously, we retrieved data on whether the patients underwent mechanical ventilation or continuous renal replacement therapy (CRRT) after the first day of ICU admission as well as whether they had sepsis as a comorbidity. We also collected data on the average values of laboratory indicators and other assessments on the first day of ICU admission (white blood cell (WBC) count, red cell distribution width (RDW), platelet (PLT) count, anion gap, blood urea nitrogen-to-serum creatinine ratio (BUN/SCr)), Sequential Organ Failure Assessment (SOFA) score, Acute Physiology Score-III (APS-III), and outcome (hospital mortality)). Serum osmolarity was calculated using the following equation: (2 × Na+ + K+) + (glucose/18) +(urea/2.8). Data were obtained using Structured Query Language via pgAdmin (version 4). We used the random forest method for multiple interpolation of all serologic indicators, considering that the missing values did not exceed 5%.
Statistical analysis
The normal distribution of continuous variables was examined using the Shapiro–Wilk test. Unpaired student t-test was used for the analysis of parametric distribution variables. The nonparametric variables were analyzed using the Wilcoxon rank sum test. 12 Continuous variables were expressed as mean ± SD. Categorical variables were analyzed using either the Pearson Square test or Fisher Precision test and expressed in numbers.
All patients were randomly assigned to the training and validation cohorts in a ratio of 7:3, ensuring that the outcome events were randomly distributed in the two cohorts. To evaluate the presence of multicollinearity among the predictor variables, we computed variance inflation factors (VIFs). Variables exhibiting a VIF >5 were deemed to have significant multicollinearity and were either excluded from the analysis or combined with other variables to mitigate this issue. Least Absolute Shrinkage and Selection Operator (LASSO) regression analysis was used to standardize and center the variables prior to performing 10-fold cross-validation, which was repeated ten times to ensure robustness. The optimal lambda value was selected based on this process. Then, multivariate logistic regression analysis was used to identify independent risk factors, which were then included in the final model, and a corresponding nomogram was plotted. The area under the receiver operating characteristic (ROC) curve (AUC) was used to assess the prediction accuracy of the model. 13 Z test was used to compare the difference in AUC; Hosmer–Lemeshow goodness of fit test, 14 bootstrap resampling, and calibration curve analysis were used to assess the consistency between the predicted value of the model and the actual value; decision curve analysis (DCA) 15 was used to analyze the clinical benefits of the model. Data from emergency intensive care unit (EICU) were used to perform external validation of the value of the model.
A two-tailed p-value of <0.05 was considered to indicate statistical significance in all analyses. All analyses were performed using STATA18 (StataCorp, College Station, TX, USA).
Results
Baseline characteristics of the included patients
According to the ICD disease code, a total of 5427 patients were included in this study.
The baseline characteristics of included patients are shown in Table 1. All patients were randomly assigned into the training (n = 3798, 70%) and validation (n = 1629, 30%) sets. There was no statistical difference between the training and validation sets in terms of various factors. In the training set, the median age of patients with CAP in the survival group was 68 years, which was lower than that of patients in the nonsurvival group (74 years). RDW, WBC count, PLT count, osmolarity, anion gap, BUN/SCr, SOFA score, APS-III, vent, sepsis, and CRRT showed statistically significant difference between survivors and nonsurvivors in the training and validation sets.
Baseline characteristics of the included patients.

WBC: white blood cell; PLT: platelet; RDW: red cell distribution width; BUN/SCr: blood urea nitrogen-to-serum creatinine ratio; SOFA: Sequential Organ Failure Assessment; APS-III: Acute Physiology Score-III; CRRT: continuous renal replacement therapy.
Factors predicting hospital mortality in patients with CAP
All variables had a VIF value of <5. In the training set, among all 13 associated characteristic variables, 11 potential predictors were selected on the basis of the data from the training set (Figure 1(a) and Figure 2(b)) and had nonzero coefficients in the LASSO regression model. These predictors included age, WBC count, BUN/SCr, RDW, APS-III, sepsis, PLT count, SOFA score, anion gap, osmolarity, and CRRT.

LASSO regression analysis for screening the predictors of in-hospital mortality of CAP. LASSO: least absolute shrinkage and selection operator; CAP: community-acquired pneumonia.
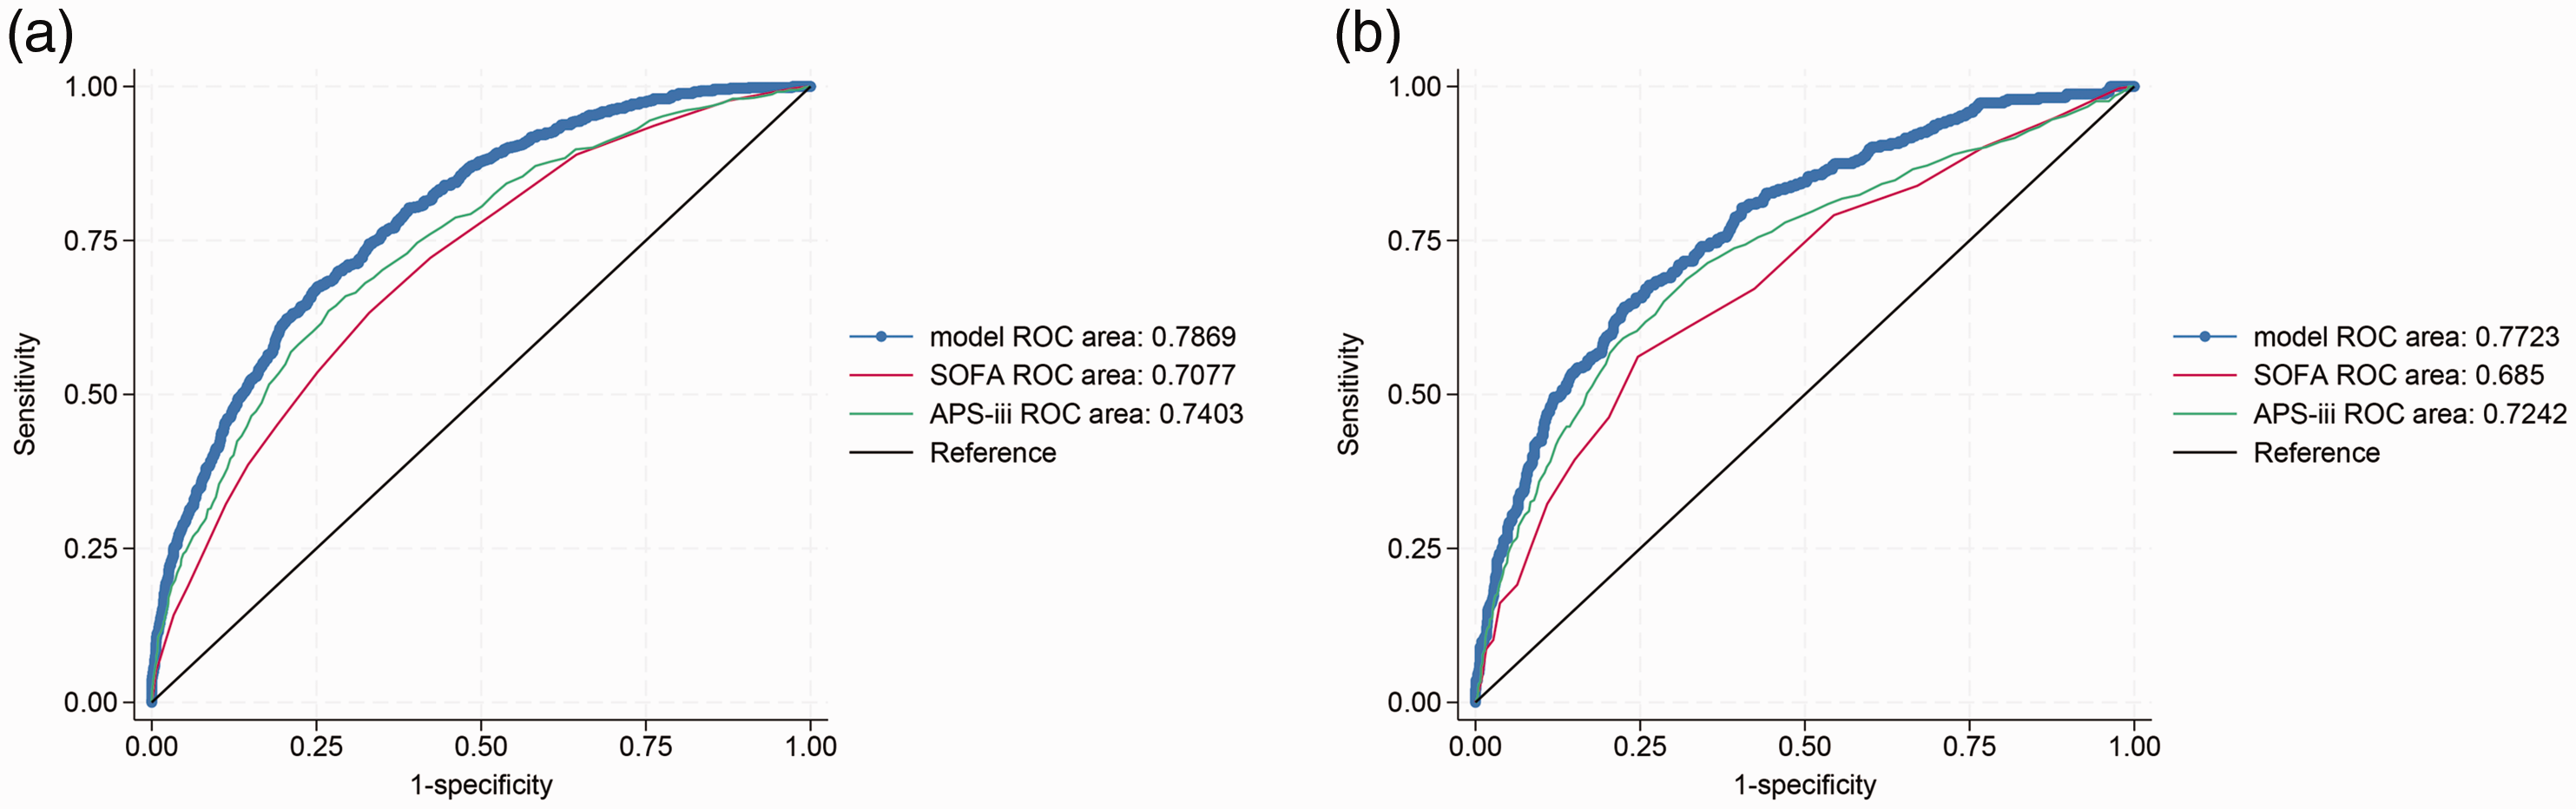
ROC curves of training (a) and validation (b) sets. ROC: receiver operating characteristic.
The results of logistic regression analysis in the training set are shown in Table 2. Age, RDW, SOFA score, APS-III, BUN/Cr, anion gap, osmolarity, and sepsis showed statistically significant differences. We ultimately included the variables age, RDW, SOFA score, APS-III, BUN/Cr, anion gap, osmolarity, and sepsis in our model.
Results of multivariate logistic regression analysis.

SE: standard error; CI: confidence interval; WBC: white blood cells; RDW: red cell distribution width; BUN/SCr: blood urea nitrogen-to-serum creatinine ratio; SOFA: Sequential Organ Failure Assessment; APS-III: Acute Physiology Score-III; CRRT: continuous renal replacement therapy; PLT: platelet; cons: constant.
Establishment and evaluation of the nomogram model for patients with CAP and high risk of mortality
We used the training set to establish a nomogram model for hospital mortality in patients with CAP. The ROC curve was used to assess the occurrence of hospital mortality in patients with CAP. In the training set, the AUC of the model was 0.7869, the AUC of APS-III was 0.7403, and the AUC of SOFA score was 0.7077. Z test showed that our model was superior to SOFA score and APS-III (p < 0.05). In the validation set, the AUC of the model was 0.7723, the AUC of APS-III was 0.7242, and the AUC of SOFA score was 0.685 (Figure 2). The results showed that the model had improved predictive ability compared with APS-III and SOFA score (p < 0.05).
Results of calibration curve analysis
The Hosmer–Lemeshow goodness of fit test was performed, and the results showed a p-value of 0.11, indicating that the model was well-calibrated. In the calibration curve, the y-coordinate indicated the actual incidence probability in the study cohort, and the x-coordinate indicated the estimated probability of the model (Figure 3). The 45° red line represents a perfect prediction. 16

Calibration curve analysis of training (a) and validation (b) sets.
Bootstrap test
We adjusted the model performance evaluation through 500 bootstrap resamplings. The bootstrap plot (Figure 4) showed that after bootstrap adjustment, the Brier score of the training set was 17.5%, and the slope was 0.984; the Brier score of the validation set was 16.2%, and the slope was 0.965, indicating the superiority of model predictions.

Bootstrap plot.
Results of DCA
Figure 5 shows the results of DCA in the training (Figure 5(a)) and validation (Figure 5(b)) sets. The results showed that the model’s net benefit exceeded treat ALL and treat NONE at a threshold of 20%–80%, indicating its high applicability within this range.
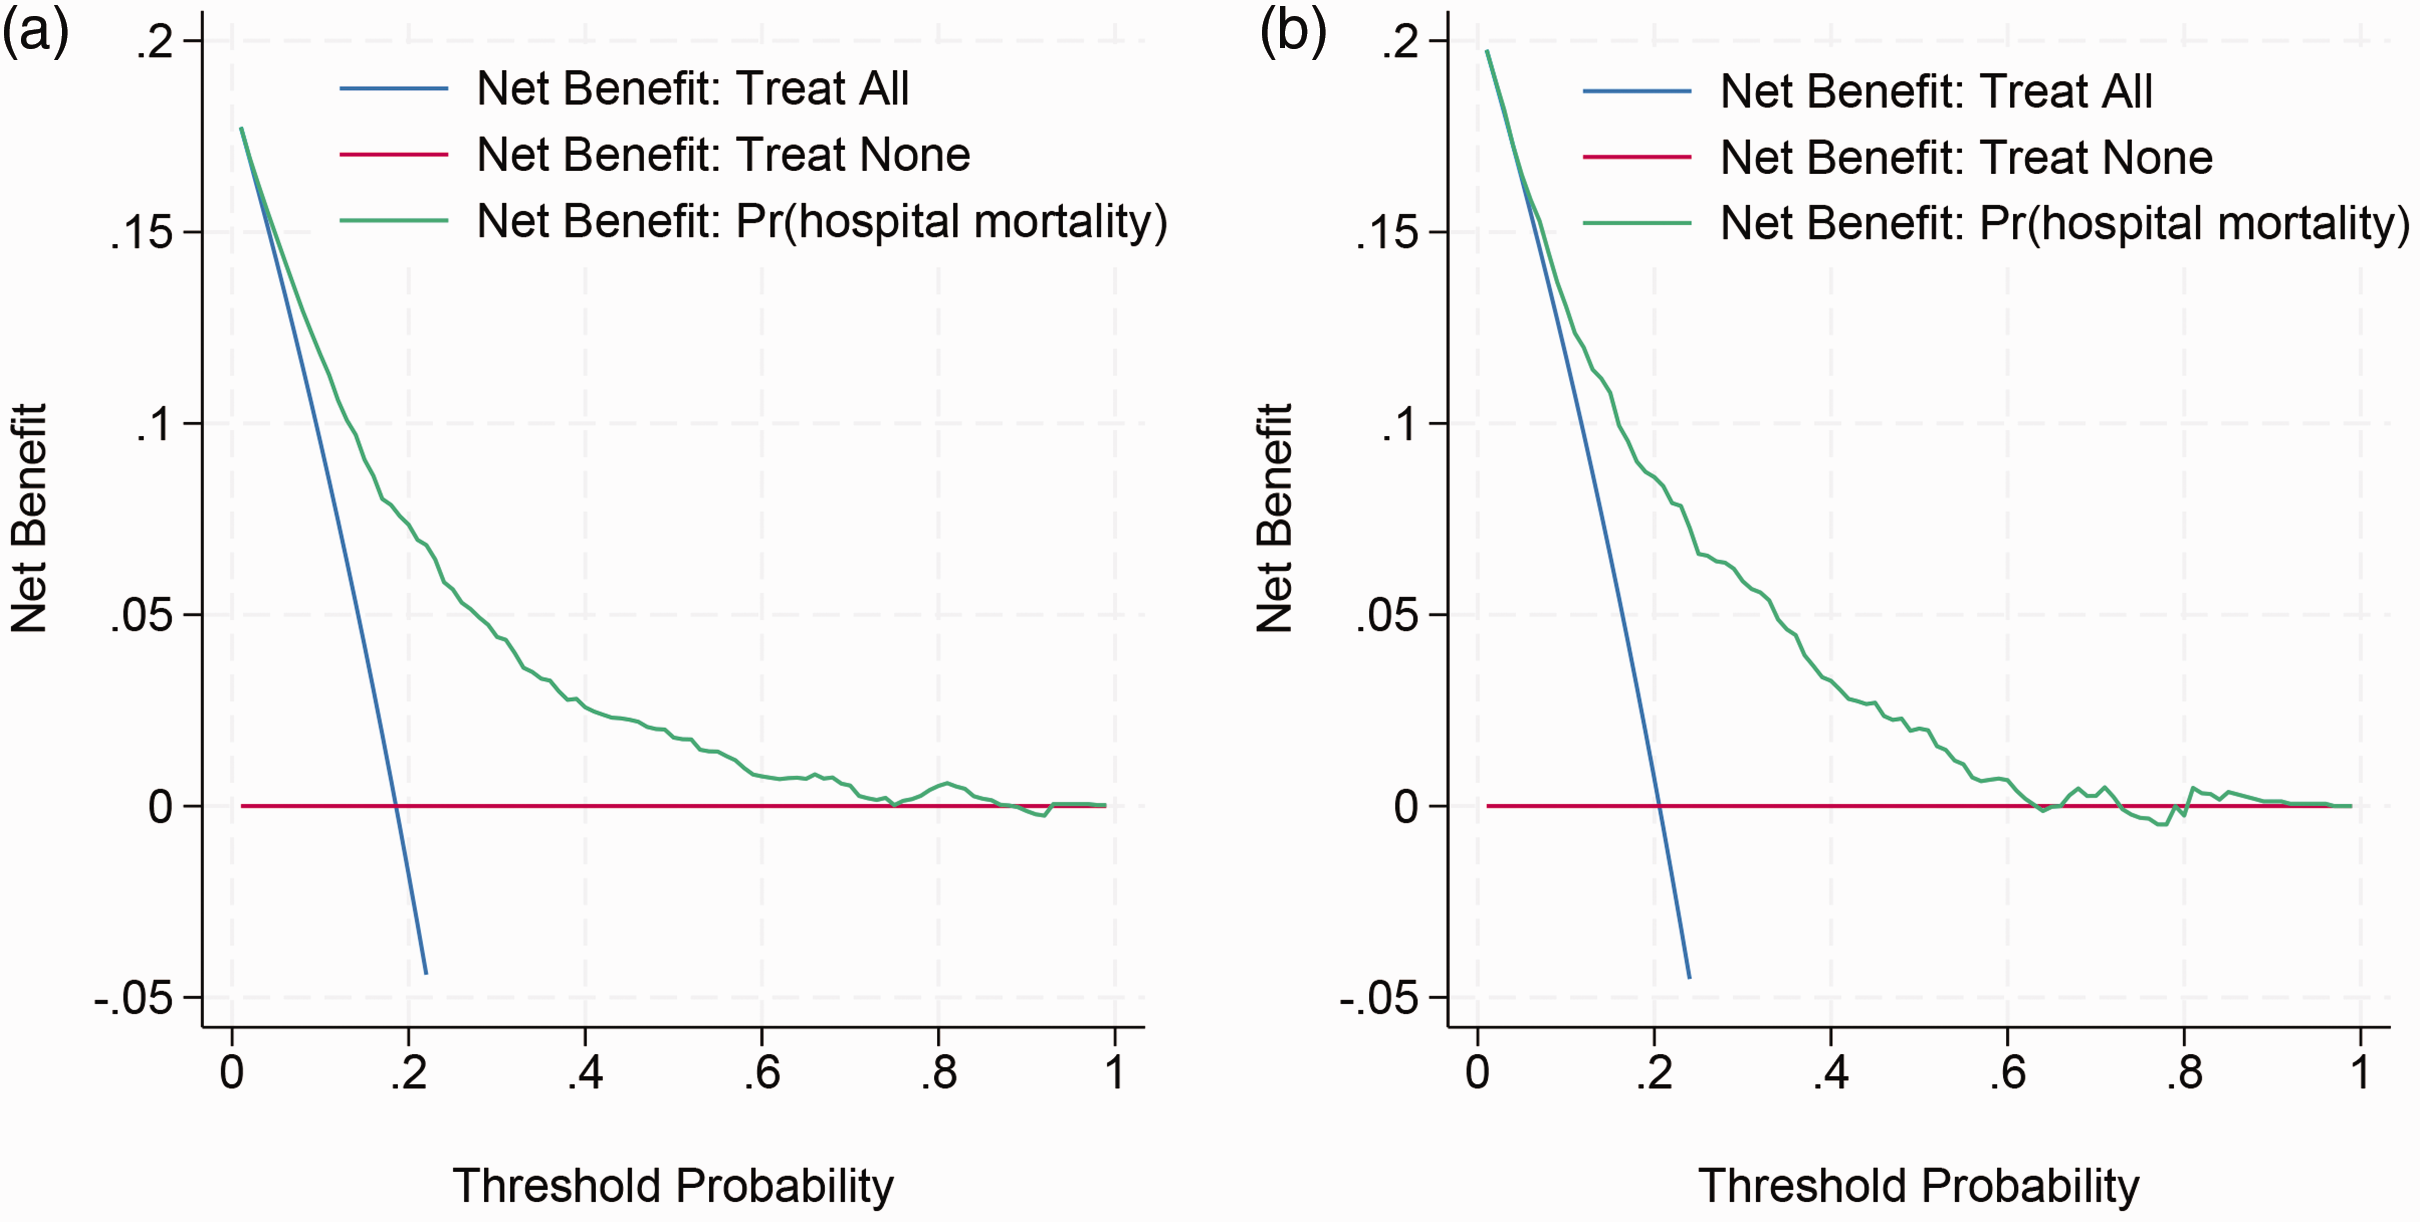
Decision curve analysis of training (a) and validation (b) sets.
Predictive hospital mortality based on the nomogram
Based on the screened features, a nomogram was plotted (Figure 6). The total score can be obtained by adding the scores for each variable in the nomogram. The probability corresponding to the total nomogram score in the predictor (hospital mortality) is the probability of hospital mortality in patients with CAP.

Nomogram of hospital mortality associated with CAP. CAP: community-acquired pneumonia.
Evaluation of the prediction value of the model in EICU patients
The data from EICU were used to perform external validation, and 3297 patients were included. The detailed characteristics of the participants are shown in Supplementary Table S1. The AUC value of the prediction model for hospital mortality was 0.7864 (95% confidence interval (CI), 0.76–0.81), AUC value of SOFA score for hospital mortality was 0.7217 (95% CI, 0.69–0.75), and AUC value of APS-III for hospital mortality was 0.7055 (95% CI, 0.68–0.73). The results showed that the model exhibited improved predictive ability compared with APS-III and SOFA score (p < 0.05).
Discussion
Based on clinical data from patients, we constructed a nomogram to predict the hospital mortality rate of patients with CAP admitted to the ICU. The results indicated that age, RDW, SOFA score, APS-III, BUN/SCr, anion gap, osmolarity, and sepsis were independent predictive factors affecting hospital mortality. In both the training and validation sets, the AUC of the model exceeded 0.7, suggesting moderate predictive ability.
CAP remains a significant public health concern, with 489 million cases of respiratory tract infections reported worldwide. 17 In 2019, pneumonia was the ninth leading cause of death in the United States, resulting in approximately 50,000 deaths. 18 In high-income countries, the mortality rate of hospitalized patients with CAP is approximately 10%–12%. 19
Due to the disease complexity in patients with CAP admitted to the ICU, current prognosis and diagnosis methods are insufficient for assessing disease severity. To determine appropriate intervention levels, new biomarkers such as the neutrophil-to-lymphocyte ratio, platelet-to-lymphocyte ratio, glucose-to-lymphocyte ratio, and lymphocyte-to-monocyte ratio are increasingly being used to predict CAP mortality. Additionally, severity scores such as SOFA score, Acute Physiology and Chronic Health Evaluation (APACHE)-II, and APS-II have significant prognostic value in identifying severe CAP. 20 However, a single indicator cannot accurately predict the hospital mortality of patients with CAP admitted to the ICU. Older patients are more likely to be affected by CAP. An immunocompromised state and weakness can lead to an increased risk of pneumonia in this population. 21 Although nursing techniques and antibiotic use have reduced mortality rates, older patients are prone to respiratory failure and shock, leading to a high mortality rate. 22 Meanwhile, due to the atypical clinical manifestations in older patients, diagnosis may be very difficult, leading to poor prognosis and higher hospital mortality than those in other populations. 23
The APS-III score comprises 12 physiological indicators. For each patient admitted to the ICU, it identifies the most abnormal value (either the highest or lowest) among these indicators during the first 24 h. It was associated with higher mortality rate in patients with CAP than in those without CAP. The mortality rate in patients with severe pneumonia and a SOFA score ≥2 is significantly higher than that in patients with a SOFA score <2. For instance, a study involving 163 patients with suspected infection demonstrated that the AUC of the SOFA score was 0.782, which was significantly superior to other scoring systems such as qSOFA and Systemic Inflammatory Response System. This suggests that the SOFA score has the strongest predictive ability for 28-day mortality. 24
RDW is a parameter that reflects the heterogeneity of red blood cell volume. It represents the coefficient of variation of red blood cell volume size, reflecting the heterogeneity of red blood cells. 25 Research shows that RDW is a robust biomarker for predicting certain respiratory diseases. 26 Elevated RDW is associated with an increased risk of death from infectious diseases. 27
BUN/SCr is an independent predictor of many illnesses, such as heart failure, gastrointestinal bleeding, stroke, and hip fractures.28,29 Other studies have shown that BUN/SCr has better predictive ability for disease prognosis than BUN or Cr alone. BUN/SCr may be a useful predictor of hospital mortality in respiratory system disorders. 30 Our study found that there were significant differences between the survival and nonsurvival groups in the training and validation sets. Furthermore, these differences persisted in the multivariate regression analysis.
Hyperosmolarity is associated with increased mortality in patients who are critically ill with cardiac, cerebral, vascular, and gastrointestinal diagnoses at admission. 31 Patients with severe pneumonia often experience septic shock, dehydration, or hyperglycemia (such as diabetes or stress hyperglycemia), resulting in increased serum osmolality. A hyperosmotic state can exacerbate cell dehydration, cause microcirculation disorders, and may induce complications, such as consciousness disorders and renal function damage. Anion gaps are elevated in metabolic acidosis. Due to septic shock, tissue hypoxia, or renal dysfunction, patients with severe pneumonia often exhibit elevated anion gaps, which may induce multiple organ failure.
Lower thresholds may be more relevant for identifying high-risk patients who require immediate intervention, while higher thresholds may be suitable for patients in whom the benefits of intervention need to be carefully weighed against potential harms. Our threshold selection (20%–80%) reflects common practices in critical care, where intermediate-to-high-risk thresholds are used for decisions regarding escalation/de-escalation. 32
Although several previous studies have established prediction models for mortality in patients with CAP, 33 our study differs by selecting distinct factors for inclusion. Notably, our nomogram is characterized by its simplicity and convenience. To construct this hospital mortality prediction nomogram, we employed LASSO and logistic regression analysis. Subsequently, we evaluated the performance of our novel nomogram model in both the training and validation cohorts using AUC, calibration curve, and DCA, consistent with methodologies employed in prior studies. 16
APACHE-II has been extensively utilized in ICU clinical practice. 34 Specifically, Li et al. demonstrated that a higher APACHE-II score at admission is a significant factor influencing survival in these patient populations. 35 However, due to the high proportion of missing values (>20%) for APACHE-II, we excluded this variable from our analysis. Instead, we included APS-III, which is a component of the APACHE-II system but is considered simpler than APACHE-II. 36 Our findings indicate that APS-III is a risk factor for hospital mortality.
Limitations
In this study, we extracted relevant clinical information on patients with CAP from the MIMIC-IV and EICU database; however, there may be several confounding factors affecting the incidence of all-cause mortality. Furthermore, as an observational study, we cannot control for confounding variables, which may lead to biased results. Moreover, there may be selection bias in the sample, affecting the generalizability of the study results.
Conclusion
Age, RDW, SOFA score, APS-III, BUN/SCr, anion gap, osmolarity, and sepsis were important predictive factors for hospital mortality among patients with CAP admitted to the ICU. The nomogram, which included the eight predictors, exhibited moderate predictive accuracy and might be helpful for prognosis assessment.
Supplemental Material
sj-pdf-1-imr-10.1177_03000605251340304 - Supplemental material for Development and validation of a predictive model for hospital mortality in patients with community-acquired pneumonia admitted to the intensive care unit
Supplemental material, sj-pdf-1-imr-10.1177_03000605251340304 for Development and validation of a predictive model for hospital mortality in patients with community-acquired pneumonia admitted to the intensive care unit by Xuefeng Song, Qiang Zhang, Zhijiang Qi and Bo Liu in Journal of International Medical Research
Footnotes
Acknowledgements
None.
Authors’ contributions
LB and QZJ designed the study. ZQ analyzed the data. SXF analyzed the data and wrote the original manuscript. All authors approved the final manuscript.
Consent to participate
None.
Consent for publication
Not applicable.
Data availability statement
The data that support the findings of this study are available from the corresponding author upon reasonable request.
Declaration of conflicting interests
None declared.
Ethics approval and consent to participate
Our data are sourced from the MIMIC-IV database and do not include protected health data. The database was approved by the Institutional Review Board (IRB) of Beth Israel Deaconess Medical Center.
Funding
None.
Supplementary material
Supplemental material for this article is available online.
References
Supplementary Material
Please find the following supplemental material available below.
For Open Access articles published under a Creative Commons License, all supplemental material carries the same license as the article it is associated with.
For non-Open Access articles published, all supplemental material carries a non-exclusive license, and permission requests for re-use of supplemental material or any part of supplemental material shall be sent directly to the copyright owner as specified in the copyright notice associated with the article.