
Abstract
Objective
This study aimed to assess the reliability of the spot urine protein/creatinine (sP/Cr) ratio for evaluating proteinuria across different ranges and renal functions.
Methods
In this retrospective study, we analyzed 24-hour urine protein excretion (24 h UP) and sP/Cr measurements in 216 patients with renal disease. Pearson correlation and Bland–Altman analyses were performed to evaluate the correlation and agreement between 24 h UP and the sP/Cr.
Results
The patients were categorized into the following three 24 h UP groups: 150 to 299 mg/24 hours, 300 to 3499 mg/24 hours, and >3500 mg/24 hours. Significant positive correlations were found between the sP/Cr and the first two 24 h UP groups (r = 0.9104 and r = 0.9721, respectively) but not between the third group (r = 0.3110). Bland–Altman analysis confirmed good agreement in the group with <3500 mg/day proteinuria. Estimated glomerular filtration rates ≥60 mL/minute and <60 mL/minute were significantly correlated with the sP/Cr (r = 0.8714 and r = 0.4516, respectively).
Conclusion
The sP/Cr ratio is a reliable indicator for non-nephrotic proteinuria, irrespective of renal function, but is unreliable for nephrotic-range proteinuria.
Keywords
Introduction
Proteinuria represents an early and essential factor for the diagnosis, assessment of disease severity, and monitoring of treatment response in renal disease. Early detection and treatment of chronic kidney disease by the finding of proteinuria can considerably decrease the risk of kidney failure progression.1,2 The gold standard for urinary estimation of protein is from a 24-hour urine sample. This method averages the variation in proteinuria due to the circadian rhythm, physical activity, and posture. However, 24-hour urine collection can be subject to error due to overcollection or undercollection. 3 Twenty-four-hour urine collection is also cumbersome and inconvenient to collect and delays management. Therefore, the spot urine protein/creatinine (sP/Cr) ratio was introduced as a rapid test from spot urine samples to avoid inaccurately timed and arduous urine collection in clinical practice. 4 In recent decades, the sP/Cr ratio has been widely used to estimate daily protein excretion, but there is a lot of controversy regarding the diagnostic reliability of using the sP/Cr for assessing proteinuria.5–9
In this study, we investigated the reliability of the sP/Cr in the assessment of 24-hour urine protein excretion (24 h UP) in patients with various levels of proteinuria and estimated glomerular filtration rates (eGFRs).
Patients and methods
Patients
This retrospective, observational study was carried out in the Department of Nephrology, Yingtan 184 Hospital between January 2019 and January 2024. We included patients aged older than 18 years with different renal diseases. Data on demographics and concomitant diseases were collected from the medical records. We de-identified all patients’ details, and the data were recorded by the investigators in such a way that the patients could not be identified, and the anonymity of the data was ensured. Ethics review committee approval for this type of retrospective study was not required according to regulations in China. Informed consent of the patients was also not required because of the retrospective nature of the study. In this study, we followed the STROBE guidelines. 10
Measurements
All of the patients were provided detailed instructions for 24-hour urine collection. A random mid-morning spot urine sample was also collected the next day for measuring urinary protein and creatinine concentrations. Blood samples were collected for the measurement of serum creatinine concentrations to calculate the eGFR by the modification of diet in renal disease method. 11 The sP/Cr ratio was calculated by dividing proteinuria (mg/dL) by urine creatinine concentrations (g/dL). The 24 h UP is expressed in mg/24 hours.
Creatinine concentrations in blood and urine were measured by Jaffé’s method 12 for colorimetric and kinetic determination of creatinine, and the protein concentration in urine was determined by the turbidimetric method 13 using a Beckman Coulter AU2700 instrument (Brea, CA, USA).
Statistical analysis
Quantitative variables are expressed as the mean and standard deviation and qualitative variables as percentages. The total patient population was stratified according to degrees of 24 h UP into the following three groups: 150 to 299 mg/24 hours, 300 to 3499 mg/24 hours, and >3500 mg/24 hours. Analysis of variance was used to compare the general characteristics and clinical data between the three groups. The Pearson correlation coefficient (r) was calculated to assess the relation between the values of urinary proteinuria obtained using 24 h UP and the sP/Cr ratio in the same patient. The Bland–Altman method was used to analyze the degree of agreement between these two methods of measurements. The statistical analysis was performed using IBM SPSS version 28.0 (IBM Corp., Armonk, NY, USA). Statistical significance was considered when P was <0.05.
Results
The general characteristics and clinic data of the patient population are shown in Table 1. The mean (± standard deviation) age of the patients was 50.4 ± 14.4 years. Among the 216 included patients, 49 (22.7%) had glomerulonephritis, 43 (19.9%) had nephroangiosclerosis, 40 (18.5%) had diabetic nephropathy, 33 (15.3%) had tubulointerstitial nephropathies, 26 (12%) had rheumatological disease, 13 (6%) had pregnancy with preeclampsia, and 12 (5.6%) had other conditions, such as polycystic kidney disease, renal amyloidosis, multiple myeloma, and unknown diseases. There was no significant difference in age or sex between the three groups of patients with proteinuria. Kidney function as measured by serum creatinine concentrations significantly worsened as the degree of proteinuria increased (P = 0.001).
General characteristics and clinic data of the patients in the three 24-hour urine protein groups.

Data are shown as n, n (%), mean ± standard deviation, or range.
24 h UP, 24-hour urine protein excretion; sP/Cr, spot urine protein/creatinine ratio; eGFR: estimated glomerular filtration rate.
*P < 0.001.
We analyzed the correlation between the sP/Cr ratio and 24 h UP (Figure 1). A significant correlation was observed between the sP/Cr ratio and the 24 h UP groups of 150 to 299 mg/24 hours (r = 0.9104, P = 0.001) and 300 to 3499 mg/24 hours (r = 0.9721, P = 0.001) (Figure 1(a) and 1(b)). However, no significant correlation was observed between the sP/Cr ratio and the group with proteinuria in the nephrotic range (24 h UP >3500 mg/24 hours) (r = 0.3110, P = 0.078) (Figure 1(c)).

Correlations between the sP/Cr and 24-hour proteinuria. (a) Twenty-four-hour proteinuria of 150 to 299 mg; (b) 24-hour proteinuria of 300 to 2499 mg; and (c) 24-hour proteinuria >3500 mg. sP/Cr, spot urine protein/creatinine ratio; 24 h UP, 24-hour urine protein excretion.
Figure 2 shows the degree of agreement between 24 h UP and the sP/C. The mean difference between 24 UP and the sP/Cr ratio was −4.91 ± 21.75 (95% confidence interval −47.55 to 37.73) in the 24 h UP 150 to 299 mg/24 hours group and −14.29 ± 117.41 (95% confidence interval −244.431 to 215.84) in the 300 to 3499 mg/24 hours group. However, this mean difference in the nephrotic-range proteinuria group (>3500 mg/day) was 3630.16 ± 5274.36 (95% confidence interval −6708.58 to 13,967.90). Therefore, the agreement was good for proteinuria levels <3500 mg/day, while that for nephrotic-range proteinuria was greatly decreased.
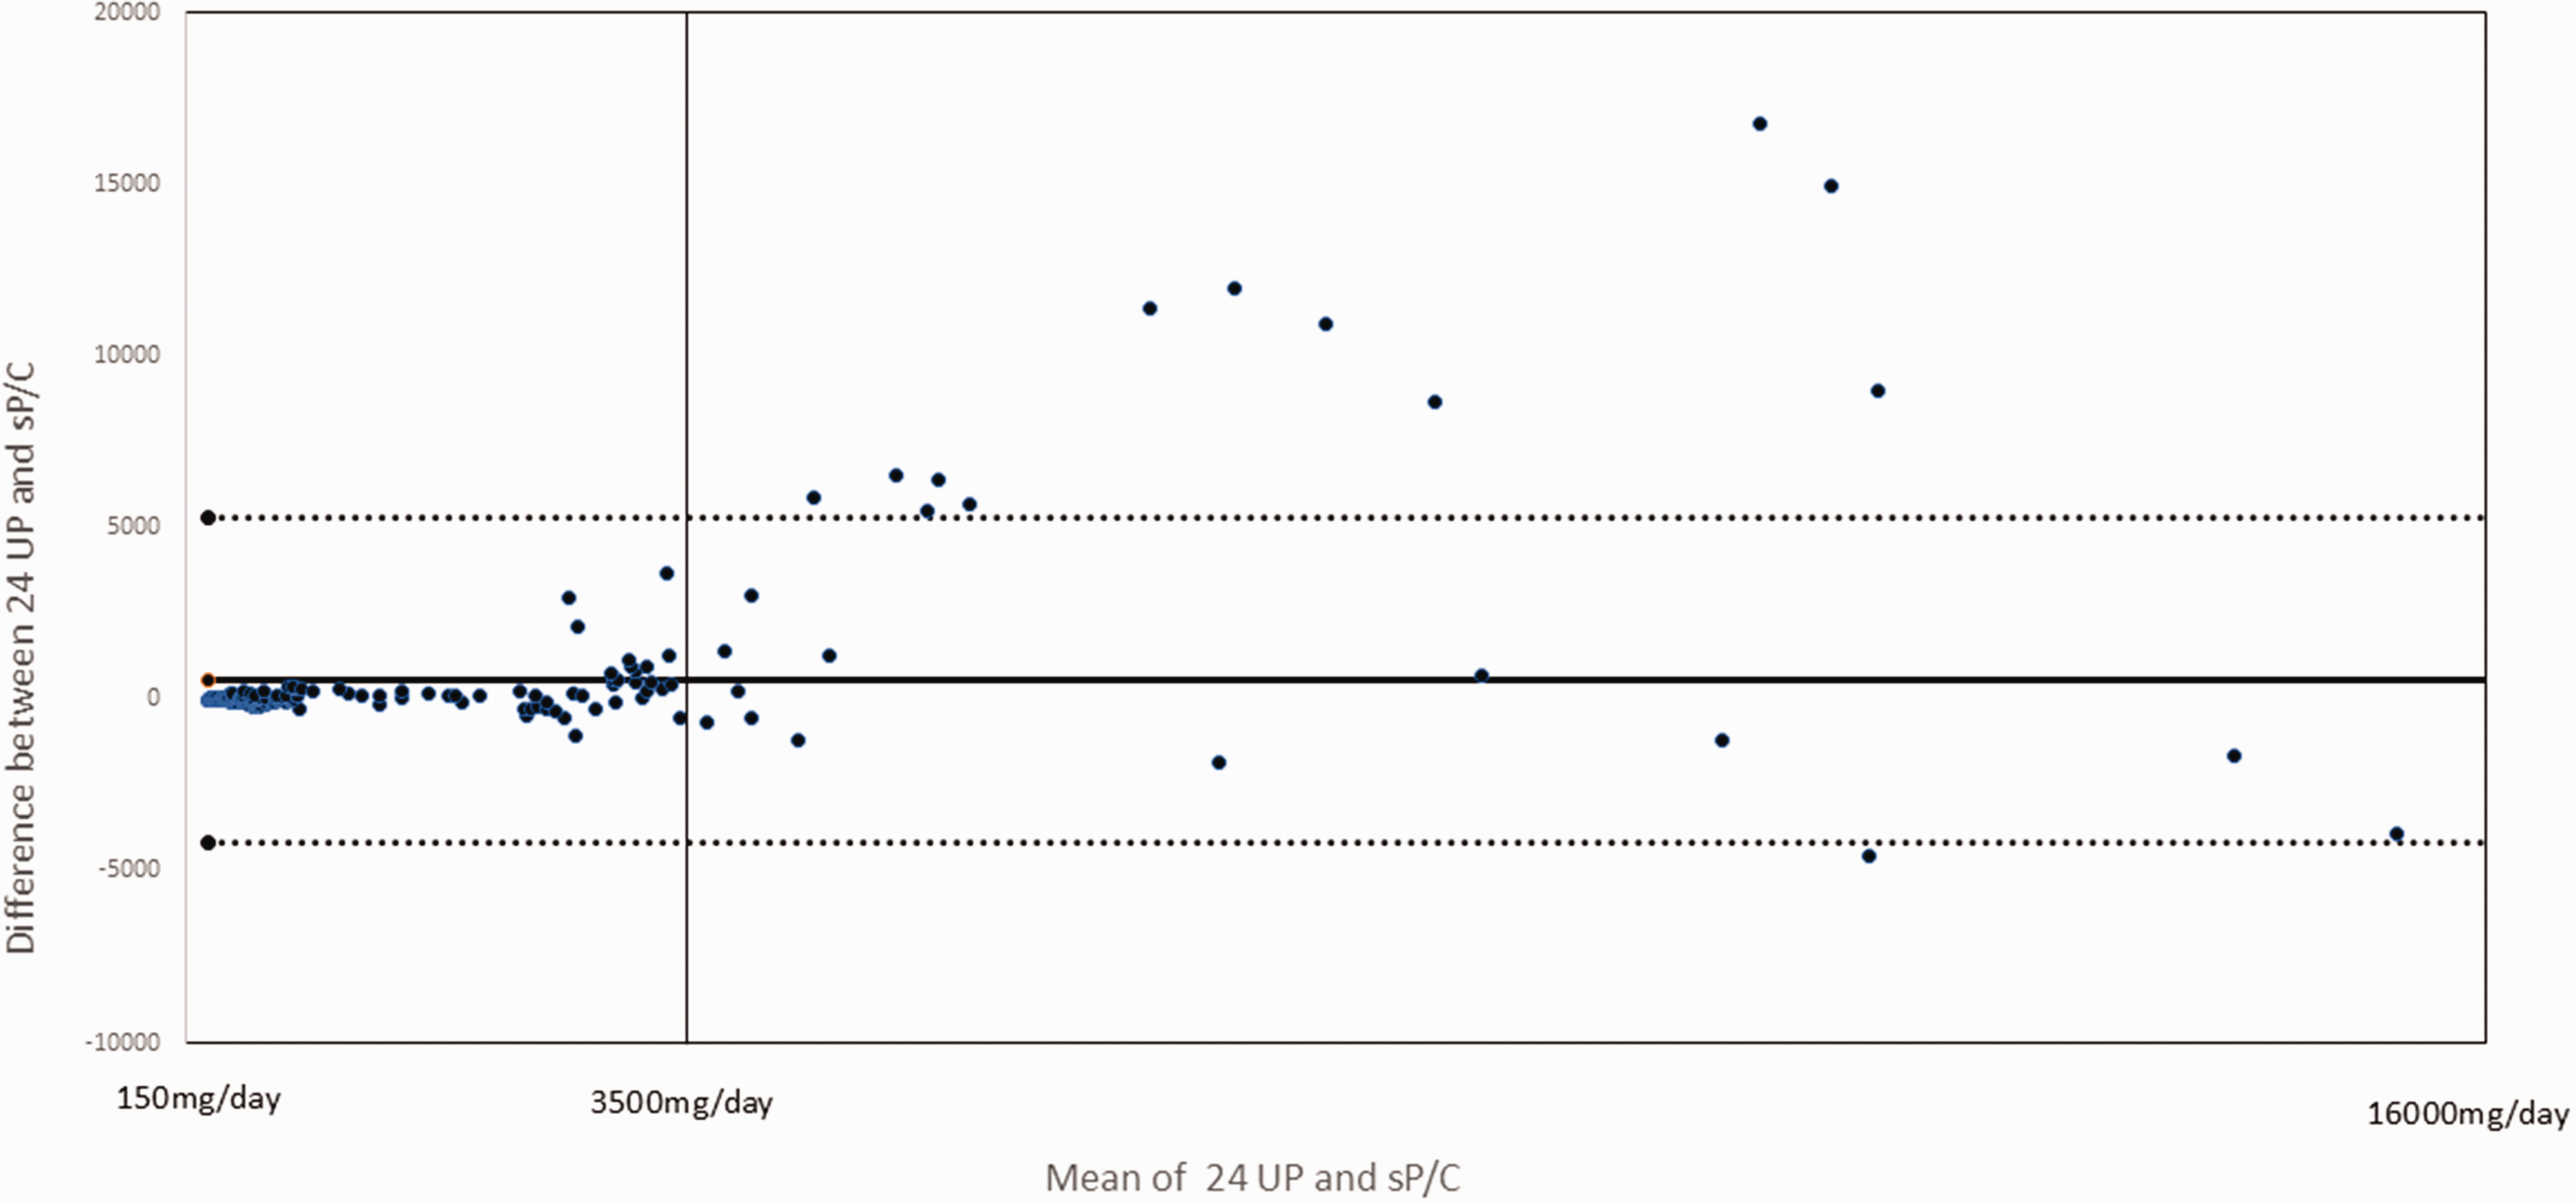
Bland–Altman plot showing agreement analysis between 24 UP and the sP/C. The solid line represents the mean different between 24 UP and the sP/C. The dashed line represents the 95% confidence interval. A larger dispersion can be seen with nephrotic-range proteinuria (>3500 mg/day). 24 h UP, 24-hour urine protein excretion; sP/Cr, spot urine protein/creatinine ratio.
We also assessed the correlation between the sP/Cr ratio and 24 h UP in the patients based on kidney function. When patients were stratified according to the degree of kidney function as determined by the eGFR into two groups, a significant correlation was observed between the values of urinary proteinuria obtained using 24 h UP and the sP/Cr ratio in the same patient in the eGFR ≥60 mL/minute and <60 mL/minute groups (r = 0.8714, P = 0.001; r = 0.4516, P = 0.001, respectively) (Figure 3). However, notably, the correlation in the group with only mild chronic kidney disease (eGFR ≥60 mL/minute) was stronger than that in the eGFR <60 mL/minute group.

Correlations between the sP/Cr and 24-hour proteinuria in patients with various eGFRs. (a) Patients with an eGFR ≥60 mL/minute; and (b) patients with an eGFR <60 mL/minute. sP/Cr, spot urine protein/creatinine ratio; 24 h UP, 24-hour urine protein excretion; eGFR: estimated glomerular filtration rate.
Discussion
Estimation of proteinuria by calculating the sP/Cr ratio is recommended in a variety of clinical practice guidelines.1,3,14,15 Several studies did not show the diagnostic utility of the sP/Cr ratio in clinical practice and showed disagreement in the correlation between the sP/Cr ratio and 24 h UP.8,9,16 However, many investigations have supported the clinical usefulness of the sP/Cr ratio in estimating proteinuria.5–7,17–21 More than 150 mg/day is classified as proteinuria. Our Pearson correlation analysis showed that there was significant correlation between 24 h UP and the sP/Cr ratio in the 24 h UP groups of 150 to 299 mg/24 hours and 300 to 3499 mg/24 hours. However, no significant correlation was observed between 24 h UP and the sP/Cr ratio in the group with proteinuria in the nephrotic range (24 h UP >3500 mg/24 hours). The Bland–Altman analysis showed good agreement for proteinuria levels from 150 to 3499 mg/day, while that for the nephrotic range of proteinuria was decreased. Our study suggests that the sP/Cr ratio is a reliable parameter to estimate proteinuria <3500 mg/day. Therefore, the timely identification of proteinuria may be an optimal approach to detect and treat patients with renal disease and non-nephrotic range proteinuria, and monitor the treatment response to decrease the risk of kidney failure progression.
The usefulness of the sP/Cr ratio for assessing nephrotic-range proteinuria is yet to be determined. Regarding proteinuria in the nephrotic range, some studies showed that the sP/Cr ratio predicted 24 h UP with good accuracy.7,21–23 However, we did not observe a good correlation between the sP/Cr ratio and 24 h UP, which is consistent with the findings of some other studies.24–28 A research group in Australia 24 showed that discriminant sP/Cr ratio values reliably predicted protein excretion thresholds of 0.3, 0.5, 1.0, and 3.0 g/day, and the correlation between these two methods became weaker as proteinuria increased. However, there was unacceptable inaccuracy of the sP/Cr ratio at higher levels of protein excretion. Chen et al studied the relationship between the sP/Cr ratio and 24 h UP in 204 patients with chronic kidney disease, and found a good correlation between them, but Bland–Altman analysis showed high variability in the nephrotic range of proteinuria. 25 Studies by Sahu et al and others26–29 also showed that the correlation between the sP/Cr ratio and 24 h UP became weaker as proteinuria increased. Additionally, there was no agreement between these two methods of determining proteinuria within the nephrotic range. The discrepancy of this relationship between different studies may be attributed to differences in ethnicity, age, sex, muscle size, circadian rhythm of urine collection, or dietary pattern. Further large-scale validation is required to establish a universal consensus on this issue.
Our study showed that in the eGFR ≥60 mL/minute and <60 mL/minute groups, there was a significant correlation between the values of urinary proteinuria obtained using 24 h UP and the sP/Cr ratio in the same patient, and this correlation was strongest in the group with only mild chronic kidney disease (eGFR ≥60 mL/minute). This finding is consistent with previous studies.30–32 Ali et al 30 divided 107 patients into five groups according to a GFR of ≥90, 60 to 89, 30 to 59, 15 to 29, and <15 mL/minute. They found that the correlation between 24 h UP and the sP/Cr ratio was good in all of the five groups. Morales et al 31 studied patients with glomerulonephritis and different levels of renal function. They found that the correlation and agreement between the sP/Cr ratio and 24 h UP was good for all renal function levels, although there were more marked differences as urinary protein excretion increased. Nayak et al 32 studied 100 patients with chronic kidney disease stages 3 and 4 and showed the accuracy of the sP/Cr ratio for assessing 24 h UP in these patients.
The limitations of our study are as follows. This was a single-institution study of only one ethnic group. The number of patients, especially the subgroup of patients with nephrotic-range proteinuria or those with an eGFR <60 mL/minute, was small. Urinary albumin concentrations were not specifically measured and compared with protein, particularly in patients with diabetic nephropathy. Additionally, because of the limited number of patients with an eGFR <60 mL/minute, we divided the patients only into two groups of an eGFR >60 mL/minute and <60 mL/minute, and not into five stages according to the severity of chronic kidney disease. Increasing the number of samples collected, especially in patients with nephrotic-range proteinuria and an eGFR <60 mL/minute, may provide better knowledge of the correlation between the two methods.
In conclusion, our study suggests that the sP/Cr ratio is a reliable parameter for the initial assessment of proteinuria, follow-up surveillance of non-nephrotic-range proteinuria, and monitoring of treatment response in renal diseases, regardless of the level of renal function. Regarding proteinuria within the nephrotic range, there is unacceptable inaccuracy of the sP/Cr ratio, and thus the usefulness of measuring the sP/Cr ratio in this setting needs to be further investigated and confirmed.
Supplemental Material
sj-pdf-1-imr-10.1177_03000605241281874 - Supplemental material for Reliability of the spot urine protein/creatinine ratio for assessing proteinuria in patients with renal disease
Supplemental material, sj-pdf-1-imr-10.1177_03000605241281874 for Reliability of the spot urine protein/creatinine ratio for assessing proteinuria in patients with renal disease by Fengmei Huang, Xiaojie Xie, Manqin Wang, Xiaofang Tong and Ruiqi Wu in Journal of International Medical Research
Footnotes
Acknowledgements
The successful completion of this study could not have been achieved without the help and support of many individuals. The authors are grateful to all members of the laboratory who provided substantial assistance during the experiments.
Author contributions
Study design: XX and FH.
Literature search: XX, FH, and XT.
Manuscript preparation: XX, FH, XT, MW, and RW.
All authors read and approved the final manuscript.
Data accessibility statement
The data supporting the findings of this study are available within the article.
Declaration of conflicting interest
The authors declare that there is no conflict of interest.
Funding
This research received no specific grant from any funding agency in the public, commercial, or not-for-profit sectors.
References
Supplementary Material
Please find the following supplemental material available below.
For Open Access articles published under a Creative Commons License, all supplemental material carries the same license as the article it is associated with.
For non-Open Access articles published, all supplemental material carries a non-exclusive license, and permission requests for re-use of supplemental material or any part of supplemental material shall be sent directly to the copyright owner as specified in the copyright notice associated with the article.