
Abstract
Objectives
To explore the relationship between CADM1 expression and sensitivity to TPF-induced chemotherapy in laryngeal squamous cell carcinoma (LSCC) patients, then investigate its potential mechanisms.
Methods
Differential CADM1 expression was examined in chemotherapy-sensitive and chemotherapy-insensitive LSCC patient samples after TPF-induced chemotherapy using microarray analysis. Receiver operating characteristic (ROC) curve analysis and bioinformatics approaches were used to investigate the diagnostic value of CADM1. Small interfering RNAs (siRNAs) were used to knock down CADM1 expression in an LSCC cell line. Differential CADM1 expression was compared by qRT-PCR assays in 35 LSCC patients treated with chemotherapy, including 20 chemotherapy-sensitive and 15 chemotherapy-insensitive patients.
Results
Public database and primary patient data both suggest that CADM1 mRNA is expressed at lower levels in chemotherapy-insensitive LSCC samples, suggesting its potential usefulness as a biomarker. Knockdown of CADM1 with siRNAs led to decreased sensitivity of LSCC cells to TPF chemotherapy.
Conclusions
Upregulation of CADM1 expression can alter the sensitivity of LSCC tumors to TPF induction chemotherapy. CADM1 is a possible molecular marker and therapeutic target for induction chemotherapy in LSCC patients.
Introduction
Larynx cancer is the most common form of head and neck cancer and the second most frequent respiratory tumor after lung cancer. Among larynx cancer cases, 98% are laryngeal squamous cell carcinoma (LSCC).1–3 Although significant progress has been made in treating LSCC, less than half of patients survive for 5 years. Prognosis is worse for patients with intermediate and advanced disease stages. 4 Patients who underwent surgical resection alone had a high recurrence rate and probability of developing secondary cancer within 3 to 5 years after surgery. 5 Therefore, organ preservation combined with radiotherapy is gradually becoming a more reasonable choice for many advanced patients. Zhang et al. found that patients in the organ-preserving radiotherapy group in their study had significantly better emotional characteristics and social relationships than those in the surgical group. 3 Effectively treating advanced larynx cancer remains challenging, with insensitivity to chemotherapeutic agents being the biggest obstacle. 6
Cell adhesion molecule 1 (CADM1) is a member of the immunoglobulin superfamily (Igsf) of adhesion molecules. It is localized in the cell membrane and functions as a tumor suppressor protein. 7 CADM1 upregulation promotes apoptosis and inhibits malignant proliferation in tumors of various epithelial cell origins. 8 CADM1 prevents the progression of squamous cell carcinoma by reducing STAT3 activity through its extracellular structural domain. 7 Using Bayesian network analysis, our previous study also found that low CADM1 expression levels may contribute to chemotherapy sensitivity. 9 CADM1 is downregulated in various malignancies and modulates chemotherapy efficacy in aggressive squamous cell carcinomas by targeting JAK/STAT signaling.7,8 However, its relationship with chemoresistance in LSCC is unclear.
In this study, we observed low expression levels of CADM1 in the drug-resistant LSCC patient group and determined its relationship with chemoresistance by using small interfering RNA (siRNA)-based experiments.
Materials and methods
Microarray data analysis
The chemosensitivity in LSCC expression data (GSE85607; four cases in the drug-resistant group and seven cases in the sensitive group) was used for predicting CADM1 expression and induced chemoresistance in laryngeal cancer. The CADM1 mRNA expression levels in head and neck cancer were analyzed from the Gene Expression Interaction Analysis (GEPIA) database (http://gepia.cancer-pku.cn/). The prognosis of head and neck cancer patients was analyzed for CADM1 expression levels using the Kaplan–Meier Plotter (KM plotter) tool (http://kmplot.com/analysis/index.php?p=background). The GSE72384 dataset was used for validation (see Supplemental material).
Bioinformatics analysis
We used Gene Set Enrichment Analysis (GSEA) to examine the relationship between low CADM1 expression levels and the chemosensitivity of larynx cancer. Receiver operating characteristic (ROC) curves were used to evaluate the diagnostic performance of CADM1. Area under the ROC curve (AUC) values >0.7 were considered useful for disease diagnosis. The protein–protein interaction (PPI) network for CADM1 was constructed using the Search Tool for Retrieval Interaction Gene Search (STRING) database. Gene ontology (GO) biological process enrichment analyses were performed with the PPI network genes. GO analysis was performed using the clusterProfiler, org.Hs.eg.db, and ggplot2 packages in R version 4.2.1.
Clinical LSCC specimens
LSCC patients who were hospitalized in the Department of Otolaryngology of Chaoyang Central Hospital were included for analysis. Before enrollment, all patients had not undergone surgery, radiotherapy, or biologic targeting therapy. All patients were selected for induction chemotherapy before radical surgical resection after a multidisciplinary discussion and other comprehensive assessments. The patients, who had a clinical diagnosis of intermediate to advanced LSCC with a strong desire for organ preservation, refused or were physically unable to tolerate the procedure. All patients were treated with paclitaxel + cisplatin + 5-fluorouracil (TPF) induction chemotherapy for two cycles after sampling and were then divided into sensitive and resistant groups according to the Response Evaluation Criteria in Solid Tumors (RECIST) guidelines. All patients were enrolled after pathomorphological confirmation, and detailed clinical information was collected from each patient (Table 1). Each sample was immediately frozen in liquid nitrogen and stored at −80°C. The Ethics Committee of Chaoyang Central Hospital approved the study (approval no. [2022]23) and written informed consent was obtained from each patient.
Clinicopathological characteristics of patients with laryngeal squamous cell carcinoma.

Cell culture
The human laryngeal cancer cell line UMSCC5 was obtained from the University of Michigan (Ann Arbor, MI, USA) feeder. Cells were cultured in RPMI-1640 complete medium (RPMI-1640 basic medium + 10% fetal bovine serum (FBS) + 1% penicillin and streptomycin) at 37°C in a 5% CO2 incubator.
RNA extraction and quantitative reverse transcription polymerase chain reaction (RT-qPCR) assay
Cells were lysed with 1 mL of Trizol (Invitrogen, Waltham, MA, USA) and total RNA was extracted from selected specimens according to the manufacturer’s protocol. The HiScript® II Q RT SuperMix for qPCR (+gDNA Remover) (Vazyme, Nanjing, China) was used to remove genomic DNA and for reverse transcription. A negative control was run with nuclease-free water in place of reverse transcriptase. Then, RT-qPCR was performed using the KAPA SYBR® FAST qPCR Kit Master Mix (2X) Universal (Kapa Biosystems, Wilmington, MA, USA). The relative expression levels of target genes were normalized to those of endogenous GAPDH. All RT-qPCR amplification reactions were performed using an ABI7500 fluorescence PCR instrument (Applied Biosystems, Waltham, MA, USA) according to the SYBR Green I PCR test kit instructions using the following cycling conditions: one cycle of 95°C for 3 minutes, 40 cycles of 95°C for 15 s, 58°C for 15 s, and 72°C for 30 s. The data were analyzed using the software included with the instrument: ABI Prism 7500 SDS Software (Applied Biosystems). The results were analyzed automatically using this software, and the threshold and baseline levels were adjusted according to the negative control to determine the cycle threshold (Ct) value for each sample. The Ct values were validated using the melting curve analysis. The 2−ΔΔCt method was used to determine the relative expression level of each mRNA. Three replicates for performed for each sample, and the average value was taken. Table 2 lists all relevant primer sequences.
Reverse transcription polymerase chain reaction primer sequences.

CADMI1, cell adhesion molecule 1; GAPDH, glyceraldehyde 3-phosphate dehydrogenase; F, forward; R, reverse.
Cell transfection and drug treatments
UMSCC5 cells in the logarithmic growth stage were either transfected with siRNA (group 1), not transfected (group 2), or included as a blank control group (group 3). After transfecting the cells in group 1 for 24 hours, the cells in groups 1 and 2 were treated with different concentrations of paclitaxel, 5-fluorouracil, cisplatin, and co-administration. The control group (group 3) was not treated with any drug. Each group was incubated for 24 hours with 10 μL of MTT solution in each well, then incubated for 3 to 4 hours in a 5% CO2 incubator protected from light.
UMSCC5 cells in the logarithmic growth stage were seeded in 6-well plates at 5 × 10⁵ cells/mL. When the cells were approximately 70% confluent, they were transfected with a CAMD1-targeting siRNA (100 nM) using the LipofectamineTM2000 transfection kit (Invitrogen) according to the manufacturer’s instructions. A group of cells was transfected with one of three siRNAs, CAMD1-1, CAMD1-2, or CAMD1-3, and a blank control group was also included. Five hours post-transfection, the efficiency was detected by RT-qPCR. Please see Table 3 for the specific siRNA sequences.
Small interfering RNA (siRNA) sequences.

CADMI1, cell adhesion molecule 1; NC, no-treatment control.
Cell proliferation assay
UMSCC5 cells were treated with different concentrations of paclitaxel, cisplatin, and 5-fluorouracil (8, 4, 2, 1, 0.5, 0.25, 0.125, or 0 μg/mL) for 24, 48, or 72 hours. The best proportional concentrations of the three drugs were tested by applying orthogonal experiments for the respective IC50 of the three drugs, 1/10 paclitaxel IC50 + 1/5 fluorouracil IC50 + 1/3 cisplatin IC50 concentrations of the drugs, followed by a 2-fold gradient dilution for 24, 48, and 72 hours measurements for testing. The optical density (OD) values were detected simultaneously using an enzyme marker at 490 nm wavelength. The measured OD values were used for cell proliferation impact analysis. The curve was fitted to the Sigmodel function using Origin 7.0 data processing software (OriginLab Corporation, Northampton, MA, USA) to find the IC50 value.
Statistical analysis
The bioinformatics data and arrangement were analyzed using the R software version 4.2.1 R (www.r-project.org). The differences in CADM1 expression levels were compared with the Wilcoxon test and two-way analysis of variance (ANOVA). The associations between CADM1 expression levels and clinicopathological parameters were examined using the Fisher's exact test and χ2 test. For the qRT-PCR experimental replicates, the data are expressed as the mean ±standard deviation, and comparisons between groups were made using the t-test. GraphPad Prism software version 8.0.2 (GraphPad, San Diego, CA, USA) was used for plotting differences between groups. P < 0.05 was considered statistically significant.
Results
CADM1 mRNA levels are downregulated in LSCC tissues and are associated with poor clinical prognosis
CADM1 mRNA expression levels are lower in head and neck cancer tissues, as suggested by analysis using the GEPIA database (Figure 1a; P < 0.05). Analysis with the KM plotter tool revealed that low CADM1 expression levels were associated with poor prognosis in patients with stage 4 head and neck cancer (Figure 1b; P < 0.01).

Low cell adhesion molecule 1 (CADM1) mRNA expression levels are found in head and neck squamous cell carcinoma (HNSC) tissues and can predict poor prognosis. (a) CADM1 mRNA expression levels in HNSC (n = 519) and normal tissues (n = 182) from the Gene Expression Interaction Analysis (GEPIA) database and (b) Kaplan–Meier analysis showed a negative correlation between CADM1 expression levels and survival of clinical stage 4 HNSC patients. **P < 0.01.
Functional analysis of CADM1
We used the GSE85607 microarray data for further analysis. The GSEA results showed that low expression of CADM1 was involved in African trypanosomiasis, Ferroptosis, Metabolism of xenobiotics by cytochrome P450, Pentose and glucuronate interconversions, and Steroid hormone biosynthesis (Figure 2a). The AUC value for CADM1 was 0.857, indicating that CADM1 expression had good diagnostic and predictive value (Figure 2b). PPI networks for 10 CADM1-related genes were obtained from the String database, and GO analysis was performed on these genes (Figure 3a–b). GO Biological Process results were involved with the regulation of natural killer (NK) cell-mediated cytotoxicity and immunity, Cellular Component results were cell–cell junction, basolateral plasma membrane, and basal part of the cell, and Molecular Function results were PDZ domain binding.
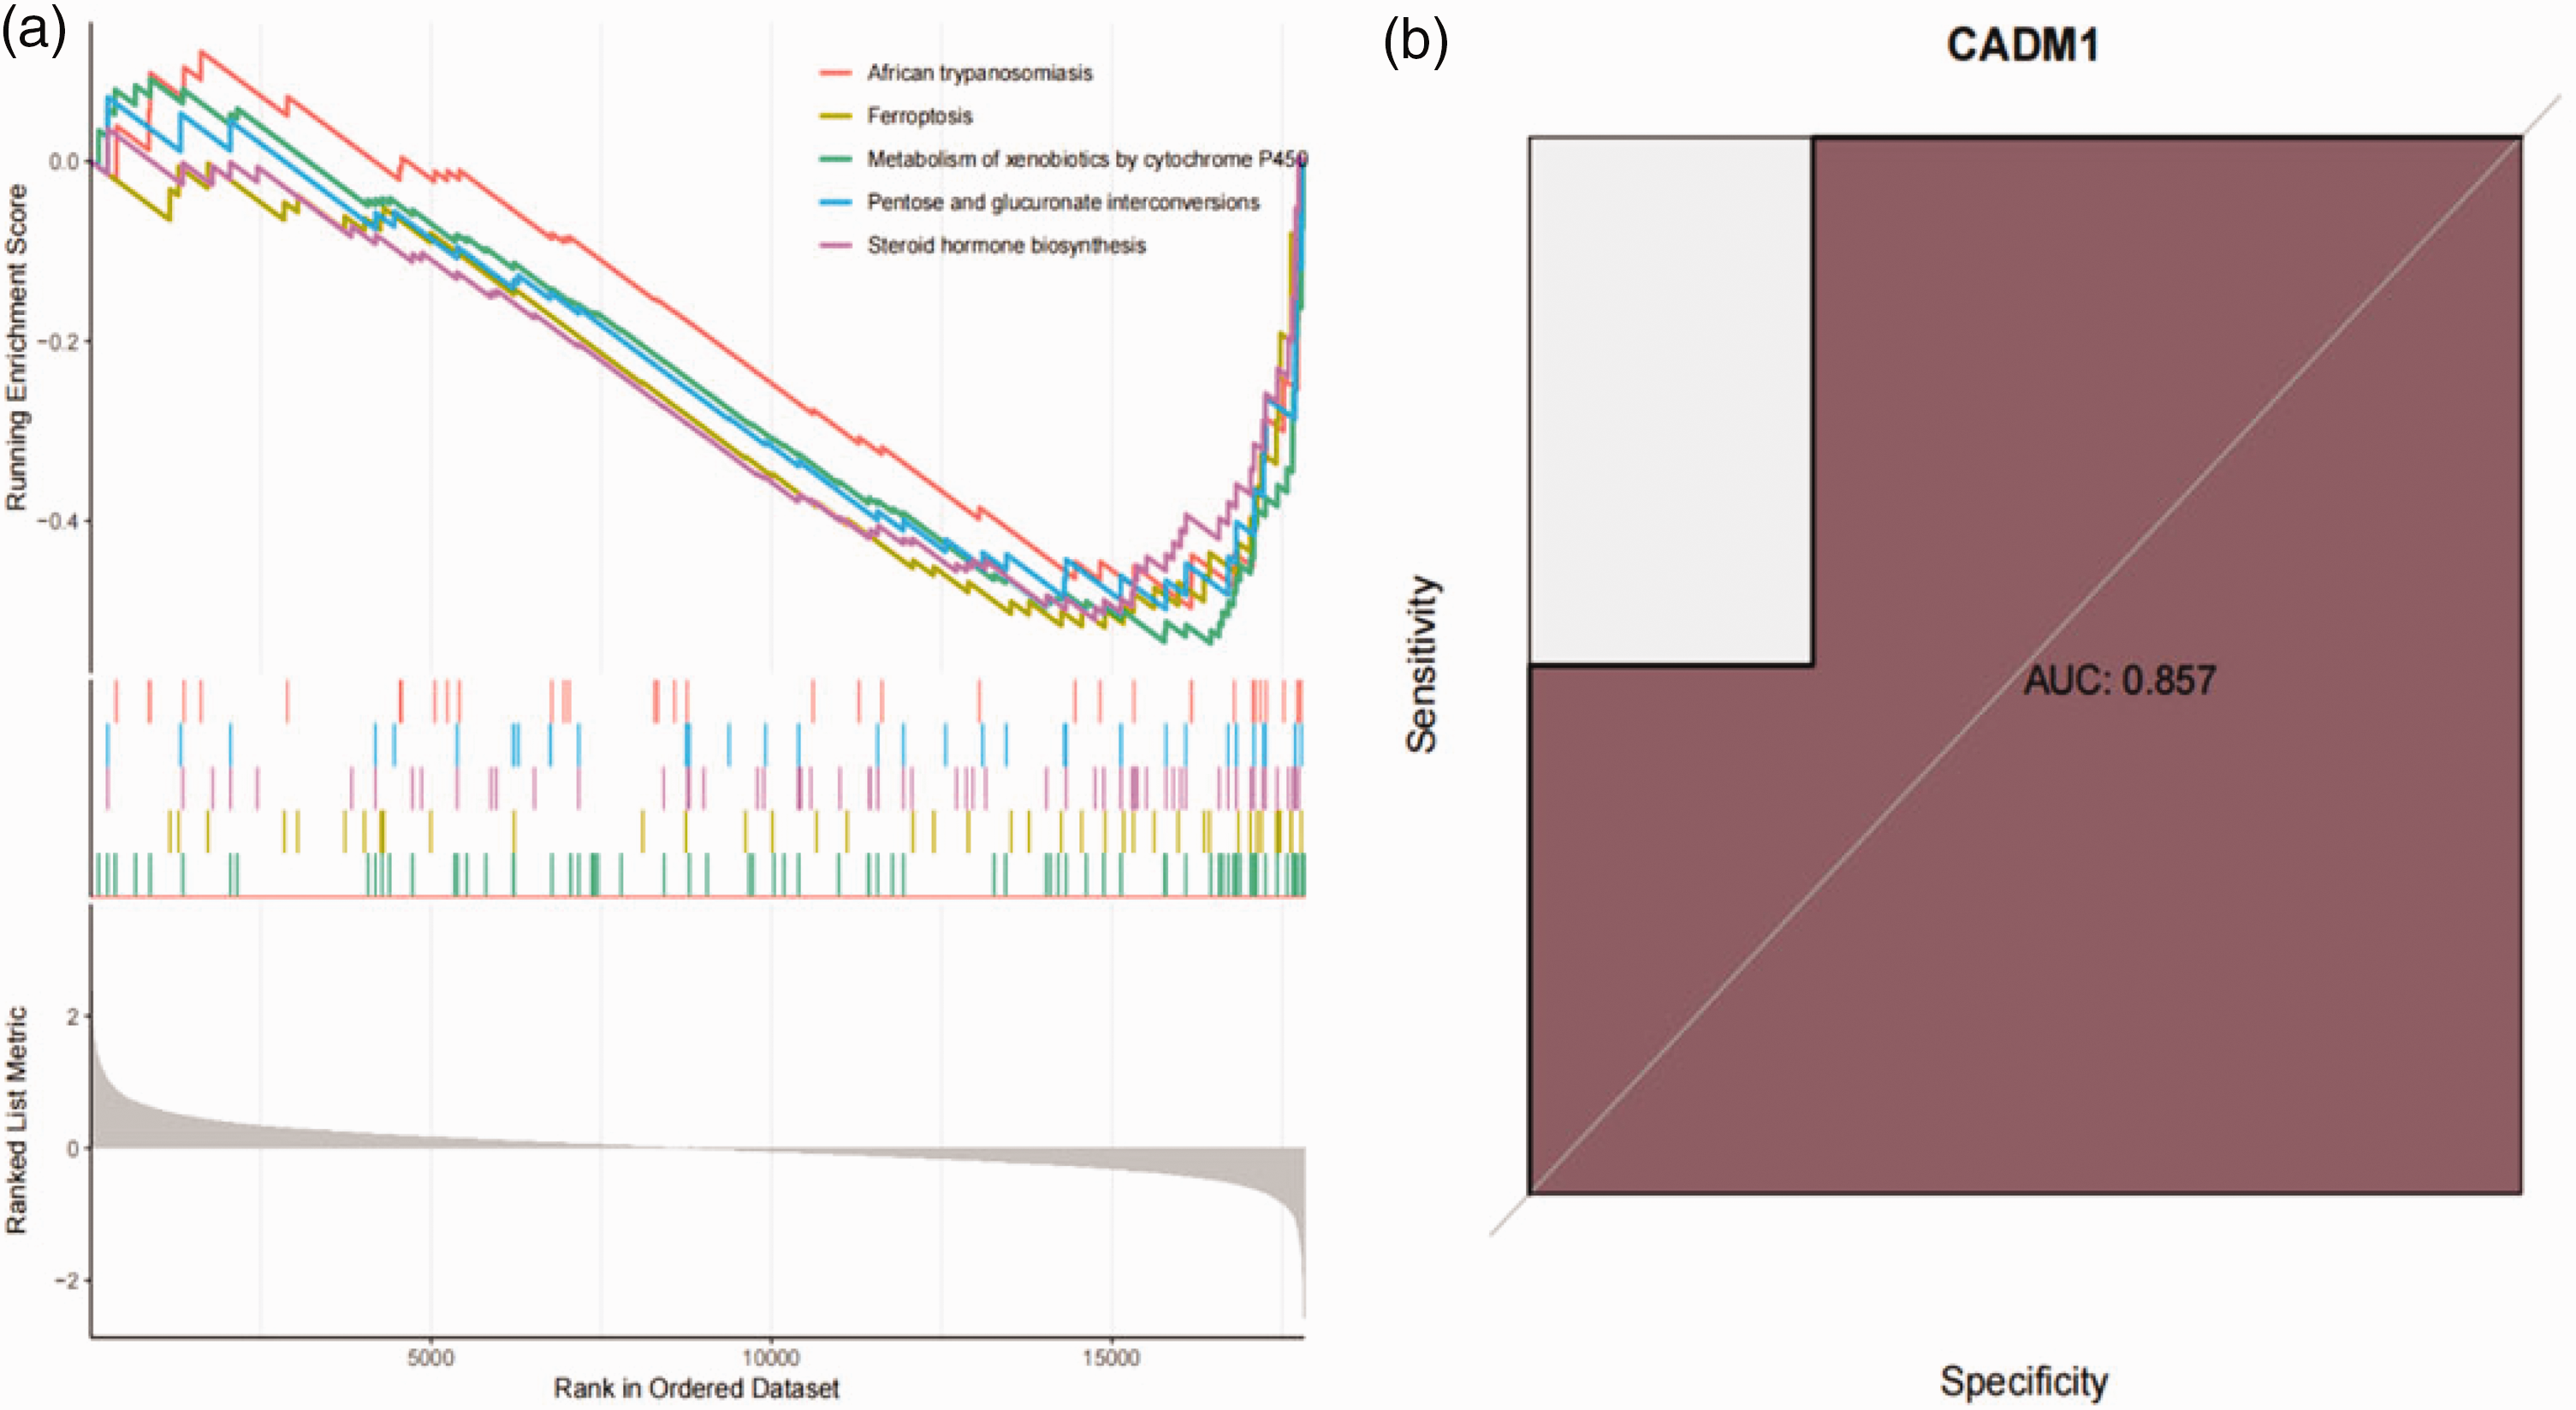
(a) Gene Set Enrichment Analysis (GSEA) revealed the pathways enriched with low cell adhesion molecule 1 (CADM1) expression and (b) Diagnostic evaluation of CADM1 expression by receiver operating characteristic (ROC) curve analysis.

(a) Protein–protein interaction (PPI) network analysis using the STRING database and (b) Significant results of the gene ontology (GO) analysis of the top PPI genes.
Correlations between CADM1 expression levels and LSCC patient clinicopathological factors
Thirty-five LSCC patients were included in the analysis. Of these, 20 patients were included in the sensitive group and 15 patients in the resistant group. Using the median cut-off value of CADM1 mRNA expression in LSCC tissues (1.521), patients were classified into the high expression group (21 cases) and low expression group (14 cases). There was a close relationship between the CADM1 mRNA expression levels and LSCC pathological stage and clinical grade (P < 0.05). Additionally, the CADM1 expression levels of the poor/moderately differentiated group were lower than those of the well-differentiated group (P = 0.022). Late clinical stage LSCC patients had lower CADM1 expression levels than the early-stage patients (P = 0.02) (Table 4).
Clinicopathological characteristics of patients with laryngeal squamous cell carcinoma (LSCC) and expression of cell adhesion molecule 1 (CADM1).

*P < 0.05.
CADM1 expression levels are downregulated in the LSCC chemoresistant group
CADM1 mRNA levels, as determined using RT-qPCR assays, were 2.176 ± 0.501 in the sensitive group and 0.863 ± 0.247 in the non-sensitive group, suggesting that CADM1 expression was significantly higher in the sensitive group (Figure 4a; P = 0.0152). CADM1 expression levels were also significantly downregulated in the non-sensitive group in the GSE85607 dataset (Figure 4b; P = 0.0181). Furthermore, CADM1 expression levels were lowest in the drug-resistant strains cultured with cisplatin treatment in the GSE72384 validation set (Figure 4c; P = 0.0317).

(a) Cell adhesion molecule 1 (CADM1) mRNA expression levels were significantly lower in the non-sensitive laryngeal squamous cell carcinoma (LSCC) patient group. (b) CADM1 mRNA was expressed at lower levels in the non-sensitive LSCC tissues of the GSE85607 dataset and (c) CADM1 mRNA levels were lowest in the drug-resistant strain cultured with cisplatin treatment. *P < 0.05.
CADM1 knockdown in LSCC cells can reduce their sensitivity to chemotherapy and can be used as a molecular marker to assess chemotherapy sensitivity
Three siRNAs were examined to individually knock down CADM1 mRNA levels in UMSCC5 cells. Their optimal annealing temperatures were established by amplification curve and lysis curve analyses. Using RT-qPCR assays, we found that the CADM1-3 siRNA knocked down CADM1 mRNA levels the most significantly. Therefore, this siRNA was used for the subsequent experiments (Figure 5a; P < 0.05). UMSCC5 cells were treated with different concentrations of paclitaxel, cisplatin, and 5-fluorouracil for 24, 48, or 72 hours. All three drugs showed the most significant inhibitory effect at 72 hours, and the IC50 values at 72 hours were measured as 0.125 μg/mL, 1.017 μg/mL, and 232.486 μg/mL, respectively. The MTT experiments showed that in UMSCC5 cells, the IC50 values were 5.12 μg/mL for the cells treated with TPF alone and 23.54 μg/mL for the cells both treated with TPF and transfected with CADM1-3 siRNA. These data suggest that knocking down CADM1 expression resulted in a significantly decreased sensitivity to TPF chemotherapy treatment, as the IC50 value of the TPF + siRNA group was 4.6 times higher than that of the TPF group (Figure 5b).

Small interfering RNA (siRNA)-mediated knockdown of cell adhesion molecule 1 (CADM1) in laryngeal squamous cell carcinoma (LSCC) cells results in reduced sensitivity to chemotherapy. (a) The RT-qPCR results of CADM1 mRNA levels following siRNA transfection, with the lowest CADM1 mRNA expression levels observed in the si-CADM1-3 group and (b) The LSCC cells treated with TPF and transfected with si-CADM1-3 were significantly less sensitive to chemotherapy, with a markedly higher IC50 value relative to that of the TPF alone group.
Discussion
Currently, the most effective treatment for LSCC is the surgical removal of the tumor followed by radiotherapy, depending on the patient's condition. 10 A total laryngectomy often reduces the quality of life of patients with advanced laryngeal cancer, particularly T3T4a patients. Induction chemotherapy before surgery or radiotherapy enables information about radiosensitivity to be obtained and a more appropriate treatment approach to be chosen between surgery and radiotherapy. This can support the preservation of laryngeal function as much as possible. 11 Patients with laryngeal cancer can benefit from induction chemotherapy, which avoids the need for destructive surgical resection and provides reasonable disease control. 12 Therefore, improving LSCC tumor sensitivity to induction chemotherapy is essential for preserving laryngeal function and improving patient prognosis. The combination of 5-fluorouracil and cisplatin has frequently been used to treat head and neck cancer, 13 and paclitaxel has been widely used in a variety of tumors. 14 TPF regimens combine the advantages of each, acting as an anti-tumor agent by inhibiting cell proliferation and promoting apoptosis. 13 CADM1 is involved in cell adhesion, signaling, and other mechanisms that contribute to tumor biology, and decreased CADM1 expression can lead to increased tumor aggressiveness and poor patient prognosis. 15 In this study, we focused on the role of CADM1 in LSCC sensitivity to chemotherapy.
Here, we found that CADM1 mRNA was expressed at low levels in head and neck cancer samples by bioinformatics data analysis, and patients with higher CADM1 downregulation had a poor prognosis. The CADM1 functional analysis results indicated associations with ferroptosis, metabolism of xenobiotics by cytochrome P450, pentose and glucuronate interconversions, steroid hormone biosynthesis, and regulation of NK cells. Several studies have found that inducing the sensitivity of head and neck cancer cells to ferroptosis can reverse drug resistance or enhance sensitivity to chemotherapeutic agents.16–18 Cytochrome P450 is an enzyme involved in the metabolism of phase 1 xenobiotics, toxins, and cancer drugs that can affect carcinogenesis, treatment outcomes, and cancer drug resistance.19,20 Chockley et al. found that epithelial-mesenchymal transition (EMT)-induced modulation of E-cadherin levels and CADM1 overexpression could mediate increased tumor susceptibility to NK cytotoxicity, leading to inefficient metastasis. 21 From this, we hypothesize that CADM1 has multi-layered effects on regulating tumor cell proliferation, metastasis, and drug resistance. Upregulation of CADM1 may be a therapeutic strategy for preventing tumor metastasis and reversing drug resistance.
We also evaluated the correlation between CADM1 expression levels and clinicopathological factors, finding that decreased CADM1 expression correlated with advanced tumor progression (TNM Stage) and malignant pathological grade. Motonobu et al. found that CADM1 downregulation promoted advanced breast cancer progression and was strongly associated with tumor malignancy. 22 Deletion of CADM1 expression in bladder cancer was associated with adverse pathological factors, and overexpressing CADM1 in bladder cancer cell lines resulted in reduced cell proliferation and invasion rates. 23 Li et al. found that CADM1 is a target of miR-486 in ovarian cancer cells, and this regulation could affect cell cycle progression and apoptosis. 24 CADM1 downregulation is often associated with higher clinical stage, pathological differentiation, and poor prognosis. 8 Another study demonstrated that miR-424-5p can promote the invasion and metastasis of LSCC through downregulation of CADM1. 25 These previous results are consistent with our data in this study. We verified by RT-qPCR that CADM1 mRNA levels were significantly lower in the non-sensitive LSCC patient group compared with the sensitive group. This indicated that CADM1 downregulation may lead to insensitivity to chemotherapy in certain patients. Furthermore, these findings suggest that CADM1 downregulation can not only promote malignant tumor progression, but also aggravate poor patient prognosis through elevated resistance to chemotherapy. Thus, CADM1 may be an important molecular marker to guide clinical treatment decisions. Because LSCC patients with low expression levels of CADM1 are not sensitive to induction chemotherapy, surgical treatment or upregulating CADM1 expression before induction chemotherapy may be preferable choices for improving chemotherapy efficacy. When CADM1 is highly expressed, the tumor is sensitive to induction chemotherapy and radiotherapy treatment can be simultaneously selected.
Our MTT results showed that LSCC cells with siRNA-mediated knockdown of CADM1 were significantly less sensitive to TPF chemotherapy. Zheng et al. found that miR-21 can negatively regulate CADM1 expression. CADM1 expression levels were downregulated in drug-resistant tongue squamous cell carcinoma cell lines, but restoring CADM1 expression could increase the response of these cells to chemotherapeutic agents. 26 Sumit et al. analyzed the ability of CADM1 to predict chemoresistance in patients with pancreatic ductal adenocarcinoma using Sequential Window Acquisition of All Theoretical Mass Spectra (SWATH-MS). 27 Therefore, CADM1 may be an important molecular biomarker to guide important therapeutic decisions for patients.
Genetic engineering technology can change the sensitivity of drug-resistant LSCC patients to TPF-induced chemotherapy, potentially avoiding the pain of surgical treatment. Its specificity has a broad application prospect. However, gene therapy technology is not yet ready for large-scale clinical applications. In the era of precision medicine, we can determine if patients are suitable candidates for a TPF-induced chemotherapy regimen not only from the results of large clinical trials, but also by detecting molecular biomarkers specific to the individualized patient tumor tissues. There are some limitations to our study. More clinicopathological data are needed to demonstrate the clinical significance of CADM1 expression, and further experiments are required to elucidate its associated mechanism of action.
Conclusion
CADM1 expression can alter the sensitivity of LSCC tumors to TPF chemotherapy. It is therefore expected to be a biomarker and potential therapeutic target for induction chemotherapy in LSCC.
Supplemental Material
sj-zip-1-imr-10.1177_03000605231168017 - Supplemental material for Effect of CADM1 on TPF-induced chemotherapy in laryngeal squamous cell carcinoma
Supplemental material, sj-zip-1-imr-10.1177_03000605231168017 for Effect of CADM1 on TPF-induced chemotherapy in laryngeal squamous cell carcinoma by Jiani Nie, Lianhe Li, Fuxian Tan, Hongmei Wang, Hongmin Wang, Liangyu Zou and Zhenlei Wen in Journal of International Medical Research
Footnotes
Declaration of conflicting interests
The authors declare that there is no conflict of interest.
Funding
The authors disclosed receipt of the following financial support for the research, authorship, and/or publication of this article: This study was supported by the Liaoning Natural Science Foundation Program (2019-ZD-0901).
Supplementary material
Supplemental material for this article is available online.
References
Supplementary Material
Please find the following supplemental material available below.
For Open Access articles published under a Creative Commons License, all supplemental material carries the same license as the article it is associated with.
For non-Open Access articles published, all supplemental material carries a non-exclusive license, and permission requests for re-use of supplemental material or any part of supplemental material shall be sent directly to the copyright owner as specified in the copyright notice associated with the article.