
Abstract
Objective
To define which oxidative stress markers could be used as diagnostic tools in the assessment of post-infarction heart failure (HF).
Methods
This observational study enrolled patients with HF that were divided into three subgroups (ejection fraction [EF] ≥ 50%; EF 40–49%; EF < 40%) and age- and sex-matched healthy control subjects. The plasma concentrations of advanced oxidation protein products (AOPP), thiobarbituric acid reactive substances, catalase activity and free thiols were determined in all participants.
Results
The study enrolled 81 patients with HF and 68 healthy control subjects. There were significant differences in the values of oxidative stress markers between patients and controls. Oxidative stress parameters did not differ between the subgroups of patients, except for AOPP, which was significantly higher in the EF < 40% group. Univariate and multivariate logistic regression analyses showed an association between AOPP and HF in the EF ≥ 50% group, while receiver operating characteristic (ROC) curve analysis identified a cut-off value of 60.89 µmol/l for AOPP.
Conclusions
Based on the ROC curve analysis of AOPP and the higher significance in the multivariate analyses for patients with EF ≥ 50%, these current results suggest that AOPP could be a useful additional tool in the assessment of post-infarction HF.
Keywords
Introduction
The most common cause of heart failure (HF) is myocardial infarction (MI) despite the development and advances in both diagnostics and treatment. 1 The aetiology of most cases of HF is increased oxidative stress and the subsequent changes in cardiomyocyte function.2,3 Clinical and experimental studies have shown that oxidative damage is a key pathophysiological event in post-infarction chronic HF, 4 while the heart muscle itself is an important source of free radical production. 5 The most important breaking point is the moment of reperfusion of the ischaemic tissue, when a second wave of myocardial damage occurs, due to the production of reactive oxidative species. 6 Free radicals damage the heart tissue through the process of lipid peroxidation, oxidative modification of proteins and DNA, which leads to decreased cardiac contractility, reduced ion transport and calcium cycle disorders.7 High metabolic activity of cardiomyocytes determines the possibility of intensive production of free radicals.8 The resulting oxidative stress leads to changes in gene expression and cell death, which causes a more intensive process of myocardial remodelling and impairment of heart function, and leads to progression of disease. 3
When a MI occurs, cardiomyocyte death triggers repair mechanisms that include scar formation and ventricular remodelling.9 Ventricular remodelling is characterized by thinning of the chamber walls, changes in its geometry and even further cardiomyocyte loss.10 Since the myocardium consists of both extracellular matrix and cardiomyocytes, the remodelling process occurs in both tissue components.11 The heart muscle cells go through apoptosis, and the rest of the cardiomyocytes usually respond to ischaemia by becoming hypertrophic, whereas the extracellular matrix usually degrades and fibrosis makes up for its loss.12,13 There are various risk factors that can increase the possibility of developing HF after MI. For example, age is the most dominant, since an increase of 10 years can increase the risk of post-infarction HF by up to 50%. 14 Other risk factors are female sex, hypertension and diabetes mellitus. 14 It is yet to be determined, however, whether the ischaemia or reperfusion plays a more dominant role in the complex remodelling process and development of HF with preserved ejection fraction (EF). 15
Advanced oxidation protein products (AOPP), which are plasma proteins that are oxidized by exposure to reactive oxygen species (ROS) in the bloodstream, were first identified in uraemia. 16 However, as a consequence of their ability to cause endothelial injury, and even possibly cardiomyocyte apoptosis, it is quite evident that they could be involved in the development of cardiac damage.16,17 AOPP can also directly trigger an oxidative burst in neutrophils and monocytes. 18 Together with other free radicals, this might be a signal for nuclear factor kappa B activation, leading to atherogenesis, partially by oxidative modification of the low-density lipoprotein (LDL) particle, leukocyte attraction, and proliferation of smooth muscle cells.19
Ejection fraction, as an important parameter of myocardial function, if reduced, can lead to poor nutrition and potentially greater susceptibility to peripheral tissue damage.20 It is possible to differentiate patients with HF into those with preserved and reduced EF. 21
The aim of this current study was to define which of the following oxidative stress variables, AOPP, thiobarbituric reactive substances in plasma (TBARSP) or red blood cells (TBARSRBC), catalase (CAT) activity and free thiols, can be used as diagnostic tools in the assessment of post-infarction HF.
Patients and methods
Study population
This observational study enrolled consecutive patients diagnosed with symptomatic post-infarction HF in the Department of Functional Diagnostics, Institute for Treatment and Rehabilitation “Niska Banja”, Nis, Serbia between January 2019 and June 2019. Healthy volunteers without HF were enrolled while attending the Institute for Treatment and Rehabilitation for routine examinations over the same time frame and were age- and sex-matched to the patient group. The exclusion criteria for the participation in the study were as follows: (i) presence of malignant disease; (ii) acute infectious; and (iii) autoimmune disease.
Heart failure was defined according to universal definition of HF as a clinical syndrome caused by a structural or functional cardiac abnormality, with elevated natriuretic peptide (BNP) levels and pulmonary/systemic congestion. 22 The patients with HF were further divided into three subgroups according to the EF: HFpEF – HF with preserved EF (≥50%); HFmrEF – HF with moderately preserved EF (40–49%); and HFrEF – HF with reduced EF (<40%). All patients underwent two-dimensional transthoracic echocardiography using an ACUSON Sequoia 256 ultrasound system (Siemens Healthcare GmbH, Erlangen, Germany) and a 2.5 MHz probe. The data were analysed according to current American Echocardiography Association guidelines. 23
The study protocol was approved by the Ethics Committees of the Institute for Treatment and Rehabilitation “Niska Banja”, Nis, Serbia (approval no. 4574/1) and the Faculty of Medicine, University of Nis, Nis, Serbia (approval no. 6558). The study was conducted in accordance with the Declaration of Helsinki and the instructions of good clinical practice. Written informed consent for participation in the study was obtained from all study participants.
Blood collection and biochemical analyses
A venous blood sample was taken from each participant after an overnight fast. The venous punction was performed using a standard procedure on the cubital veins and blood was collected into closed system vacuum containers. Potassium ethylenediaminetetra-acetic acid was used as an anticoagulant agent for complete blood count analyses. The complete blood count was determined using a Celltac MEK-6510K automatic analyser (Nihon Kohden, Tokyo, Japan). A regular serum tube with gel separator was used to gather blood for the rest of the analyses performed. The blood samples were centrifugated at 2000
Data collection
Patient data were collected from a survey that each patient was asked complete. Medical history data were also collected from their patient records at the Institute for Treatment and Rehabilitation “Niska Banja”, Nis, Serbia. Patients were selected from a group admitted for post-infarction rehabilitation during 2019. The healthy control subjects completed the same survey as the patients. Being healthy volunteers, they did not have medical history data to have collected. All participant data were de-identified to ensure anonymity.
Determination of TBARSP and TBARSRBC
The lipid peroxidation products were determined indirectly via the products of the lipid peroxidation reaction with thiobarbituric acid (TBA). TBARSP was determined using a previously reported method.
24
In brief, 0.3 ml of plasma and FeSO4 were used to increase the sensitivity. The optical density (OD) was measured at 535 nm using a Thermo Scientific™ Multiskan™ FC Microplate Photometer (Thermo Fisher Scientific, Vantaa, Finland), recalculated as 1.56 × 10⁵ M−1 cm−1 and expressed in μmol/l.
24
TBARSRBC was determined using a previously reported method.
25
In brief, 0.4 ml of washed RBC were resuspended in 1.6 ml of 0.1 M phosphate buffer (pH 7.4). Then 1 ml of 30% trichloroacetic acid (TCA) was added and the mixture incubated on ice for 1 h. After centrifugation at 4000
Determination of plasma AOPP
The concentration of AOPP was determined using a spectrophotometric method according to a previous publication. 16 In brief, plasma was added to a mixture of water, acetic acid and potassium-iodide. The OD was measured at 340 nm using a Thermo Scientific™ Multiskan™ FC Microplate Photometer (Thermo Fisher Scientific) and compared with the chloramine T solution added to the same mix as the sample. Results were expressed as μmol of chloramine T equivalent in a litre of plasma per mg of total proteins in plasma. 16
Determination of plasma CAT activity
Plasma CAT activity was determined according to a previous report and was based on the formation of a stable coloured complex between H2O2 and molybdenum salts.
26
In brief, 40 µl of plasma, standard or blank probe was mixed with 1.2 ml of H2O2 and incubated for 10 min at 37°C. Then, 0.8 ml of 10% TCA was added and the tubes were centrifugated at 2000
Determination of free thiols
The levels of free thiols (SH) in plasma were determined using a modified method according to a previous report. 27 The OD was determined at 412 and 630 nm using a Thermo Scientific™ Multiskan™ FC Microplate Photometer (Thermo Fisher Scientific). The thiol concentration was expressed per litre of plasma.
Statistical analyses
Power calculations using G-power version 3.1.9.7 software determined that the minimum number of study participants was 50 in total with a type I error rate of 0.05 and study power of 0.9.28,29
All statistical analyses were performed using IBM SPSS Statistics for Windows, Version 20.0 (IBM Corp., Armonk, NY, USA). Data are expressed as mean ± SD or n of participants (%). Continuous data were analysed for normality of distribution using the Kolmogorov–Smirnov test. Student’s t-test (for normally distributed data) and Mann–Whitney U-test (for not normally distributed data) were used for the comparison of continuous demographic and oxidative stress parameters between patient and control groups. The Kruskal–Wallis test with Mann–Whitney U-test was used post hoc to compare oxidative stress parameters in relation to EF patient groups. Categorical data were compared using χ2-test. A P-value < 0.05 was considered statistically significant.
A receiver operating characteristic (ROC) curve was produced and the area under the curve (AUC) was calculated to evaluate the significance of the analysed biomarkers in diagnosing HF. This procedure was performed on all HF patients versus all non-HF controls. The cut-off point on the ROC curve that maximized its discriminative index was defined (i.e. Youden index, which was calculated as the sensitivity minus the false-positive rate). The sensitivity, specificity, positive likelihood ratio, negative likelihood ratio, positive predictive value and negative predictive value at that cut-off point were calculated for the markers. Multivariate logistic regression analysis, adjusted for age, sex, hypertension and diabetes mellitus, 14 was performed to examine the influence of significant univariate oxidative stress predictors on EF. The reporting of this study conforms to the REMARK guidelines. 30
Results
This observational study enrolled 81 patients diagnosed with symptomatic post-infarction HF and 34 age- and sex-matched healthy volunteers without signs and symptoms of HF. The demographic and clinical characteristics of the patient and control groups are shown in Table 1. The demographic characteristics of the two groups matched, except for the ratio of smokers and non-smokers; and hypertension and diabetes mellitus were more frequent in patients than in controls. There were significant differences in the values of certain haematological and biochemical parameters between the patient and control groups, especially those parameters related to renal function such as urea, creatinine and estimated glomerular filtration rate (P < 0.001 for these comparisons; Table 2). These findings indicate that HF after MI was associated with the quality of function of other organ systems. There were significant differences between the two groups in the TBARSRBC, TBARSP, AOPP and free thiols (P < 0.05 for these comparisons; Table 3).
Demographic and clinical characteristics of the patients with symptomatic post-infarction heart failure (HF) (n = 81) stratified according to ejection fraction (EF) compared with the healthy control group (n = 68).

Data presented as mean ± SD or n of participants (%).
NYHA, New York Heart Association Functional Classification; eGFRCG, estimated glomerular filtration rate according to Cockcroft-Gault formula; eGFRMDRD, estimated glomerular filtration rate according to Modification of Diet in Renal Disease formula.
Biochemical and haematological characteristics of the patients with symptomatic post-infarction heart failure (n = 81) compared with the healthy control group (n = 68).

Data presented as mean ± SD.
aData were compared with Student’s t-test (for normally distributed data) and Mann–Whitney U-test (for not normally distributed data; *Z values shown); NS, no significant between-group difference (P ≥ 0.05).
eGFRCG, estimated glomerular filtration rate according to Cockcroft-Gault formula; eGFRMDRD, estimated glomerular filtration rate according to Modification of Diet in Renal Disease formula; Na, sodium; K, potassium; Ca, calcium; P, phosphorus; TC, total cholesterol; LDL-C, low-density lipoprotein cholesterol; HDL-C, high-density lipoprotein cholesterol; TG, triglycerides; RBC, red blood cells; WBC, white blood cells; Hb, haemoglobin; BNP, brain natriuretic peptide.
Oxidative stress markers of the patients with symptomatic post-infarction heart failure (n = 81) compared with the healthy control group (n = 68).

Data presented as mean ± SD.
aData were compared with Mann–Whitney U-test (for not normally distributed data); NS, no significant between-group difference (P ≥ 0.05).
TBARSRBC, thiobarbituric reactive substances in red blood cells; Hb, haemoglobin; TBARSP, thiobarbituric reactive substances in plasma; CAT, catalase; AOPP, advanced oxidation protein products; SH, free thiols.
Oxidative stress parameters did not differ significantly between the three subgroups of patients with HF stratified according to the EF, except for AOPP (Table 4). AOPP was significantly higher in patients with an EF < 40% compared with patients with an EF of 40–49% and ≥50% (P = 0.007). When considering the clinical manifestations of HF based on the New York Heart Association (NYHA) Functional Classification, the current results showed significant differences in BNP, TBARSP and free thiols between patients with class I/II HF and patients with class III/IV HF (P < 0.05 for all comparisons), whereas no significant differences were observed for TBARSRBC, AOPP and CAT levels (Table 5).
Oxidative stress markers of the patients with symptomatic post-infarction heart failure (HF) (n = 81) stratified according to ejection fraction (EF).
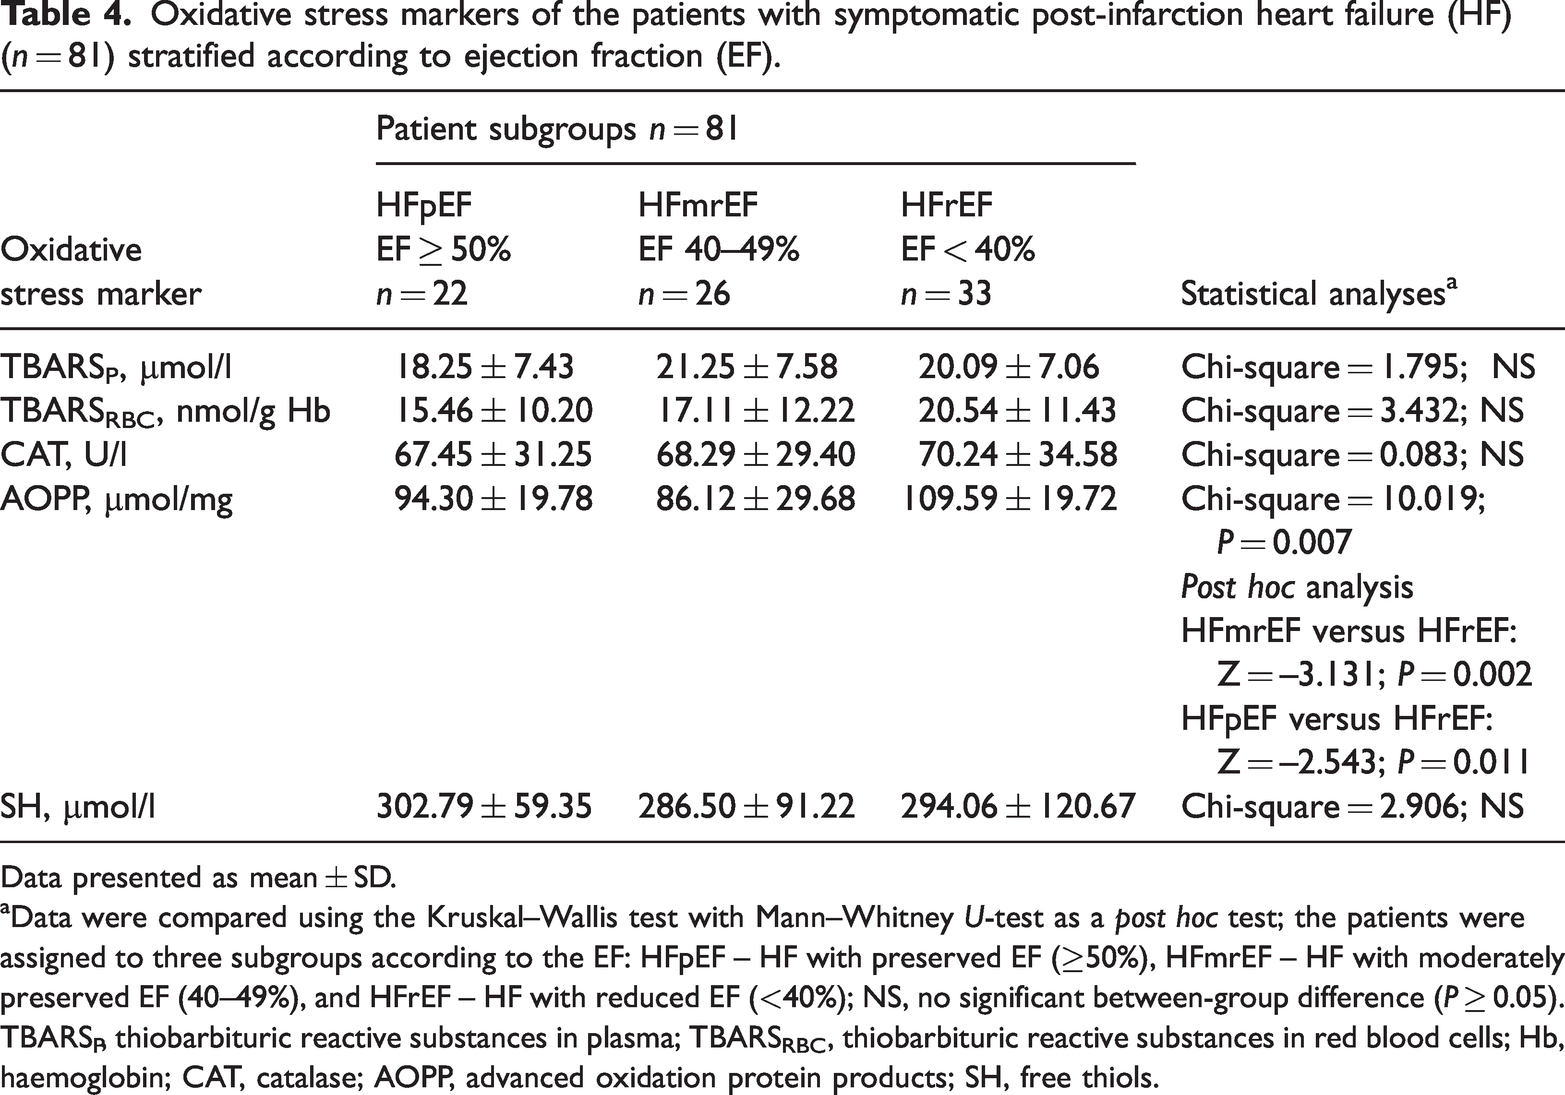
Data presented as mean ± SD.
aData were compared using the Kruskal–Wallis test with Mann–Whitney U-test as a post hoc test; the patients were assigned to three subgroups according to the EF: HFpEF – HF with preserved EF (≥50%), HFmrEF – HF with moderately preserved EF (40–49%), and HFrEF – HF with reduced EF (<40%); NS, no significant between-group difference (P ≥ 0.05).
TBARSP, thiobarbituric reactive substances in plasma; TBARSRBC, thiobarbituric reactive substances in red blood cells; Hb, haemoglobin; CAT, catalase; AOPP, advanced oxidation protein products; SH, free thiols.
Oxidative stress markers of the patients with symptomatic post-infarction heart failure (n = 81) stratified according to the New York Heart Association (NYHA) Functional Classification.

Data presented as mean ± SD.
aData were compared with Mann–Whitney U-test (for not normally distributed data); NS, no significant between-group difference (P ≥ 0.05).
BNP, brain natriuretic peptide; TBARSP, thiobarbituric reactive substances in plasma; TBARSRBC, thiobarbituric reactive substances in red blood cells; Hb, haemoglobin; CAT, catalase; AOPP, advanced oxidation protein products; SH, free thiols.
Univariate analyses demonstrated that the plasma level of AOPP (EF ≥ 50%: P < 0.001; EF 40–49%: P = 0.003; EF < 40%: P = 0.001), CAT (EF ≥ 50%: P = 0.002; EF 40–49%: P = 0.002; EF < 40%: P < 0.001), TBARSRBC (EF ≥ 50%: P = 0.011; EF 40–49%: P = 0.012; EF < 40%: P = 0.012) and free thiols (EF < 40%: P = 0.025) were significantly associated with EF (Table 6). After adjustment for age, sex, diabetes mellitus and hypertension, multivariate logistic analyses demonstrated that the plasma level of AOPP (EF ≥ 50%: P = 0.010; EF < 40%: P = 0.047) and TBARSP (EF ≥ 50%: P = 0.047; EF < 40%: P = 0.026) were significantly associated with EF (Table 6).
Univariate and multivariate analysis of association between oxidative stress markers and ejection fraction (EF) value.

The patients were assigned to three subgroups according to the EF: HFpEF – HF with preserved EF (≥50%), HFmrEF – HF with moderately preserved EF (40–49%), and HFrEF – HF with reduced EF (<40%).
CI, confidence interval; OR, odds ratio; TBARSRBC, thiobarbituric reactive substances in red blood cells; TBARSP , thiobarbituric reactive substances in plasma; CAT, catalase; AOPP, advanced oxidation protein products; SH, free thiols; NS, no significant association (P ≥ 0.05).
As shown in Figure 1, the AUC of the ROC curve of AOPP plasma level was 0.908 (95% confidence interval: 0.851, 0.965), indicating the significance of plasma AOPP level in the clinical diagnosis of HF. Sensitivity, specificity and the predictive cut-off value of plasma AOPP are presented in Table 7.
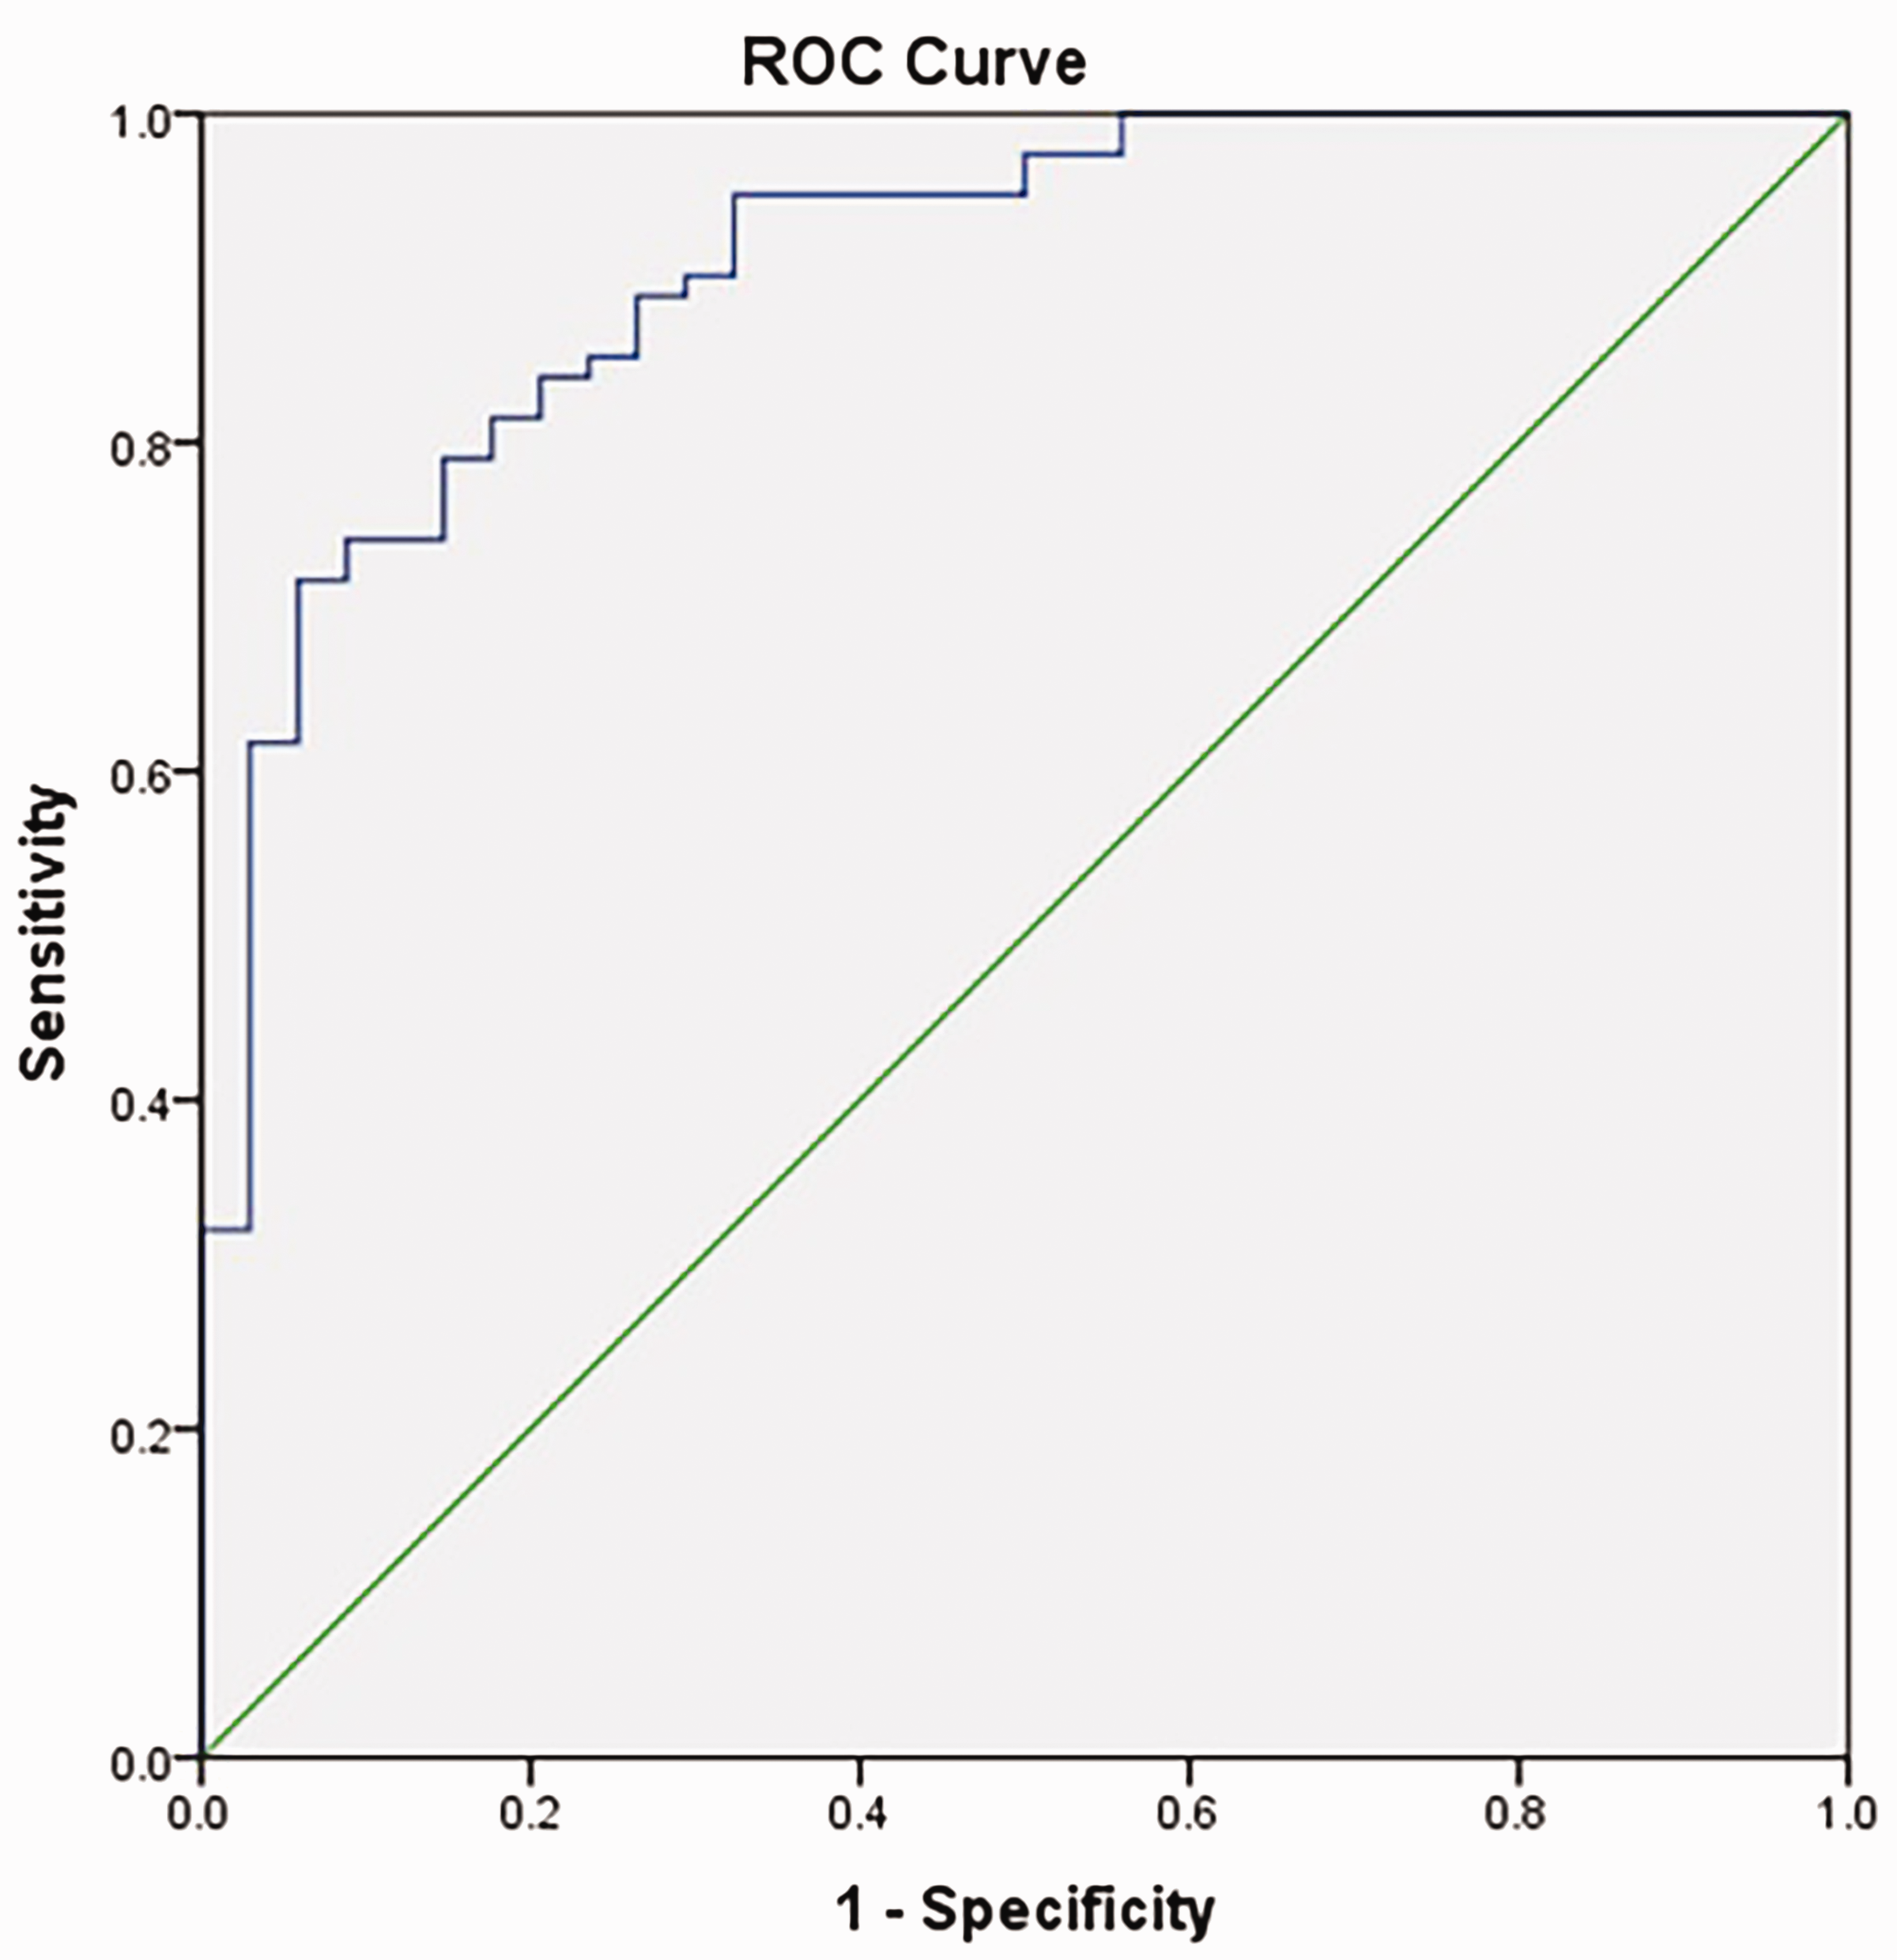
Receiver operating characteristic (ROC) curve of the utility of plasma levels of advanced oxidation protein products in the clinical diagnosis of heart failure (area under the curve = 0.908; cut-off point = 60.89 µmol/l).
Receiver operating characteristic curve analysis of the utility of plasma levels of advanced oxidation protein products (AOPP) in the clinical diagnosis of heart failure.

*In this study population of 81 patients with heart failure.
CI, confidence interval.
Discussion
Research suggests that chronic HF can potentially be classified in the so-called group of oxidative diseases.2,31,32 Oxidative stress, as a state of disrupted balance between prooxidants and antioxidant molecules and mechanisms, in the direction of higher production and activity of prooxidants, plays a significant role in the development of HF.31 The results of various studies suggest that free radicals may be involved in cardiomyocyte hypertrophy, apoptosis and mechanisms that mediate myocardial remodelling, by participating in the shift from compensatory hypertrophy to progressive dilation of the heart chambers.33,34 With respect to skeletal muscle, a variety of alterations specific to muscle structure and metabolic state, including muscle atrophy, alterations in fibre type, reduced activity of mitochondrial enzymes and decreased volume density of mitochondria, have all been associated with HFrEF. 35
However, most of the oxidative stress parameters that were examined in this current study did not differ significantly among patients stratified according to their EF. The exception was the value of AOPP, which was significantly higher in patients with EF < 40% compared with patients with EF of 40–49% and ≥50%. In a previous study, peripheral oxidative stress was found not to be detectable in post-infarction HF, even when HF was characterized by progressive remodelling in the subjects examined.36 It was assumed that during late post-infarction myocardial remodelling, ROS were produced mostly in the heart tissue itself.36,37 The peripheral innate antioxidant systems neutralized levels of oxidative stress biomarkers in bodily fluids, making it hardly possible to be detected in their samples. 37 In the current study, the levels of AOPP were the highest in the EF < 40 % group. When comparing the EF ≥ 50% and EF 40–49% groups, the subgroup with preserved EF showed the higher levels of AOPP. This result was in accordance with a hypothesis that HF with preserved EF has an inflammatory background along with microvascular dysfunction compared with the group with reduced EF. 38 The inflammation that is ongoing in patients with EF ≥ 50% is a promoting factor for oxidative stress, 38 which might be an explanation for the differences found among the investigated subgroups in the current study.
Markers of oxidative protein damage have been shown to be a risk factor for atherosclerotic cardiovascular complications in dialysis patients and have been associated with thickening of the intima of the carotid artery. 39 Oxidative damage that occurs and affects proteins has a significant influence on the pathogenesis of eccentric hypertrophy in the left ventricle. 40 This current study showed a significant link between the development of HF with different EF values with almost all oxidative stress parameters through univariate logistic regression analysis. When adjusted for age, sex, hypertension and diabetes mellitus, a multivariate analysis identified AOPP as a marker that could potentially be used during patient assessments. The ROC curve analysis for AOPP showed a cut-off value of 60.89 µmol/l. Considering the fact that AOPP levels were significant in the EF ≥ 50% and EF < 40% groups of patients, it may be useful to include this marker in the assessment of these patients. Patients with EF ≥ 50% belong to the high priority patients for follow-up assessment because their heart function is still preserved enough and allows tertiary prevention of further cardiovascular events and HF. It should be noted that AOPP levels did not differ between patients with NYHA class I + II and III + IV. These current results may indicate that AOPP is better to be combined with other measurements of heart function and physiology such as EF. Methodologically speaking, AOPP can be introduced as a quick and easy analysis to determine in these patients. 41
Patients with post-infarction HF were selected and investigated in this current study. Therefore, AOPP qualifies as a marker that could be useful to determine in prognosis assessment after MI. An increase in the concentration of AOPP was also found in non-uraemic patients with coronary heart disease, which confirms their role in the process of atherosclerosis. 42 AOPP is highly associated with intima thickness in the carotid arteries and may be associated with cardiovascular events. 39 High levels of AOPP in plasma significantly increase the atherosclerotic plaques in hypercholesterolemic rabbits. 43 This previous study showed in vivo that an increase in plasma AOPP levels promote inflammation, as evidenced by increased tumour necrosis factor-α levels, enhanced plasma macrophage invasion and smooth muscle cell proliferation in the arterial wall. 43
Chronic oxidative stress can be monitored through lowering of free thiols in plasma, because reactive species oxidize them quite easily. 44 Research has demonstrated a decrease in plasma thiol, 45 which is probably most related to the oxidation of cysteine in human serum albumin.46 In addition, an increase in plasma carbonyl has been documented without identifying the proteins involved.40,47 Research suggests that the plasma thiols/disulfide state might be an early biomarker of atherosclerosis.48 Since there are both nutritional and therapeutic agents that neutralize the oxidized redox state, there have been suggestions that they could be used to prevent and protect against cardiovascular disease.49,50 In a cohort study, free thiols predicted the risk of cardiovascular events, as well as mortality.51 The current results did not show significant differences in the concentration of free thiols among the groups of patients with HF stratified according to the EF. However, the difference in the concentration of free thiols was significant when NYHA class I + II patients were compared with NYHA class III + IV patients in the current study. These current results suggest that even though free thiol levels might not be as adequate as comparing EF as a measure of heart function, they might be quite useful in distinguishing the severity of the patient’s condition in addition to classifying them into an NYHA class. However, more research should be conducted to draw conclusions on this issue, with a potentially larger number of patients. 52
This current study had several limitations. First, the number of participants was relatively small. In order to produce strong conclusions regarding this population and to provide recommendations regarding the use of a particular diagnostic marker will require a larger study population. Secondly, the healthy volunteers that formed the control group included a small proportion of smokers and those with diabetes mellitus and hypertension. Since these characteristics can influence the biochemical markers that were examined in this current study, the multivariate logistic regression analyses adjusted for age, sex, hypertension and diabetes mellitus.
In conclusion, these current findings suggest that AOPP might participate in the pathogenetic process of HF development after MI as this biomarker was observed to have different concentrations depending on the EF. Based on the ROC curve analysis of AOPP and the higher significance in the multivariate analyses for patients with EF ≥ 50%, these current results suggest that AOPP could be a useful additional tool in the assessment of HF development in patients after MI.
Footnotes
Author contributions
This research was conducted, worked on and reported by all authors equally.
Declaration of conflicting interest
The authors declare that there are no conflicts of interest.
Funding
The authors disclosed receipt of the following financial support for the research, authorship, and/or publication of this article: This work was supported by the Ministry of Education, Science and Technological Development, Republic of Serbia (project no. 451-03-9/2022-14/200113).