
Abstract
Objectives
To determine whether metabolic phenotype is associated with the change in carotid intima-media thickness (CIMT) in patients undergoing bariatric /metabolic surgery (BMS).
Methods
We performed a case-control study of BMS candidates who had metabolically unhealthy obesity (MUO) or metabolically healthy obesity (MHO). We measured the change in CIMT during the 9 months following BMS. The plasma tumor necrosis factor-α, interleukin-1β, adiponectin, leptin, nitric oxide (NO), vascular endothelial growth factor A (VEGF-A), and malondialdehyde concentrations were determined, adipocyte area was measured histologically, and adipose tissue area was estimated using computed tomography.
Results
Fifty-six patients (mean age 44.5 years, mean body mass index 44.9 kg/m2, 53% women, and 53% had MUO) were studied. Nine months following BMS, the MUO phenotype was not associated with a significant reduction in CIMT, and that of the MHO group was larger. In addition, fewer participants achieved a 10% reduction in CIMT in the MUO group. A CIMT reduction was associated with lower VEGF-A and NO in the MUO group, while that in the MHO group was associated with a higher NO concentration.
Conclusion
The metabolic phenotype of patients may influence their change in CIMT following BMS, probably through circulating vasodilatory and pro-inflammatory molecules.
Keywords
Introduction
As well as causing weight loss, bariatric and metabolic surgery (BMS) can ameliorate obesity-linked co-morbidities, such as type 2 diabetes mellitus (t2DM), dyslipidemia, non-alcoholic fatty liver disease, high blood pressure, and obstructive sleep apnea/hypopnea.1,2
Carotid intima-media thickness (CIMT) is frequently used to evaluate the progression of atherogenesis and cardiovascular risk (CVR). 3 Furthermore, patients that undergo BMS experience significant reductions in CIMT and CVR alongside decreases in body mass index (BMI). 4 Although the precise mechanisms mediating the reduction in CVR following BMS are not yet clear, roles for mediators such as vascular endothelial growth factor (VEGF)-A, subclinical inflammation, and adiposity-related substances have been proposed. 5
Two cardiometabolic risk phenotypes have recently been defined, metabolically unhealthy obesity (MUO) and metabolically healthy obesity (MHO), which include specific features of adipose tissue dysfunction, fat body distribution, and adipocytes6,7 that confer metabolic risk. Although these MUO and MHO phenotypes might affect the change in CIMT that occurs following BMS, no previous studies have been designed to identify the relationships between these cardiometabolic phenotypes and the reduction in CVR achieved using BMS. Therefore, in the present study, we aimed to define the relationship between the metabolic phenotype and the change in CIMT following BMS.
Methods
Study design and setting
We performed a case-control study at the Bariatric Surgery and Clinical Research Departments of the Centro Médico Nacional “20 de Noviembre” ISSSTE in Mexico City between January 2016 and December 2018. The recruitment period was between January and September 2016, the participants were subsequently followed during 2016 and 2017, and data collection and analysis was performed between 2016 and 2018.
Study sample
The eligible patients were those diagnosed with morbid obesity (BMI of ≥40 kg/m2 in the absence of co-morbidities or BMI of ≥35 kg/m2 accompanied by any obesity-related health conditions, such as t2DM, hypertension, or obstructive sleep apnea/hypopnea) and were candidates for BMS. All of these patients had undergone endoscopic screening for Helicobacter pylori, screening for endocrine abnormalities, and/or psychiatric evaluations to exclude concomitant disorders that might have reduced compliance with therapy following BMS. The participants had not undergone weight-reducing therapy during the 6 months preceding their enrollment and patients were excluded if they were undergoing a second BMS procedure; if they had an inflammatory disease, severe renal and/or hepatic disease, or active malignancy; if they were pregnant; or if there was evidence of a history of cardiovascular disease (self-reported or diagnostic evidence of ischemic heart disease, coronary artery disease, myocardial structural abnormalities, cardiac interventions or treatment for any of these conditions).
The participants were consecutively recruited and allocated, according to the number of metabolic defects present, to an MHO or an MUO group. Participants placed in the MHO group had fewer than three of the following, whereas those placed in the MUO group had three or more. 1) Fasting plasma glucose concentration >5.55 mmol/L; 2) Plasma triglyceride level ≥1.69 mmol/L; 3) Plasma high-density lipoprotein (HDL)-cholesterol concentration for women ≤1.29 mmol/L and for men ≤1.03 mmol/L; 4) Blood pressure ≥130/85 mmHg; and 5) Waist circumference for women >88 cm and for men >102 cm.
A case was defined using a reduction in CIMT ≥10% 9 months following BMS and a control was defined using a reduction of <10%, as previously.8,9 This difference is meaningful, because it reflects the degree of subclinical atherogenesis following BMS. The control participants in the MHO group were matched for age and sex to participants in the MUO group.
To calculate the appropriate sample size, we used the prevalence of a reduction in CVR identified in previous studies and an alpha value of 0.05. This calculation yielded a sample size of n = 25, which was a reasonable number, given the number of candidates for BMS who are treated during a single year and who meet the selection criteria.
All the patients were de-identified to comply with data protection recommendations for use in research. The study was registered and approved by the Institutional Boards of Ethics, Biosafety, and Research of the CMN “20 de Noviembre” ISSSTE, Mexico City. (approval number 386.2013) and conformed with the principles of the Declaration of Helsinki. All the participants provided their written informed consent. The results form part of the “CROP” study (Biomarkers Derived From Adipose Tissue Useful for the Diagnosis and Prognosis of Cardiovascular Risk in Obese Patients), which is registered at clinical-trials.gov, with number NCT03561987.
Demographic and anthropometric characteristics of the participants
The baseline demographic and clinical data, including age, sex, height, body mass, presence of chronic diseases (such as t2DM and hypertension), and the medications being used, were all obtained from the medical records of the participants. BMI was calculated by dividing body mass (kg) by the square of height (m). Waist circumference was measured according to World Health Organization recommendations, between the lowest point of the last rib and the iliac crest, and is expressed in cm.
Bariatric and metabolic surgery
The BMS procedures performed were sleeve gastrectomy or Roux-en-Y gastric bypass (RYGB), according to the presence or absence of co-morbidities, their eating habits, and/or their digestive tract anatomy. RYGB was preferred for participants with a larger number of adverse conditions.
Analysis of plasma parameters
Blood samples were obtained after an 8-hour fast by antecubital venipuncture, then the samples were immediately centrifuged at 4200 × g for 5 min at room temperature, and plasma samples were recovered and analyzed. Biochemical analyses were performed using an automated analyzer (XN-1000, Sysmex, Kobe, Japan). The plasma tumor necrosis factor (TNF)-α and adiponectin concentrations were determined using immunomagnetic multiplexing assays (MAP Human TH17 [HTH17MAG-14K] and MAP Human Adipocyte [HADCYMAG-61K] Magnetic Bead Panel, respectively; Merck Millipore, Burlington, MA, USA) and were read on a MAGPIX System 40-072–EM (Merck Millipore), according to the manufacturer’s instructions. Soluble intercellular adhesion molecule (ICAM)-1 and VEGF-A were determined using ELISA kits (Quantikine® enzyme-linked immunosorbent assays: Human ICAM-1/CD54 Allele-specific Immunoassay; R&D Systems Inc., Minneapolis, MN, USA; and Human VEGF ELISA Kit, Abcam, Cambridge, UK, catalogue number ab100662). Finally, the concentrations of markers of oxidative stress nitric oxide (NO; Nitric Oxide Assay Kit, Abcam, catalogue number ab65328) and malondialdehyde (MDA; method based on the reaction of MDA with thiobarbituric acid at 95°C, with absorbance of the product being read at a wavelength of 532 nm), were also determined (SUNRISE 30087502 Microplate ELISA reader; Tecan Austria GmbH, Grödig, Austria).
Analysis of adipose tissue parameters
Fifteen-gram samples of visceral adipose tissue (VAT) were obtained from the omenta of the participants during BMS, fixed in formalin, and paraffin-embedded. Histological sections were prepared and stained with toluidine blue, and the adipocyte area was calculated as the mean area of all the adipocytes contained within five 10× fields per sample on digital images obtained from an inverted fluorescence microscope (Axiovert S100; Zeiss, Oberkochen, Germany). Regions of interest were outlined using Imagen Pro-Plus version 5 (Media Cybernetics, Inc., Rockville, MD, USA). The total VAT area was estimated using a 64-slice multi-detector computed tomography (CT). Briefly, the tomography window was placed from beneath the diaphragm to the upper margin of the pubic symphysis with the participant in a supine position. The CT slice thickness was 5.0 mm, the matrix size was 512 × 512, and the pitch was 0.828; and the data were analyzed by two independent, experienced radiologists. An image analyzer (ImageJ software; National Institutes of Health, Bethesda, MD, USA) was used to analyze coronal sections of the abdominal cavity obtained at the level of the fourth lumbar vertebra, which was delineated by the inner edge of the muscular wall and excluded the viscera. The area contained was measured in square centimeters.
Carotid intima-media thickness
CIMT was evaluated using a 4.0-MHz ultrasonographic probe (Philips, Amsterdam, Netherlands), according to the 2004 Mannheim Consensus. 9 Briefly, with the patient in a supine position, primary transverse and longitudinal scanning of the common carotid artery was performed, focusing on the posterior carotid wall at the commencement of the carotid bifurcation and the common carotid artery. CIMT was measured approximately 1 cm from the start of the common carotid artery, as the greatest distance between the lumen-intima interface and the media-adventitia interface, and the result recorded was the mean of at least four measurements. The reproducibility of the measurements was verified by the calculation of acceptable intra-class correlation coefficients of >0.85, which should reduce potential bias. CIMT was determined at baseline and 9 months following BMS, then the magnitude of the change in CIMT was calculated. A CIMT reduction of ≥10% in both groups was used to divide the study sample into two groups, as previously reported.10,11
Study endpoints
The primary endpoint was a reduction in CIMT of ≥10% in both the MUO and MHO groups following BMS.
Statistical analysis
The normality of the datasets was analyzed using the Shapiro–Wilks test. Continuous datasets are expressed as the median and interquartile Range (25th, 75th percentile) and categorical data are shown as n (%). Two-tailed Mann–Whitney U or unpaired t-tests were used as appropriate to analyze continuous data, and the chi-square test was used to analyze categorical data. No missing data were considered during the analyses. Statistical analyses were performed using Prism v. 6.0 (GraphPad, San Diego, CA, USA) and SPSS v. 20 (IBM, Inc., Armonk, NY, USA). Statistical significance was accepted if p ≤ 0.05. The reporting of the study conforms to the Strengthening the Reporting of Observational Studies in Epidemiology (STROBE) Statement: guidelines for reporting observational studies. 10
Results
Fifty-six patients who were candidates for BMS, with a mean age of 45 years, 53% of whom were female, who had a mean BMI of 44.9 kg/m2, and had high prevalences of hypertension and t2DM constituted the study sample. Their clinical and demographic characteristics are shown in Table 1. Three patients were excluded because of incomplete data. The participants were allocated to MHO (n = 26, 46.4%) or MUO (n = 30, 53.6%) groups, and those in the latter group were characterized by being younger; having higher cardiometabolic risk as denoted by the Framingham risk score and the SCORE (Systematic COronary Risk Evaluation); higher plasma glucose, insulin, HbA1c, aminotransferase activities; lower HDL-C; and more frequent use of anti-diabetic and anti-hypertensive medication (Table 1 and Table 2).
Clinical and demographic characteristics of the patients at baseline.

Categorical data are shown as n (%) and continuous data as median (25th, 75th percentile).
The two-tailed Mann–Whitney U test or unpaired t-test was used as appropriate to analyze continuous data, and the chi-square test was used to analyze categorical data.
BMI, body mass index; SAD, sagittal abdominal diameter; HBP, high blood pressure; t2DM, type 2 diabetes mellitus; Dyslip, dyslipidemia; MHO, metabolically healthy obese; MUO, metabolically unhealthy obese; AST, aspartate aminotransferase; ALT, alanine aminotransferase; HbA1c, glycated hemoglobin.
Clinical and demographic characteristics of the participants, part 2.

Categorical data are shown as n (%) and continuous data as median (25th, 75th percentile).
The two-tailed Mann–Whitney U test or unpaired t-test was used as appropriate to analyze continuous data, and the chi-square test was used to analyze categorical data.
MHO, metabolically healthy obese; MUO, metabolically unhealthy obese; SCORE, Systematic COronary Risk Evaluation; HDL-C, high-density lipoprotein-cholesterol; LDL-C, low-density lipoprotein-cholesterol. The “Other drugs” used were statins, non-steroidal anti-inflammatories, antidepressants, neuro-modulators, anti-chronic obstructive pulmonary disease agents, thyroxine, and proton pump inhibitors.
BMS (either sleeve gastrectomy (n = 21, 37.5%) or RYGB (n = 35, 62.5%)) was performed, and 9 months later, the changes in CIMT in the MHO and MUO groups were calculated and compared (Figure 1a). Compared with baseline, the percentage change in the CIMT after BMS was not statistically significant in the MUO group; however, it this percentage change was significant in the MHO group (25th percentile of change in CIMT) (Figure 1a). Furthermore, the number of participants who achieved a 10% reduction in CIMT tended to be lower in the MUO group than in the MHO group, although without statistical significance (73.9% vs. 66.7%) (Figure 1b).
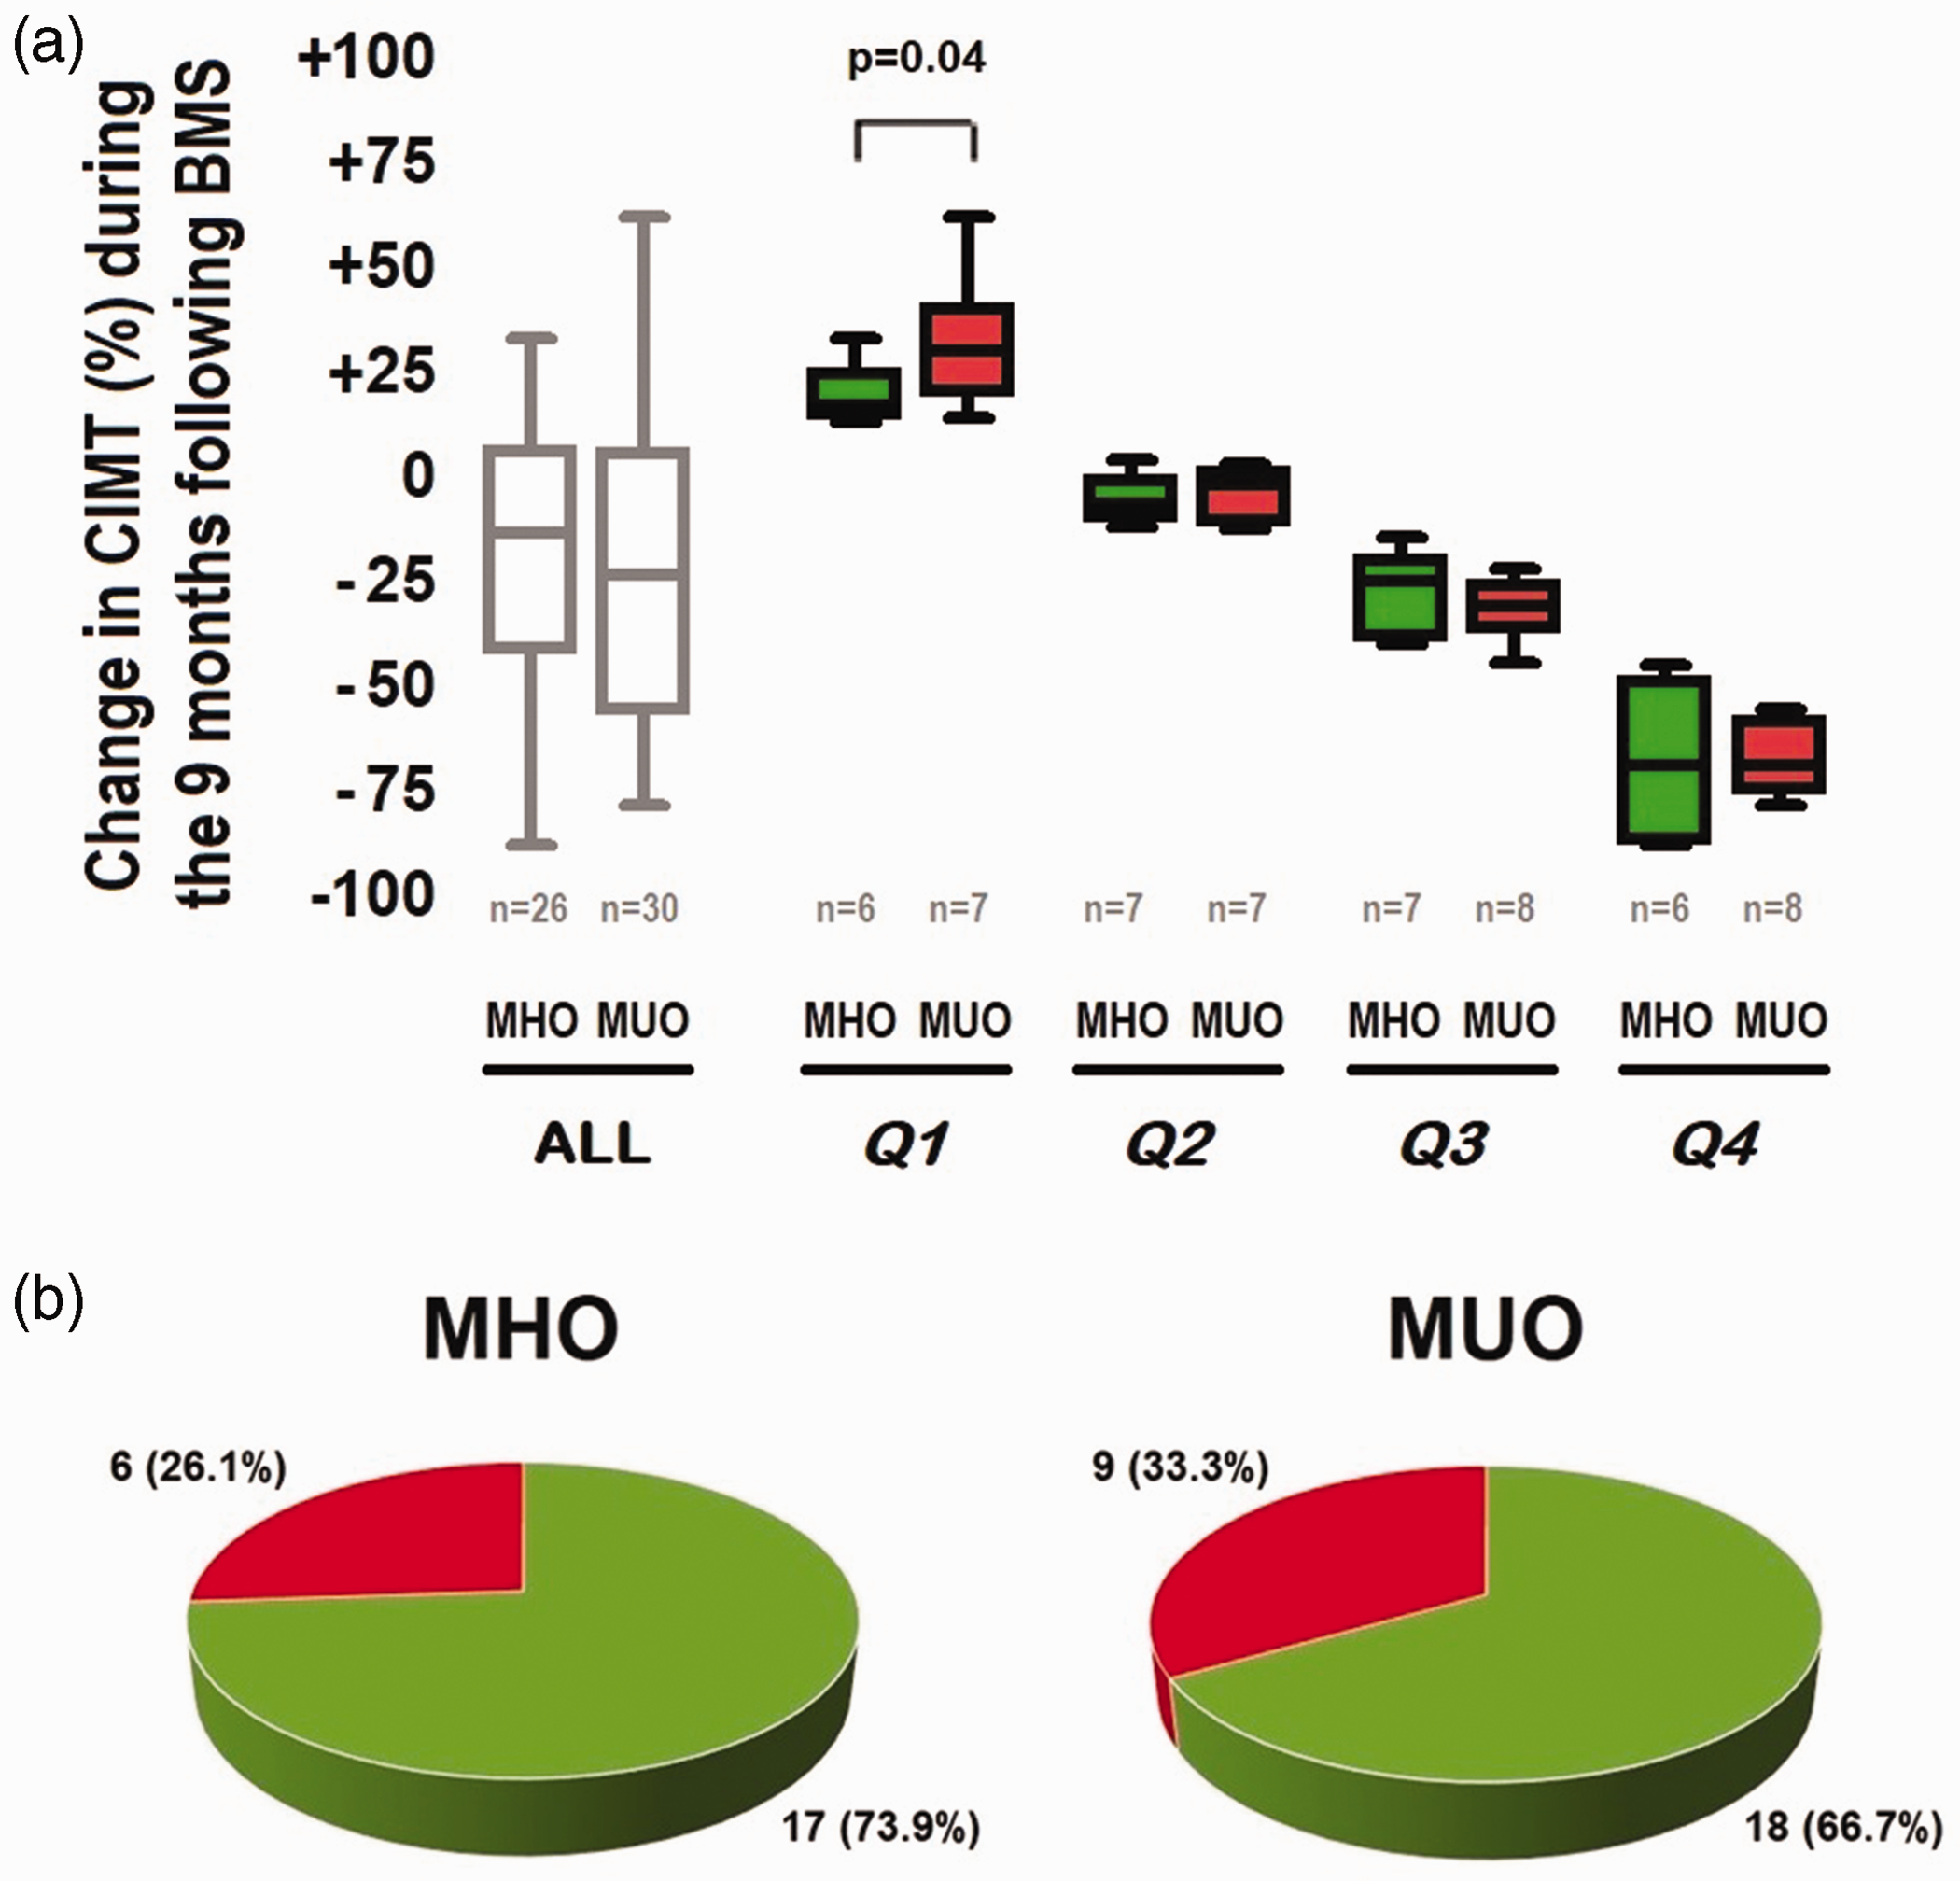
Relationship between the metabolic phenotype and the change in CIMT. (a) Percentage change in CIMT during the 9 months following BMS, according to the metabolic phenotype; expressed according to the quartile of change in CIMT and (b) Number and percentage of participants showing reductions in CIMT of >10% during the 9 months following BMS for each metabolic group. Categorical data are shown as n (%) and continuous data as quartiles. The two-tailed Mann–Whitney U test or unpaired t-test was used as appropriate to analyze continuous data, and the chi-square test was used to analyze categorical data.
A significant reduction in CIMT in the MUO group was associated with a lower VEGF-A concentration (10.4- vs. 2.59-fold difference; p <0.05), whereas a significant reduction in CIMT in the MHO group was associated with a higher NO concentration (257.5 vs. 317.6 µmol/L; p <0.05), which was also significantly higher than that in the MUO group (317.6 vs. 296.7 µmol/L; p <0.05).
From a comparative perspective, CIMT reduction in the MHO group was characterized by a lower VAT area and adipocyte size and higher NO than those in the MUO group (145.2 vs. 202.6 cm2, 1931 vs. 2470 cm2, and 317.6 vs. 296.7 µmol/L, respectively; p <0.05) (Table 3 and Figure 2).
Relationships of metabolic phenotype and the reduction in CIMT with indices of adiposity and vascular function.

Continuous data are presented as median (25th, 75th percentiles).
The two-tailed Mann–Whitney U test or unpaired t-test was used as appropriate.
CIMT, carotid intima-media thickness; MHO, metabolically healthy obese; MUO, metabolically unhealthy obese; VAT, visceral adipose tissue; SAT, subcutaneous adipose tissue; TNF-α, tumor necrosis factor alpha; NO, nitric oxide; MDA, malondialdehyde; VEGF-A, vascular endothelial growth factor A; sICAM-1, soluble intercellular adhesion molecule-1.
*p < 0.05 for CIMT reduction <10% vs. ≥10%; # p < 0.05 MHO vs MUO.
†Values in normal individuals, also obtained but not shown, are control value = 1.

Relationships of the metabolic phenotype and reduction in CIMT with indices of adiposity and vascular function. The two-tailed Mann–Whitney U test or unpaired t-test was used as appropriate. *p < 0.05 for CIMT reduction <10% vs. ≥10%; ** p < 0.05 MHO vs MUO.
Discussion
The main aim of the present study was to identify the effect of metabolic phenotype on the reduction in atherogenesis that occurs following BMS, and the relationships with potential mediators of endothelial dysfunction and adiposity.
Several previous studies have shown reductions in CVR and vascular modifications in patients that undergo BMS;8,13–17 but the mechanisms involved remain unclear. However, in our previous study, we showed that adipocyte size, the extent of adipose tissue vascularization, and the concentrations of leptin and VEGF-A play a role in the reduction in CVR following BMS. 5 In addition, cardiometabolic risk phenotypes have been shown to be related to particular features of adipose tissue dysfunction, body fat distribution, and low-level inflammation.6,7 Therefore, in the present study, we aimed to determine whether specific metabolic phenotypes influence the reduction in CVR following BMS.
We found that the MUO phenotype was associated with a smaller reduction in CIMT 9 months following BMS, but this was observed in a smaller number of participants than in the MHO group. Likewise, the reduction in CIMT was more significant at the 25th percentile (lowest quartile), suggesting that the influence of metabolic phenotype is subtle and most noticeable in individuals with small modifications in subclinical atherogenesis following BMS.
The MUO phenotype was associated with several findings consistent with a pro-atherogenic environment, including high plasma glucose, insulin, and HbA1c, and low HDL-C; which may at least partially explain the smaller decrease in CIMT following BMS in this group, and is consistent with a role for cardiometabolic risk factors in vascular remodeling following BMS. Previous studies have yielded conflicting results regarding the influence of metabolic status on atherogenic and endothelial markers following BMS,18,19 which might be explained by differences in study design, the study population, the experimental approach, and the endpoints assessed.
The reduction in CIMT following BMS was accompanied by higher NO and lower indices of adiposity and endothelial dysfunction in participants with the MHO phenotype, whereas the same reduction in CIMT in participants with MUO was associated with a lower VEGF-A concentration. This suggests that endothelial dysfunction limits vascular remodeling following BMS, consistent with our previous findings. 5 Furthermore, the difference in NO concentration between individuals of differing metabolic phenotype suggests a difference in their ability to respond to biological vasodilators in these groups. Consistent with this, the expression of neuronal nitric oxide synthase has been shown to be related to hepatic insulin resistance and the concentrations of pro-fibrotic factors, such as platelet-derived growth factor, in experimental models.20,21 In addition, hyperinsulinemia has been shown to significantly reduce the production of NO and alter the concentrations of vasomotor regulators, including endothelin-1 and NO, as well as the vasodilatory response, particularly in individuals with more serious metabolic disorders. 22
Mechanistic insight into the influence of the cardiometabolic phenotype on blood vessels following BMS may help identify specific therapeutic targets and aid risk stratification. To the best of our knowledge, this is the first study to use a translational and longitudinal approach to evaluate the influence of metabolic phenotype on subclinical atherogenesis following BMS. However, some limitations of the study should be mentioned. First, the sample was relatively small, and second, the heterogeneity of participants regarding their metabolic risk phenotype was limited, because the sample predominantly comprised patients with the MUO phenotype. Thirdly, there are several means of assessing atherosclerosis, and CIMT might not be the best of these. CIMT was used in the present study because of the evidence that it is a useful predictor of cardiovascular events, regardless of the presence or absence of conventional risk factors.23,24 Therefore, we believe that the present findings should be applicable to similar populations with obesity and metabolic phenotypes.
In conclusion, the data obtained show that the metabolic phenotype of patients may affect the reduction in CIMT that occurs following BMS, and that this is probably mediated through mediators of vasodilation and inflammation. The smaller reduction in CIMT identified in the MUO group suggests that such patients might benefit from the longer-term use of lipid-lowering medications.
Footnotes
Acknowledgements
We thank the members of the Department of Bariatric Surgery for their invaluable support with patient recruitment and biopsy acquisition.
Author Contributions
Conceptualization: AML and JASC; patient recruitment and clinical measurements: DZBL, GDPS, and CRZA; bariatric surgery: JMR, MOF, and OFGF; primary cell culture: JAGB, EVG, and AHP; statistical analysis: JASC, MET, and JAPJ; formal analysis: JASC, AML, and PMT; writing: JASC and AML; review and editing: MATG, MERA, ACR, REHM, JGS, and SG.
Declaration of conflicting interests
The authors declare that there is no conflict of interest.
Funding
This study was funded by the institutional budget program “E015 for health research and technological development” from the Security and Social Services for the Workers of the State Institute (ISSSTE).