
Abstract
Objective
Triple-negative breast cancer (TNBC) is characterized by a lack of targeted therapies and poor patient prognosis, and its underlying pathological mechanisms remain unclear. This study aimed to identify potential key genes and related pathways that are required for TNBC development.
Methods
We screened the Gene Expression Omnibus database for transcriptome data and identified differently expressed genes in TNBC. Then, we performed Gene Ontology analysis to determine the genes and pathways involved in TNBC development. We correlated significantly expressed genes and miRNAs using miRDB, TargetScan, miRWalk, and DIANA, and then validated the expression of CDK1 and miR-143-3p in TNBC patients.
Results
Eighteen genes were significantly upregulated in TNBC patients, and these were found to be enriched in cell metabolic process, cell division, mitochondrion, and respiratory chain. MiR-143-3p was found to be an upstream regulator of CDK1. Validation experiments revealed that CDK1 was upregulated while miR-143-3p was downregulated in clinical TNBC specimens.
Conclusions
Collectively, our results revealed 18 upregulated genes in TNBC. Notably, CDK1 and its related microRNA miR-143-3p could be potential therapeutic targets for TNBC.
Introduction
Breast cancer (BC) has high incidence and mortality rates in women. Estimates from the United States indicate that approximately 284,200 new BC cases are expected in women annually, of which 44,130 patients are likely to die. 1 The prognosis of BC patients has markedly improved, owing to improved approaches for early diagnosis, surgery, neoadjuvant chemotherapy, and molecular targeted gene therapy. Studies have shown that up to 10% of BC cases originate from genetic mutations. 2 In addition to BRCA1/2, the expression of protein kinase R (PKR) and phosphatidylinositol 4-kinase 2-alpha (PI4K2A) have been shown to play important roles in the prognosis of BC patients. 3 Studies have also shown that inhibiting the activity of fatty acid transport protein 1 (FATP1) can inhibit the ability of BC cells to obtain fatty acids, thereby suppressing cell viability. 4 Results from in vitro experiments have revealed that combining a highly specific anti-human epidermal growth factor receptor 3 (HER3) antibody with siRNAs can effectively inhibit the proliferation of HER3-positive BC cells. 5 Triple-negative breast cancer (TNBC) is a subtype of BC that accounts for between 10% and 15% of all cases. To date, no effective targeted therapy has been developed for TNBC. 6 Therefore, searching for potential molecular targets is crucial to providing a theoretical basis that will guide the development of effective molecular targeted therapies for TNBC.
Bioinformatics analyses have been widely used to identify differentially expressed genes (DEGs) and related signaling pathways with the aim of improving disease diagnosis and drug discovery. In this study, we aimed to identify DEGs in TNBC on the basis of three microarray datasets from the Gene Expression Omnibus (GEO) database. Subsequently, we performed Gene Ontology (GO) pathway enrichment and functional analyses to reveal the molecular mechanisms underlying TNBC development and identify therapeutic targets. The workflow of this study is summarized in Figure 1.

Workflow of the analysis performed in this study.
Methods
Analysis of gene microarray data
To identify important genes involved in TNBC, we selected and downloaded three gene expression datasets for BC, namely GSE57297, GSE65212, and GSE38959 from the GEO database (http://www.ncbi.nlm.nih.gov/geo). The GSE57297 dataset comprises three TNBC samples alongside seven healthy controls, GSE65212 comprises 55 and 11 TNBC and healthy samples, respectively, and GSE38959 has 30 TNBC samples alongside three healthy controls. We employed GEO2R (http://www.ncbi.nlm.nih.gov/geo/geo2r) to identify DEGs in BC samples relative to controls using the thresholds p-adjusted value <0.05 and logFC (fold change) >1. Next, we queried the gene expression profiling interactive analysis (GEPIA2) database (http://gepia.cancer-pku.cn/) for full names of the genes and their expression profiles in BC.
GO pathway analysis of the identified DEGs
Functional annotation of identified genes was performed using the DAVID database (http://david.ncifcrf.gov/) at a statistical significance of P<0.05.
Differential gene expression and survival analyses
Analyses of differential gene expression and survival analyses according to gene expression were conducted using the starBase online platform (ENCORI Pan-Cancer Analysis Platform, https://starbase.sysu.edu.cn/panCancer.php).
MicroRNA identification and network construction
We predicted potential targets of microRNAs using the online prediction tools miRDB (http://mirdb.org/), TargetScan (http://genes.mit.edu/targetscan/), miRWalk (http://www.umm.uniheidelberg.de/apps/zmf/mirwalk), and DIANA (http://diana.imis.athena-innovation.gr/DianaTools/). Subsequently, miRNA–gene–pathway networks were constructed and presented as Venn diagrams (http://bioinformatics.psb.ugent.be/webtools/Venn/).
Patients and clinicopathological features
Formalin-fixed and paraffin-embedded (FFPE) samples alongside normal tissues were obtained from the primary tumors of TNBC patients who were recruited at Jiangsu Taizhou People’s Hospital between January 2018 and March 2021. Patients were included in the study if they met the following criteria: (1) underwent surgery for the first time; (2) had not received either chemotherapy or radiotherapy; and (3) voluntarily provided verbal informed consent for use of their FFPE samples. Conversely, patients with any serious medical conditions were excluded from the study. The patients’ ages ranged from 28- to 70-years-old (mean: 52.0 years), and disease grades were categorized according to the American Joint Committee on Cancer (AJCC) 8th TNM classification. The study was approved by the Human Ethics Review Committee of Jiangsu Taizhou People’s Hospital (KY2021-043-01; 2021-04-16). Because all FFPE samples were from patients treated at Jiangsu Taizhou People’s Hospital and remained at the institution, written informed consent was exempted by the Ethics Committee.
RNA extraction and gene expression analysis
FFPE TNBC specimens were sectioned at 10-µm thickness. RNA was extracted using the miRNAprep Pure FFPE Kit (cat. No. DP502; TianGen Biotech, Beijing, China) in accordance with the manufacturer's instructions, and then reverse transcribed to complementary DNA (cDNA) using the miRcute Plus miRNA First-Strand cDNA Synthesis Kit (TianGen Biotech). The cDNA was subjected to quantitative real-time PCR (qPCR) targeting miR-143-3p using the miRcute Plus miRNA qPCR Detection Kit (TianGen Biotech) on an ABI 7500 system (Thermo Fisher Scientific, Waltham, MA, USA). U6 was used as an internal reference. The real-time reaction for CDK1 was performed using FastKing gDNA Dispelling RT SuperMix (TianGen Biotech). A standard SYBR Green PCR Kit (Lifeint, Beijing, China) was used to examine mRNA expression in accordance with the manufacturer's protocol. Relative expression was calculated using the 2−ΔCq method, where ΔCq = Cq(target) − Cq(reference). The primers used were as follows: miR-143-3p forward: 5′-GCGCGTGAGATGAAGCACTGTAGCTC-3′; The reverse primer was the universal primer in the kit; CDK1 forward: 5′-GGTTCCTAGTACTGCAATTCG-3′ and CDK1 reverse: 5′-TTTGCCAGAAATTCGTTTGG-3′; GAPDH forward: 5′-GGAGCGAGATCCCTCCAAAAT-3′ and GAPDH reverse: 5′-GGCTGTTGTCATACTTCTCATGG-3′. All miRNA primers were obtained from TianGen Biotech. GAPDH was included as an internal reamplification control. The primers were synthesized by Shenggong Inc. (Shanghai, China). All experiments were performed in triplicate.
HEK293T cell culture and co-transfection
HEK293T cells were first inoculated in Dulbecco's modified Eagle's medium (DMEM) supplemented with 10% fetal bovine serum (FBS) and 100 U/mL penicillin/streptomycin, and then seeded into six-well plates. A miR-143-3p mimic or miR-negative control was co-transfected into HEK293T cells with CDK1 wild-type or mutant plasmids, respectively, using Lipofectamine 2000 (Thermo Fisher Scientific) in accordance with the manufacturer’s instructions. Cells were harvested 48 hours after transfection and subjected to dual-luciferase reporter assays.
Dual-luciferase assay
Dual-luciferase assays were performed using the Beyotime kit (RG027; Shanghai, China) in accordance with the manufacturer’s instructions. Briefly, transfected cells were thoroughly lysed for 20 minutes using an oscillator before detection. Next, 100 μL of firefly luciferase reagents and 20 μL of samples were added to each well, followed by 100 μL of Renilla luciferase reagents with stirring. Finally, the relative light units were measured.
Statistical analysis
Statistical analyses were performed using PASW Statistics for Windows version 18.0 (SPSS Inc., Chicago, IL, USA) and data are presented as mean ± standard deviation (SD). Differences in clinical parameters between groups were analyzed using Student’s unpaired t-tests, whereas expression levels of miR-143-3p and CDK1 were compared between TNBC and adjacent non-tumor tissues using paired t-tests. Correlations between miR-143-3p and Ki67 were performed using the Spearman correlation test. Differences of P ≤ 0.05 were considered statistically significant.
Results
Identification of DEGs in TNBC
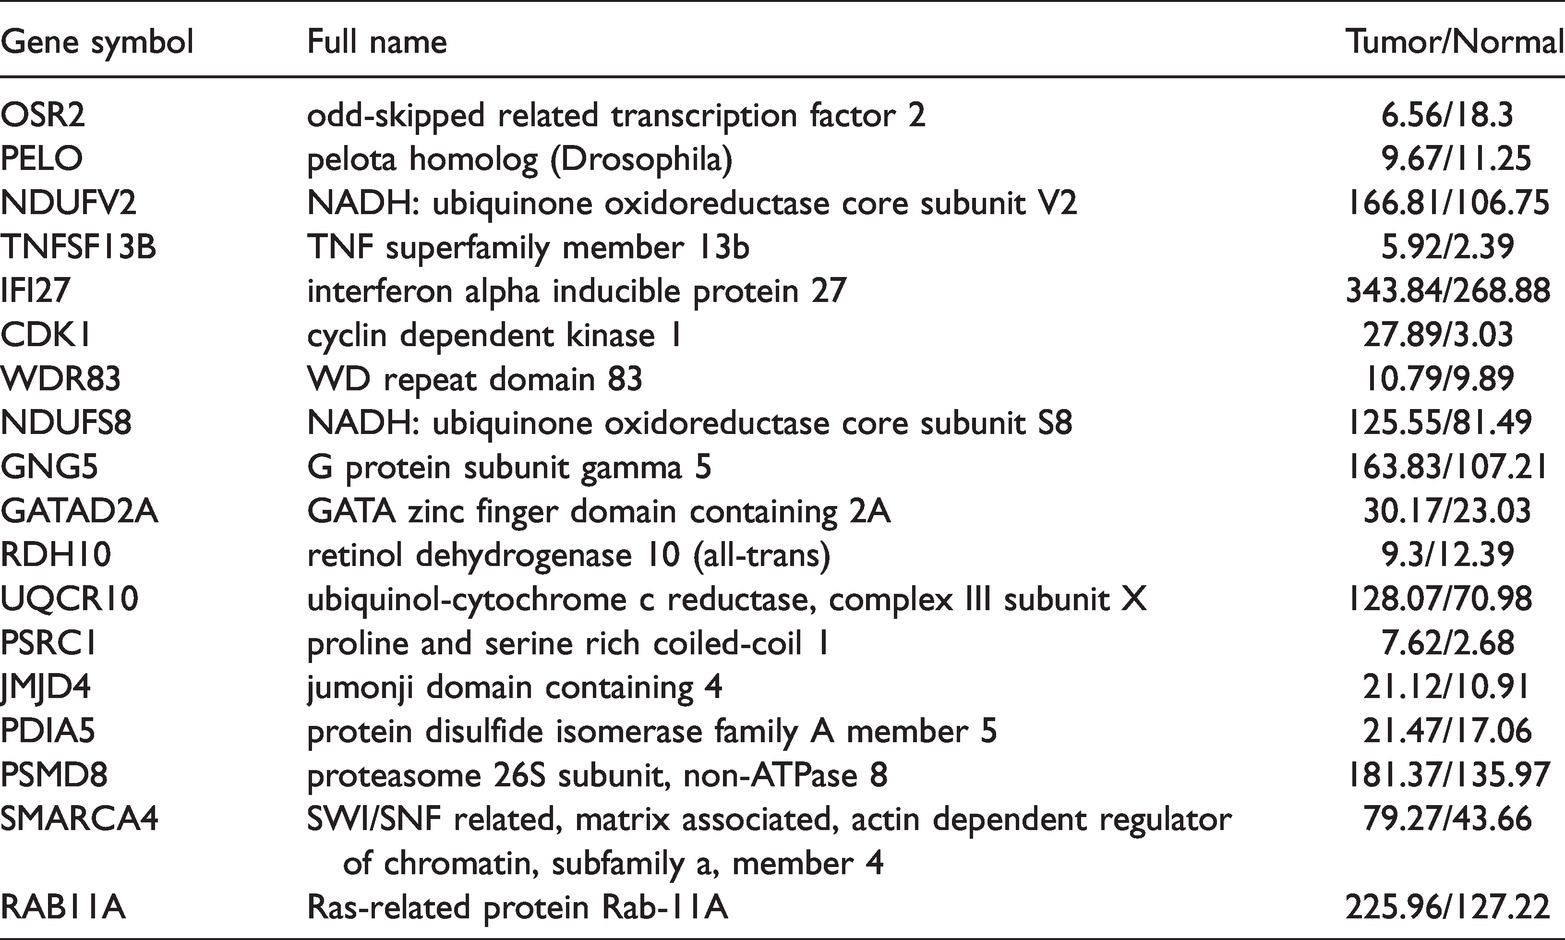
Differential expression analysis revealed that 3244, 3870, and 6684 genes were upregulated in the GSE57297, GSE65212, and GSE38959 datasets, respectively. A Venn diagram of these genes showed that 18 upregulated genes were shared among the three datasets (Figure 2a). Summaries of the symbols, full names, and expression profiles in GEPIA2 for the 18 upregulated genes are outlined in Table 1. In total, 3172, 7455, and 3827 downregulated genes were identified in GSE57297, GSE65212, and GSE38959, respectively, of which 10 were shared among the three datasets (Figure 2b).
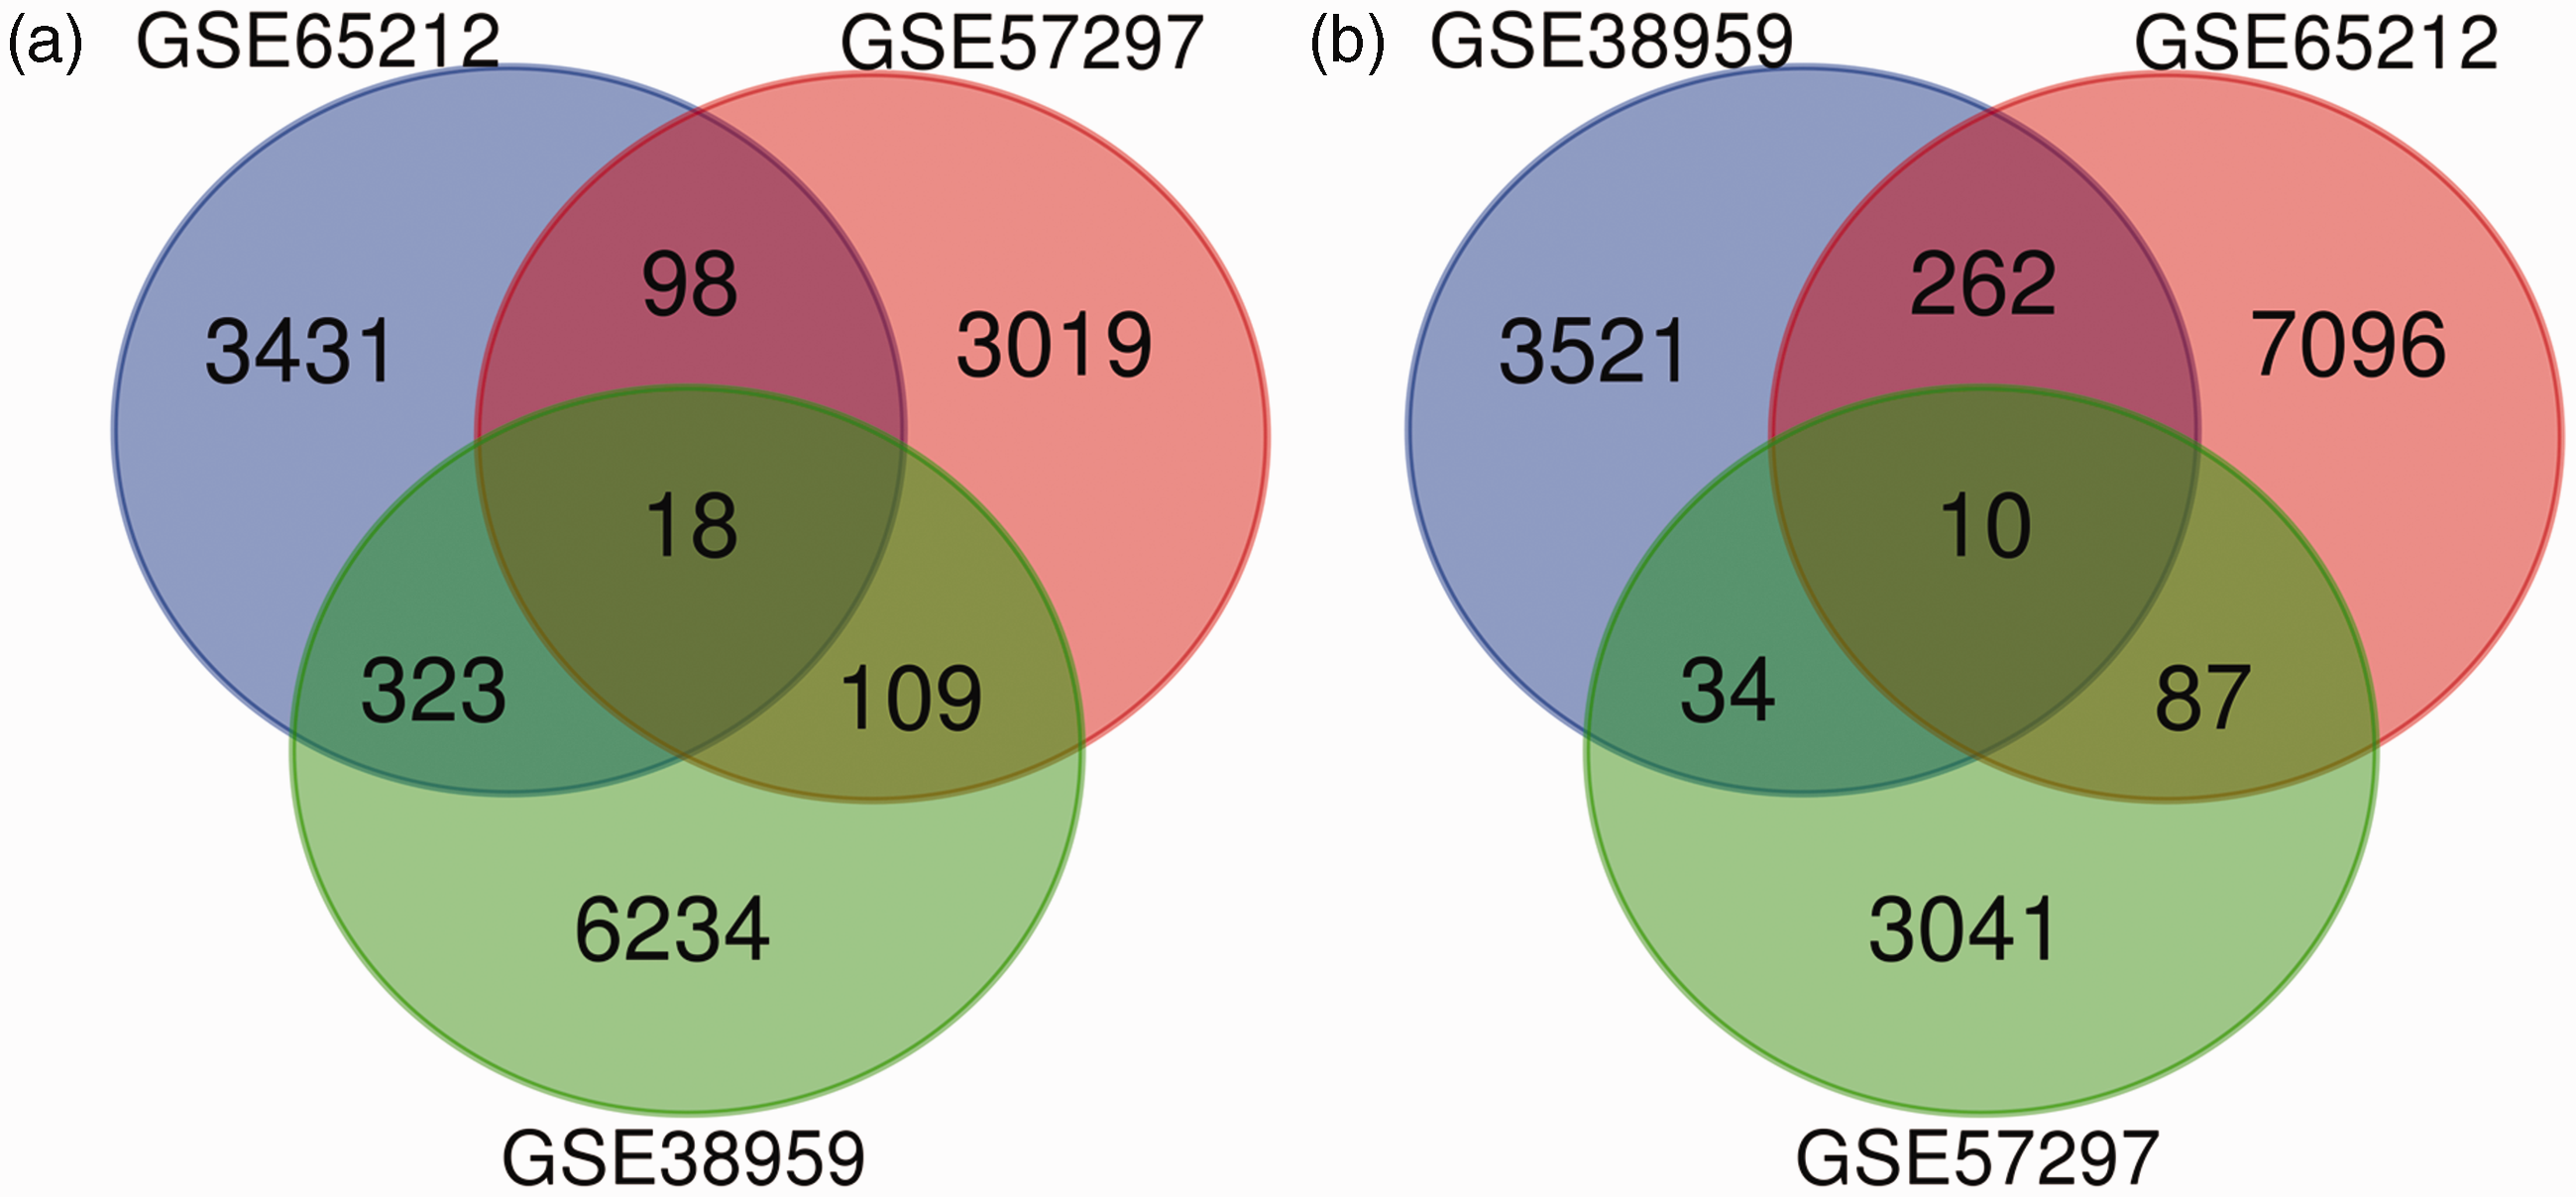
Venn diagram showing DEGs across the three datasets, with an overlap of 18 upregulated genes (a) and 10 downregulated genes (b).
Summary of the functions of the key upregulated genes in triple-negative breast cancer.
Functional annotation of the 18 upregulated genes
GO terms showed that the upregulated DEGs were significantly enriched in cell metabolic process and gene expression (Table 2). Functional GO functional analysis revealed that the DEGs were mainly involved in cell division, mitochondrion, and respiratory chain (Table 3).
GO pathway enrichment analysis of the differentially expressed genes.

Functional analysis of the differentially expressed genes.

Clinical significance of the 18 upregulated genes
Analyses of differential expression and survival data with regards to these genes were conducted using the starBase online platform. Except for PELO and RDH10, the other 16 genes were upregulated in most BCs (Figure 3a). Kaplan–Meier survival curve analysis demonstrated that there was a significant difference in survival according to the expression of some of the identified genes in BC tissues, including PELO (Figure 3b).
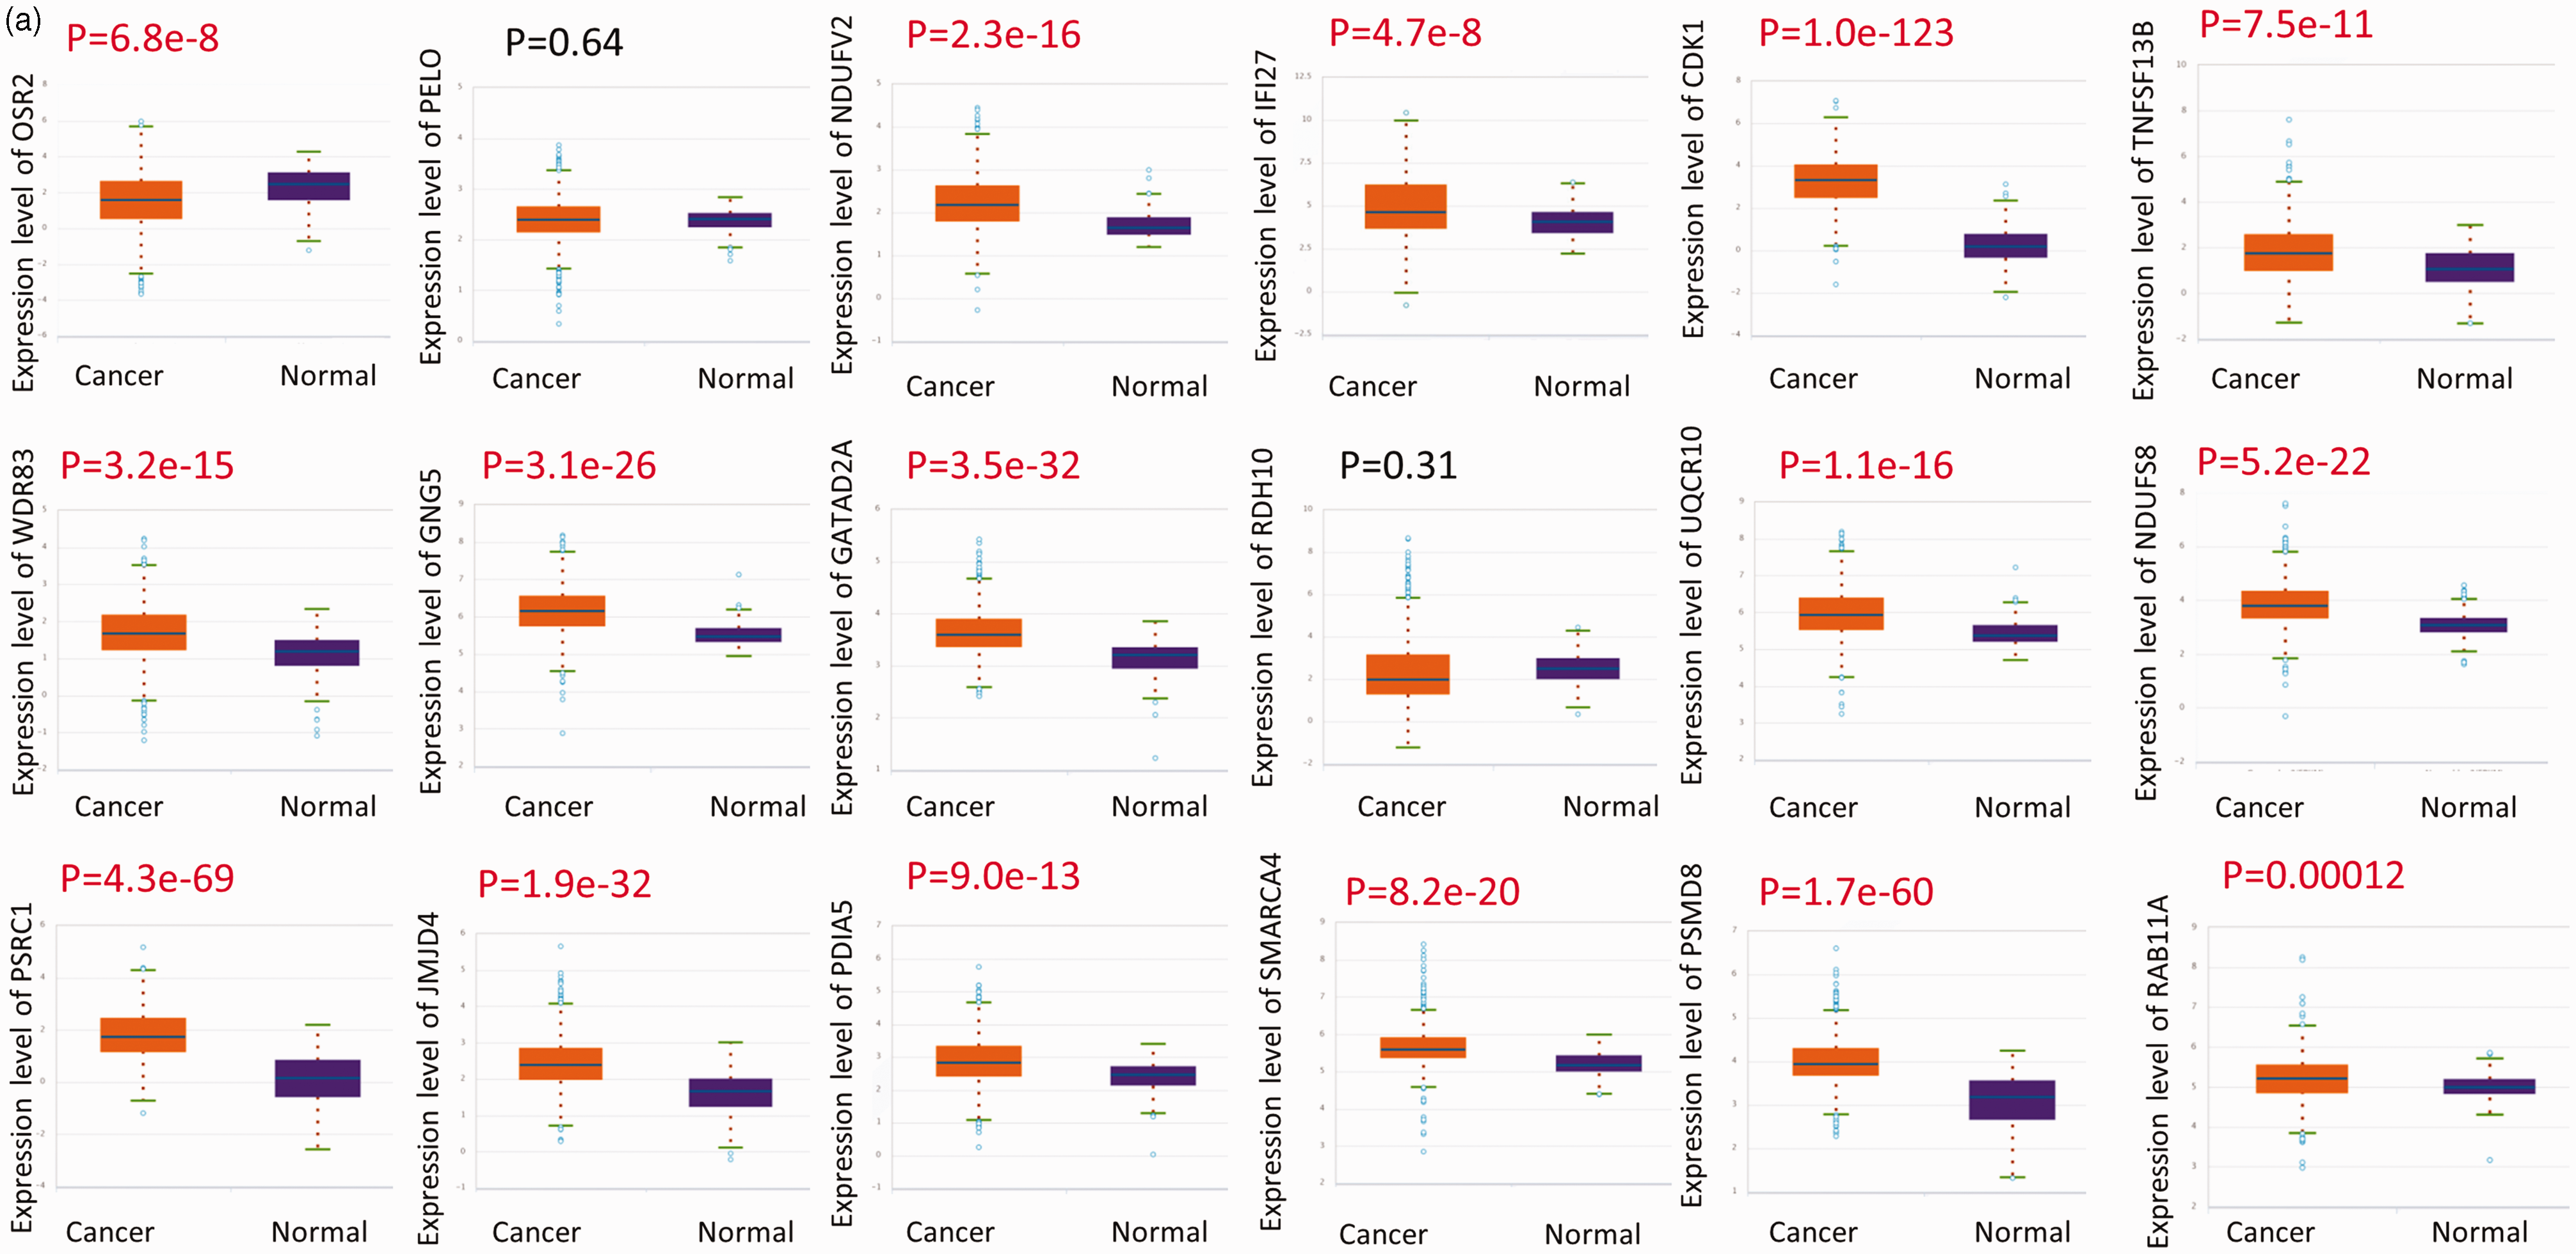
Differential gene expression (a) and survival analyses by gene expression (b) were performed using the starBase online platform.
Identification of novel miRNAs
We used miRDB, TargetScan, miRWalk, and DIANA to screen for common targets on the basis of the intersection of elements and visualized the results using a Venn diagram (Figure 4). All four databases contain computationally predicted miRNA–target interactions. Interestingly, only one miRNA (miR-143-3p) was predicted to be an upstream regulator of CDK1 (Figure 4a). Conversely, four miRNAs (miR-5002-5p, miR-6513-5p, miR-942-5p, and miR-6780a-3p) were identified for IFI27 (Figure 4b). Moreover, two miRNAs (miR-139-5p and miR-155-5p) were curated for SMARCA4 (Figure 4c). We used GEPIA2 to determine expression profiles of CDK1 in human tumors. The results showed that CDK1 was highly expressed in 21 malignant tumor types relative to matched normal tissues (Figure 5a and b). In contrast, miR-143-3p was markedly downregulated in BC samples relative to normal samples according to starBase data (Figure 6a). Moreover, miR-143-3p expression was negatively correlated with CDK1 levels (Figure 6b). The predicted targets are illustrated in Figure 6c.

Venn diagram showing the intersection of gene targets for CDK1 (a), IFI27 (b), and SMARCA4 (c). CDK1, cyclin dependent kinase 1; IFI27, interferon alpha inducible protein 27; SMARCA4, SWI/SNF related, matrix associated, actin dependent regulator of chromatin, subfamily a, member 4.

(a) Interactive Body Map. Median expression of tumor and normal samples in Body Map and (b) Gene expression profiles across all tumors relative to paired normal tissues (Bar plot). The height of each bar represents median expression in a particular tumor type or normal tissue.

(a) Profile of miR-143-3p expression in breast cancer according to starBase. (b) MiR-143-3p expression was correlated with CDK1 (Pearson correlation, r = −0.116, P < 0.05) and (c) CDK1 was found to be a putative target gene of miR-143-3p.
MiR-143-3p binds to the 3′UTR of CDK1
A dual-luciferase reporter system was used to determine the relationship between miR-143-3p and CDK1. The results showed that co-transfecting HEK293T cells with a miR-143-3p mimic and the CDK1 3′UTR vector resulted in significantly lower luciferase activity compared with that of cells transfected with the miR negative control and/or CDK1 3′UTR vector alone (P<0.01). Next, we found that luciferase activity was recovered in cells transfected with the CDK1-mut vector (P<0.01) (Figure 7a and b), indicating that miR-143-3p directly targets CDK1 by binding to its 3′UTR.
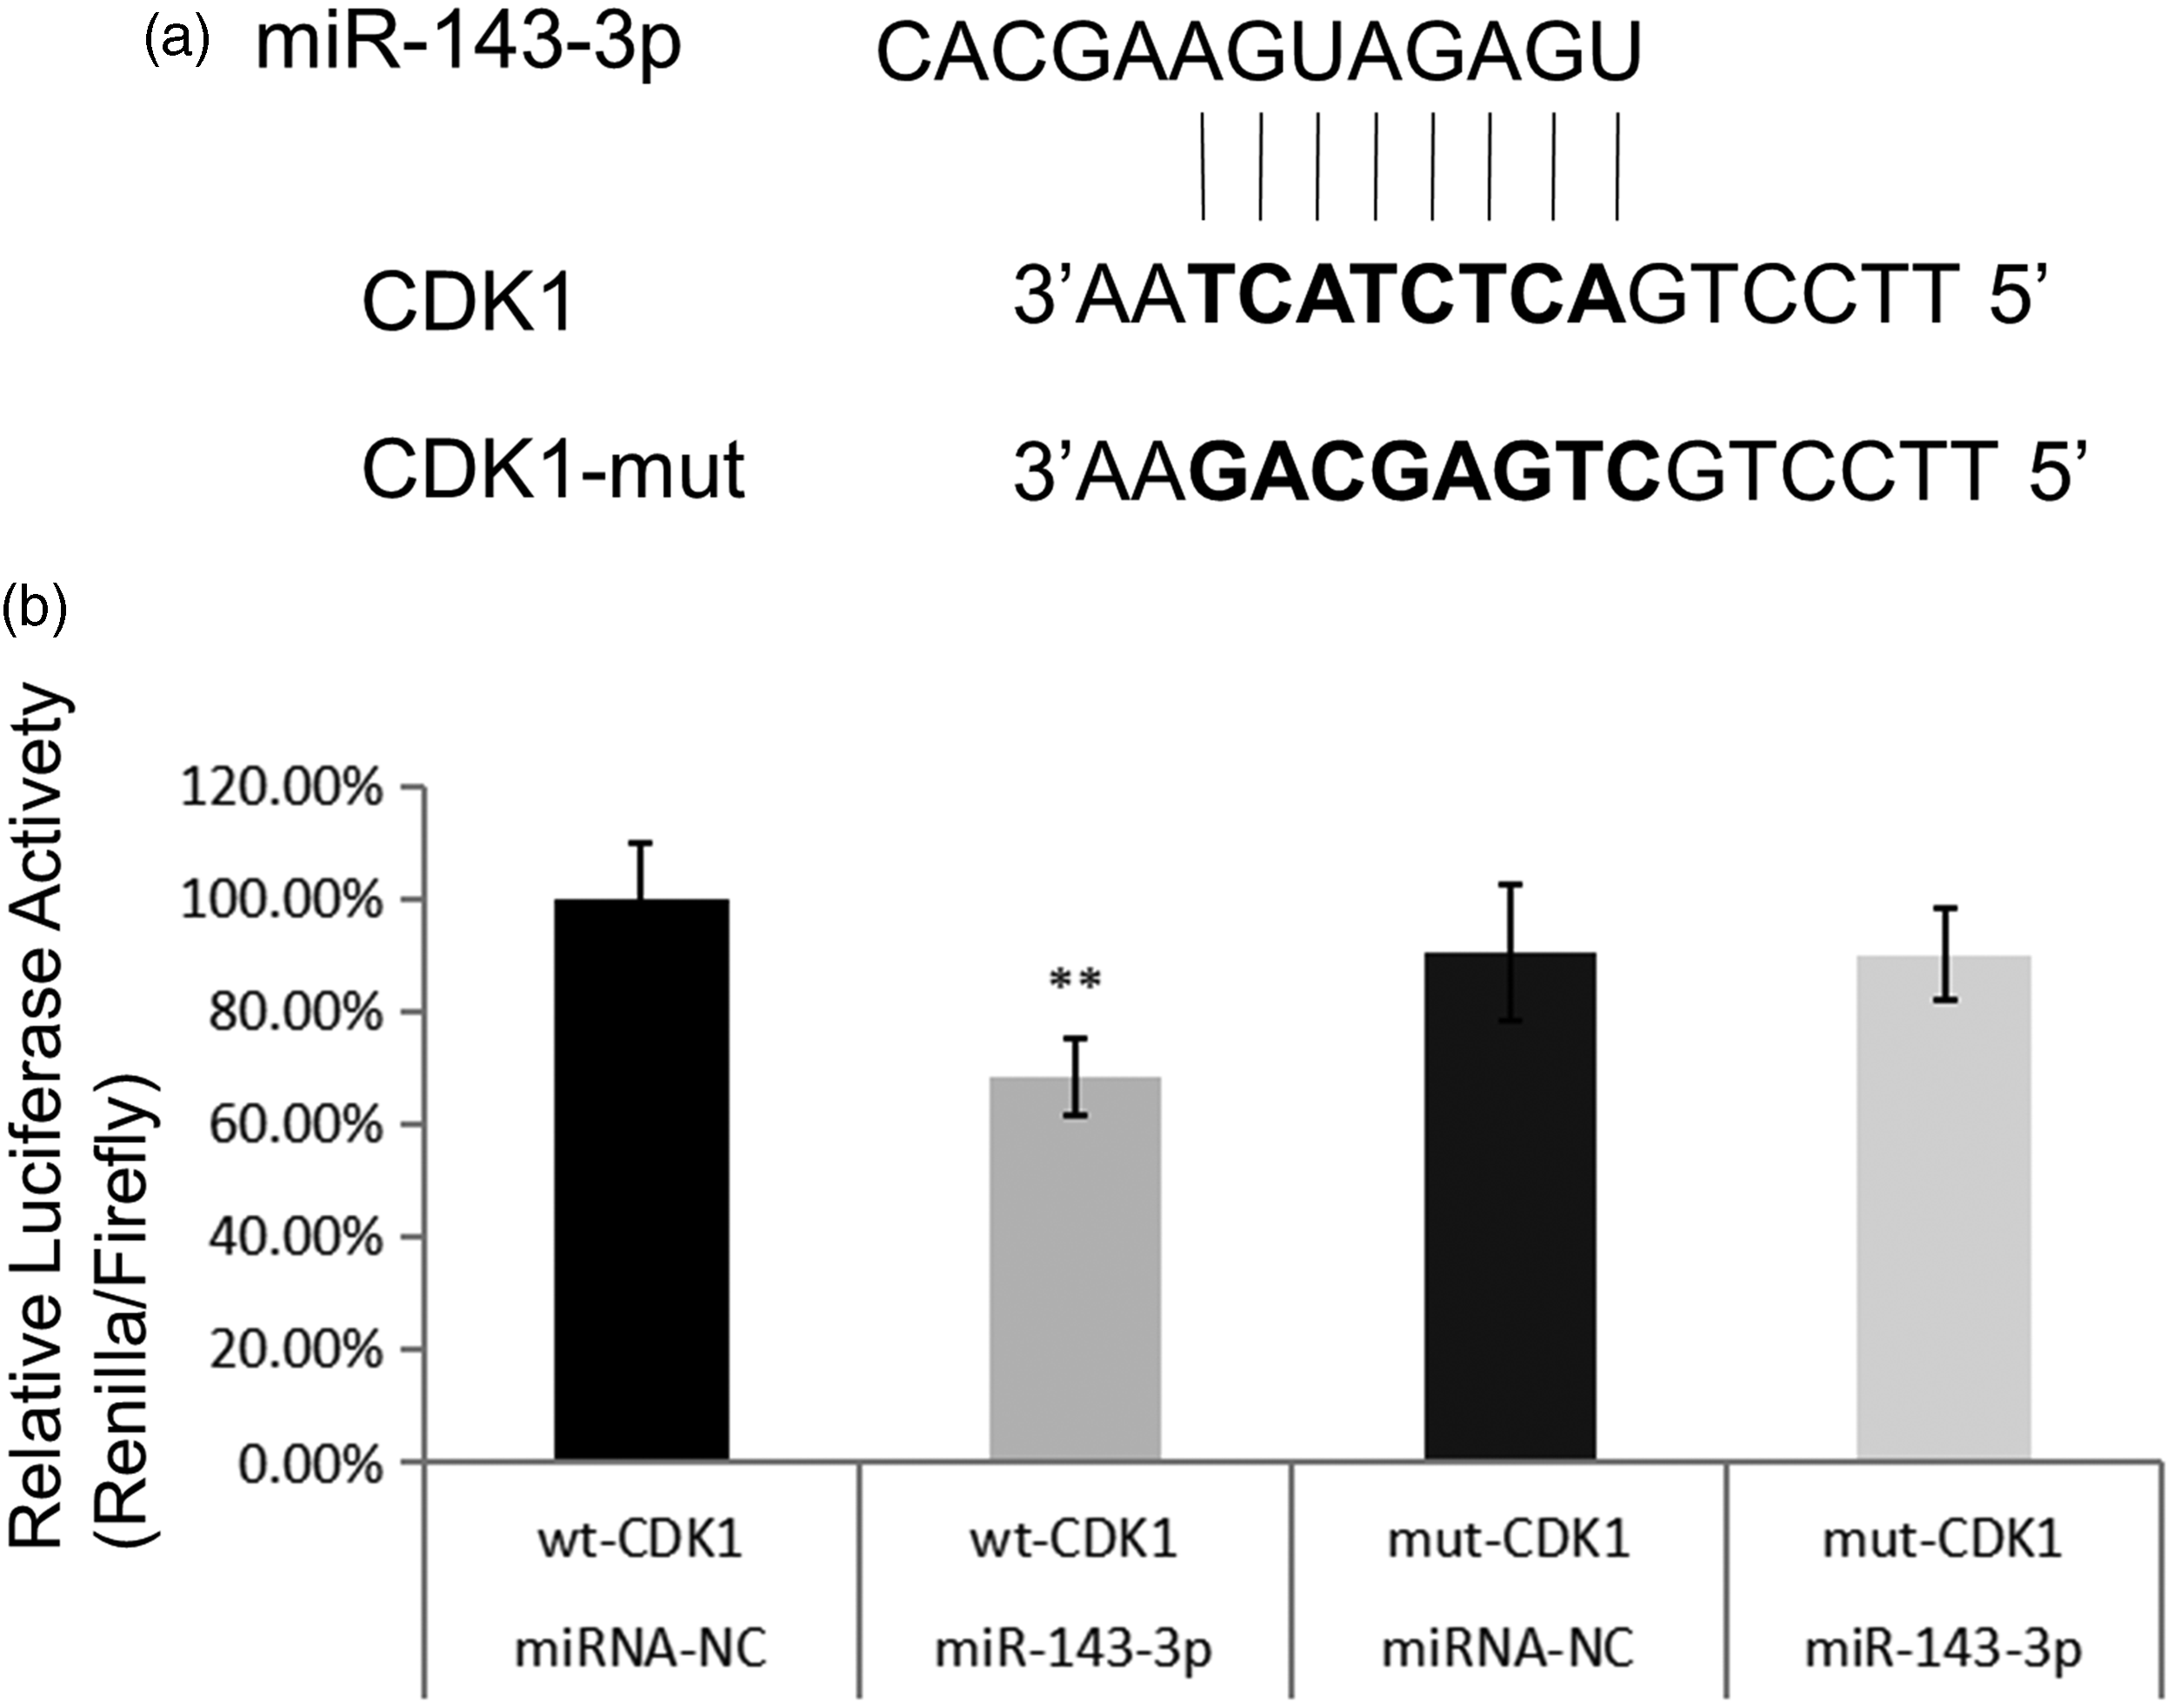
miR-143-3p inhibits CDK1 transcription by binding to its 3′UTR. (a) Predicted miR-143-3p target sequence in CDK1 and (b) Dual-luciferase reporter assays verified that CDK1 is a target gene of miR-143-3p.
Validation of CDK1 and miR-143-3p expression in TNBC
Our qPCR results showed that CDK1 was significantly upregulated in 30 TNBC patient samples relative to surrounding tissues (P<0.05) (Figure 8a). Clinicopathological associations between CDK1 and miR-143-3p expression in TNBC are presented in Table 4. In summary, miR-143-3p showed reduced expression in samples from 40 TNBC patient samples relative to surrounding tissues (P<0.05) (Figure 8b). A negative correlation (p<0.05) was observed between miR-143-3p and Ki67 expression (Figure 8c).

(a) Profile of CDK1 expression in TNBC relative to adjacent normal tissue samples from 30 patients. (b) MiR-143-3p expression in TNBC tissues alongside their adjacent normal tissues across 40 patients and (c) MiR-143-3p expression was correlated with Ki67 (Pearson correlation, r = 0.114, P < 0.05).
Clinicopathologic associations with CDK1 and miR-143-3p in TNBC (n = 45).

Discussion
Recent statistics have revealed that BC is the most prevalent malignant tumor in women, accounting for 30% of all female cancers. 1 The incidence of BC in China has been increasing over recent years, 7 a complex phenomenon that has been attributed to numerous factors. The familial clusters and ethnic disparities suggest that genetic mutations play a central role in BC-related carcinogenesis. 8 Therefore, targeted therapy may have great implications for the treatment of BC. The development of targeted therapies for TNBC is challenging due to the lack of expressed targetable receptors, a situation that has made the disease become the most aggressive BC subtype. Moreover, discovering potential genetic mutations remains a huge challenge for targeted therapy. 9 Microarray technology has rapidly evolved over the past decade, a phenomenon that has markedly improved explorations of genetic alterations in TNBC.
In this study, we identified 28 DEGs between TNBC and healthy samples across three microarray datasets in the GEO database, of which 10 and 18 were down- and up-regulated, respectively. We performed GO analysis to explore interactions among the upregulated DEGs and found that all 18 were enriched in cell metabolic process and gene expression. Functional analysis indicated that the upregulated DEGs were involved in cell division, mitochondrion, and respiratory chain. Metabolic reprogramming of cancer plays an important role in tumor development. 10 Previous studies have also shown that increased levels of cell cycle-related proteins are correlated with worse survival in BC patients. 11 A recent study demonstrated that mitochondria are a potential target for drug resistance in TNBC, 12 while another revealed that inhibiting mitochondrial oxidative phosphorylation prevented tumorigenesis of BC cells without interfering with the metabolism of non-cancerous cells. 13 Taken together, these observations are consistent with our results. Recently, a new drug that targets TROP-2 named sacituzumab govitecan (SG) was approved for TNBC. 14 Further studies showed that the median overall survival was 12.1 months with SG compared with only 6.7 months with chemotherapy in patients with relapsed or refractory TNBC. 15 Thus, survival was significantly increased with SG compared with chemotherapy among patients with relapsed or refractory TNBC. Therefore, searching for new potential therapeutic targets, biomarkers, and related pathways in TNBC is imperative to improving the management of this disease.
We used miRDB, TargetScan, miRWalk, and DIANA to screen for relevant miRNA–gene interactions and found that only miR-143-3p was associated with CDK1 expression. Members of the CDK family play a key role in cell cycle progression, and CDK1 is considered the best CDK target for BC therapy.16,17 Previous studies have shown that CDK1 is regulated by multiple factors, key among them being KIAA1429, which promotes tumor progression. 18 Another study demonstrated that downregulation of NUSAP1 inhibited the tumorigenicity of BC cells by regulating CDK1 expression, 19 while the miR-143-3p/CDK1 axis has also been found to regulate apoptosis in lung cancer cells. 20 Moreover, overexpressing miR-143-3p inhibited the progression of cervical cancer, while CDK1 offset this effect. 21 However, until now, the relationship between miR-143-3p and CDK1 had not been reported in TNBC. Our results also revealed that miR-139-5p and miR-155-5p were associated with SMARCA4 across all four databases. Studies have not only found that SMARCA4 (also called BRG1) is associated with tumor immunity, 22 but is also a key factor for tumor cell proliferation. 23 Notably, the IFI27 gene was associated with miR-5002-5p, miR-6513-5p, miR-942-5p, and miR-6780a-3p. A previous study found that IFI27 overexpression was associated with overall survival in estrogen receptor-positive BC patients. 24
Next, we validated CDK1 and miR-143-3p expression using qPCR and found that CDK1 was upregulated, while miR-143-3p was downregulated in TNBC relative to adjacent normal tissues. These results were consistent with previous studies, which have also reported a downregulation of miR-143-3p in clinical BC samples and BC cells.25,26 Results from cellular experiments have also demonstrated that increased miR-143-3p expression has antitumor effects in BC cells. 27 Functionally, miR-143-3p regulates BC cell proliferation and apoptosis by targeting MYB proto-oncogene like 2. 28 Li et al. 29 found that miR-143-3p expression improved the sensitivity of BC cells to radiation through fibroblast growth factor-1. Collectively, we hypothesize that miR-143-3p could be involved in multiple signaling pathways by targeting different genes in BC. Moreover, CDK1 participates in the tumorigenesis of TNBC via miR-143-3p.
Our results further indicated that miR-143-3p was negatively correlated with Ki67 expression. Generally, higher Ki67 expression is associated with shorter median survival times in BC patients. 30 Therefore, these results further affirmed that miR-143-3p is involved in TNBC development. It is possible that lower miR-143-3p expression may be strongly correlated with TNBC malignancy, whereas CDK1 upregulation plays a role in TNBC development. These findings present crucial targets for BC therapy and have significant implications. However, further studies are needed to elucidate the biological functions and pathways regulated by these genes in BC. Our findings further demonstrated that miR-143-3p targets CDK1. This pathway is involved in tumorigenesis in TNBC. However, further validation using in vitro and in vivo experiments is required before application in clinical practice. Overall, the findings of this study will set a platform for future research that aims to develop therapeutic and diagnostic strategies for TNBC.
Conclusions
This study revealed key genes involved in TNBC development, of which 18 were significantly upregulated in disease samples. CDK1 was found to be associated with miRNAs, suggesting that these could be therapeutic targets for TNBC. Future studies are expected to elucidate the mechanisms underlying the expression changes and biological functions of CDK1 and miR-143-3p in TNBC.
Footnotes
Authors’ contributions
Q.N. and C.P. conceptualized and designed the study; Q.N. and A.H. performed experiments; C.P. analyzed data and interpreted experimental results; Q.N. prepared figures and drafted the manuscript; C.P. and A.H. edited and revised the manuscript. All authors approved the final version of the manuscript.
Data availability statement
Data that support the findings of this study are available from the corresponding author upon reasonable request.
Declaration of conflicting interests
The authors declare that the research was conducted in the absence of any commercial or financial relationships.
Funding
The authors disclosed receipt of the following financial support for the research, authorship, and/or publication of this article: This work was supported by funds from the Jiangsu Provincial Double-Innovation Doctor Program (Grant Nos. 202030205 and 202030206).