
Abstract
Objective
To investigate the effect of sequential Helicobacter pylori eradication therapy on serum osteoprotegerin levels in patients with H. pylori infection and co-existing inflammatory bowel disease (IBD).
Methods
Three groups of patients were involved in this observational cross-sectional study: IBD (n = 83), H. pylori infection (HP, n = 68), and H. pylori infection with co-existing IBD (HP + IBD, n = 52). These groups were compared with a normal control group (NC, n = 50). Serum osteoprotegerin, serum bone alkaline phosphatase (BALP), and fecal calprotectin (FC) levels were measured.
Results
Serum osteoprotegerin levels were significantly correlated with the simple endoscopic score for Crohn’s disease and Mayo score for ulcerative colitis. The receiver operating characteristic analysis of osteoprotegerin revealed high values for the area under the curve, sensitivity, and specificity. Discriminant analysis illustrated that osteoprotegerin levels significantly differentiated patients with IBD from healthy controls. Osteoprotegerin and FC levels distinguished the IBD and HP + IBD groups from the NC and HP groups.
Conclusions
Sequential eradication therapy did not affect serum osteoprotegerin levels in patients with H. pylori infection and co-existing IBD. Serum osteoprotegerin elevation might be a marker for IBD development in patients with past or current H. pylori infection.
Keywords
Introduction
Background/rationale
Inflammatory bowel disease (IBD) is a global chronic idiopathic immunologically mediated disease with ulcerative colitis (UC) and Crohn’s disease (CD) as its main types. 1 Helicobacter pylori, a widespread infection, is acquired during childhood and it may be carried throughout life if not properly eradicated. Information about the probable connection between H. pylori infection and IBD is controversial. Although some studies identified a negative link and even suggested a protective role of H. pylori infection against IBD,2,3 other studies reported a positive relationship between H. pylori infection and IBD.4,5 Conversely, some limited data suggest a positive link between H. pylori eradication and the development of IBD. Thus, monitoring the exact link between H. pylori infection, whether active or eradicated, and the development of IBD is difficult but important.6,7 H. pylori infection leads to many metabolic abnormalities, and it may be a risk factor for osteoporosis. 8 It was associated with an increased risk of osteoporosis independent of risk factors and confounding factors. 9 In addition, proton pump inhibitors exerted a negative influence on bone formation in growing rats largely by decreasing calcium absorption. 10 However, early H. pylori eradication therapy is likely to reverse the increased risk of osteoporosis development. 11
Patients with IBD carry a higher risk of bone loss than the ordinary population. Chronic inflammation decreases bone mineral density, leading to osteoporosis. 12 Osteoprotegerin (OPG) is a cytokine receptor produced by osteoblasts and a member of the TNF receptor family of proteins. It plays important roles in bone turnover (a marker of bone formation), inflammatory pathways, and tumor cell survival. Osteoblasts express a surface ligand named receptor activator of nuclear factor kappa B (NF-κB) ligand (RANKL), which can bind either to receptor activator of NF-κB (RANK) on osteoclast precursors or to OPG, which is considered an osteoblast-derived soluble decoy receptor. 13 The interaction between RANK and RANKL results in the maturation of osteoclasts, which can ultimately cause osteoporosis. OPG inhibits the RANK–RANKL ligation and hence prevents the subsequent activation of NF-κB, 14 inhibits the osteoclast maturation, and interferes with osteoporosis. 15 In addition, OPG is produced by dendritic cells and B‐lymphocytes, whereas RANKL is largely synthesized by T‐lymphocytes. RANKL and several cytokines (e.g., TNF‐α) induce the production of OPG by immune cells. The disruption of RANK–RANKL binding by OPG downregulates the activities of T‐lymphocytes and dendritic cells and modulates the inflammatory response.16,17 Conditions associated with osteoporosis might be associated with higher RANKL and lower OPG levels. Consequently, this system may be essential for linking mucosal or systemic inflammation with changes in bone metabolism and eventually osteoporosis. 18 IBD is associated with osteoporosis, chiefly in patients with active inflammation; thus, OPG may act as a counter mechanism to suppress both inflammation and bone loss. 19 OPG displayed promising results as a biomarker in the diagnosis of gastrointestinal cancer and predicting treatment efficacy. 20
Objectives
The current study investigated the effect of sequential H. pylori eradication therapy on serum OPG levels in patients with H. pylori infection and co-existing IBD.
Materials and methods
Study design
This observational cross-sectional study was conducted in the Gastroenterology Department, King Abdulaziz University Hospital between May 2019 and October 2020. The study was approved by the King Abdulaziz University-Research Ethics Committee, Jeddah, Saudi Arabia (approval number: 308-19; approval date: April 21, 2019) and was performed in accordance with the Declaration of Helsinki. The reporting of this study conforms to the STROBE guidelines. 21
Participants
Patients were randomly assigned to the IBD, H. pylori active infection (HP), or H. pylori active infection with co-existing IBD group (HP + IBD). A normal control (NC) group was recruited among patients who visited KAU hospital for routine medical checkups. The diagnosis of IBD was based on colonoscopic, histologic, biochemical, and radiologic findings. The diagnosis of current H. pylori infection was based on a positive urea breath test (UBT) result. Patients with IBD and co-existent dysplasia or colorectal cancer were excluded. In addition, patients who used acid inhibitors, bismuth compounds, or antibiotics within the previous 4 weeks before taking the UBT were excluded. All patients provided written informed consent, and all patient details have been de-identified.
Variables
Blood samples were collected after fasting, and sera were stored at −80°C until the measurement of OPG and bone alkaline phosphatase (BALP) levels. Fecal calprotectin (FC) levels were also measured. Patients in the HP and HP + IBD groups received sequential eradication therapy (rabeprazole 20 mg and amoxicillin 1000 mg for 5 days), followed by rabeprazole 20 mg, clarithromycin 500 mg, and tinidazole 500 mg for another 5 days. Each drug was given orally twice daily. 22 The sequential eradication therapy achieves higher eradication rates than the standard triple therapy. 23 Four weeks after the completion of eradication therapy, UBT was repeated, and patients with confirmed eradication underwent measurements of serum OPG, serum BALP, and FC levels.
Data sources/measurement
IBD location and behavior
The location of CD was classified as ileal, colonic, ileocolonic, or upper gastrointestinal tract. Its behavior was categorized as inflammatory (non-stenosing non-penetrating), stenosing, and penetrating.24,25 The location of UC was classified as pancolitis (up to the hepatic flexure or beyond), left-sided colitis (up to the splenic flexure), proctosigmoiditis, and proctitis.24,26
CD activity
Endoscopic activity was established by the simple endoscopic score for Crohn’s disease (SES-CD), in which ulcerations, ulcerated surfaces, inflamed surfaces, and stenosis were evaluated. The total score was graded as follows: 0–2, inactive (remitted); 3–6, mild; 7–15, moderate; and >15, severe.24,25 Clinical activity was evaluated using the Crohn’s Disease Activity Index (CDAI), in which scores of <150, 150–250, 251–350, and >350 indicated inactive, mild, moderate, and severe disease, respectively. 27
UC activity
UC endoscopic and clinical activity was evaluated using the full Mayo score, which has four components (stool frequency, rectal bleeding, endoscopic findings, and physician’s global assessment). The clinical or partial Mayo score uses the three non-invasive components of the full Mayo score and excludes the endoscopic subscore. The total score was interpreted as follows: 0–2, inactive (remitted); 3–5, mild; 6–10, moderate; and >10, severe. 28
UBT
Subjects were tested using the BreathTek® UBT (Otsuka America Pharmaceutical, Inc., Princeton, NJ, USA). Briefly, after an overnight fast, each subject breathed into a small collection bag, drank the Pranactin–Citric drug solution, and then breathed again into another collection bag. In cases of active infection, H. pylori degrades the solution into gases, which are measured in the exhaled breath. The 13C-UBT test is a safe, accurate, non-invasive, and simple procedure. 29
Measurement of OPG
Serum OPG content was measured using the commercially available ELISA kit based on biotin double-antibody sandwich technology (Reddot Biotech., Kelowna, British Columbia, Canada). On adding the standards or samples to wells coated with OPG monoclonal antibody, OPG binds with its antibody. Anti-OPG antibody labeled with biotin was then added to bind with streptavidin-conjugated horseradish peroxidase (HRP), which forms an immune complex. The unbound enzymes were removed. Substrates A and B were then added to obtain the blue color, which changes to yellow with effect of the acid. The concentration of OPG was read at 450 nm.
Measurement of BALP
Serum BALP content was measured using a commercially available ELISA kit based on a sandwich ELISA technique (MyBioSource, Inc. San Diego, CA, USA). Briefly, an anti-BALP antibody was pre-coated onto a microplate. BALP in standard and sample was bound by its antibody. A biotin-conjugated antibody specific for BALP was added, and then after washing, streptavidin-conjugated HRP was added. After washing, a substrate solution was added, and after color development was stopped, its intensity was measured using a microplate reader at 450 nm.
Measurement of FC
FC levels were measured using a commercially available ELISA kit (MyBioSource, Inc.). Briefly, the protocol featured is a single incubation step reaction based on the sandwich principle. After this incubation, the wells were filled with a substrate, and the developed color intensity, which was proportional to the amount of calprotectin in stool, was measured at 450 nm.
Outcome data
The outcome events were SES-CD, CDAI, Mayo score, serum OPG, serum BALP, and FC.
Bias
To minimize bias, the patients were randomly enrolled in the study, and the measurements were performed by blinded personnel.
Study size
The sample size was based on a significance level of P < 0.05 and a statistical power of 80% to avoid false-negative associations. The effect size and standard deviation were obtained from the scientific literature.
Statistical methods
Data were presented as the mean ± standard deviation. Spearman’s correlation was used to detect correlations between OPG levels in the IBD and HP + IBD groups with SES-CD or the Mayo score. Logistic regression analysis was used to control confounding factors. The sensitivity, specificity, and cutoff concentrations of the OPG test were calculated by generating receiver operating characteristic (ROC) curves. Discriminant analysis was performed to detect the ability of OPG levels to correctly identify patients who developed IBD. Analysis of variance with Tukey’s test as a post-hoc test was used for multiple comparisons. SPSS version 22 (IBM Corp., Armonk, NY, USA) was used for statistical analysis.
Results
Participants
As presented in the flow diagram, the numbers of individuals at each stage of the study for the IBD, HP, and HP + IBD groups, respectively, were as follows: potentially eligible, 110, 80, and 65; examined for eligibility, 95, 76, and 61; confirmed eligible, 87, 70, and 54; and included in the study, completed follow-up, and analyzed, 83, 68, and 52. The main reasons for non-participation were poor general condition and refusal. In addition, 50 subjects were included in the NC group.

Descriptive data
Table 1 presents the sex distribution, age, medications, duration of disease, location, and behavior data of the groups. There were no significant correlations between these variables and OPG levels.
Demographic data and clinical characteristics of all patient groups.

5-ASA, 5-amino salicylic acid; NC, normal control group; IBD, inflammatory bowel disease group; HP + IBD, Helicobacter pylori and inflammatory bowel disease group; CD, Crohn’s disease; UC, ulcerative colitis.
Data were expressed as frequencies and percentages, excluding age and duration of disease, which were expressed as the mean ± standard deviation.
Main results
SES-CD, CDAI, and Mayo score
Table 2 presents SES-CD and CDAI for patients with CD and the full Mayo score for patients with UC in the IBD and HP + IBD groups. SES-CD, CDAI, and Mayo score did not differ between the IBD and HP + IBD groups. There were significant large correlations between SES-CD and CDAI in patients with CD in both the IBD and HP + IBD groups (r = 0.864 and r = 0.829, respectively, both P < 0.001).
SES-CD and CDAI for patients with Crohn’s disease and the Mayo score for patients with ulcerative colitis in the IBD and HP + IBD groups.

Data were expressed as frequencies and percentages.
SES-CD, Simple endoscopic score for Crohn’s disease; CDAI, Crohn’s Disease Activity Index; IBD, inflammatory bowel disease; HP, Helicobacter pylori; SD, standard deviation.
Levels of serum OPG, serum BALP, and FC before H. pylori eradication therapy
OPG levels were significantly higher in the IBD and HP + IBD groups than in the NC and HP groups (all P < 0.001), whereas its levels did not differ between the IBD and HP + IBD groups or between the NC and HP groups. Meanwhile, serum BALP levels did not differ among the groups. In addition, FC levels were significantly higher in the IBD and HP + IBD groups than in the NC and HP groups (all P < 0.001). However, its levels did not differ between the IBD and HP + IBD groups or between the NC and HP groups (Table 3).
Levels of serum OPG, serum BALP, and FC before Helicobacter pylori eradication therapy.

OPG, osteoprotegerin; BALB, bone alkaline phosphatase; FC, fecal calprotectin; NC, normal control group; IBD, inflammatory bowel disease group; HP + IBD, Helicobacter pylori and inflammatory bowel disease group.
Data were expressed as the mean ± standard deviation. *P < 0.05 vs. NC and HP.
Serum OPG and BALP levels after H. pylori eradication therapy
The levels of OPG and BALP in the HP and HP + IBD groups did not differ between before and after eradication (Table 4).
Levels of serum OPG and BALP before and after Helicobacter pylori eradication therapy.

HP (B), Helicobacter pylori group before eradication therapy; HP (A), Helicobacter pylori group after eradication therapy; HP + IBD (B), HP + IBD, Helicobacter pylori and inflammatory bowel disease group before eradication therapy; HP + IBD (A), HP + IBD, Helicobacter pylori and inflammatory bowel disease group after eradication therapy.
Data are expressed as the mean ± standard deviation.
Other analyses
Relationships of serum OPG levels with SES-CD and the Mayo score
As presented in Table 5, Spearman’s correlation analysis revealed large correlations of serum OPG concentrations with SES-CD and the Mayo score. Moreover, the ROC curves (Figure 1) illustrated that the areas under the ROC curve (AUCs) for OPG were greater than 0.9 (P < 0.001) with high sensitivity and specificity. In addition, the discriminant analysis demonstrated that OPG levels could differentiate patients with CD or UC from control patients with eigenvalues exceeding 1.0 and canonical correlations exceeding 0.7. The sensitivity and specificity for OPG were equal to the values calculated from the ROC curves. The percentages of correctly classified cases for the original and cross-validated grouped cases for OPG were 96.4% and 95.9% for SES-CD and the Mayo score, respectively.
Values of Rho, AUC, cutoff, sensitivity (%), specificity (%), eigenvalue, and canonical correlations between serum osteoprotegerin levels and SES-CD and Mayo score in the IBD and HP + IBD groups.
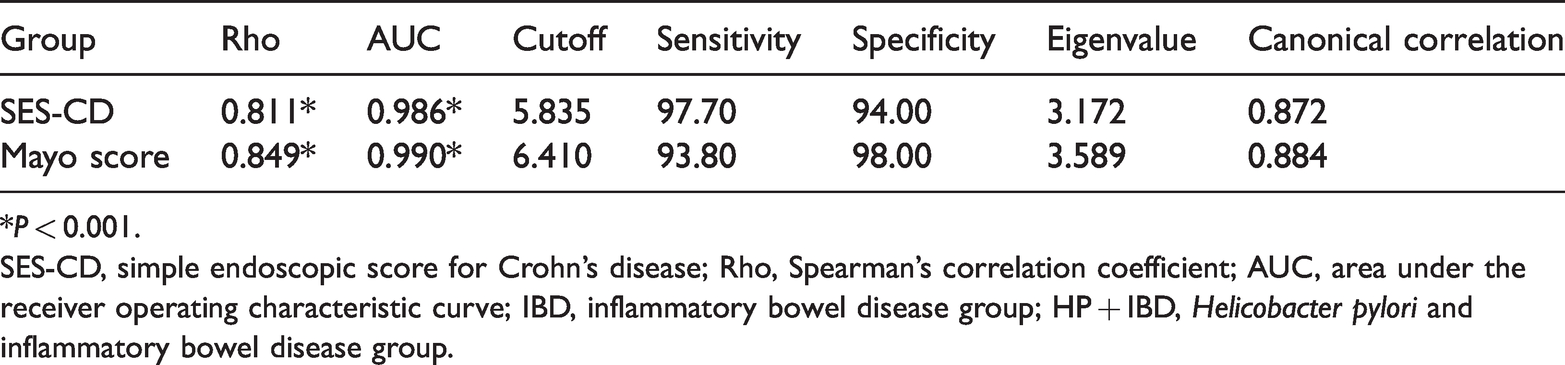
*P < 0.001.
SES-CD, simple endoscopic score for Crohn’s disease; Rho, Spearman’s correlation coefficient; AUC, area under the receiver operating characteristic curve; IBD, inflammatory bowel disease group; HP + IBD, Helicobacter pylori and inflammatory bowel disease group.
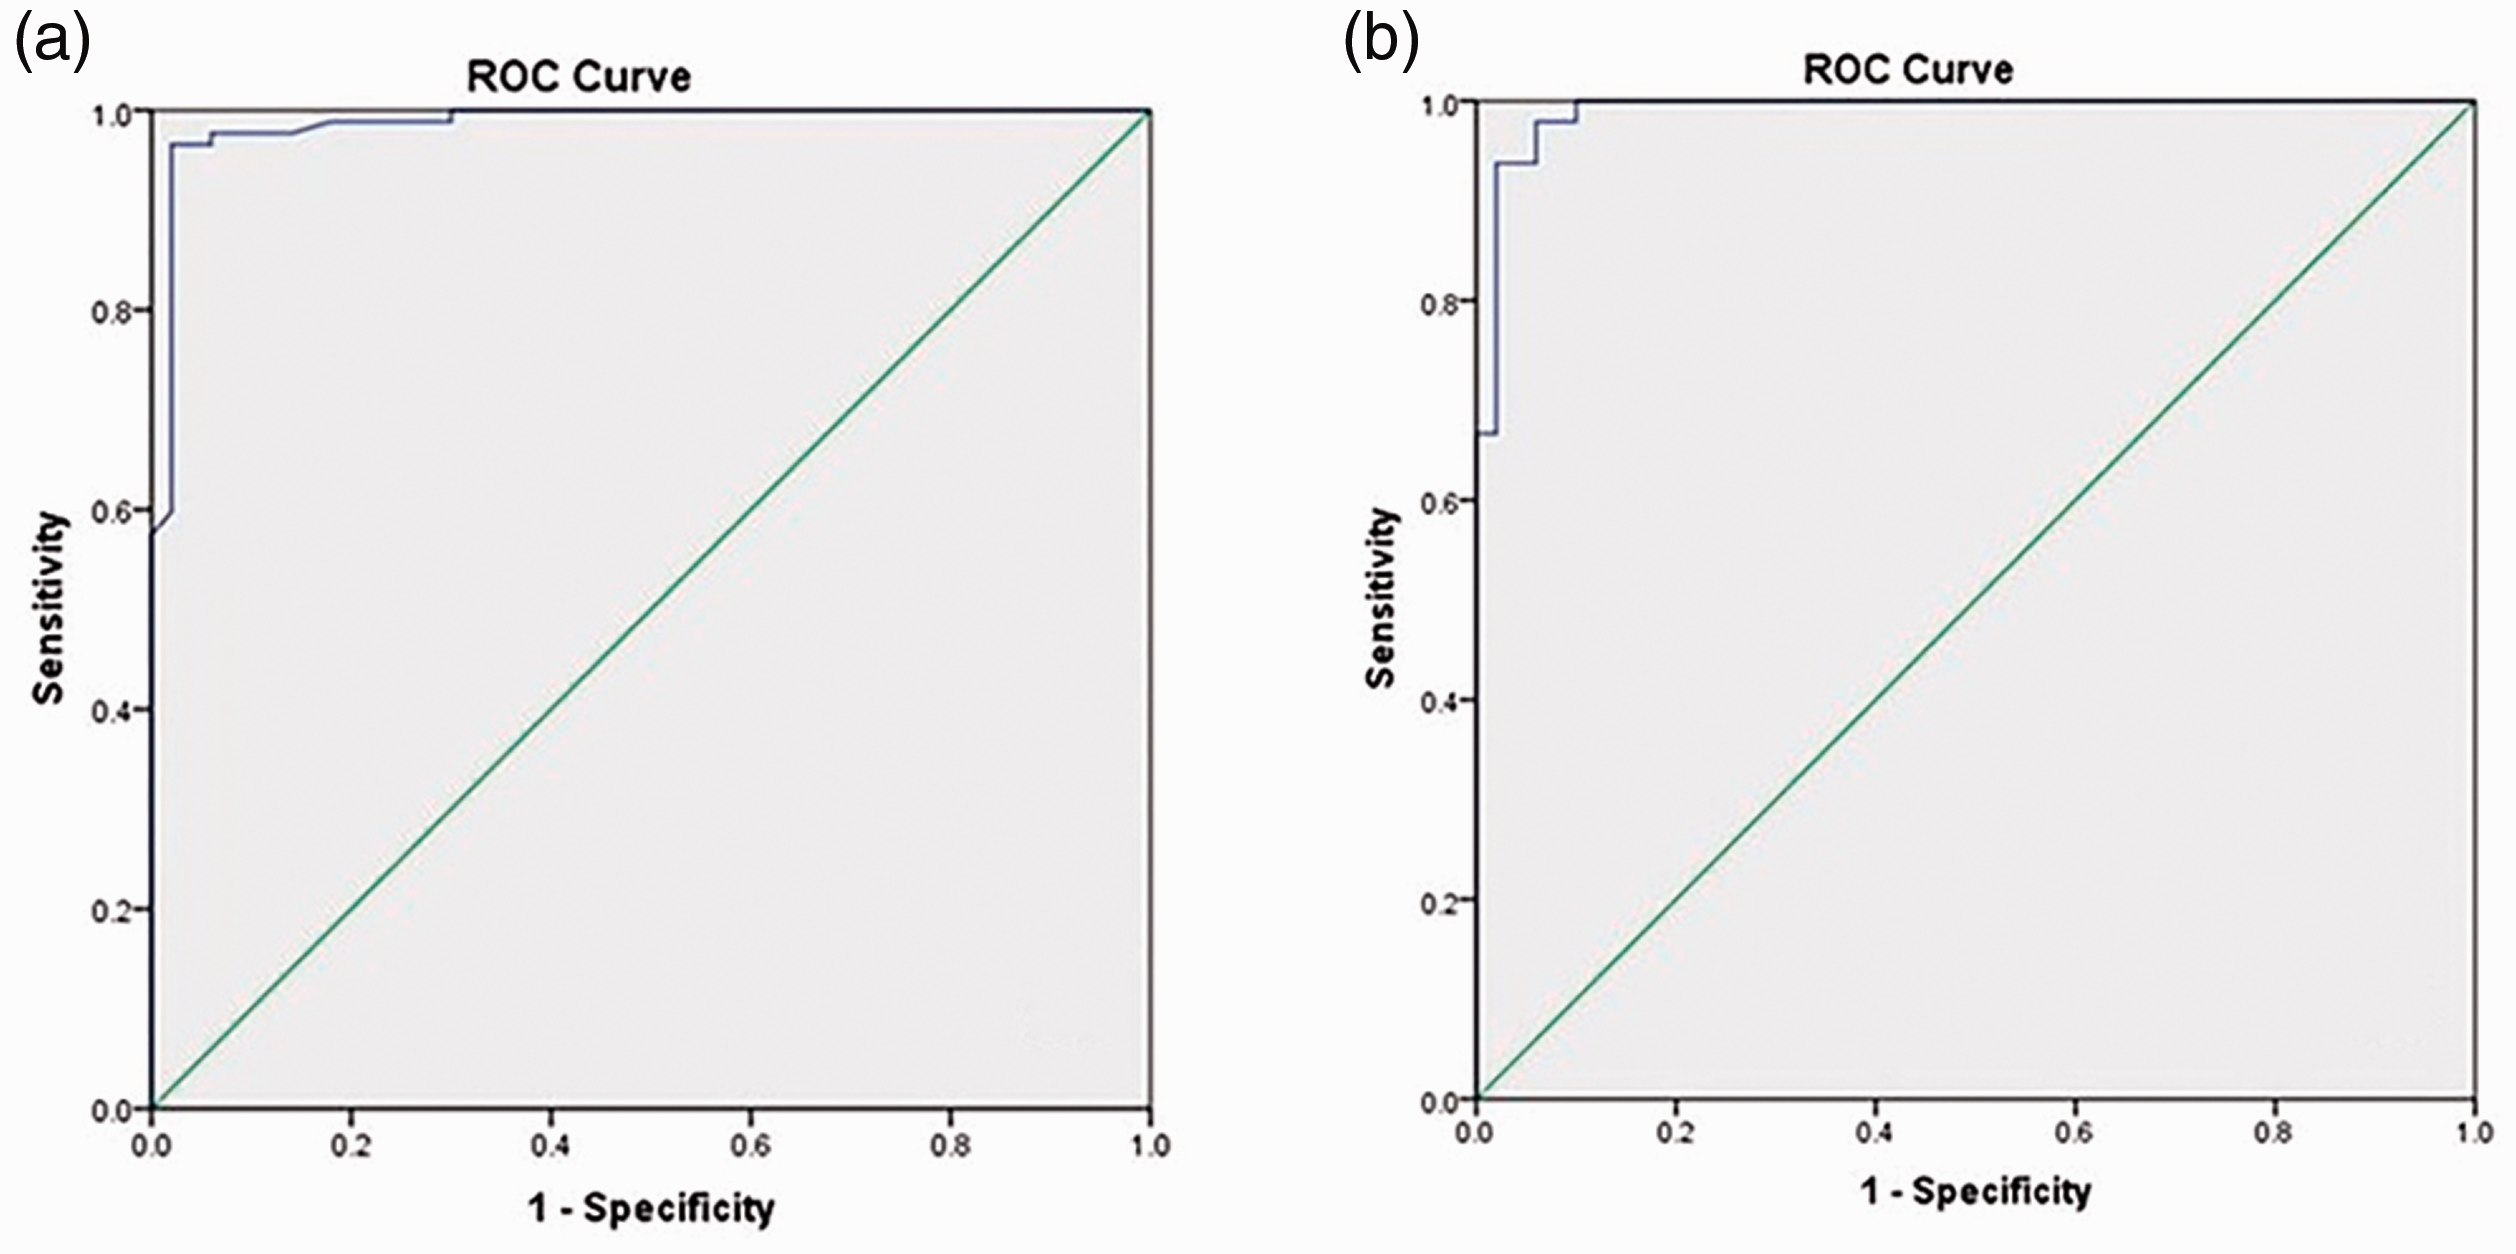
The receiver operating characteristic curves for osteoprotegerin detection of (a) Crohn’s disease according to simple endoscopic score for Crohn’s disease and (b) ulcerative colitis according to the Mayo score.
Discussion
Key results
Elevated serum OPG levels were detected in patients with H. pylori infection and concurrent (either active or quiescent) IBD compared with the findings in normal controls. ROC analysis revealed the high overall accuracy of the OPG test. The AUCs indicated the high accuracy of the test for discriminating patients with IBD from normal subjects. The OPG test revealed cutoff scores with high sensitivity and specificity. The eigenvalues exceeded 1, and the canonical correlation values were high.
Limitations
The limitations of the current study included the relatively small number of patients because of the low prevalence of concomitant H. pylori infection and IBD (9.6%–12.8%).30,31 In addition, the effect of sequential therapy on other IBD markers was not evaluated. Moreover, the OPG level was measured only once, and there was no follow-up of participants to detect any possible change of OPG levels over time.
Interpretation
The relationship between H. pylori infection and IBD represents crosstalk between the upper and lower gastrointestinal tract. The infection may shift the equilibrium between T helper 1 (Th1) and Th2 immune responses to the Th2 pattern. IBD is a Th1-related disease, and thus, H. pylori eradication may increase the Th1 pro-inflammatory cytokines, leading to the development of IBD. 32 H. pylori infection can protect against IBD; therefore, H. pylori eradication therapy should be given cautiously, especially for children and young adults. 33 By contrast, a retrospective case control study concluded that previous H. pylori eradication therapy was not associated with the onset of IBD. However, the researchers mentioned that “an increased risk of developing IBD may persist till up to 5 years after antibiotic treatment” and that “Further studies are warranted to address the question as to whether H. pylori eradication therapy may trigger IBD development in a specific subgroup of patients.” 31 In addition, another paper reported that a previous history of 7 days of triple therapy to eradicate H. pylori does not alter the disease activity of patients with IBD during a 2-month observation period. The 2-month duration is considered short given that the risk of IBD development after H. pylori eradication therapy may persist up to 5 years, as previously mentioned. In addition, the authors mentioned that careful observation after eradication therapy is necessary, especially for patients with active IBD who underwent eradication therapy”. 34 Systemic combined amoxicillin and metronidazole reduced the local inflammatory load and OPG levels in patients with localized periodontitis. 35 Thus, this study investigated the effect of sequential H. pylori eradication therapy on serum OPG levels in patients with H. pylori infection and co-existing inflammatory bowel disease.
In IBD, OPG levels are significantly correlated with those of inflammatory cytokines (e.g., TNF‐α); thus, OPG production is suggested to be stimulated by cytokines in the context of chronic inflammation. The levels of OPG were found to be higher in both the sera and cultured colonic biopsy supernatants of patients with CD than in controls. 36 Both serum and fecal OPG levels are increased in active CD, and these changes possibly arise from the inflamed gut. 37 In addition, OPG was found to stimulate cytokine production, and therefore, OPG is suggested to be a primary controller of inflammation in IBD. 38 Some studies found that in IBD, OPG activates gut inflammation by inducing immune cell activation, NF‐κB pathway activity, and cytokine production. Nevertheless, other studies illustrated that OPG plays a protective role by reducing immune cell activity. It was found that the OPG concentration is high in patients with IBD, and it is correlated with severity. OPG affects cell turnover, differentiation, survival, and death through extracellular pathways, which are associated with poor prognosis in IBD and several digestive carcinomas. Consequently, it was suggested that OPG could be an indicator that predicts the diagnosis of IBD and monitors the response to treatment. 39 OPG levels are significantly decreased after corticosteroid treatment in patients with IBD. 40 This high OPG level in IBD may indicate T-lymphocyte activation. 18
In agreement with previous reports, 26 the current study revealed that patients with CD and UC equally received 5-amino salicylic acid preparations and corticosteroids (approximately 90% and 58% of patients, respectively), whereas azathioprine and infliximab were more commonly used by patients with CD. Moreover, there was a strong correlation between SES-CD and CDAI. Previously, it was reported that SES-CD was largely correlated with CD clinical parameters. 25 In addition, there are significant correlations between endoscopic and clinical activity in both CD and UC. 28 By contrast, weaker correlations were detected between SES-CD and CDAI. 41 In the current study, elevated serum OPG levels were higher in patients H. pylori and concurrent (either active or quiescent) IBD, than in normal controls. The ROC analysis confirmed the high overall accuracy of the OPG test. The AUCs were high, indicating the ability of the test to discriminate patients with disease from normal subjects. The OPG test produced cutoff scores with high sensitivity and specificity. The eigenvalues exceeded 1, indicating the presence of many reliable components, 42 and the canonical correlation values were high for the effect size. 43 The increased OPG level cannot be attributed to H. pylori infection because it was reported that H. pylori-infected patients did not exhibit significant differences in serum OPG levels versus normal people. In postmenopausal women, H. pylori IgG seropositivity was not associated with bone loss, 44 and H. pylori infection did not appear to be a risk factor to osteoporosis. 45 In addition, in the elderly population, H. pylori infection was not associated with decreased bone mineral density, nor did it increase the predisposition to osteoporosis. 46
Meanwhile, BALP levels were normal in all groups. BALP is an indicator of osteoblastic activity, and it is used as an indicator of osteoporosis. 47 This finding indicates that the elevated levels of OPG in the IBD and HP + IBD groups were not attributable to osteoporosis. In this study, active H. pylori infection was treated using sequential therapy rather than the standard regimen because the H. pylori eradication rate using sequential therapy is nearly 90%. 48 In the HP and HP + IBD groups, the OPG levels did not differ significantly between before and after eradication. In addition, there were no significant differences in the levels of BALP in the HP and HP + IBD groups between before and after therapy, indicating that the elevation of OPG levels in these patients is not a marker of osteoporosis. It is worthy to mention that in the current study, the levels of OPG were significantly correlated with those of FC. FC has satisfactory sensitivity and specificity for identifying patients most likely to develop IBD secondary to IBS. 49 This confirms that the increased OPG levels in patients with both H. pylori (both active and eradicated) infection and concurrent IBD are most probably attributable to the development of IBD.
In conclusion, sequential eradication therapy did not affect serum OPG levels in patients with H. pylori infection and co-existing IBD. Thus, serum OPG elevation may be used as a marker of the development of IBD in patients of active or prior H. pylori infection. Further research with a long observation period and repeated measurements of OPG and other IBD markers at different time points is recommended.
Generalizability
Being a single-center study with a small number of patients, it is difficult to assume that the results can be generalized. However, the reader must individually judge whether these findings can be applied to his or her setting and population.
Footnotes
Acknowledgement
The participation of the medical students Abdulrahman Almajnuni, Abdulrahman Bukhari, Yousef Ramadan, Talal Alzahrani, and Muath Alharbi is gratefully acknowledged.
Declaration of conflicting interest
The authors declare that there is no conflict of interest.
Funding
The authors disclosed receipt of the following financial support for the research, authorship, and publication of this article: This project was funded by the Deanship of Scientific Research (DSR) at King Abdulaziz University (KAU), Jeddah under grant number (G: 103-828-1439). The authors, therefore, acknowledge with thanks DSR for technical and financial support.