
Abstract
Objective
To investigate the clinical value of the peak strain dispersion (PSD) in evaluating left ventricular (LV) systolic synchrony in patients with rheumatoid arthritis (RA).
Methods
One hundred eleven patients with RA were divided into two groups according to their disease duration: <5 years (Group I, n = 60) and ≥5 years (Group II, n = 51). The control group comprised 57 healthy subjects without RA. All three groups were examined by transthoracic two-dimensional echocardiography. Traditional parameters were measured by conventional echocardiography. Two-dimensional speckle tracking imaging was used to analyze the PSD and LV global longitudinal strain (LVGLS). Related ultrasound and blood test results were analyzed and compared.
Results
The PSD gradually increased in the order of the control group, Group I, and Group II, and the difference among the groups was statistically significant. The LVGLS gradually decreased in the order of the control group, Group I, and Group II, and the difference among the groups was statistically significant. The PSD was negatively correlated with the LVGLS.
Conclusions
LV systolic synchrony in patients with RA gradually decreases as the disease course progresses. The PSD can be used as a new reliable index to evaluate LV systolic synchrony.
Keywords
Introduction
Rheumatoid arthritis (RA), which is more common in women than men, is a chronic and systemic autoimmune disease characterized by inflammatory synovitis involving multiple organs such as the heart, joints, kidneys, and lungs. 1 The prevalence of cardiovascular disease is two to five times higher in patients with than without RA.2–5 Cardiovascular complications, the insidious onset of which makes early detection difficult, are a major cause of mortality in patients with RA; such complications include premature atherosclerosis, heart failure, or acute myocardial infarction.6,7 In contrast to patients who have cardiac insufficiency without RA, patients with both cardiac insufficiency and RA seldom have typical symptoms and signs such as obesity, hypertension, and myocardial ischemia; however, their mortality rate is significantly higher 1 year after the occurrence of cardiac insufficiency. Early detection of cardiac involvement in patients with RA is of great clinical significance.
Conventional echocardiography has limitations in detecting subclinical changes of left ventricular (LV) function in patients with RA. Some studies have evaluated LV function in patients with RA using tissue Doppler imaging (TDI).8,9 Although the assessment of myocardial deformation by TDI is considered a typical method for the evaluation of LV function, strain imaging by TDI is inferior to two-dimensional speckle tracking imaging (2D-STI) because of the angle-dependence. 10 Strain imaging by 2D-STI in patients with RA may contribute to early assessment of LV function. Although several studies have used 2D-STI to evaluate myocardial deformation in patients with different stages of RA,10–12 most of the studies showed a wide range of results. The clinical potential of dyssynchrony measurement is promising. Thus, the present study was conducted not only to determine the longitudinal deformation of the left ventricle but also to reveal the clinical value of LV myocardial synchrony in patients with RA who have a normal LV ejection fraction (LVEF). The peak strain dispersion (PSD) is a parameter that can accurately reflect dyssynchrony and has been used to evaluate early LV systolic dysfunction in several diseases, such as diabetes, 13 hypertension, 14 and hypertrophic cardiomyopathy. 15 Assessment of the PSD by 2D-STI has not been used to evaluate LV synchrony in patients with RA to date. Therefore, we used the PSD to detect subclinical pathologies in myocardial function in patients with RA. The purpose of this study was to investigate the clinical value of the PSD in evaluating LV systolic synchrony in patients with RA.
Materials and methods
Study population and control subjects
This study involved 130 patients with RA who had a normal LVEF in the First Affiliated Hospital of Wannan Medical College from May 2017 to May 2020. All patients were diagnosed by the same experienced rheumatologist and fulfilled the American College of Rheumatology/European League Against Rheumatism (ACR/EULAR) 2010 criteria. 16 The patients were divided into two groups according to their disease duration: Group I (disease duration of <5 years) and Group II (disease duration of ≥5 years). The patients in Group I comprised 60 patients (17 men and 43 women) with a mean age of 43.00 ± 6.71 years and incident age ranging from 34 to 55 years. The patients in Group II comprised 51 patients (12 men and 39 women) with a mean age of 44.64 ± 6.37 years and incident age ranging from 36 to 58 years. The control group comprised 57 healthy normal subjects (14 men and 43 women) matched for age, sex, heart rate, and body surface area (BSA); their mean age was 43.30 ± 6.03 years and their incident age ranged from 31 to 57 years.
The exclusion criteria for this study were cardiac involvement, including valve disease, congenital heart disease, cardiomyopathy, coronary heart disease, heart failure, and pericardial effusion; extracardiac diseases that could lead to cardiac dysfunction, such as hypertension, renal insufficiency, and diabetes; inability to cooperate during examinations; poor ultrasound transmission; and lack of satisfactory ultrasound images. We excluded two patients with congenital heart disease, six with valve disease, two with coronary heart disease, and nine with poor-quality images.
Ethics
The study protocol was approved by the ethics committee and institutional review board of the First Affiliated Hospital of Wannan Medical College [(2019) Ethics research No. 87], and written informed consent was obtained from each participant included in the study and his or her family members. All photographs in which a patient or other person is identifiable have been published with written permission from that person. All participants have consented to and placed no restrictions on the publication of their photographs.
Echocardiography
Transthoracic two-dimensional echocardiography was performed in all participants using a Philips EPIQ 7C ultrasonic system equipped with an S5-1 probe with a frequency of 3.5 to 5.0 MHz. The LV end-diastolic diameter (LVEDD), LV end-systolic diameter (LVESD), and LV posterior wall thickness (LVPWT) at the end of diastole were obtained from the long-axis view of the left ventricle. The LV end-diastolic volume (LVEDV) and LV end-systolic volume (LVESV) were estimated using Simpson’s biplane method of disks in the four- and two-chamber views. The LVEF and LV fractional shortening (LVFS) were also calculated by the biplane method of disks. The LV relative wall thickness (LVRWT) was calculated using the following formula: LVRWT = (2 × LVPWT) / LVEDD. The LV mass was calculated using the Devereux formula. 17 All patients’ sex, age, height, weight, blood pressure, and heart rate were recorded. BSA was calculated according to height and weight as follows: BSA (m2) = 0.0061 × height (cm) + 0.0128 × weight (kg) − 0.1529. The routine parameters of the left ventricle were standardized through the BSA, and the standardized parameters of the LVEDD index (LVEDDI), LVESD index (LVESDI), LVEDV index (LVEDVI), LVESV (LVESVI), and LV mass index (LVMI) were then obtained.
The collected two-dimensional dynamic images were transferred to a QLAB 10.5 workstation, and myocardial strain was analyzed in the interface of the aCMQ program. Three satisfactory plane views were selected, including apical two-, three-, and four-chamber views. The software automatically tracked the myocardial movement and outlined the endocardium. Unsatisfactory endocardium outlined by the software was then manually adjusted to wrap the region of interest around the whole myocardial layer. After clicking “calculate,” the software automatically provided the PSD and longitudinal strain in each view of the left ventricle (Figures 1, 3, and 5). After analyzing each view and clicking “accept,” the software automatically provided the LV global PSD, LV global longitudinal strain (LVGLS), and a color-coded 17-segment bullseye chart (Figures 2, 4, and 6).

2D-STI parameters of left ventricle in apical two-, three-, and four-chamber views in control group. (a) The aCMQ software automatically generated the endocardial border trace (arrow) in the apical two-chamber view and automatically provided the PSD (30.7 ms) and LV longitudinal strain (−25.8%) from the apical two-chamber view in the control group. (b) The aCMQ software automatically generated the endocardial border trace (arrow) in the apical three-chamber view and automatically provided the PSD (1.6 ms) and LV longitudinal strain (−22.4%) from the apical three-chamber view in the control group. (c) The aCMQ software automatically generated the endocardial border trace (arrow) in the apical four-chamber view and automatically provided the PSD (5.5 ms) and LV longitudinal strain (−31.1%) from the apical four-chamber view in the control group.

Bullseye diagram in control group. The aCMQ software automatically calculated the LVEDV, LVESV, LVEF, LVGLS (−26.4%), and LV global PSD (20.1 ms) and provided a color-coded 17-segment bullseye diagram in the control group

2D-STI parameters of left ventricle in apical two-, three-, and four-chamber views in Group I. (a) The aCMQ software automatically generated the endocardial border trace (arrow) in the apical two-chamber view and automatically provided the PSD (5.1 ms) and LV longitudinal strain (−24.3%) from the apical two-chamber view in Group I. (b) The aCMQ software automatically generated the endocardial border trace (arrow) in the apical three-chamber view and automatically provided the PSD (32 ms) and LV longitudinal strain (−20.3%) from the apical three-chamber view in Group I. (c) The aCMQ software automatically generated the endocardial border trace (arrow) in the apical four-chamber view and automatically provided the PSD (40.8 ms) and LV longitudinal strain (−22.8%) from the apical four-chamber view in Group I.2D-STI, two dimensional speckle tracking imaging; PSD, peak strain dispersion, LV, left ventricle; LA, left atrium; RV, right ventricle; RA, right atrium; AO, aorta.

Bullseye diagram in Group I. The aCMQ software automatically calculated the LVEDV, LVESV, LVEF, LVGLS (−22.5%), and LV global PSD (34.7 ms) and provided a color-coded 17-segment bullseye diagram in Group I.
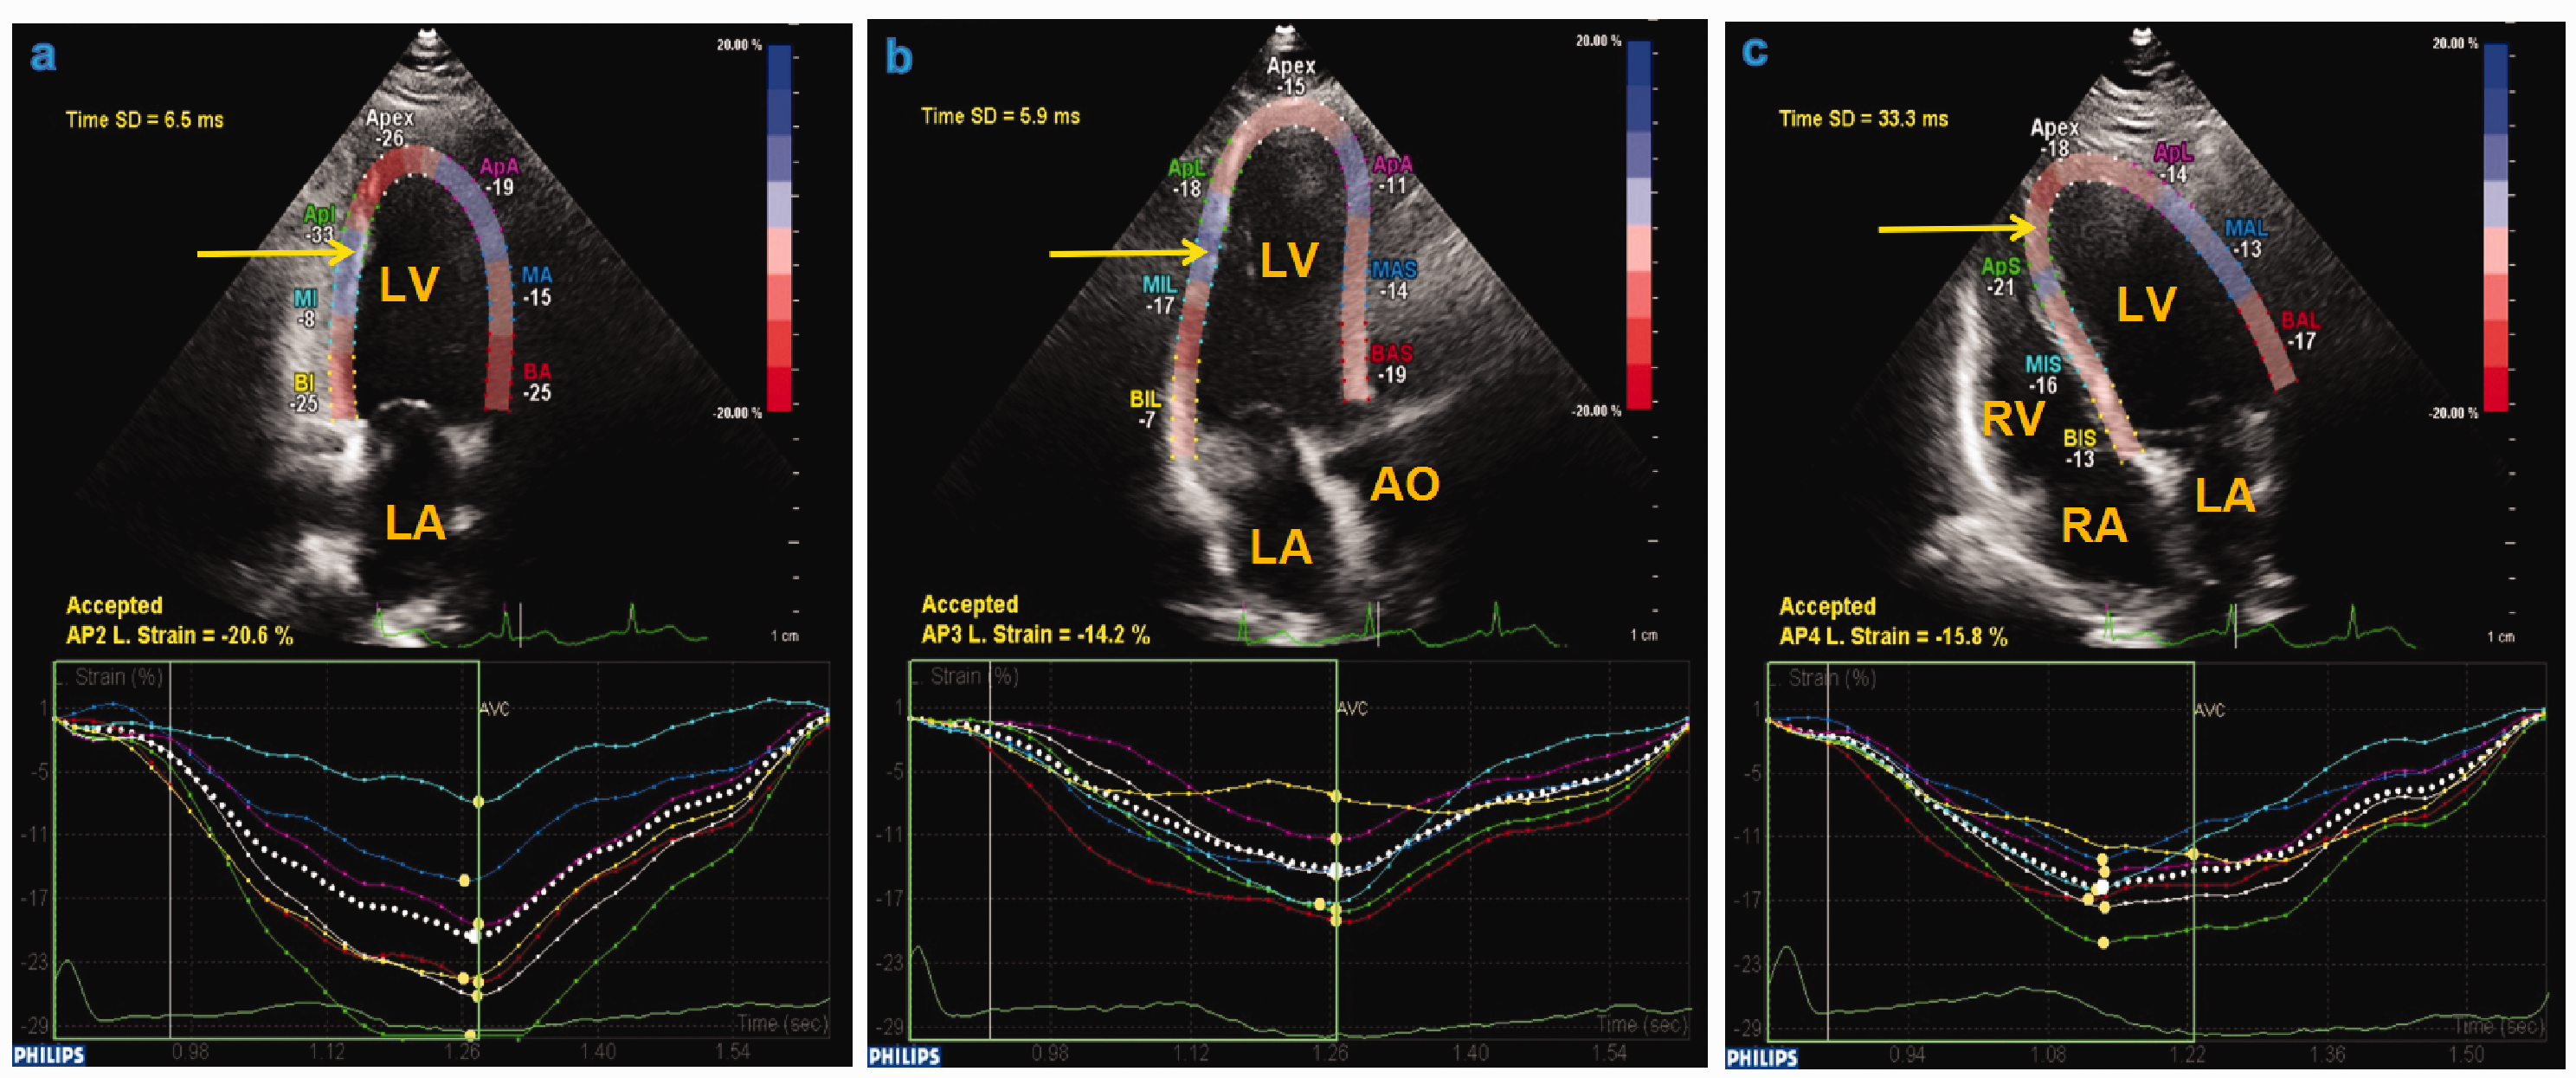
2D-STI parameters of left ventricle in apical two-, three-, and four-chamber views in Group II. (a) The aCMQ software automatically generated the endocardial border trace (arrow) in the apical two-chamber view and automatically provided the PSD (6.5 ms) and LV longitudinal strain (−20.6%) from the apical two-chamber view in Group II. (b) The aCMQ software automatically generated the endocardial border trace (arrow) in the apical three-chamber view and automatically provided the PSD (5.9 ms) and LV longitudinal strain (−14.2%) from the apical three-chamber view in Group II. (c) The aCMQ software automatically generated the endocardial border trace (arrow) in the apical four-chamber view and automatically provided the PSD (33.3 ms) and LV longitudinal strain (−15.8%) from the apical four-chamber view in Group II.

Bullseye diagram in Group II. The aCMQ software automatically calculated the LVEDV, LVESV, LVEF, LVGLS (−16.9%), and LV global PSD (41 ms), and provides a color-coded 17-segment bullseye diagram in Group II.
Thirty data sets were randomly selected to test the repeatability of PSD measurement within and among observers. The intraobserver consistency test was analyzed by the same operator at least 1 week apart with 2D-STI software, and another experienced operator analyzed the data of 30 patients without knowing the results of the former. The two sets of results were then compared to test the consistency between the observers.
Clinical and laboratory parameters
Laboratory parameters including C-reactive protein (CRP) level, erythrocyte sedimentation rate (ESR), rheumatoid factor (RF) level, and anti-cyclic citrullinated peptide (anti-CCP) level were obtained from all subjects after 12 hours of overnight fasting. An RF level of >20 IU/mL was considered positive, and an anti-CCP level of ≥25 U/mL was considered positive. We used the Health Assessment Questionnaire (HAQ) to assess functional impairment in patients with RA. The Disease Activity Score 28 (DAS28) was used to determine the disease activity in patients with RA.
Statistical analysis
IBM SPSS Statistics for Windows, Version 21.0 (IBM Corp., Armonk, NY, USA) was used for the statistical analysis. Continuous outcome variables are presented as mean ± standard deviation, and non-normally distributed variables are presented as median and interquartile range. For quantitative data with a normal distribution and homogeneous variance, the independent-samples t-test or one-way analysis of variance was used for comparison between or among groups. Otherwise, the Mann–Whitney U test or Kruskal–Wallis one-way analysis of variance was used for comparison between or among groups. The chi-square test or Fisher’s exact test was used to analyze categorical data. Pearson’s correlation analysis was applied to show the correlation between two sets of data. A Bland–Altman scatter plot was used to show the results of interobserver and intraobserver repeatability tests. A P value of <0.05 was considered significant.
Results
Comparison of general data among groups
There were no significant differences in the general data among the groups (Table 1).
Characteristics of all study participants.

Data are presented as mean ± standard deviation unless otherwise indicated.
BSA, body surface area; BMI, body mass index; HR, heart rate; HDL, high-density lipoprotein; LDL, low-density lipoprotein.
Comparison of clinical and laboratory parameters of RA among groups
Among the patients with RA, there were no significant differences in the DAS28, HAQ score, RF level, anti-CCP level, CRP level, or ESR between the groups. The disease duration was significantly longer in Group II than in Group I (P < 0.05). Among all subjects, the RF level, anti-CCP level, CRP level, and ESR were significantly higher in Groups I and II than in the control group (all P < 0.05) (Table 2).
Clinical and laboratory parameters.

Data are presented as mean ± standard deviation, median (interquartile range), or number of patients.
*Compared with control group, P < 0.05. #Compared with Group I, P < 0.05.
DAS28, Disease Activity Score 28; HAQ, Health Assessment Questionnaire; RF, rheumatoid factor; Anti-CCP, anti-cyclic citrullinated peptide; CRP, C-reactive protein; ESR, erythrocyte sedimentation rate.
Comparison of conventional echocardiographic parameters, PSD, and LVGLS among groups
The LVEDDI, LVESDI, LVEDVI, LVPWT, LVEF, and LVFS were not significantly different between the control group and Group I. The LVESVI, LVMI, LVRWT, and PSD were significantly higher and the LVGLS was significantly lower in Group I than in the control group (all P < 0.05). Compared with the control group and group I, there were no significant difference in The LVEF and LVFS were not significantly different between Group II and the control group or Group I. However, the LVEDDI, LVESDI, LVEDVI, LVESVI, LVPWT, LVMI, LVRWT, and PSD were significantly higher and the LVGLS was significantly lower in Group II than in the control group and Group I (all P < 0.05) (Table 3).
Echocardiographic analysis.
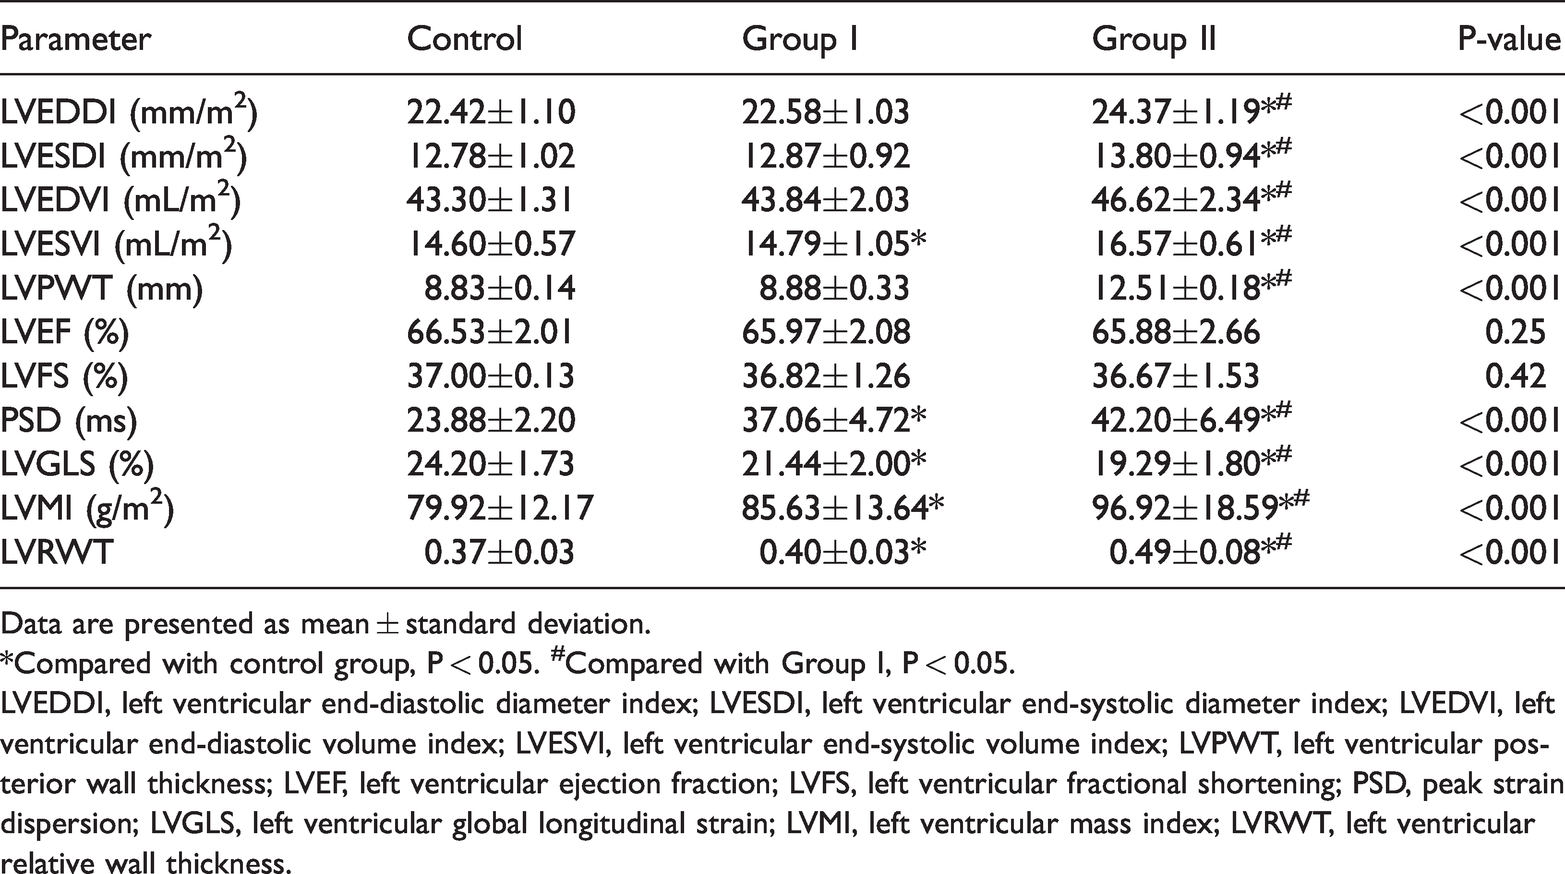
Data are presented as mean ± standard deviation.
*Compared with control group, P < 0.05. #Compared with Group I, P < 0.05.
LVEDDI, left ventricular end-diastolic diameter index; LVESDI, left ventricular end-systolic diameter index; LVEDVI, left ventricular end-diastolic volume index; LVESVI, left ventricular end-systolic volume index; LVPWT, left ventricular posterior wall thickness; LVEF, left ventricular ejection fraction; LVFS, left ventricular fractional shortening; PSD, peak strain dispersion; LVGLS, left ventricular global longitudinal strain; LVMI, left ventricular mass index; LVRWT, left ventricular relative wall thickness.
Correlation analysis
In all study subjects, a negative correlation was found between the PSD and LVGLS (r = −0.91, P < 0.01) (Figure 7). Among patients with RA, a positive correlation was found between the PSD and RA disease duration (r = 0.85, P < 0.01) and between the PSD and LV geometry characteristics, including the LVMI and LVRWT (r = 0.21 and 0.51, respectively; both P < 0.05). However, no significant correlation was found between the PSD and with any inflammatory markers, including the DAS28, HAQ, RF level, anti-CCP level, CRP level, and ESR (r = −0.07, −0.04, −0.04, −0.09, −0.05, and −0.11, respectively) (Table 4).

Linear correlation between PSD and absolute value of LVGLS.
Association of PSD with LV geometry and inflammation-related indexes in patients with rheumatoid arthritis

LVMI, left ventricular mass index; LVRWT, left ventricular relative wall thickness; DAS28, Disease Activity Score 28; HAQ, Health Assessment Questionnaire; RF, rheumatoid factor; Anti-CCP, anti-cyclic citrullinated peptide; CRP, C-reactive protein; ESR, erythrocyte sedimentation rate.
Repeatability analysis
Bland–Altman analysis of the PSD obtained by 2D-STI showed high interobserver and intraobserver consistency (Figure 8). The mean interobserver difference in the PSD was 0.003, and the confidence interval for the two standard deviations was −0.324 to 0.331. The Bland–Altman consistency analysis results showed that <5% of the interobserver differences in the PSD exceeded ±1.96 standard deviations, which conforms to the 95% confidence level. The mean intraobserver difference in the PSD was −0.027, and the confidence interval for the two standard deviations was −0.376 to 0.322. The Bland–Altman consistency analysis results showed that <5% of the intraobserver differences in the PSD exceeded ±1.96 standard deviations, which also conforms to the 95% confidence level.

Bland–Altman analysis of PSD obtained by 2D-STI. (a) Bland–Altman interobserver difference plot for PSD measured by 2D-STI. The mean interobserver difference in the PSD was 0.003, and the confidence interval for the two standard deviations was −0.324 to 0.331. The Bland–Altman consistency analysis results showed that <5% of the interobserver differences in the PSD exceeded ±1.96 standard deviations, which conforms to the 95% confidence level. Therefore, the PSD measured by 2D-STI was consistent between observers. (b) Bland–Altman intraobserver difference plot for PSD measured by 2D-STI. The mean intraobserver difference in the PSD was −0.027, and the confidence interval for the two standard deviations was −0.376 to 0.322. The Bland–Altman consistency analysis results showed that <5% of the intraobserver differences in the PSD exceeded ±1.96 standard deviations, which conforms to the 95% confidence level. Therefore, the PSD measured by 2D-STI was consistent within the same observer.
Discussion
RA is an independent risk factor for cardiovascular disease. 18 The risk of cardiovascular death is more than 50% higher in patients with than without RA. Long-term chronic inflammation and autoimmune disorders may be related to the pathogenesis of cardiovascular disease in patients with RA. 19 Early detection of cardiac involvement in patients with RA is of great clinical significance.20,21
Conventional echocardiography cannot detect the subtle changes in cardiovascular function that occur in patients with RA. 2D-STI is a practical technique with high accuracy, sensitivity, and specificity. Strain echocardiography has played a key role in the assessment of cardiac disease. 22 In 2D-STI, the image-processing algorithm allows for better evaluation of global and local myocardial deformation by tracking the speckle patterns in the two-dimensional plane.23,24 2D-STI is superior to strain imaging by TDI because of the independence of the Doppler angle of incidence. 25 LVGLS, which is mainly completed by the contraction of longitudinal myofibers (which have poor tolerance to ischemia and hypoxia) in the subendocardial myocardium, facilitates more sensitive detection of subclinical myocardial dysfunction than does the LVEF and deformations in other directions.26,27 Several studies have evaluated LV deformation in patients with RA through LVGLS obtained by 2D-STI.11,12,20,28 Although this technique allowed for detailed evaluation of the LV deformation in patients with RA, these studies showed a wide range of results because of variations in image quality, applied frame rates, strain values, and strain rates among them.
The PSD, calculated as the standard deviation of the time to peak strain of the 17 segments, is derived from 2D-STI and can be used to evaluate the synchronization of myocardial movement in the early stage of disease with high accuracy and efficiency.14,29,30 A smaller PSD is associated with better synchrony of myocardial movement. Several studies have accurately evaluated LV synchrony through utilization of the PSD. To the best of our knowledge, however, the PSD has not previously been used to evaluate LV function in patients with RA. Several parameters can be obtained from STI. The PSD is a parameter derived from 2D-STI; compared with other parameters of LV synchrony obtained from 2D-STI, such as the peak time and strain peak time, the PSD has higher accuracy because of the characteristics of triplane imaging in the same cardiac cycle. Additionally, although both the PSD and LVGLS are derived from 2D-STI, the PSD has higher diagnostic value because it provides different information regarding regional LV function. 31 One study revealed an increased PSD in patients with normal LVGLS. 32 Although real-time three-dimensional echocardiography can also be used to reflect LV synchrony, 2D-STI technology is more advantageous in evaluating LV synchrony in patients with RA because of its higher time and spatial resolution. We assessed the PSD by 2D-STI in our study and found remarkable differences between healthy people and patients with RA.
Our results indicate that the level of inflammation in patients with RA is significantly higher than that in healthy people but that the inflammation does not significantly increase as the disease course progresses. This may be mainly because although inflammatory factors reflect the current disease activity and inflammation level, they do not represent the cumulative damage during the duration of RA disease. Our results revealed that the LV geometry may be changed in patients with RA and aggravated with prolongation of the RA disease duration, which is in accordance with a previous study. 33 Because of the inflammation, vascular stiffness is increased in patients with RA; in addition, chronic inflammation may contribute to the development of LV hypertrophy.
To the best of our knowledge, this is the first evaluation of the PSD in patients with RA. Our findings indicate that LVGLS is robust in detecting subclinical LV systolic dysfunction in patients with RA, which is consistent with previous studies.11,12,20,28 The PSD is also a more sensitive index than conventional parameters. Our study showed that the LVMI, LVRWT, and RA disease duration were significantly related to the PSD among patients with RA. Cytokines and inflammation play an important role in the occurrence and development of RA. The subendocardial myocardial fibers predominantly contribute to the longitudinal myocardial function, and impairment of longitudinal myocardial function appears in the early stage of multiple diseases because of microvascular lesions in the subendocardial layer. Meanwhile, increased arterial stiffness is related to the changes in the LV geometry,34,35 which leads to impairment of the rhythm of myocardial electrical activity and decreased LV synchrony. As the disease continues to develop, the long-term effects of inflammatory factors and long-term hormone therapies, which have immunosuppressive effects, may induce endocardial damage and LV remodeling and thus lead to further deterioration of LV synchrony. 33 Hence, a long duration of RA disease, which represents longstanding inflammation, may increase patients’ cardiovascular risk; this is in accordance with previous studies.12,33 In addition, there may be no correlation between the PSD and inflammatory markers because the RA-induced inflammatory damage of RA accumulates over the duration of the disease and the inflammatory factors reflect the current level of disease activity. This study also indicated that the PSD as measured by 2D-STI has good reproducibility.
This study has some limitations. The results cannot be applied to patients with a history of cardiac involvement, and the low temporal and spatial resolution may have led to inaccurate results. Because of the relatively small sample size and single-center experience, our findings need to be confirmed in prospective multicenter studies with larger numbers of patients and longer follow-up. Moreover, we did not detect LV segment synchrony, atrioventricular synchrony, or interventricular synchrony in the patients with RA; thus, the evaluation of cardiac synchrony was not detailed enough and should be improved in future studies. We did not compare the PSD obtained by 2D-STI with the PSD obtained by three-dimensional STI, and we hope that this comparison will also be included in future studies. Finally, this study lacked follow-up data. In future research, we will assess the prognosis of patients with RA who have an impaired PSD.
Conclusions
Conventional echocardiographic assessment of the LVEF showed no significant difference between healthy controls and patients with RA. In patients with RA who have no clinical cardiovascular disease, the PSD is associated with the disease duration, LVMI, and LVRWT. The LV systolic synchrony in patients with RA is reduced in the early stage and gradually decreases as the disease duration increases. Subclinical LV systolic dysfunction is common in patients with RA and is affected by the duration of disease. Early detection of LV impairment in patients with RA is critical to ensure timely treatment and improvement of the prognosis.
Utilization of the PSD allows for early, accurate, and quantitative evaluation of LV systolic synchrony in patients with RA, facilitating early clinical intervention.
Footnotes
Declaration of conflicting interest
The authors declare that there is no conflict of interest.
Funding
The author(s) disclosed receipt of the following financial support for the research, authorship, and/or publication of this article: The present study was supported by funding from the Research Project on Application of Commonweal Technology in Anhui Province (grant no. 1704f0804048) and the Annual Scientific and Technological Projects of Wuhu City (grant no. 2020ms3-5).
Authors’ contributions
Xiang Ji performed the research, analyzed the data, and wrote the paper. Xia Zhang designed the study and performed the research. Huijun Feng performed the research and carried out additional analyses.