
Abstract
Objective
Cardiovascular disease is a major cause of death. This study evaluated the relationship between serum cystatin-c and coronary lesion severity in coronary artery disease (CAD) patients with a normal glomerular filtration rate.
Methods
Nine hundred and fifty-nine patients were retrospectively included and divided into non-CAD and CAD groups according to coronary angiography results. CAD patients were classified into three groups by Gensini score tertiles. Multivariable logistic regression was used to study the relationship between serum cystatin-c and coronary lesion severity.
Results
Serum cystatin-c levels were significantly higher in CAD patients than in non-CAD patients. Correlation analysis revealed significant correlations between serum cystatin-c levels with the Gensini score and the number of diseased vessels. The area under the receiver operating characteristic curve of serum cystatin-c was 0.544 and 0.555 for predicting a high Gensini score and three-vessel disease, respectively. Multivariate stepwise regression analysis demonstrated that the serum cystatin-c level was an independent predictor of a high Gensini score [odds ratio (OR) = 2.177, 95% confidence interval (CI) 1.140–3.930] and three-vessel disease (OR = 1.845, 95% CI 0.994–3.424) after adjusting for the conventional CAD risk factors.
Conclusions
Serum cystatin-c was elevated in CAD patients and may be an independent predictor of CAD severity.
Keywords
Introduction
Cardiovascular disease is a common illness and a leading cause of health burdens and death. Renal dysfunction is associated with morbidity and mortality in coronary artery disease (CAD) patients. Even mild renal insufficiency can increase the risk of major adverse cardiovascular events (MACEs) in CAD patients.1–3 Studies have shown that a reduced estimated glomerular filtration rate (eGFR) or increased serum creatinine level is an independent risk factor for MACEs.4–7
Cystatin-c (Cys-C) is produced by all nucleated cells and belongs to a member of the superfamily of cysteine proteinase inhibitors.8,9 Because of its low molecular weight, it is freely filtered by the glomeruli and almost completely reabsorbed and catabolized in the tubules without undergoing tubular secretion. As a novel sensitive marker of renal dysfunction, Cys-C is less influenced by age, sex, lean muscle mass, and weight compared with serum creatinine and eGFR.9–12 However, Cys-C is not regarded as a candidate marker of impaired kidney function. Recent studies have reported an association between Cys-C and various established cardiovascular risk factors and markers, the incidence of coronary events and heart failure, and the risk of cardiovascular death, particularly in the elderly.13–15 In the Prospective Epidemiological Study of Myocardial Infarction, Cys-C predicted the occurrence of the first coronary events in men aged 50 to 59 years old and displayed a strong relationship with CAD. 16
Although Cys-C has been studied in recent years, whether its level is an independent risk factor for CAD remains unclear. In addition, whether this association is because Cys-C is a better indicator of renal function or other factors besides glomerular filtration affect the concentration of this protein and are associated with cardiovascular risk is poorly understood. Moreover, few studies have analyzed the relationship between serum Cys-C levels and the severity of CAD, and in particular, using the well-recognized quantitative coronary scores in a large sample size. Therefore, this study explored the usefulness of serum Cys-C in predicting the severity of new-onset CAD assessed by the Gensini score and the number of diseased vessels among patients with a normal GFR.
Materials and methods
Ethical approval
The study complied with the Declaration of Helsinki and was approved by the hospital ethical review board (Shaanxi Province People’s Hospital and Center for Cardiovascular Diseases, China). Informed written consent was obtained from all patients included in this analysis, and all patient details were de-identified. The procedures in our study complied with relevant STROBE guidelines. 17
Patient enrolment
From October 2017 to June 2018, we retrospectively enrolled patients who had an abnormal electrocardiogram or angina-like chest symptoms. All subjects enrolled in this study underwent detailed clinical, hematologic, and angiographic examinations to assess their cardiac status. All patients underwent coronary angiography and then were divided into the CAD group (coronary stenosis ≥50%, n = 840) and the non-CAD group (coronary stenosis < 50%, n = 119) according to the coronary angiography results. 18 Patients with non-CAD, a prior myocardial infarction history, and an eGFR < 90 mL/minutes/1.73 m2 were excluded from our study. Age, gender, body mass index (BMI), smoking status, and concurrent basal diseases (including hypertension, diabetes mellitus, and prior stroke) were all recorded. BMI was calculated according to the following formula: BMI = body weight (kg)/body height 2 (m2).
Biochemical analysis
After overnight fasting, venous blood was collected before coronary artery angiography. Serum was stored at −80°C and used to analyze total cholesterol (TC), low-density lipoprotein cholesterol (LDL-c), high-density lipoprotein cholesterol (HDL-c), triglycerides (TG), uric acid (UA), and fasting plasma glucose (FPG). The serum high-sensitivity C-reactive protein (hs-CRP) assay was performed on the Modular platform (E 170 and Modular P; Roche Diagnostics, Basel, Switzerland). Cys-C was measured on a ProSpec nephelometric analyzer (Siemens Healthcare, Marburg, Germany). All assays were performed in accordance with the manufacturer’s instructions. Serum creatinine (SCr) (alkaline picrate Jaffe method) levels and blood urea nitrogen (BUN) levels were measured using a spectrophotometric method, 19 and the eGFR was estimated with the Cockcroft–Gault formula. 20
Coronary angiography and coronary Gensini score
Coronary angiography was performed for all patients according to standard Judkins techniques. Quantitative coronary angiography was performed by two experienced interventional cardiologists who were blinded to the clinical information. The Gensini score was used to evaluate the severity of atherosclerosis as described previously.21,22
Statistical analysis
SPSS Statistics for Windows, Version 17.0 (SPSS Inc., Chicago, IL, USA) was used for statistical analysis. Measurement data were presented as the mean ± standard deviation or median (inter-quartile range). Numeration data were presented as a constituent ratio. All continuous variables were tested for normal distribution and the homogeneity of variances. Statistically significant differences were tested by the chi-square test (for qualitative items), Student’s t-test for unpaired observations (for normally distributed quantitative items), Spearman’s rank correlation, Pearson’s correlation, and multivariate stepwise regression analysis. p < 0.05 was considered statistically significant. 21
Results
Characteristics of the study subjects
The characteristics of the study subjects are described in Table 1. The study population consisted of 959 patients (363 men and 596 women) aged 26 to 85 years (mean age 60.9 ± 9.9 years). All enrolled patients were classified into a non-CAD group (n = 119) and a CAD group (n = 840) according to the coronary angiography results. CAD patients were sub-grouped into a stable angina group (stable group, n = 479) and acute coronary syndrome (ACS) group (n = 361). The proportion of smokers (p = 0.003), diabetes mellitus patients (p = 0.001), and male patients (p = 0.001) in the CAD group was higher than that in the non-CAD group. Both the serum Cys-C level and Gensini score in CAD patients were significantly higher than those in the non-CAD group (p =0.027 and p < 0.001, respectively) (Figure 1, Table 1). However, there was no statistical significance between the CAD and non-CAD groups in age, hypertension, BMI, prior stroke, family history of CAD, FBG, HDL-c, UA, TC, TG, LDL-c, BUN, SCr, or eGFR. Furthermore, the proportion of men (p < 0.001), smokers (p < 0.001), and patients with hypertension (p = 0.002) was different between the stable group and the ACS group, and the ACS group showed a significantly higher Gensini score (p = 0.002).
Clinical data of the non-CAD group and CAD group.

ap value for the CAD group versus the non-CAD group.
bp value for the stable angina group versus the ACS group.
CAD, coronary artery disease; ACS, acute coronary syndrome; BMI, body mass index; FBG, fasting blood glucose; TC, total cholesterol; TG, triglycerides; HDL-c, high-density lipoprotein cholesterol; LDL-c, low-density lipoprotein cholesterol; Cys-C, cystatin-c; BUN, blood urea nitrogen; SCr, serum creatine; UA, uric acid; hs-CRP, high sensitivity C-reactive protein; eGFR, estimated glomerular filtration rate.

The levels of Cys-C in the non-CAD group (n = 119), stable group (n = 479), and ACS group (n = 361). The Student’s t-test was used to determine intergroup differences. The data are shown as the mean ± SD.
Cys-C in the CAD group classified according to Gensini score tertiles
Based on the Gensini score tertiles, CAD patients were divided into three groups: the low Gensini score [ < 19, n = 280 (33.2%)], intermediate Gensini score [19–35, n = 276 (32.3%)], and high Gensini score [>35, n = 284 (34.6%)] groups (Table 2). The proportion of smokers (p < 0.001), patients with hypertension (p = 0.002), and men (p < 0.001) in the high group was increased compared with that in the low and intermediate groups. Furthermore, patients with a higher Gensini score showed increased levels of BUN (p < 0.001), SCr (p < 0.001), UA (p = 0.001), hs-CRP (p = 0.006), and the number of diseased vessels (p < 0.001). More importantly, the serum Cys-C levels were significantly different among these three groups as assessed by trend analyses (p < 0.001) and comparison tests (p < 0.001) (Figure 2).
Baseline demographic, clinical, and laboratory characteristics based on the Gensini score tertiles.

ap value obtained from the analysis of variance, Kruskal–Wallis test, or chi-squared test.
bp value for the high Gensini score group versus the low and intermediate Gensini score groups.
CAD, coronary artery disease; BMI, body mass index; FBG, fasting blood glucose; TC, total cholesterol; TG, triglycerides; HDL-c, high-density lipoprotein cholesterol; LDL-c, low-density lipoprotein cholesterol; Cys-C, cystatin-c; BUN, blood urea nitrogen; SCr, serum creatine; UA, uric acid; hs-CRP, high sensitivity C-reactive protein; eGFR, estimated glomerular filtration rate.
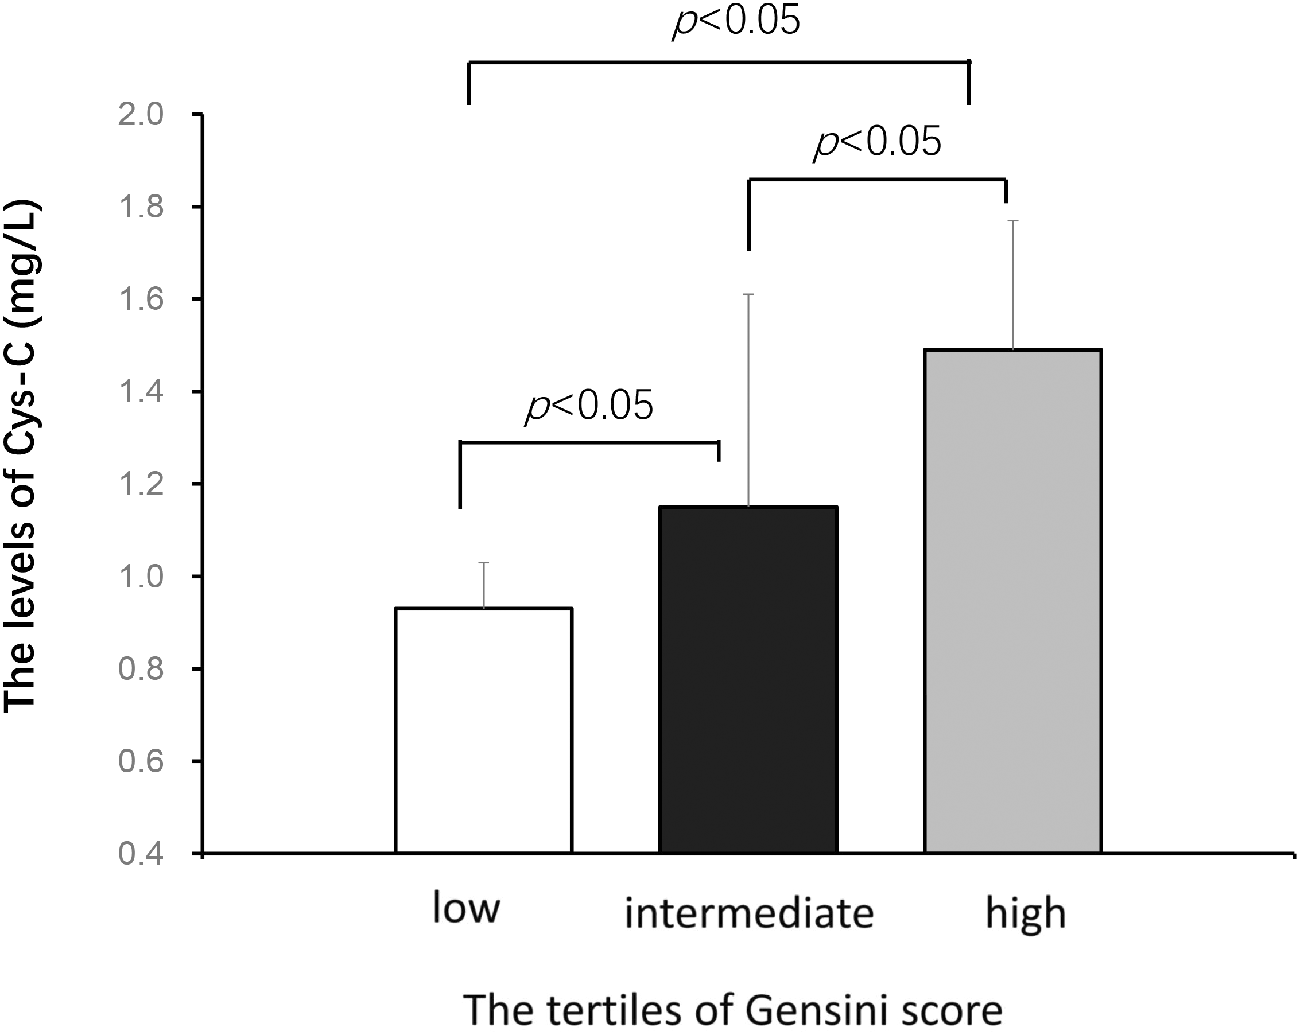
The serum levels of Cys-C in the low (n=280), intermediate (n=76), and high Gensini score (n=284) groups. The Student’s t-test was used to determine intergroup differences. The data are shown as the mean ± SD.
Correlation analysis of serum Cys-C and CAD severity
Spearman’s and Pearson’s correlation analyses were used to evaluate the correlations between the serum Cys-C levels, hs-CRP levels, Gensini score, and number of diseased vessels. There was a significant correlation between the serum Cys-C level and Gensini score in the CAD group (Pearson’s correlation: r = 0.157, p < 0.001; Spearman’s correlation: r = 0.139, p = 0.006). The same result was observed for the number of diseased vessels (Pearson’s correlation: r = 0.112, p = 0.001; Spearman’s correlation: r = 0.096, p = 0.030) and hs-CRP (Pearson’s correlation: r = 0.277, p = 0.003; Spearman’s correlation: r = 0.266, p = 0.008) with the serum Cys-C levels in CAD patients (Table 3). However, there was no correlation between serum Cys-C and hs-CRP or Gensini score in non-CAD patients (data not shown).
Correlation analysis of serum Cys-C with hs-CRP, vessel number, and Gensini Score.

Cys-C, cystatin-c; hs-CRP, high-sensitivity C-reactive protein.
The use of serum Cys-C for predicting severity
The area under the curve of the serum Cys-C level was 0.544 [95% confidence interval (CI) 0.503–0.586, p = 0.001] for predicting a high Gensini score (Figure 3a) and 0.555 (95% CI: 0.514–0.597, p = 0.009) for predicting three-vessel disease (Figure 3b). Additionally, multivariate stepwise regression analysis was performed to evaluate the independent factors of a high Gensini score or three-vessel disease. Variables included in the model were age, sex, BMI, smoking, hypertension, diabetes, and biochemical risk factors (TC, LDL-c, HDL-c, TG, hs-CRP, FPG, UA, eGFR, and Cys-C). As presented in Table 4, the results suggested that serum Cys-C [odds ratio (OR) = 2.177, 95% CI 1.140–3.930, p = 0.018], LDL-c (OR = 1.906, 95% CI 1.256–2.893, p = 0.002), and diabetes (OR = 1.542, 95% CI 1.077–2.206, p = 0.018) were independent predictors of a high Gensini score, and serum Cys-C (OR = 1.845, 95% CI 0.994–3.424, p =0.042), age (OR = 1.019, 95% CI 1.002–1.038, p = 0.032), and diabetes (OR =1.712, 95% CI 1.201–2.440, p = 0.024) were independent predictors of three-vessel disease.

The results of the receiver operating characteristic curve analysis. a. ROC curve analysis to assess the predictive power of serum Cys-C for the Gensini score. b. ROC curve analysis to determine the predictive power of three-vessel disease.
Multiple stepwise logistic regression analysis indicating factors independently associated with severity of CAD.

Variables included in the model were age, sex, BMI, smoking, hypertension, diabetes, and biochemical risk factors (TC, LDL-c, HDL-c, TG, hs-CRP, FPG, UA, eGFR, and Cys-C).
CAD, coronary artery disease; CI, confidence interval; BMI, body mass index; FBG, fasting blood glucose; TC, total cholesterol; TG, triglycerides; HDL-c, high-density lipoprotein cholesterol; LDL-c, low-density lipoprotein cholesterol; Cys-C, cystatin-c; UA, uric acid; hs-CRP, high sensitivity C-reactive protein; eGFR, estimated glomerular filtration rate.
Discussion
In this study, we assessed the level of Cys-C in a consecutive series of CAD patients with normal kidney function to avoid the effect of overt renal insufficiency on coronary atherosclerosis. We also evaluated whether Cys-C can identify individuals at a higher risk for CAD among patients belonging to a low-risk category according to their eGFR.
Our findings demonstrated that the serum levels of Cys-C in CAD patients were significantly higher than those in the non-CAD group. Previous studies have shown that enhanced Cys-C expression in CAD patients was due to increased inducible ischemia and regional myocardial ischemia, indicating that higher Cys-C concentrations reflect potentially damaging increased elastolysis activity.23,24 However, our results showed that there was no significant difference in serum Cys-C levels between the stable and ACS groups, which suggests that the relationship between elevated Cys-C levels and increased elastolysis activity needs to be further studied.
Additionally, when the associations between Cys-C and CAD severity were evaluated, we found a positive relationship between the serum levels of Cys-C with the Gensini score and the number of diseased vessels. More importantly, this correlation was independent of the eGFR, even after adjusting for established risk factors associated with cardiovascular disease and Cys-C. Similar results were also reported by Niccoli et al., 25 who demonstrated that the independent association between Cys-C and the number of narrowed vessels was superior to that of creatinine and eGFR. Together, these observations confirmed that Cys-C levels might not simply be an indicator of the association between renal dysfunction and an increased risk of CAD and thus may represent more than just a marker of renal function.
Numerous studies have validated the pivotal role of inflammation in the pathogenesis of atherosclerosis.10,26,27 In our study, we found a significant association between Cys-C and the typical inflammatory factor CRP. Similar results were also found by the Heart and Soul Study, in which the data from 990 patients with CAD indicated a significant association between Cys-C and CRP. 28 Thus, the main factor underlying the close relationship between Cys-C and CAD might be inflammation. Several studies have proposed that the imbalance in cysteine protease and its inhibitor may increase the degradation of the extracellular matrix and migration of monocytes, macrophages, and vascular smooth muscle cells into the intima, leading to the development of atherosclerosis.28–30 However, the Cys-C levels did not show an acute phase response in ACS patients in our study, indicating that elevated Cys-C levels only suggested more chronic inflammation levels instead of being a predictive factor for acute events. Furthermore, a previous experimental study confirmed that the absence of the protease inhibitor Cys-C in inflammatory cells resulted in a larger plaque area and/or promoted atherosclerosis in an atherosclerotic mouse model.30,31 This is in contrast to our results showing that elevated Cys-C is associated with the severity of CAD. A possible explanation is that there is a negative feedback loop in the regulation of Cys-C to counteract the increased elastolysis activity. Furthermore, a renal mechanism might be another potential link between increased Cys-C and CAD. Serum Cys-C is a sensitive indicator of early renal disease, which cannot be detected by measuring the eGFR. Therefore, assessing Cys-C levels may help to identify individuals who are at an increased risk for the development of CAD among patients with a normal creatinine-based eGFR.
Our study had several limitations. First, it was a retrospective study in nature, and residual confounding effects existed. Second, we did not record the status of medication, which may affect the levels of Cys-C. 32 Third, the relationship between Cys-C and other parameters, such as troponin and urinary protein, were not comprehensively analyzed in our study. Despite these limitations, our study provided important data on the relationship between Cys-C and the severity of CAD in patients with normal kidney function.
Conclusions
Our findings demonstrate that Cys-C was elevated in CAD patients and significantly associated with the severity of CAD in those with normal kidney function, suggesting that Cys-C may be an independent predictor of the severity of CAD. Further research is warranted to clarify the pathophysiologic mechanisms responsible for this association.