
Abstract
Objective
To explore specific flora in mouse models of non-alcoholic steatohepatitis (NASH) to improve NASH diagnostic protocols.
Methods
Sixty mice were divided into normal diet (ND, 20 mice) and high-fat/high-sugar diet (HFSD) groups (40 mice). After 8 weeks of feeding, 10 mice in the ND group and 20 mice in the HFSD group were sacrificed to create the short-term ND and non-alcoholic fatty liver (NAFL) groups, respectively. After 16 weeks of feeding, the remaining mice were sacrificed to create the long-term ND and NASH groups, respectively. We then examined fecal flora, serum biochemical indices, and lipopolysaccharide and tumor necrosis factor-α levels and analyzed liver tissue.
Results
The relative abundance of Lactobacillus, Desulfovibrio, Ruminiclostridium 9, and Turicibacter differed between NASH and NAFL mice, and the areas under the receiver operating characteristic curve of the four genera for diagnosing NASH were 0.705, 0.734, 0.737, and 0.937. The non-alcoholic fatty liver disease activity score was positively correlated with the relative abundance of Desulfovibrio (r = 0.353), Ruminiclostridium 9 (r = 0.431), and Turicibacter (r = 0.688).
Conclusions
The relative abundance of Lactobacillus, Desulfovibrio, Ruminiclostridium, and Turicibacter may help distinguish NASH from NAFL.
Keywords
Introduction
Non-alcoholic fatty liver disease (NAFLD) affects more than 30% of people in Western societies, and its prevalence in obese patients is as high as 75%.1–3 Non-alcoholic fatty live (NAFL) and non-alcoholic steatohepatitis (NASH) are different forms of NAFLD, and they can be distinguished via histological examination of the liver. 4 In total, 10% to 20% of patients with NAFL will progress to NASH, and one-third of patients with NASH will progress to liver cirrhosis, a major risk factor for the development of hepatocellular carcinoma, within 5 to 10 years.5,6 Thus, early diagnosis of NASH is critical to allow interventions that may limit progression. However, many limitations exist in current NASH diagnostic protocols. The diagnosis of NASH usually relies on histologic liver examination, requiring liver biopsy, which is not well accepted by patients because of its invasive nature and corresponding risk. Less invasive methods of NASH diagnosis have not been developed or verified compared with biopsy diagnoses.
The intestinal flora comprises the gastrointestinal symbionts of the host, and it plays critical roles in host energy metabolism. 7 Studies on the relationship between the intestinal flora and NAFLD provides a framework that could be used to diagnose NASH using less invasive methods. Clinical studies revealed that the proportion of small intestine bacterial overgrowth in patients NAFLD is significantly higher than that of healthy people. 8 Additionally, regulation of the intestinal flora using probiotics, prebiotics, and antibiotics can lead to improvements of both NAFL and NASH9–11 in patients. However, few studies have explored the intestinal flora at the genus level to understand the role of these bacteria in the pathogenesis of NAFLD or to distinguish NASH from NAFL.
In our study, we investigated which bacteria are closely associated with NAFL and NASH in the intestinal flora of mice at the genus level. We then examined which specific bacteria have potential diagnostic value for differentiating NASH from NAFL.
Materials and methods
Experimental animal models
Sixty male specific-pathogen-free C57BL/6J mice (8 weeks old; weight, 20 ± 2 g) were purchased from Weishang Lituo Technology Co., LTD (Beijing, China). The mice were housed in a controlled environment at a temperature of 22 ± 2°C, relative humidity of 50% to 60%, and a 12-hour/12-hour light/dark cycle. We used independent ventilation cages, and mice were housed five per cage. All experiments were conducted in accordance with the National Institutes of Health guidelines for the care and use of laboratory animals.
Experiment group protocols
After 2 weeks of adaptation to the new environment, mice were randomly divided into two groups using a random number table. Twenty mice were assigned to the normal diet (ND) group, which received a standard chow diet (fat provided 10% of total energy) and pure water. The standard chow diet was purchased from Jiangsu Synergetic Pharmaceutical Bio-engineering Co., LTD (Jiangsu, China). Forty mice were assigned to the high-fat/high-sugar diet (HFSD) group, which received high-fat chow (fat provided 42% energy) and “sugary” drinks (each liter of water contained 18.9 g of sucrose and 23.1 g of fructose). The high-fat chow (formula TP26300) was purchased from Nantong Teluofei Feed Technology Co., LTD (Jiangsu, China). Both groups of mice had ad libitum access to food and water. After 8 weeks of feeding, 10 mice in the ND group and 20 mice in the HSDS group were sacrificed to create the short-term ND (STND) and NAFL groups, respectively. After 16 weeks of feeding, the remaining mice were sacrificed to create the long-term ND (LTND) and NASH groups, respectively. Fresh blood and fecal samples were collected prior to mouse sacrifice, at which point liver tissue was collected.
Sample collection
Metabolic cages were used to collect fresh feces. The mice were overnight fasted before blood samples were collected via posterior orbital venous plexus puncture. After collecting blood samples, mice were sacrificed using carbon dioxide. Mouse livers were then removed and fixed for 24 hours in 4% paraformaldehyde for further histological examination.
Histological examination of the liver
Pathological sections of mouse liver were examined by an experienced pathologist who was blinded to the research, and slides were stained with hematoxylin–eosin (HE) and picrosirius red. Microscopic images were acquired using a Nikon Eclipse E100 microscope system (Nikon, Tokyo, Japan). NAFLD was diagnosed by the presence of fatty hepatocytes occupying more than 5% of the hepatic parenchyma. 12 NAFLD was further classified as NAFL or NASH according to the Matteoni classification system 13 and the NAFLD activity score (NAS). 14 The Matteoni classification method includes the following disease states: type 1, simple steatosis; type 2, steatosis and lobular inflammation; type 3, steatosis and ballooning degeneration of hepatocyte; and type 4, type 3 plus either Mallory hyaline or fibrosis. Matteoni types 1 and 2 were diagnosed as NAFL, and types 3 and 4 were diagnosed as NASH. The NAS scoring criteria are presented in Table 1.
NAFLD Activity Score.

NAFLD, non-alcoholic fatty liver disease activity score; NASH, non-alcoholic steatohepatitis.
Blood analysis
Serum total cholesterol (TC), triglyceride (TG), high-density lipoprotein cholesterol (HDL-C), low-density lipoprotein cholesterol (LDL-C), alanine aminotransferase (ALT), aspartate aminotransferase (AST), and fasting blood glucose (FBG) levels in mice were detected using a commercial kit (Nanjing Jiancheng Institute of Biological Engineering, Nanjing. China). Serum tumor necrosis factor-α (TNF-α) and lipopolysaccharide (LPS) levels were detected using an ELISA kit (Abbkine, Wuhan, China). Both analyses were conducted according to the manufacturers’ instructions.
Fecal DNA extraction and high-throughput sequencing
DNA extraction from feces was performed using a QIAamp Fast DNA Stool Mini Kit (QIAGEN, Hilden, Germany) according to the manufacturer’s instructions. The V3-4 hypervariable region of the bacterial 16S rRNA gene was amplified using the primers 338F (
Data analyses
Qiime and vsearch software were used to conduct bioinformatics statistical analysis. Sequences were clustered into operational taxonomic units (OTUs) at a similarity level of 97%. 16 Based on the OUT results, mothur was used to generate rarefaction curves and calculate/richness and diversity indices. The Ribosomal Database Project classifier tool was used to classify all sequences into taxonomic groups (i.e., phylum, class, order, family, genus, species). 17
Data are presented as the mean ± SD, and SPSS software version 19.0 (IBM, Armonk, NY, USA) was used to analyze the data. A two-tailed Student’s t-test was used for statistical analysis to compare differences between two groups of normally distributed data. ANOVA was performed to compare data from multiple groups that were normally distributed and that had homogenous variance. For non-normally distributed or homogenous data, the Kruskal–Wallis test and Tamhane’s T2 test were used to compare multiple groups of data. Receiver operating characteristic (ROC) curve analysis was conducted using SPSS. Correlation analysis was performed using Spearman’s correlation. P < 0.05 was considered statistically significant.
Results
Establishment of NAFL/NASH mouse models using a high fat/high sugar diet
After 8 and 16 weeks of feeding, HE staining of pathological sections from the ND group revealed a clear hepatic lobule structure with an orderly arrangement of liver plates and no steatosis or hepatocyte damage. Picrosirius red staining disclosed no obvious collagenous fiber hyperplasia (STND-1, STND-2, LTND-1, and LTND-2, Figure 1). After 8 weeks, HE staining of pathological sections from the HFSD group revealed hepatocyte steatosis, vacuoles of different sizes in the cytoplasm, hepatocyte edema, and lightly stained and loose cytoplasm. However, picrosirius red staining revealed no obvious collagenous fiber hyperplasia, as observed in the ND group (NAFL-1 and NAFL-2, Figure 1). After 16 weeks, HE staining of pathological sections from the HFSD group uncovered extensive hepatocyte steatosis, scattered neutrophils infiltrating small foci, and ballooning degeneration of some hepatocytes. In this group, picrosirius red staining revealed local collagenous fiber hyperplasia around the portal tracts and hepatic sinusoids (NASH-1 and NASH-2, Figure 1). After 8 weeks, the pathological features of the livers of 13 mice in the HFSD group conformed to type 1 of the Matteoni classification, and the remaining seven mice were classified into type 2. After 16 weeks, the pathological features of the livers of 15 mice in the HFSD group conformed to type 3 of the Matteoni classification, and the remaining five mice conformed to type 4. According to the Matteoni classification, the HFSD group developed NAFL within 8 weeks and progressed to NASH after another 8 weeks. Furthermore, we compared the NAS between the NAFL and NASH groups. NAS in the NAFL group was 1.90 ± 0.85, versus 5.33 ± 1.08 in the NASH group (P < 0.01).

Microscopic assessment of liver histology. Mice from the STND, LTND, NAFL, and NASH groups are presented. Two representative photographs of mice stained with HE and picrosirius red are presented. In the NAFL group, black arrows point to vacuoles in the cytoplasm, and yellow arrows identify lightly stained and loose cytoplasm. In the NASH group, green arrows denote vacuoles in the cytoplasm, and the red arrow identifies scattered neutrophil infiltrate. The black arrow in the HE-stained image reveals ballooning degeneration of a hepatocyte, and the black arrow in the picrosirius red-stained image identifies local collagenous fiber hyperplasia around the portal tracts and hepatic sinusoids.
Variation in serum biochemical indexes and LPS and TNF-α levels in mouse models of NAFL/NASH
Serum TG, LDL-C, and AST levels were higher in the NAFL and NASH groups than in the STND and LTND group (all P < 0.05). Serum ALT and TC levels were also significantly higher in the NAFL group than in the STND group and significantly higher in the NASH group than in the LTND group (all P < 0.05). Additionally, serum FBG levels were significantly higher in the NASH group than in the STND and LTND groups (both P < 0.05). These data are summarized in Table 2 and Figure 2a–g.
Variations of serum biochemical indices, LPS, and TNF-α.

Note: aP < 0.05, versus STND group; bP < 0.05, versus LTND group; cP < 0.05, versus NAFL group; dP < 0.05, versus NASH group.
TC, total cholesterol; TG, triglyceride; HDL-C, high-density lipoprotein cholesterol; LDLC, low-density lipoprotein cholesterol; ALT, alanine aminotransferase; AST, aspartate aminotransferase; FBG, fasting blood glucose; LPS, lipopolysaccharide; TNF-α, tumor necrosis factor-α; STND, short-term normal diet; LTND, long-term normal diet; NAFL, non-alcoholic fatty liver; NASH, non-alcoholic steatohepatitis.

a) Serum TC, b) TG, c) HDL-C, d) LDL-C, e) ALT, f) AST, g) FBG, h) LPS, and i) TNF-α levels of mice in the STND, LTND, NAFL, and NASH groups. Data represent the mean ± SD of each group. aP < 0.05, versus STND group; bP < 0.05, versus LTND group; cP < 0.05, versus NAFL group; dP < 0.05, versus NASH group.
We also found that serum LPS levels were significantly higher in the NAFL group than in the STND group and significantly higher in the NASH group than in the LTND group (both P < 0.05). Within the NAFLD group, serum LPS levels were higher in the NASH group than in the NAFL group (P < 0.05). However, TNF-α levels were indistinguishable between the groups (Table 2, Figure 2h–i).
Abundance and diversity of fecal flora in NAFLD mouse models
In total, 2,946,996 high-quality sequences were obtained from the fecal samples with a mean of 50,810 ± 30,473 sequences per sample (range, 20,129–192,272). These sequences clustered into 1500 OTUs, of which 1459 OTUs were assigned using the Greengenes database. Only 383 OTUs (26.25%) were shared by the four groups (Figure 3a). The NAFL and NASH groups accounted for 164 and 44 unique OTUs, respectively.
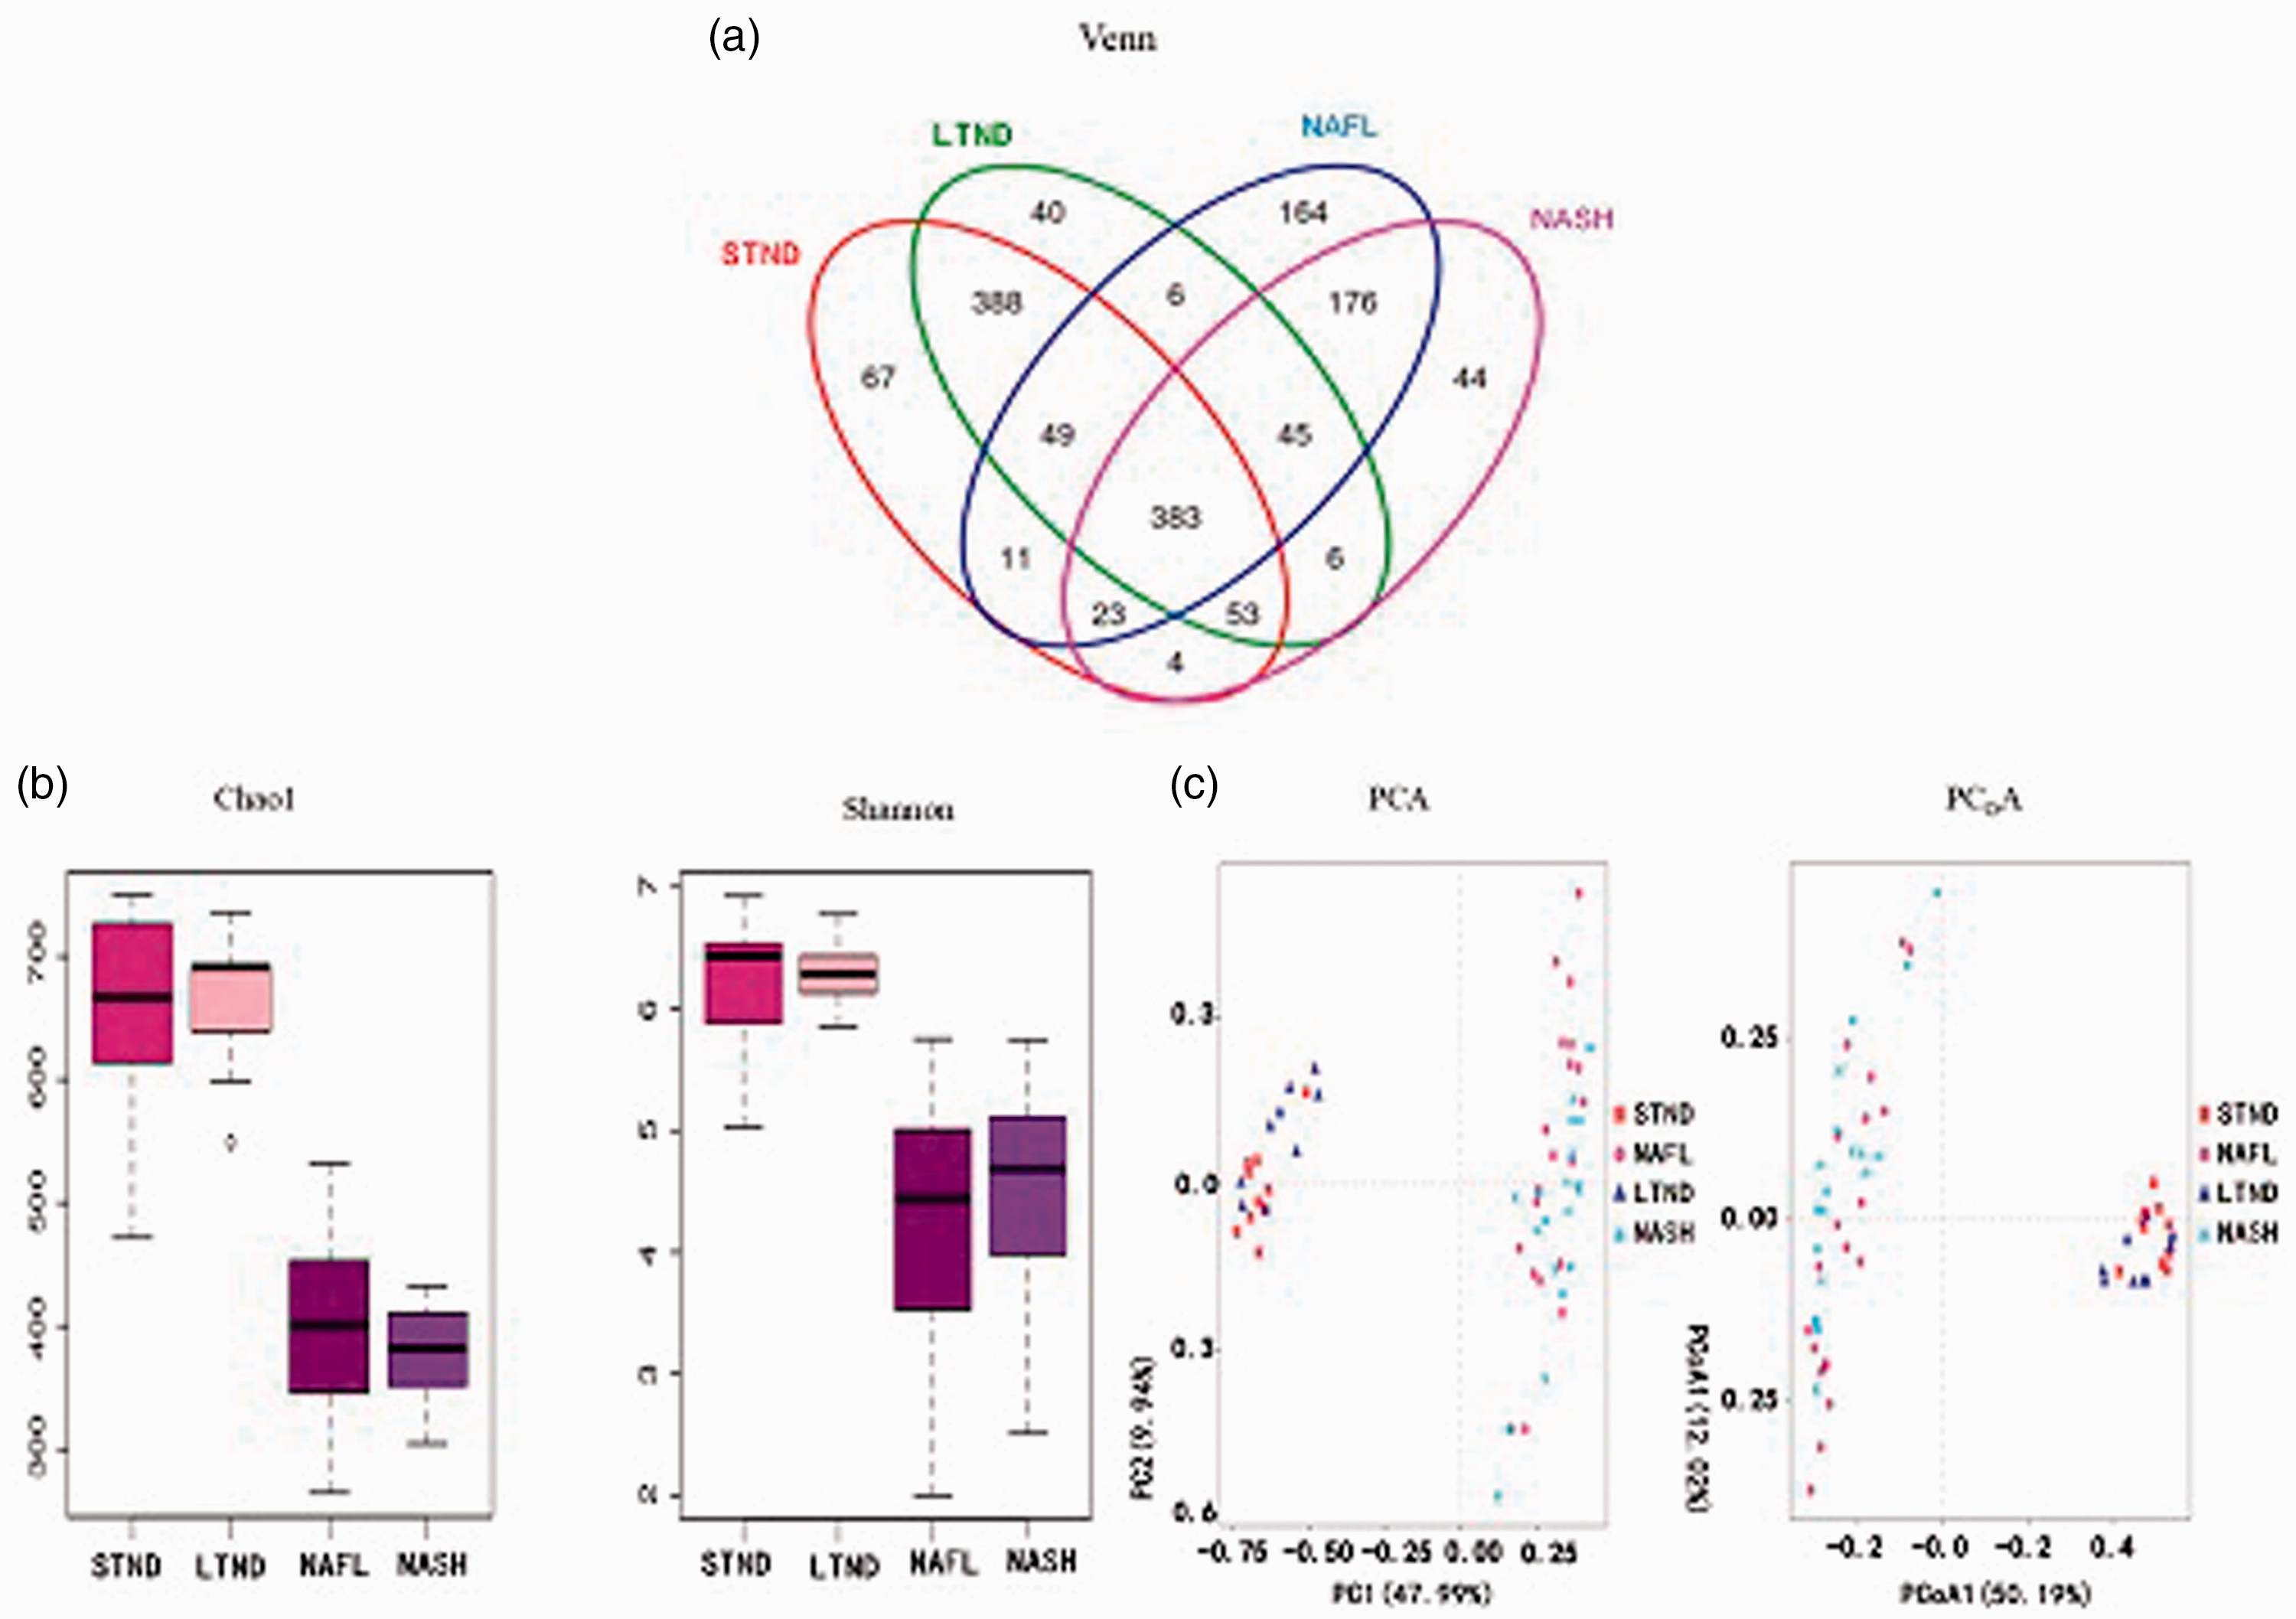
a) Venn diagram of fecal flora OTUs of the STND, LTND, NAFL, and NASH groups. b) Chao1 and Shannon indices of the fecal flora of each group. c) OTUs-based PCA and Bray–Curtis-based PCoA of the fecal flora of the four groups.
The Chao1 and Shannon indices are important statistical analysis indices of α diversity, which can reflect the abundance and diversity of microbial communities. The Chao1 and Shannon indices of the NAFL and NASH groups were significantly lower than those of the STND and LTND groups (all P < 0.05). However, there was no significant difference in either index between the NASH and NAFL groups (Figure 3b).
Principal component analysis (PCA) and principal coordinates analysis (PCoA) are commonly used methods for β diversity analysis, which compares the microbial community composition of samples from different groups. PCA and PCoA demonstrated that the fecal flora structure of the NAFL and NASH groups were more similar than those of the STND and LTND groups. However, there was no obvious difference in the fecal flora structure between the NAFL and NASH groups (Figure 3c).
Taxonomic analysis of fecal flora composition in NAFLD mouse models
We identified 19 bacterial phyla in our analysis. We focused additional analyses on bacterial phyla with a relative abundance exceeding 1%, which included Bacteroidetes, Firmicutes, Proteobacteria, Actinobacteria, and Saccharibacteria. We found that the relative abundance of Firmicutes and Actinobacteria was significantly higher in the NAFL and NASH groups than in the STND and LTND groups (all P < 0.05), whereas that of Bacteroidetes and Saccharibacteria was significantly lower (all P < 0.05). The relative abundance of Proteobacteria in the NASH group was also significantly higher (P < 0.05) than that in the STND and LTND groups. We did not identify any differences in the relative abundance of these five phyla when between the NAFL and NASH groups (Table 3, Figure 4a).
Variations in the relative abundance of phyla.

Note: aP < 0.05, versus STND group; bP < 0.05, versus LTND group; cP < 0.05, versus NAFL group; dP < 0.05, versus NASH group.
STND, short-term normal diet; LTND, long-term normal diet; NAFL, non-alcoholic fatty liver; NASH, non-alcoholic steatohepatitis.
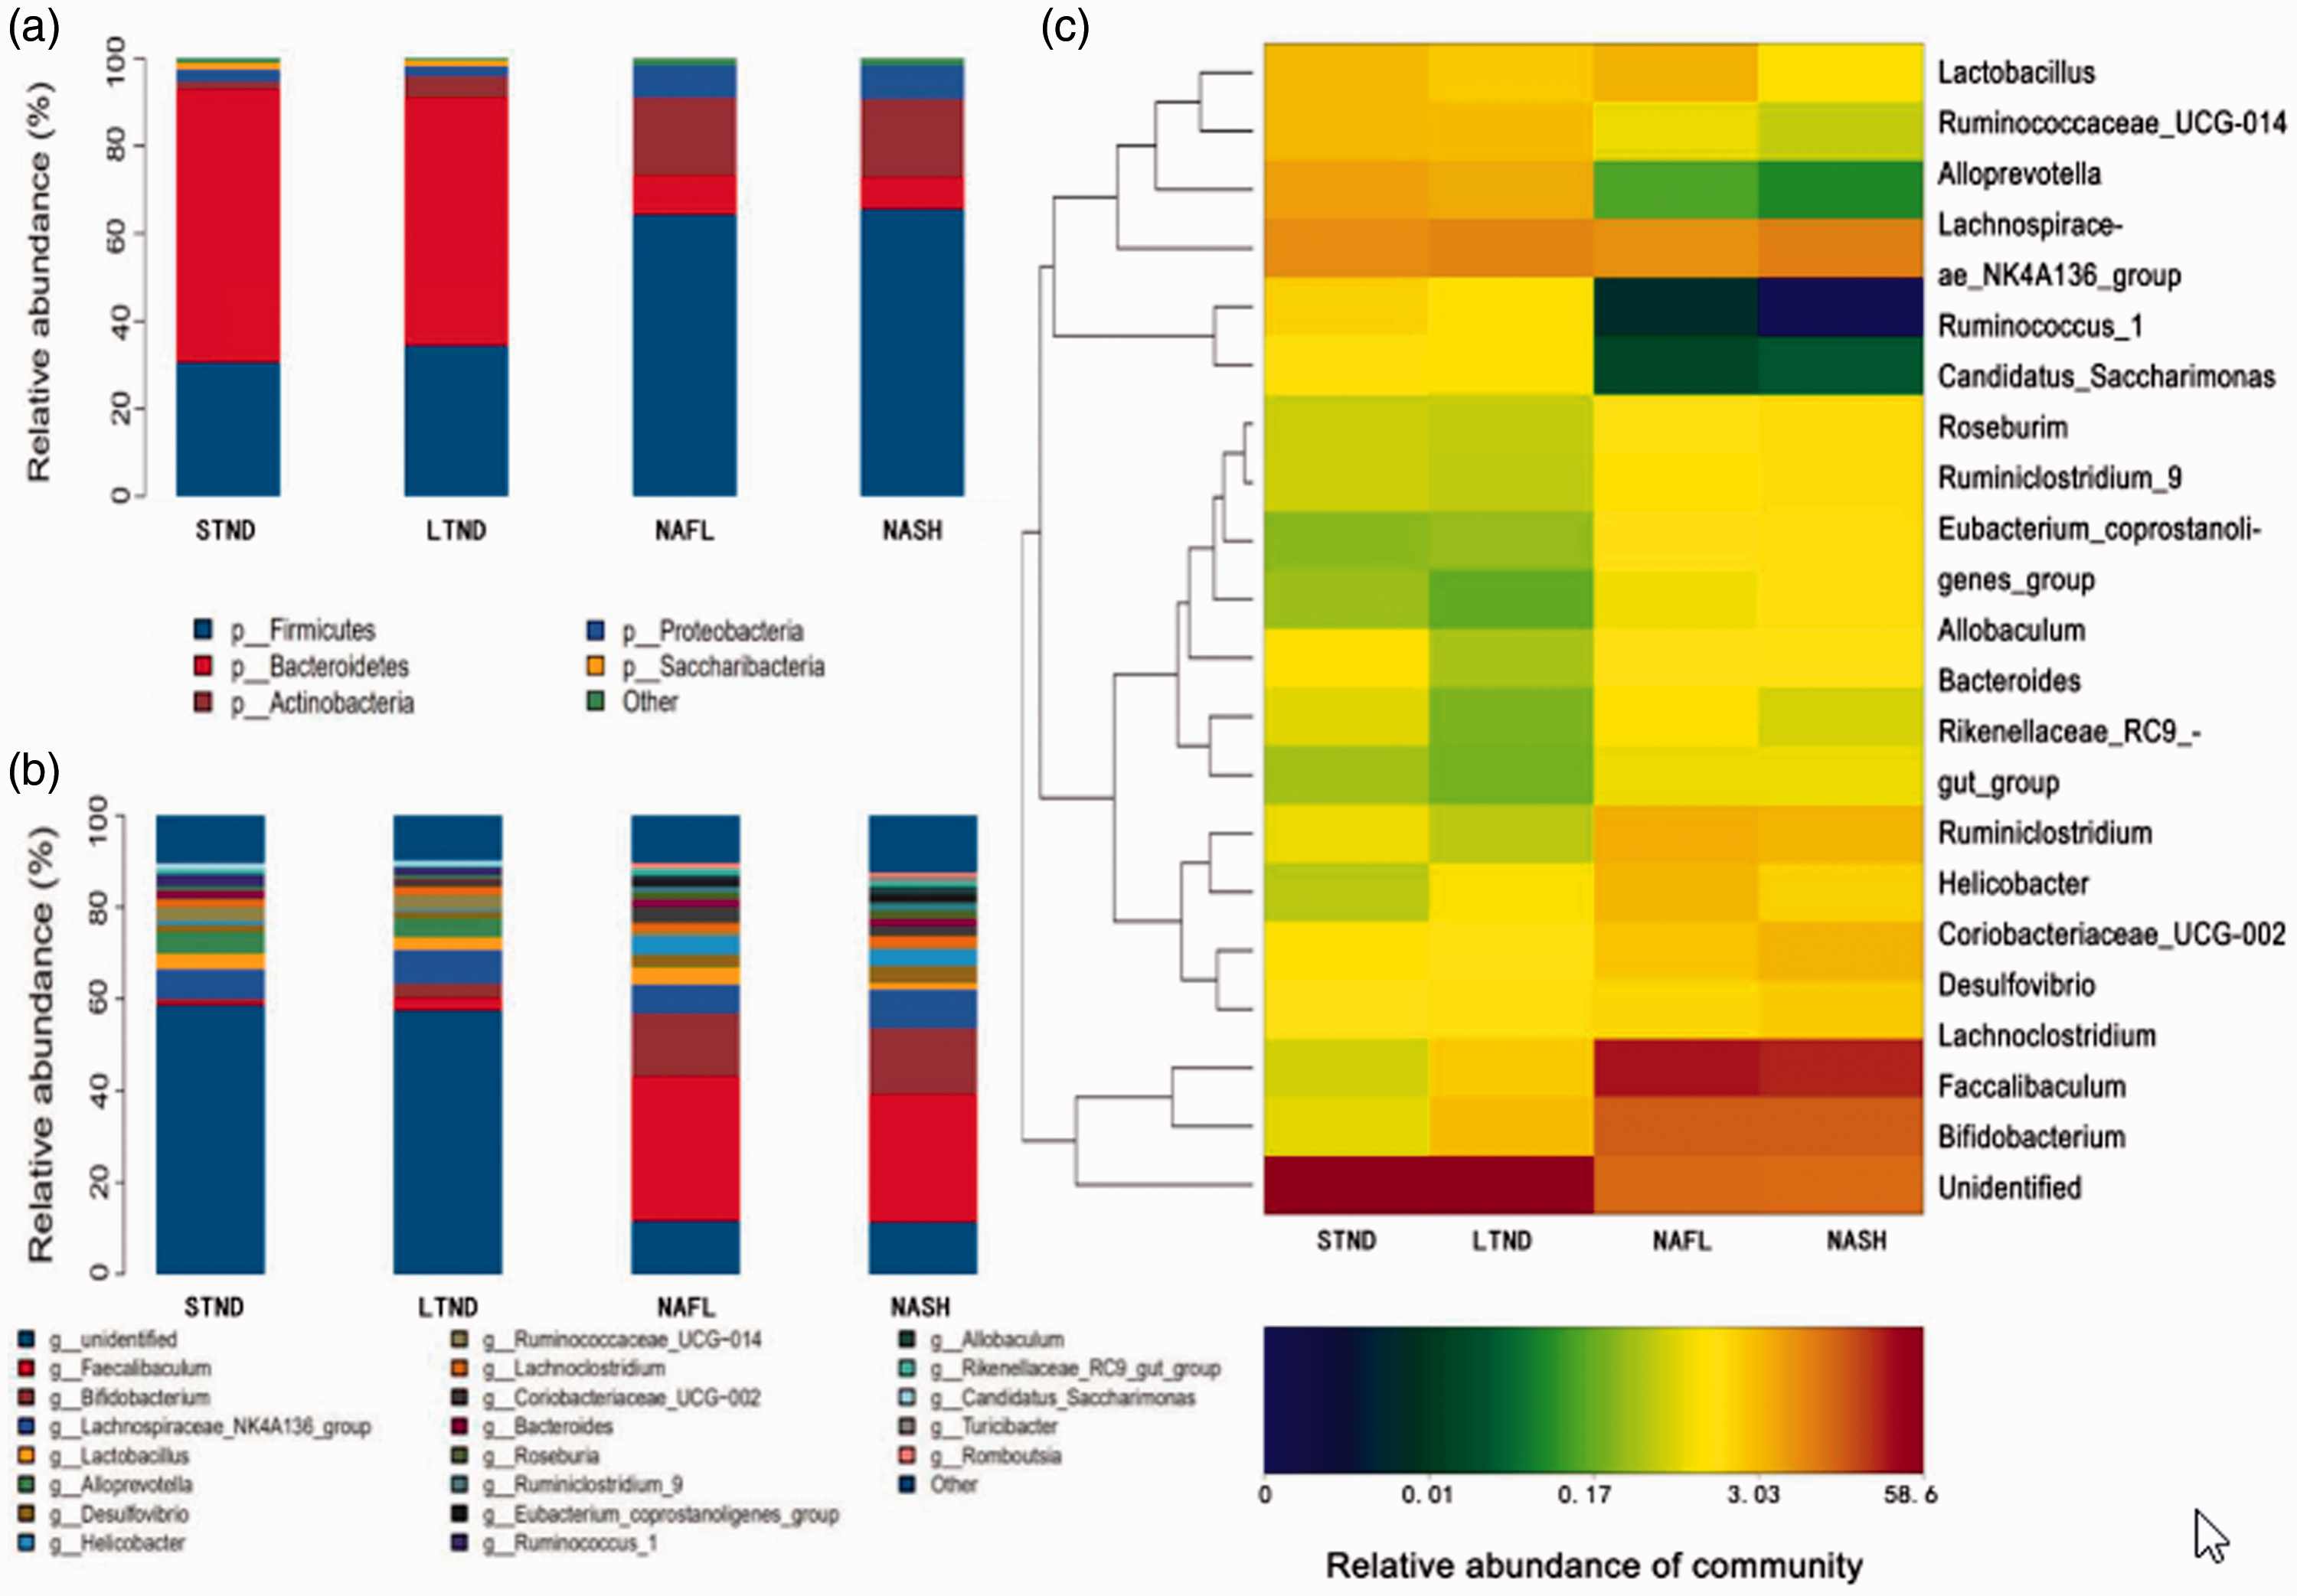
Relative abundance of fecal flora in the STND, LTND, NAFL, and NASH groups at the a) phylum and b) genus levels. c) Heatmap of the top 20 genera in the fecal flora of mice reflecting clustering similarities. Genera with high and low abundance can be clustered in blocks that reflect the similarities or differences across samples and classification levels.
We detected 221 bacterial genera, and similarly as our phyla analyses, we focused on genera with a relative abundance exceeding 1%. The relative abundance of Alloprevotella, Ruminococcaceae UCG-014, Ruminococcus 1, and Candidatus Saccharimonas were significantly higher in the STND and LTND groups than in the NAFL and NASH groups (all P < 0.05). Conversely, the relative abundance of Bifidobacterium, Faecalibaculum, Helicobacter, Eubacterium coprostanoligenes group, and Romboutsia was significantly lower in the STND and LTND groups than in the NAFL and NASH groups (all P < 0.05; Table 4, Figure 4b and c).
Variations in the relative abundance of genera.

Note: aP < 0.05, versus STND group; bP < 0.05, versus LTND group; cP < 0.05, versus NAFL group; dP < 0.05, versus NASH group.
STND, short-term normal diet; LTND, long-term normal diet; NAFL, non-alcoholic fatty liver; NASH, non-alcoholic steatohepatitis.
We also identified a difference in the relative abundance of four genera that could be used to distinguish the NAFL and NASH groups. Compared with the NAFL group, the relative abundance of Lactobacillus in the NASH group was significantly lower (P < 0.05), whereas that of Desulfovibrio, Ruminiclostridium 9, and Turicibacter was significantly higher (all P < 0.05; Table 4). Using the relative abundance of these four genera, we plotted an ROC curve and calculated the area under the ROC curve (AUROC) to determine if these genera could be used to diagnose NASH. The AUROCs of the four genera were 0.705, 0.734, 0.737, and 0.937, respectively (Figure 5). We also used Spearman’s correlation to evaluate the NAS of the mice in the NAFL and NASH groups and the relative abundance of these four genera. This analysis revealed that NAS was positively correlated with the relative abundance of Desulfovibrio (r = 0.353, P < 0.05), Ruminiclostridium 9 (r = 0.431, P < 0.01), and Turicibacter (r = 0.688, P < 0.01) but not that of Lactobacillus.

Receiver operating characteristic analysis of the relative abundance of Lactobacillus, Desulfovibrio, Ruminiclostridium 9, and Turicibacter for diagnosing non-alcoholic steatohepatitis.
Discussion
The prevalence of NAFLD is increasing worldwide, and it is estimated that NAFLD will be the leading cause of cirrhosis and hepatocellular carcinoma within the next 5 years. Mouse models provide an opportunity to understand the pathogenetic mechanisms of NAFLD. We fed mice a high-fat/high-sugar diet to establish a mouse model of NAFL/NASH. After 8 weeks of high-fat/high-sugar diet feeding, mice developed a liver pathology that mimicked aspects of human NAFL/NASH, including hepatocyte steatosis and edema. After 16 weeks of high-fat/high-sugar diet feeding, mice exhibited a pathology consistent with NASH, including scattered neutrophils infiltrating small foci and ballooning degeneration of hepatocytes. The findings suggest that a high-fat/high-sugar diet can induce NAFL/NASH in mice.
In addition to the development of liver pathology consistent with NAFL/NASH, we found that a high-fat/high-sugar diet led to increased serum TG, TC, and LDL-C levels. Prior studies revealed that long-term consumption of a high-fat diet can lead to increased synthesis of TG, TC, and LDL-C that exceeds the rate of transport and metabolism in hepatocytes and that can lead to NAFLD and hyperlipemia.18,19 In our model, the development of NASH (but not NAFL) was accompanied by an increase in FBG content.
ALT and AST are important indicators of liver function, and they are used as surrogate markers of liver damage. In the clinic, ALT and AST have also been used to non-invasively distinguish NAFL from NASH.20,21 This method is controversial because some studies illustrated that there is no significant difference in ALT and AST levels between patients with NAFL and NASH. 22 We found elevated ALT and AST levels in NAFL mice, but we could not use these two markers to distinguish NAFL and NASH. This preclinical evidence supports the idea that NAFL cannot be distinguished from NASH using ALT and AST alone.
LPS is a component of the cell wall of gram-negative bacteria. Alterations in intestinal flora caused by long-term consumption of a high-fat diet can lead to increased intestinal LPS levels. The absorption of intestinal LPS into peripheral blood can cause a slight increase in serum LPS levels called metabolic endotoxemia, which is usually 10 to 50-fold lower than the level of endotoxemia found in septic shock.23–25 When combined with CD14, LPS can activate the NF-κB signaling pathway and increase the levels of inflammatory factors that conspire to facilitate the development of fatty liver, obesity, and insulin resistance.26,27 We found that NAFL mice have higher levels of LPS than normal mice and that NASH mice have higher levels than NAFL mice. This suggests that LPS levels increase with the progression of the severity of fatty liver disease, and serum LPS levels may be useful in distinguishing NASH from NAFL.
Intestinal flora diversity is an important aspect of maintaining intestinal flora homeostasis, which can regulate important health outcomes.28,29 In this study, we used high-throughput 16S rRNA sequencing to analyze the fecal flora of our NAFLD mouse model. By examining α and β diversity, we illustrated that the abundance and diversity of fecal flora in NAFL/NASH mice were lower than those in normal mice, and the flora composition also differed between NAFL/NASH and normal mice. However, α and β diversity were similar between the NAFL and NASH groups. Further taxonomic analysis of fecal flora composition illustrated at the phylum level, Bacteroidetes, Firmicutes, Proteobacteria, Actinobacteria, and Saccharibacteria were most the common phyla in all groups of mice. However, we found an increased relative abundance of these groups in NAFL/NASH mice compared with that in normal mice. The relative abundance of other phyla (i.e., Bacteroidetes/Firmicutes) was lower in NAFL/NASH mice than in normal mice. These findings are consistent with prior reports.30–32 It is believed that a lower abundance of Bacteroidetes might facilitate the metabolic dominance of other bacteria that are more efficient in extracting energy from the diet. 33 Our study also found that the relative abundance of Actinobacteria, Saccharibacteria, and Proteobacteria also changed in NAFL/NASH mice. However, there were no obvious differences in the abundance of phyla that could distinguish the NAFL and NASH groups.
At the genus level, we found that the relative abundance of Alloprevotella, Ruminococcaceae UCG-014, Ruminococcus 1, and Candidatus Saccharimonas was lower in NAFL/NASH mice, whereas that of Bifidobacterium, Faecalibaculum, Helicobacter, Eubacterium coprostanoligenes group, and Romboutsia was increased. Alloprevotella and Ruminococcaceae UCG-014 are relatively common beneficial bacteria found in human and animal intestines that can promote the generation of short-chain fatty acids (SCFAs).34,35 SCFAs can regulate energy extraction from the diet, help maintain energy homeostasis, nourish intestinal epithelial cells, and decrease the levels of blood LPS or other inflammatory factors, thereby decreasing intestinal permeability. 36 Ruminococcus 1 is a highly heterogeneous genus in which some species have probiotic effects, 36 whereas others are considered pathogenic. A prior study found a positive correlation between the abundance of Romboutsia and obesity, 37 suggesting that these bacteria play a negative role in lipid metabolism. Interestingly, Faecalibaculum, a genus believed to promote the beneficial generation of SCFAs in the intestines, 38 had an increased relative abundance in NAFL/NASH mice, as did Bifidobacterium, a genus that has long been considered a probiotic. Bifidobacterium can competitively occupy the surface of the intestinal mucosa, preventing the invasion of pathogenic bacteria and reducing the absorption of LPS.39–41 Thus, the unexpectedly high abundance of Faecalibaculum and Bifidobacterium in NAFL/NASH mice merit further investigation.
We also identified changes in the relative abundance of four genera that helped differentiate NAFL and NASH mice. Lactobacillus was relatively less abundant in the NASH group than in the NAFL group, whereas Desulfovibrio, Ruminiclostridium 9, and Turicibacter were more abundant. The AUROCs of all four genera exceeded 0.7, with the highest AUROC belonging to Turicibacter (AUROC = 0.937). These data suggest that the relative abundance of these four genera has potential value for NASH diagnosis, particularly when trying to distinguish it from NAFL. We also performed Spearman’s correlation analysis, which illustrated that NAS was positively correlated with the relative abundance of Desulfovibrio, Ruminiclostridium 9, and Turicibacter. This indicates that the relative abundance of these three genera could be used as surrogates for assessing NAFLD severity and thereby further helping to distinguish NASH from NAFL. Lactobacillus is often used as a probiotic in the clinic, and this genus includes more than 180 species, many of which can generate SCFAs. Lactobacillus can also improve epithelial barrier function and regulate immune response, 42 making it unsurprising that its abundance decreased with disease progression. Desulfovibrio comprises a group of gram-negative endotoxin-producing bacteria, and an increased abundance of Desulfovibrio in the intestine has been associated with increased levels of inflammatory blood markers. 38 This role is also consistent with our data and the relative abundance of this genus in NASH. Although Turicibacter, the genus most strongly correlated with NASH, is commonly detected in the intestines and feces of humans and animals, its role in the intestinal microecology and its pathogenic potential remain unclear. 43
This study had several limitations. First, the structural characteristics of the mouse intestinal flora in NAFL/NASH may be different from that of humans. Additionally, although some variations in fecal flora were found in mice with NAFL/NASH, the pathogenic mechanisms of these bacteria in NAFLD are still unknown. Third, the changed bacteria are also associated with obesity, hyperlipidemia, insulin resistance, and metabolic syndrome. Further research is needed to identify the specific factors and mechanism.
In summary, we established a mouse model of NAFLD using a high-fat/high-sugar diet. NAFLD mice displayed changes in blood lipid levels, FBG levels, liver function, LPS levels, and the fecal flora structure, consistent with some aspects of human disease. Moreover, we identified increased serum LPS levels and differences in the relative abundance of Lactobacillus, Desulfovibrio, Ruminiclostridium 9, and Turicibacter as features that may help differentiate NASH from NAFL. Moreover, the relative abundance of Desulfovibrio, Ruminiclostridium 9, and Turicibacter was positively correlated with NAS, suggesting that evaluation of these species may be helpful in understanding the severity of NAFLD. Together, these data may provide non-invasive biomarkers for distinguishing NASH from NAFL and clinically assessing NAFLD.
Footnotes
Declaration of conflicting interest
The authors declare that there is no conflict of interest.
Funding
This work was supported by the Logistics Scientific Research Project of PLA (No. CHJ12J027 to Lihong Cui), National Natural Science Foundation of China (No. 82070553 to Lihong Cui), and Capital Health Research and Development of Special Fund Program (No. 2020-2-5113 to Lihong Cui).