
Abstract
Objective
This study aimed to develop and validate a high-performance liquid chromatography–tandem mass spectrometry method to simultaneously determine three bioactive components of the Huangqi Chifeng decoction (HQCF) in rat plasma.
Methods
Taxol was used as an internal standard in the developed method. Chromatographic separation was performed on a C18 column using a gradient elution with 0.1% formic acid in acetonitrile (v/v) and 0.1% formic acid in water (v/v) as the mobile phases at a flow rate of 0.4 mL·minute−1. All compounds were monitored via selected reaction monitoring with an electrospray ionization source.
Results
The lower limits of quantification of paeoniflorin, calycosin, and prim-O-glucosylcimifugin were 15.0, 0.75, and 0.75 ng·mL−1, respectively. The calibration curves indicated optimal linearity (r > 0.99) across the concentration ranges. The specificity, precision, accuracy, recovery, matrix effect, and stability of the method were validated. This method was successfully applied in a pharmacokinetics study of the three compounds in rat plasma.
Conclusion
The pharmacokinetics results provide insights into the mechanisms of HQCF in vivo and its future clinical application.
Keywords
Introduction
Rheumatoid arthritis (RA) is a chronic inflammatory autoimmune disease influenced by both genetic and environmental factors. Its estimated prevalence is 0.8% in adults globally, and the condition is more common in women than in men. 1 RA is characterized by joint inflammation and destruction that result in functional limitations, disabilities, and a poor quality of life. 2
Traditional Chinese medicine (TCM) represents a vast and largely untapped resource for modern medicine. 3 Chinese herbs have attracted considerable attention worldwide because of their complementary and alternative therapeutic effects. 4 Chinese herbal formulas represent the main clinical application of TCM treatments. The Huangqi Chifeng decoction (HQCF), which is composed of Astragali Radix, Paeoniae Radix Rubra, and Saposhnikoviae Radix, is a TCM formula that was reported for the first time in “Yilingaicuo” (Correction on Errors in Medical Classics) in the Qing Dynasty (1830s).
Previous studies revealed that Astragali Radix and Saposhnikoviae Radix are the core therapeutic components for RA treatment, and Astragali Radix is the most commonly used monotherapy in RA treatment.5,6 Numerous studies have demonstrated the presence of flavonoids and saponins in Astragali Radix, monoterpenoid glycosides in Paeoniae Radix Rubra, and chromones in Saposhnikoviae Radix. These compounds have been revealed to possess anti-inflammatory, immunosuppressive, and pain-relieving properties.7–11 In addition, the total glucosides derived from Paeonia lactiflora Pall., which includes paeoniflorin as its main active ingredient, comprise a marketed drug for RA treatment. 12
Our preliminary study indicated that HQCF alleviates inflammation in rats with collagen-induced arthritis, making it a promising candidate drug for the treatment of early RA. 13 An ultra-performance liquid chromatography (UPLC)–tandem mass spectrometry (MS/MS) method has been established for the simultaneous quantification of the five major constituents of HQCF. 14 However, the integrated pharmacokinetics of HQCF in vivo remains unexplored.
Calycosin (CA) is the major bioactive isoflavonoid in Astragali Radix; 15 and paeoniflorin (PA) and prim-O-glucosylcimifugin (PG) are the quality control indicators for Paeoniae Radix Rubra and Saposhnikoviae Radix, which are described in Chinese Pharmacopoeia. All three compounds have anti-RA activity. In the present study, we developed a high-performance liquid chromatography (HPLC)–MS/MS method to simultaneously quantify CA, PA, and PG in the plasma of rats after the oral administration of HQCF extract and applied this method to investigate the pharmacokinetics of the three components. Taxol was used as an internal standard (IS).
Materials and Methods
Chemicals and reagents
CA, PG, PA, and Taxol were purchased from Chengdu DeSiTe Biological Technology Co. Ltd. (Chengdu, China). The purities of all compounds were determined by HPLC (≥98%). Their chemical structures are presented in Figure 1. HPLC-grade acetonitrile and methanol were purchased from Thermo Fisher Scientific (Waltham, MA, USA). HPLC-grade formic acid was obtained from Shanghai Aladdin Biochemical Technology Co. Ltd. (Shanghai, China). Water for HPLC–MS/MS analysis was purified using a Direct-Q 5UV ultra-pure water purification system (MilliporeSigma, Burlington, MA, USA).

Chemical structures of the analytes and internal standard (Taxol).
Astragali Radix (the dried root of Astragalus membranaceus (Fisch.) Bge.var. mongholicus (Bge.) Hsiao), Paeoniae Radix Rubra (the dried root of Paeonia lactiflora Pall.), and Saposhnikoviae Radix (the dried root of Saposhnikovia divaricata (Turcz.) Schischk.) were purchased from a local pharmacy in Beijing, China and authenticated by Prof. Chunsheng Liu from Beijing University of Chinese Medicine. The voucher specimens were kept in our laboratory.
Preparation of HQCF extract
The extracts of Astragali Radix, Paeoniae Radix Rubra, and Saposhnikoviae Radix were prepared as previously described.16–18 Then, the extracts were precisely weighed and combined to obtain the HQCF extract according to the proportions of the HQCF dose.
Animal experiments
Male Sprague–Dawley rats (weighing 200 ± 20 g) were purchased from the National Institutes of Food and Drug Control (Beijing, China) and housed under a 12-hour/12-hour light/dark cycle at standard room temperature (24 ± 1°C) and humidity (40%–70%). Rats were fed standard rodent chow with free access to water for 7 days before the experiments. After a 12-hour fast, six rats were administered the HQCF extract water solution (0.2 g·mL−1) via gastric gavage at 1526.5 mg·kg−1 (body weight). 13 Approximately 250 µL of blood were collected through the ophthalmic vein at 0, 0.5, 1, 1.5, 2, 4, 6, 8, 12, and 24 hours after drug administration. The plasma samples were immediately collected via centrifugation at 16,060 × g for 10 minutes at 4°C. Rats were sacrificed via CO2 inhalation at 24 hours after drug treatment. The animal study was approved by the Biological and Medical Ethics Committee of Minzu University of China (approval number: ECMUC2019011AO; Beijing, China). All animal experiments and procedures were conducted according to the guidelines of Animal Research: Reporting of in vivo experiments.
Instruments and conditions
The UPLC system (Thermo Fisher Scientific) included an Ultimate 3000 RSLC system with binary pumps, a WPS-3000TRS autosampler, and a TCC-3000RS column oven. The chromatographic separation was performed using an Ultimate XB-C18 column (2.1 mm × 50 mm, 1.8 μm; Welch Materials, Shanghai, China). The binary mobile phase system consisted of 0.1% formic acid in water (A) and 0.1% formic acid in acetonitrile (B). The gradient program was as follows: 0 to 3.5 minutes, 5% to 95% B; 3.5 to 4.5 minutes, 95% B; 4.5 to 5.0 minutes, 95% to 5% B; and 5.0 to 6.0 minutes, 5% B. The flow rate was 0.4 mL·minute−1. The column temperature was 45°C.
The MS analysis was performed on a TSQ Quantum Access MAX (Thermo Fisher Scientific) equipped with electrospray ionization. The compounds were ionized in the positive and negative ion modes. The optimized parameters of the MS analysis were set as follows: spray voltage, 4000 V (positive and negative); capillary temperature, 350°C; sheath gas (nitrogen) pressure, 40 arb; and aux gas (nitrogen) pressure, 15 arb. Argon was used as the collision gas. Quantification was performed using the selected reaction monitoring (SRM) mode. The SRM transitions and conditions for measurement of the compounds are summarized in Table 1. Data were acquired using ThermoXcalibur software (version 3.0, Thermo Fisher Scientific).
Selected reaction monitoring transitions and conditions for the measurement of analytes.

*: quantitative ion.
CA, calycosin; PG, prim-O-glucosylcimifugin; PA, paeoniflorin; IS, internal standard (Taxol).
Preparation of standard solutions and quality control (QC) samples
The compounds and IS were weighed and dissolved in methanol to prepare stock solutions (2.0 mg·mL−1), which were stored at 4°C until use. The working solutions of the three compounds and IS (100 ng·mL−1) were prepared by diluting the stock solutions using methanol. The calibration standards and QC samples were prepared by diluting the corresponding working solutions with rat plasma. The concentrations of the calibration standards for CA and PG were 750, 600, 375, 75.0, 30.0, 7.50, and 0.750 ng·mL−1. The concentrations of the PA calibration standards were 15,000, 12,000, 7500, 1500, 600, 150, and 15.0 ng·mL−1. QC samples were prepared at low, middle, and high concentrations (2.25, 37.5, and 563 ng·mL−1, respectively, for CA and PG; 45.0, 750, and 11,250 ng·mL−1, respectively, for PA).
Sample preparation
The rat plasma (50 µL) and IS working solution (200 µL) were added into 1.5-mL Eppendorf tubes and vortexed for 5 minutes. The samples were centrifuged at 16,810 × g for 5 minutes at 4°C. The upper phase was transferred to a clean Eppendorf tube. A 2-μL aliquot was loaded into the HPLC–MS/MS system for analysis.
Method validation
The method was fully validated in accordance with the Bioanalytical Method Validation Guidance (US Food and Drug Administration) and the Guidelines for Quantitative Analysis of Biological Samples (Chinese National Medical Products Administration) in terms of specificity, linearity, the lower limit of quantification (LLOQ), precision, accuracy, recovery, matrix effects, and stability.19,20
Specificity
Specificity was evaluated by comparing the chromatograms of blank plasma samples (from six rats), blank plasma samples spiked with standards, and plasma samples collected after oral HQCF extract administration and spiking with IS.
Calibration curves and LLOQ
The calibration curves were generated in a weighted (1/x2) linear least squares regression model and assessed by plotting the peak area ratios of the analytes/IS versus the nominal concentrations of the analytes. The correlation coefficient (r) of the calibration curves was considered acceptable at values exceeding 0.99. The LLOQ was defined as the lowest concentration point of the calibration curve with a signal-to-noise ratio ≥ 5.
Precision and accuracy
Precision and accuracy were evaluated by determining three levels of the QC samples (n = 6) with three batches on three separate validation days. The relative standard deviation (RSD) was used to assess the precision, and a value of ≤15% was considered acceptable. The accuracy was calculated as the mean measured concentration/nominal concentration × 100%. A value within ±15% of the nominal concentration was considered acceptable.
Recovery and matrix effect
The extraction recoveries of the analytes and IS were determined by comparing the mean peak areas of the extracted spiked samples with those of extracts of blanks spiked with the analytes/IS post-extraction at three QC concentrations. The matrix factor (MF) was defined by comparing the peak areas of the blank plasma samples post-extraction spiked with analytes or IS with those of the corresponding analytes or IS spiked in blank solvent. The matrix effect, i.e., the IS normalized matrix factor, was calculated as the ratio of the MF of each analyte to the MF of IS. The matrix effect was evaluated at low and high QC levels in six replicates. For the IS normalized MF, an RSD of ≤15% was considered acceptable.
Stability
The short-term stabilities of the stock solutions of the analytes or IS were evaluated for 6 hours at room temperature. The stability of the QC samples (n = 6) was determined at three concentrations under the following conditions: 4 hours at room temperature, 24 hours at 4°C, freeze/thaw (three cycles at −80°C and room temperature), and 45 days at −80°C. A deviation value within ±15% was considered stable.
Pharmacokinetics study
The validated HPLC–MS/MS method was used to determine CA, PG, and PA plasma concentrations in rats. The pharmacokinetic parameters were processed via non-compartmental analysis using Phoenix WinNonlin 7.0 Version software (Certara, St. Louis, MO, USA). The main pharmacokinetic parameters were as follows: time to reach the maximum concentration (Tmax), maximum plasma concentration (Cmax), elimination half-life (t1/2), the area under the concentration–time curve from 0 to the last sampling time (AUC0-t), the area under the concentration-time curve from 0 to infinity (AUC0-∞), and total body clearance (CL). Data are expressed as the mean ± SD.
Results
Optimization of the sample preparation and HPLC-MS/MS conditions
Protein precipitation was used to prepare samples. We found that protein was precipitated completely when an aliquot of plasma was mixed with a 4-fold excess of methanol and vortexed for 5 minutes. Meanwhile, the recovery of the method was acceptable. The mobile phase played a critical role in achieving good chromatographic behavior and appropriate ionization. Therefore, several mobile phases were tested to optimize the separation and response signals of all analytes. MS intensity was better using acetonitrile than using methanol. Formic acid was added to the aqueous and organic mobile phases to obtain sharper peaks. Finally, an optimal mobile phase was achieved with 0.1% formic acid in water and 0.1% formic acid in acetonitrile in the gradient elution mode, with a runtime of 6 minutes.
The electrospray MS conditions for the determination of all analytes and IS were established by optimizing the tuning parameters. The MS/MS product ion spectra of three analytes and IS are presented in Figure 2. CA produced the [M + H]+ (m/z 285.03) precursor ion and displayed a major fragment ion at m/z 269.91 by splitting a methyl radical (·CH3) from the parent ion. The fragment ion (m/z 213.00) of CA was formed by the neutral losses of 16 (CH4) and 56 (CO*2) moieties. PG displayed an intense ion at m/z 469.00 [M + H]+, and the [M + H − C6H10O5]+ fragment ion at m/z 306.99 was produced by the elimination of glucose from the molecule. The fragment ion [M + H − C6H10O5]+ formed an ion at m/z 261.00 via the neutral losses of 18 (H2O) and 28 (CO) moieties. The [M + HCOO]– ion of PA at m/z 525.19 was generated as the base peak. The [M − H − CH2O]− (m/z 449.07) ion was the primary fragment ion of PA, and it produced the secondary fragment ion [M − H − CH2O − C7H6O2]− (m/z 326.97) via the splitting of a benzoic acid molecule. IS exhibited the [M + Na]+ precursor ion at m/z 876.20. The major fragment ion (m/z 307.98) of IS was the Taxol C13 side chain ion [ScH + Na]+.

The tandem mass spectrometry product ion spectra of the analytes and internal standard. (i) Calycosin; (ii) prim-O-glucosylcimifugin; (iii) paeoniflorin; (iv) internal standard (Taxol).
Specificity
Representative SRM chromatograms of blank plasma, plasma samples containing the standard analytes (at LLOQ) or IS, and plasma samples collected after the oral administration of the HQCF extract are presented in Figure 3a–c. No apparent interference was observed from endogenous substances during the retention time of the analytes and IS.

Representative chromatograms of the analytes and internal standard in rat plasma. (a) Blank plasma; (b) plasma sample containing the analytes (at the lower limit of quantification) and internal standard; and (c) plasma sample taken 1 hour after the oral administration of the Huangqi Chifeng decoction extract. (i) Calycosin; (ii) prim-O-glucosylcimifugin; (iii) paeoniflorin; (iv) internal standard (Taxol).
Calibration curves and LLOQ
The regression equations, correlation coefficients, and linearity ranges of the analytes are presented in Table 2. The calibration curves of the analytes exhibited optimal linearity across the concentration range (r > 0.99). The LLOQs of CA, PG, and PA were 0.75, 0.75, and 15.0 ng·mL−1, respectively. These data suggest that the method was sensitive for the pharmacokinetic analysis of HQCF extract in rat plasma.
Calibration curves and LLOQ of the three components in rat plasma.

CA, calycosin; PG, prim-O-glucosylcimifugin; PA, paeoniflorin; LLOQ, lower limit of quantification.
Precision and accuracy
The within-run and between-run precision and accuracy of the QC samples are summarized in Table 3. At each QC level, the within-run precision ranged 1.95% to 8.26%, and the within-run accuracy ranged 90.26% to 105.56%. The between-run precision ranged 1.30% to 7.46%, and the between-run accuracy ranged 92.24% to 105.55%. These data indicate that the HPLC–MS/MS method has acceptable precision, accuracy, and reproducibility.
Precision and accuracy of the analytes (mean ± SD).

CA, calycosin; PG, prim-O-glucosylcimifugin; PA, paeoniflorin.
Recovery and matrix effect
The results of the extraction recovery and matrix effect are presented in Table 4. At all QC levels, the recovery percentages ranged from 96.84% to 107.31% with an RSD less than 8.99% for the three components. Therefore, the assay was considered satisfactory. The recovery for IS was 96.99%. The IS-normalized MFs for the analytes were measured over the range of 92.53% to 105.96% with an RSD of ≤5.29% at low and high QC levels. No significant matrix effect was observed.
Recovery and matrix effect results of the analytes in rat plasma (mean ± SD, n = 6).
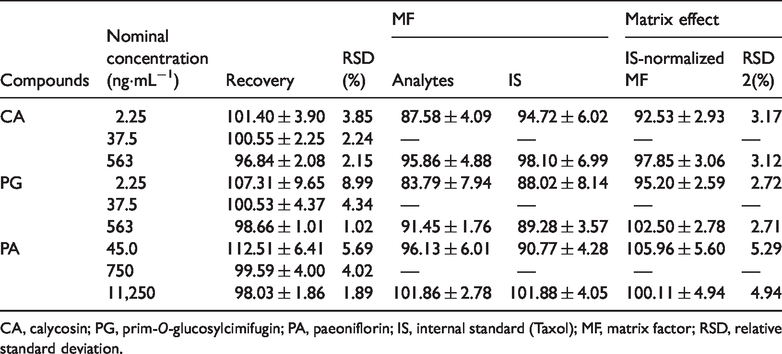
CA, calycosin; PG, prim-O-glucosylcimifugin; PA, paeoniflorin; IS, internal standard (Taxol); MF, matrix factor; RSD, relative standard deviation.
Stability
The stock solutions of CA, PG, PA, and IS were stable at room temperature for 6 hours with accuracies of 90.2, 93.9, 105.4, and 102.4%, respectively. The RSDs were less than 6.9%. All analytes remained stable at −80°C for 45 days, at room temperature for 4 hours, and after three freeze/thaw cycles (Table 5). Furthermore, the analytes in the extracted samples were stable in the autosampler at 4°C for 24 hours. The accuracies of the three compounds at three levels of the QC samples ranged from 88.0% to 111.7%. The RSDs for all stability conditions were <10%. These results indicate that CA, PG, and PA exhibit no significant degradation in rat plasma under different experimental conditions, suggesting that this method can be applied in pharmacokinetic analysis.
The stability of the analytes under storage condition (n = 6).

CA, calycosin; PG, prim-O-glucosylcimifugin; PA, paeoniflorin; RSD, relative standard deviation.
Pharmacokinetics study
Then, we applied the HPLC–MS/MS method to study the pharmacokinetics of HQCF extract in rat plasma. The mean plasma concentration–time profiles of the three analytes are illustrated in Figure 4. The pharmacokinetic parameters calculated using the non-compartment mode are presented in Table 6. As illustrated in Figure 4, after HQCF extract administration, the concentration–time curves of CA, PG, and PA exhibited double-peak absorption phases in the plasma profile. Tmax and t1/2 of CA were 1.5 and 6.28 hours, respectively. This finding suggests that the isoflavones in HQCF (e.g., calycosin-7-O-β-
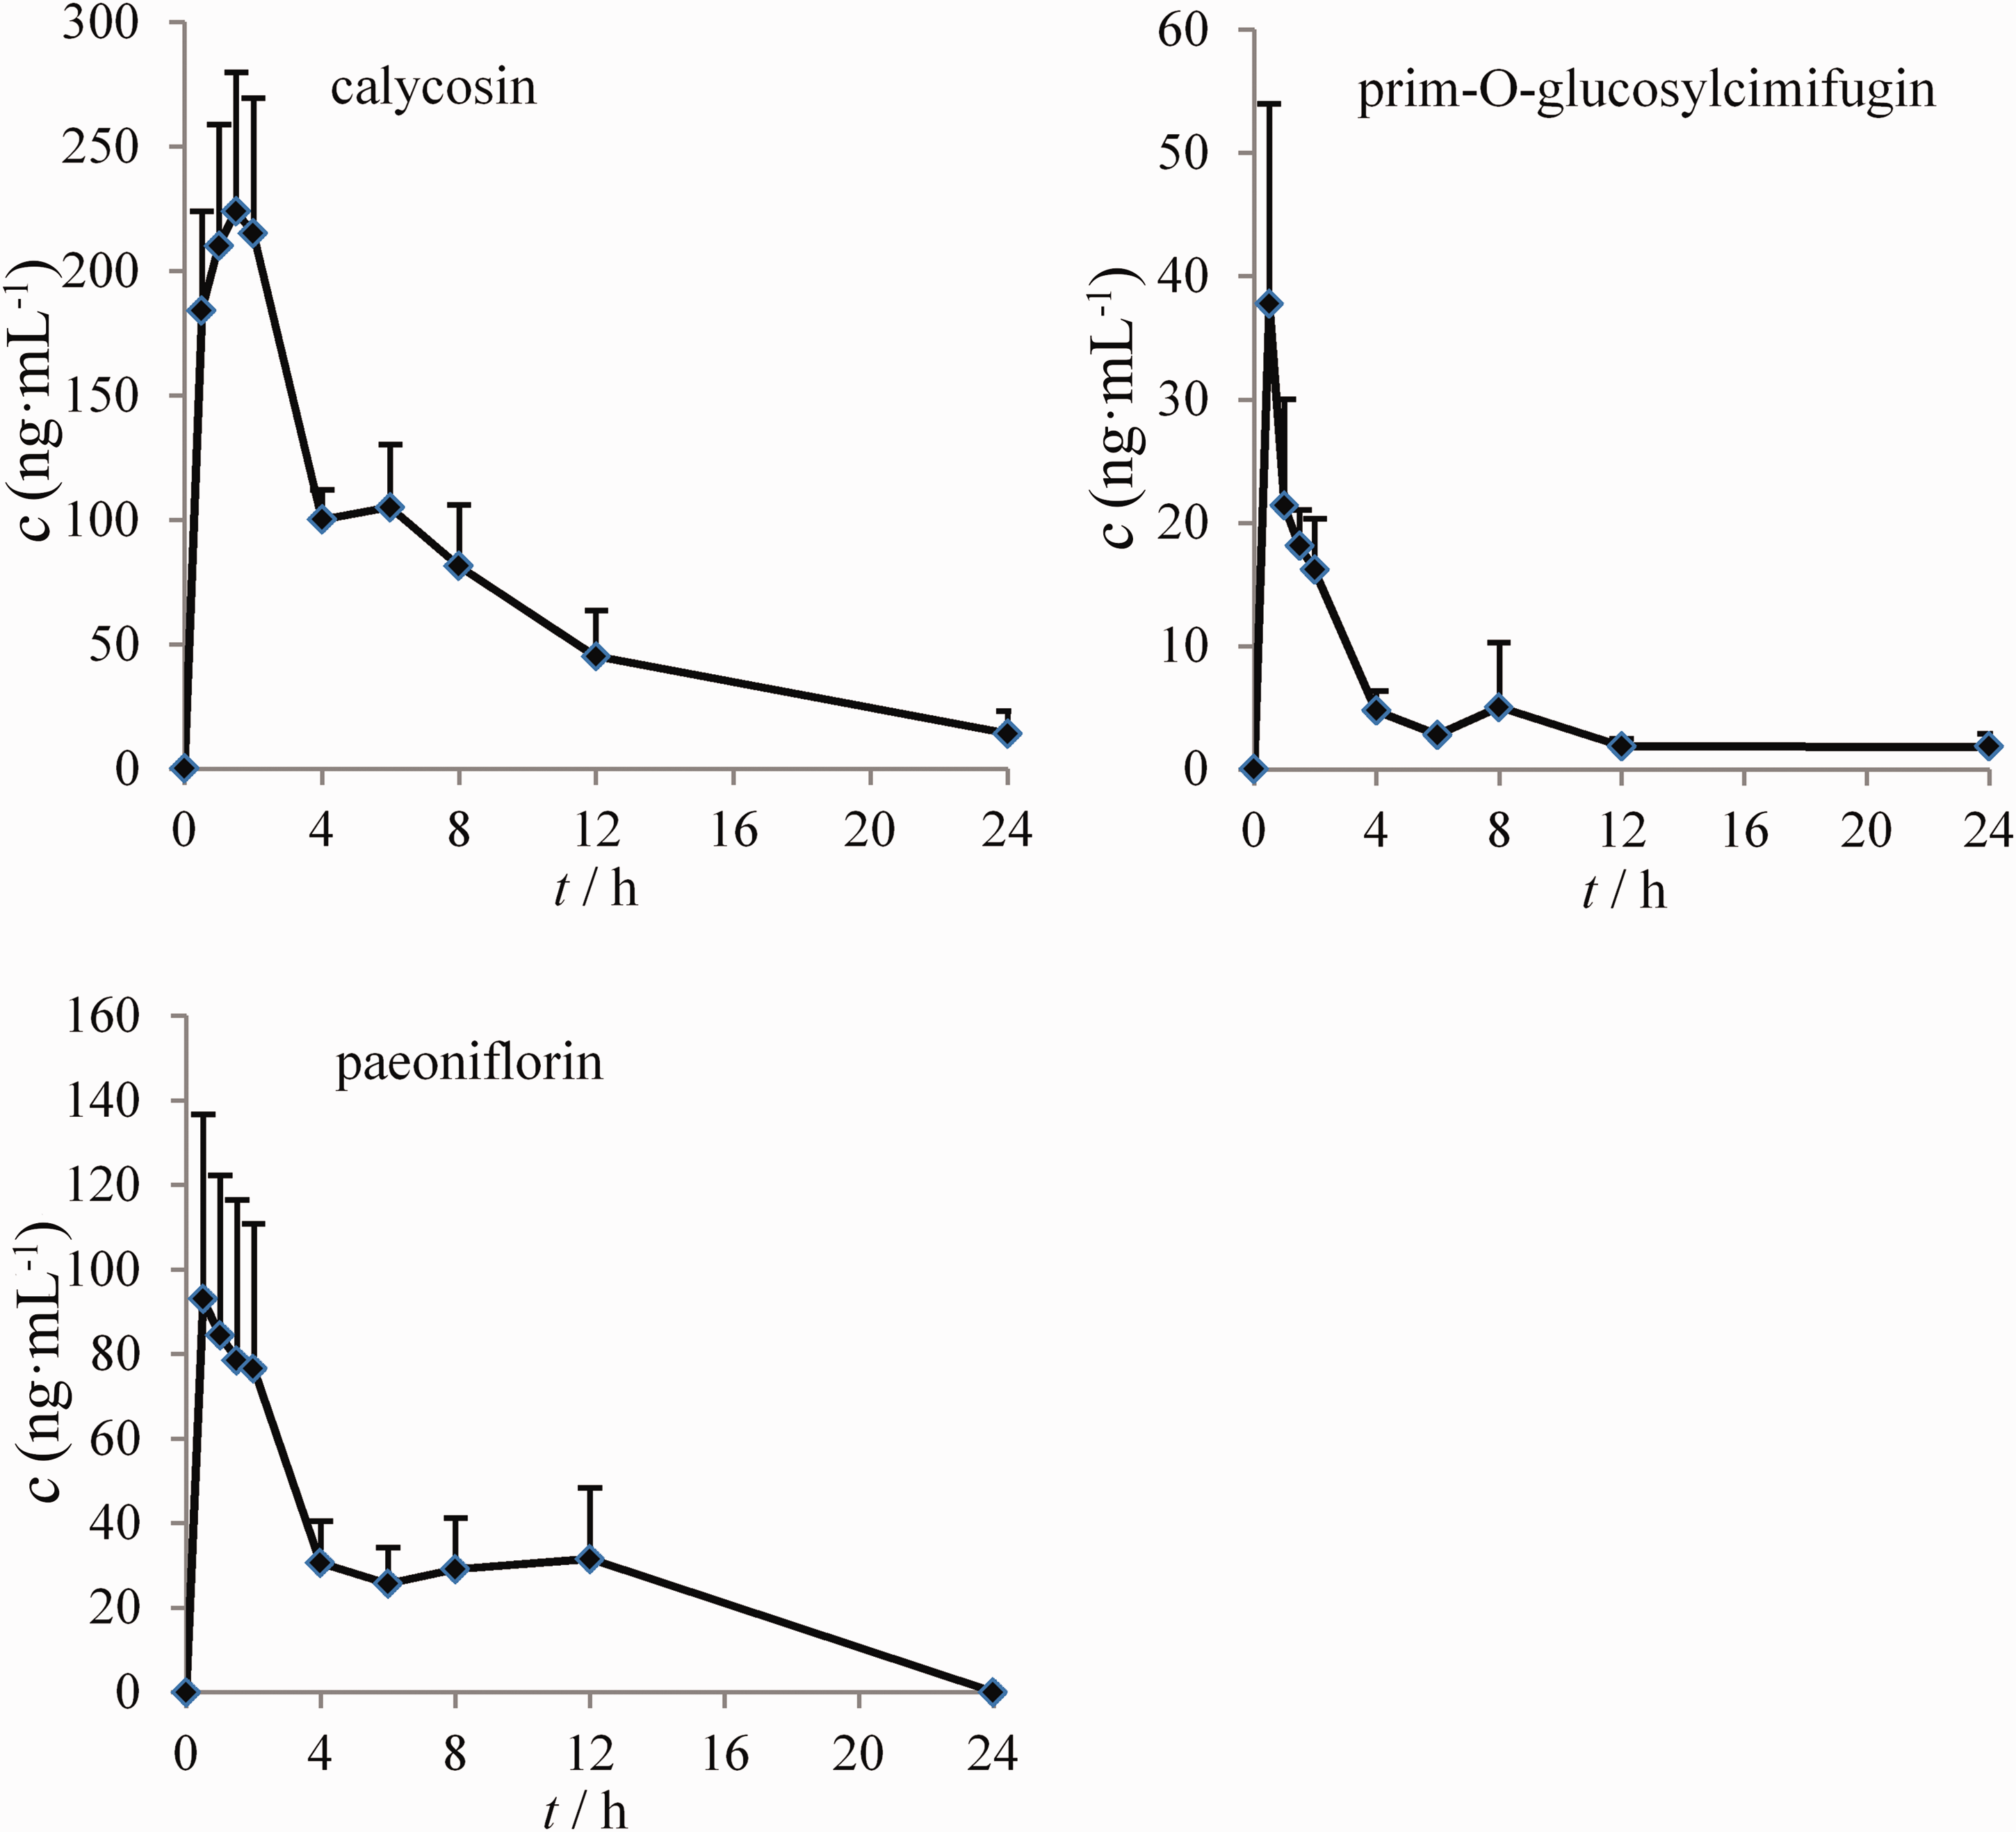
The mean plasma concentration–time curves of three analytes after the oral administration of the Huangqi Chifeng decoction extract.
Main pharmacokinetic parameters of three analytes after oral administration of the Huangqi Chifeng decoction extract (mean ± SD, n = 6).

CA, calycosin; PG, prim-O-glucosylcimifugin; PA, paeoniflorin; Cmax, maximum plasma concentration; Tmax, time to reach the maximum concentration; t1/2, elimination half-life; AUC0-t, area under the concentration-time curve from 0 to the last sampling time; AUC0-∞, area under the concentration-time curve from 0 to infinity; CL, total body clearance
Discussion
To the best of our knowledge, this is the first study to simultaneously quantify multiple HQCF constituents and assess the pharmacokinetics of HQCF extract in rat plasma. Our study provides important information regarding the mechanisms of absorption, distribution, metabolism, and excretion of the major HQCF components.
In this study, we quantified three major HQCF components because (1) CA is one of the main isoflavonoids in Astragalus extract that inhibits the expression of pro-inflammatory cytokines and exerts anti-arthritis effects 21 and because (2) PG and PA are the indicators for the quality control of Paeoniae Radix Rubra and Saposhnikoviae Radix. We selected Taxol as an IS because it has excellent response, stability, and recovery rates in MS analysis and its determination is not affected by endogenous substances. 22
In the pharmacokinetic analysis, we found that the concentration–time curves of CA, PG, and PA exhibited double-peak absorption phases in the plasma profile. The bimodal phenomenon of PG was consistent with previous findings regarding the pharmacokinetics of single-herb administration. 23 No study has reported the bimodal phenomena of CA and PA. We also noticed that Tmax and t1/2 of all analytes were greater than those in previous studies, whereas CL was significantly lower than that reported in previous studies.23–26 These findings are possibly attributable to the fact that TCM preparations are complex because of the diversity of herbs and ingredients. It appears that the different characteristics of the individual herbs or ingredients may affect each other. For example, it has been reported that the isoflavone in Astragali Radix increases Cmax, Tmax, t1/2, AUC0-t, and AUC0-∞ of PG while reducing CL. 26
In conclusion, we developed and verified a rapid, sensitive, and specific HPLC-MS/MS method for the simultaneous analysis of CA, PG, and PA in rat plasma after the oral administration of HQCF extract. This method displayed acceptable recovery, stability, precision, and accuracy, and it was successfully applied to the pharmacokinetic analysis of these components in vivo. This study may provide useful information for understanding the metabolism and therapeutic mechanisms of HQCF in RA.