
Abstract
Objective
To explore the mechanism underlying the progression of newly diagnosed idiopathic thrombocytopenic purpura (ITP) to its chronic or remission state using bioinformatic methods.
Methods
GSE56232 and GSE46922 gene expression profile datasets were downloaded from Gene Expression Omnibus (GEO). Differentially expressed genes were identified and characteristic genes were screened by weighted gene co-expression network analysis. These genes were used for function enrichment analysis and construction of a protein–protein interaction network. Finally, characteristic genes were verified to determine potential molecular mechanisms underlying ITP progression.
Results
We found that characteristic genes in the chronic ITP group were mainly involved in intracellular processes and ion binding, while characteristic genes in the remission ITP group were involved in intracellular processes and nuclear physiological activities. We identified a sub-network of characteristic genes, LMNA, JUN, PRKACG, SMC3, which may indicate the mechanism by which newly diagnosed ITP progresses to chronic. Although no meaningful signaling pathways were found, the expression of NR3C1, TPR, SMC4, PANBP2, CHD1, and U2SURP may affect ITP progression from newly diagnosed to remission.
Conclusion
Our findings improve the understanding of the pathogenesis and progression of ITP, and may provide new directions for the development of treatment strategies.
Keywords
Introduction
Idiopathic thrombocytopenic purpura (ITP) is an acquired hemorrhagic disease characterized by isolated thrombocytopenia, which can affect individuals of any age, race, and sex. 1 , 2 The disease mainly manifests as scattered skin bleeding points and other mild bleeding symptoms, such as epistaxis and gum bleeding. In severe cases, intracranial bleeding can be life-threatening. 3 ITP is considered to be related to abnormalities in the immune system, and arises when autoantibodies directed against platelet antigens result in increased clearance of platelets by the mononuclear macrophage system from the peripheral circulation.4–7 The incidence of ITP in adults is between 3.3 and 3.9 per 100,000 per year, and that of children is between 1.9 and 6.4 per 100,000. 8 , 9 While a brief course with spontaneous remission is frequently observed in most children with ITP, some patients transform to the chronic phenotype. 10 Additionally, ITP patients whose symptoms have been temporarily relieved are also at risk of recurrence.
A recent study showed that the CD40 gene single nucleotide polymorphism rs1883832 is associated with an increased risk of ITP development in the Egyptian population. 11 However, this only explored the risk factors related to ITP pathogenesis at the single gene level, and did not consider the molecular mechanisms underlying disease progression at the multi-gene level.
Recently, bioinformatic approaches have been increasingly used in target gene or protein exploration and analysis. 12 , 13 Gene expression profile technology has produced numerous high-throughput gene profiles, which are widely used in data mining, so this is a promising method to explore the mechanism underlying the pathogenesis and progression of ITP. In the analysis of gene expression profile data, the identification of differentially expressed genes (DEGs) is an essential step after data collection. 14 However, it can only identify DEGs between two groups and does not determine whether these genes are co-expressed. Weighted gene co-expression network analysis (WGCNA) is a novel gene co-expression network-based approach that uses systems biology to analyze molecular interaction mechanisms and resolve correlation networks. 15 , 16 WGCNA can also be used to find modules for co-expression and to explore the relationship between gene networks and clinical phenotypes.
In our study, we used Gene Expression Omnibus (GEO) mRNA expression datasets GSE56232 and GSE46922 to identify genes that were differentially expressed in both chronic ITP and remission ITP groups relative to the newly diagnosed ITP group. We constructed gene co-expression networks and gene modules according to the disease phenotype, and overlapped DEGs with module genes to identify characteristic genes for gene enrichment analysis and hub gene mining. Our study used bioinformatics to analyze potential molecular mechanisms involved in the transition from newly diagnosed ITP to the chronic or remission state. We also aimed to provide a scientific basis for in-depth research on ITP pathogenesis and new insights that can be used in the clinical diagnosis and treatment of the disease.
Materials and methods
Data source
Gene expression profile datasets GSE56232 and GSE46922 were downloaded from the GEO database (http://www.ncbi.nlm.nih.gov/geo). GSE56232 included mRNA expression profiles from six newly diagnosed ITP patients and six remission ITP patients, 17 while GSE46922 contained data from seven newly diagnosed ITP patients and six chronic ITP patients. 18 All samples were from human peripheral blood T cells. The datasets were based on the GPL570 Platform (Affymetrix Human Genome U133 Plus 2.0 Array; Thermo Fisher Scientific, Santa Clara, CA, USA) and were processed according to the standard Affymetrix protocol.
Identification of DEGs in ITP
“Limma” is an R package used for the analysis of gene expression microarray data, which enables the simultaneous analysis of many RNA targets in arbitrary, complicated designed experiments. 19 On this basis, we used the limma package in R to identify DEGs among chronic ITP, remission ITP, and newly diagnosed ITP groups. DEGs with |log2FC|>0.58 and p-value <0.05 were selected for subsequent analysis. We then used the above results to create volcano plots and heat maps for different phenotypes of ITP using the R package to visualize the DEGs.
Co-expression network construction using WGCNA
Following elimination of the batch effect and data normalization, merged datasets from GSE56232 and GSE46922 were used to identify scale-free gene modules of co-expression and highly correlated gene networks constructed using WGCNA. First, we constructed a similarity matrix using the R package “WGCNA”. A soft-thresholding power β, where the corresponding scale-free Topology Fit Index was >0.9, was selected using the “pickSoftThreshold” function. The similarity matrix then generated a scale-free network topology depending on this soft threshold function, and the weighted adjacency matrix was transformed into a topological overlap measure (TOM) matrix to estimate its connectivity property in the network. Finally, the value (1-TOM) was designated as the distance to identify hierarchical clustering genes and modules. The minimum module size was set to 30, and the module eigengene (ME) was used to represent expression profiles of module genes. Modules with MEs lower than 0.25 in the clustering were identified as highly similar and were merged. The most valuable clinical data in our study were different ITP phenotypes, namely chronic ITP, remission ITP, and newly diagnosed ITP. Therefore, we plotted heat maps of the module–trait relationship and scatter plots according to the tutorial accompanying the WGCNA package in R to identify modules significantly associated with related clinical data.
Screening and analysis of characteristic genes
Genes in the significant modules that overlapped with DEGs, termed characteristic genes, were chosen for further analysis and validation. First, we imported these genes into the Search Tool for the Retrieval of Interacting Genes database (STRING) (http://string-db.org), which was used to predict potential interactions among mRNAs. A p-value <0.05 was regarded as statistically significant, and the top 10 significant categories were selected for visualization in a bubble chart after being ranked by their p-value. Additionally, Kyoto Encyclopedia of Genes and Genomes (KEGG) analysis (https://www.kegg.jp) was conducted for characteristic genes. We then created networks of these characteristic genes for chronic or remission states of ITP using Cytoscape 3.7.0. 20 The Cytohubba plugin tool was used to identify hub genes using 12 topological methods.
Verification of hub genes and construction of sub-network
We used merged gene expression datasets to verify the expression of hub genes obtained from different phenotypes of ITP. The expression levels of hub genes from either chronic ITP or remission ITP were visualized using box plots in each group. The Wilcoxon test was used to compare differences among three groups. Based on the hub genes obtained from the above verification results, we constructed a sub-network of the relationship between genes and pathways using the Database for Annotation, Visualization and Integrated Discovery (DAVID; https://david.ncifcrf.gov/), also visualized by Cytoscape 3.7.0.
Results
Workflow
The workflow of this study is shown in Figure 1. First, to explore the potential molecular mechanism underlying disease outcomes in newly diagnosed ITP patients, we downloaded GSE56232 and GSE46922 gene expression datasets from GEO. DEG identification was then performed on these datasets to obtain two sets of DEGs. We integrated these two datasets and used WGCNA to identify the module gene set that was most relevant to the sample phenotype. Finally, the two sets of previously obtained DEGs were merged with genes in the module, and the characteristic genes and pathways related to the disease progression of ITP were further explored by downstream analysis.
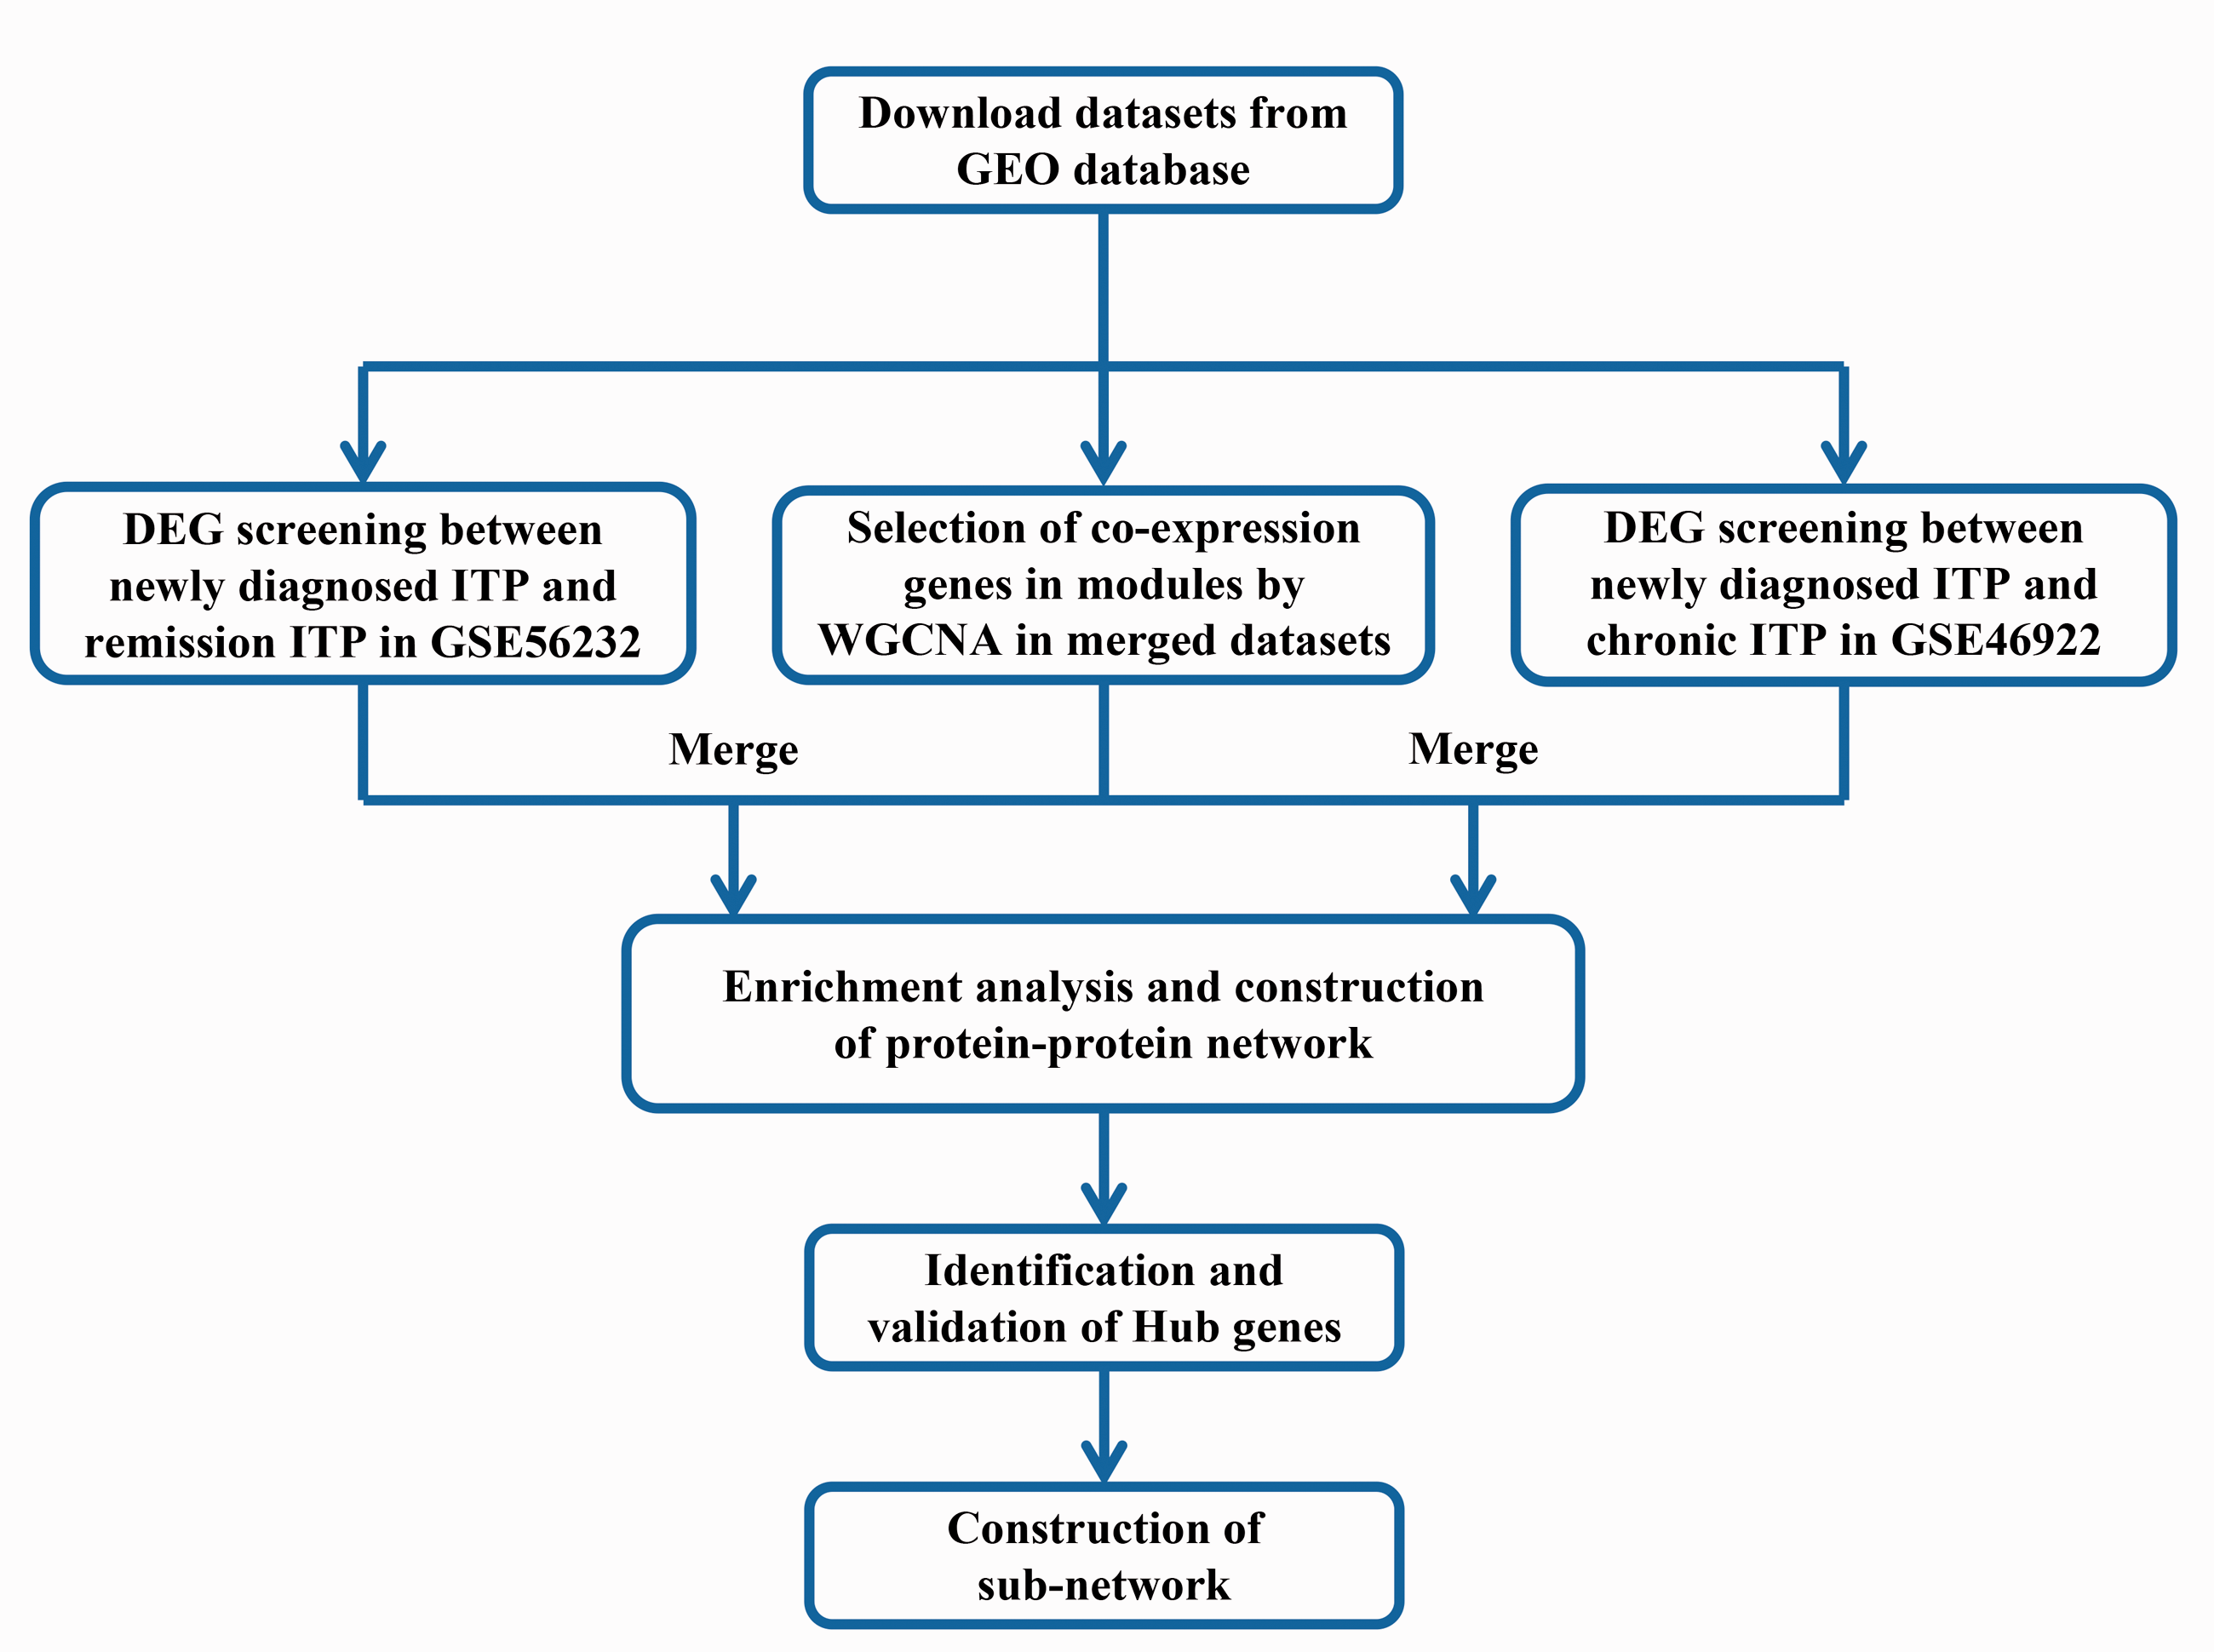
Workflow of data preparation, processing, and analysis in this study.
Screening of DEGs
After downloading GEO datasets, we performed differential gene analysis for the two sets of ITP gene expression data. A total of 219 DEGs were identified from the GSE56232 dataset (196 up-regulated and 23 down-regulated) while 3471 DEGs were identified from GSE46922 (1662 up-regulated and 1809 down-regulated). Heat maps and volcano plots for representing DEG distribution were generated for both datasets using R software; the top 10 genes with |log2FC| values are shown in the volcano plot (Figure 2).

Screening of DEGs. (a) Heat map of DEGs identified between chronic ITP and newly diagnosed ITP groups. (b) Volcano map of DEGs identified between chronic ITP and newly diagnosed ITP groups. (c) Heat map of DEGs identified between remission ITP and newly diagnosed ITP groups. (d) Volcano map of DEGs identified between remission ITP and newly diagnosed ITP groups. For (a) and (c), red represents up-regulated genes while blue represents down-regulated genes. The correlation between color and fold-change of mRNA expression is displayed in the top right. For (b) and (d), red represents up-regulated genes while blue represents down-regulated genes. The top 10 genes with |log2FC| values are shown.
Weighted co-expression network construction and identification of modules
Using WGCNA, we calculated the community dissimilarity index and constructed a system clustering tree by choosing a soft-thresholding power. According to the standard of the dynamic cut tree, the lowest gene number of each network was set at 30 and the cut-height was set at 0.9 (Figure 3a). When the connectivity between genes in the network had satisfied the scale-free network distribution, we generated 18 modules (Figure 3b). Genes that could not be included in any of the modules were placed into the gray module. Using the summary profile (eigengene) for each module, we correlated eigengenes with the ITP disease phenotype and looked for the most significant associations (Figure 3c). Compared with other modules, blue, cyan, green-yellow, magenta, tan, and yellow modules were positively correlated with chronic ITP characteristics, while the turquoise module was positively correlated with remission ITP characteristics. Therefore, we determined that these modules were the most relevant for patients with chronic or remission ITP with different disease phenotypes. Figure 3d–j shows the degree of correlation between genes in each module and their associated disease phenotype, as derived from statistical models.

(a) Soft-threshold power determination for WGCNA by analysis of the scale-free fit index and mean connectivity for various soft-threshold powers. (b) Cluster dendrogram of genes in merged datasets of GSE46922 and GSE56232. Each branch represents one gene, and every color represents one co-expression module. (c) Heat map of the correlation between module eigengenes and disease phenotype of ITP. Correlation coefficients and p-values are shown in parentheses underneath. Colors represent correlation coefficients (scale shown on right). (d–i) Scatter plots of module eigengenes in blue (d), cyan (e), green-yellow (f), magenta (g), tan (h), and yellow (i) modules in the chronic ITP group. (j) Scatter plot of module eigengenes in the turquoise module in the remission ITP group.
Analysis of characteristic genes and identification of hub genes
To further investigate the genes strongly associated with disease progression, we merged genes in the modules related to chronic or remission ITP with DEGs obtained from the chronic or remission ITP group. The characteristic genes most relevant to chronic or remission ITP were then overlapped, as shown in Supplemental Table 1. We next investigated the altered biological functions of these characteristic genes using STRING online software. For the chronic ITP group, we identified the top 10 gene ontology (GO) categories (Figure 4a) which were mainly involved in cell structure and function such as organelles, and intracellular and cellular parts. Other identified pathways suggested that characteristic genes in chronic ITP were involved in biological activities related to cell membrane function, such as ion binding. We also obtained the top 10 GO categories from the remission ITP group (Figure 4b). We found that the characteristic genes were mainly associated with terms related to the structure and function of cells or cell organelles. However, unlike the chronic ITP group, the characteristic genes of the remission ITP group were also enriched in pathways related to nuclear structure and function. Given the small number of characteristic genes in this study, KEGG analysis could not identify specific signaling pathways of statistical significance. We constructed a PPI network of characteristic genes in chronic and remission ITP groups (Figure 4c, d). Finally, after proceeding with 12 topological methods for ranking the properties of nodes in the network (Figure 4e, f), we obtained several genes that may play a pivotal role in PPI, as shown in Supplemental Table 2.

(a) Top 10 significantly enriched GO categories of characteristic genes in the chronic ITP group. (b) Top 10 significantly enriched GO categories of characteristic genes in the remission ITP group. (c) PPI network of characteristic genes in the chronic ITP group. (d) PPI network of characteristic genes in the remission ITP group. (e) Venn diagram of hub genes in the chronic ITP group based on 12 topological methods. (f) Venn diagram of hub genes in the remission ITP group based on 12 topological methods. For (c) and (d), red represents up-regulated genes while blue represents down-regulated genes. The depth of the edge color represents the strength of the connection between genes. Edge with darker colors means stronger associations than other edges.
Verification expression and sub-network construction of hub genes
The hub genes related to different disease phenotypes were identified solely from bioinformatic speculation and statistical probability calculations. Therefore, we used the merged datasets from GSE56232 and GSE46922 to verify these hub genes. We found that the expression of JUN, PRKACG, and SMC3 was significantly down-regulated in the chronic ITP group compared with the newly diagnosed ITP group, whereas LMNA expression was significantly up-regulated (p < 0.05; Figure 5a and b). We also observed that the expression of NR3C1, TPR, SMC4, RANBP2, CHD1, and U2SURP in the remission ITP group was significantly up-regulated compared with the newly diagnosed ITP group (p < 0.05; Figure 5b). Based on these results, DAVID was used to construct a sub-network of the most relevant pathways (Figure 6), although this was only achieved for the progression of newly diagnosed ITP to chronic ITP. Additionally, hub genes obtained from the remission group could not be confirmed to be enriched in a clear pathway.
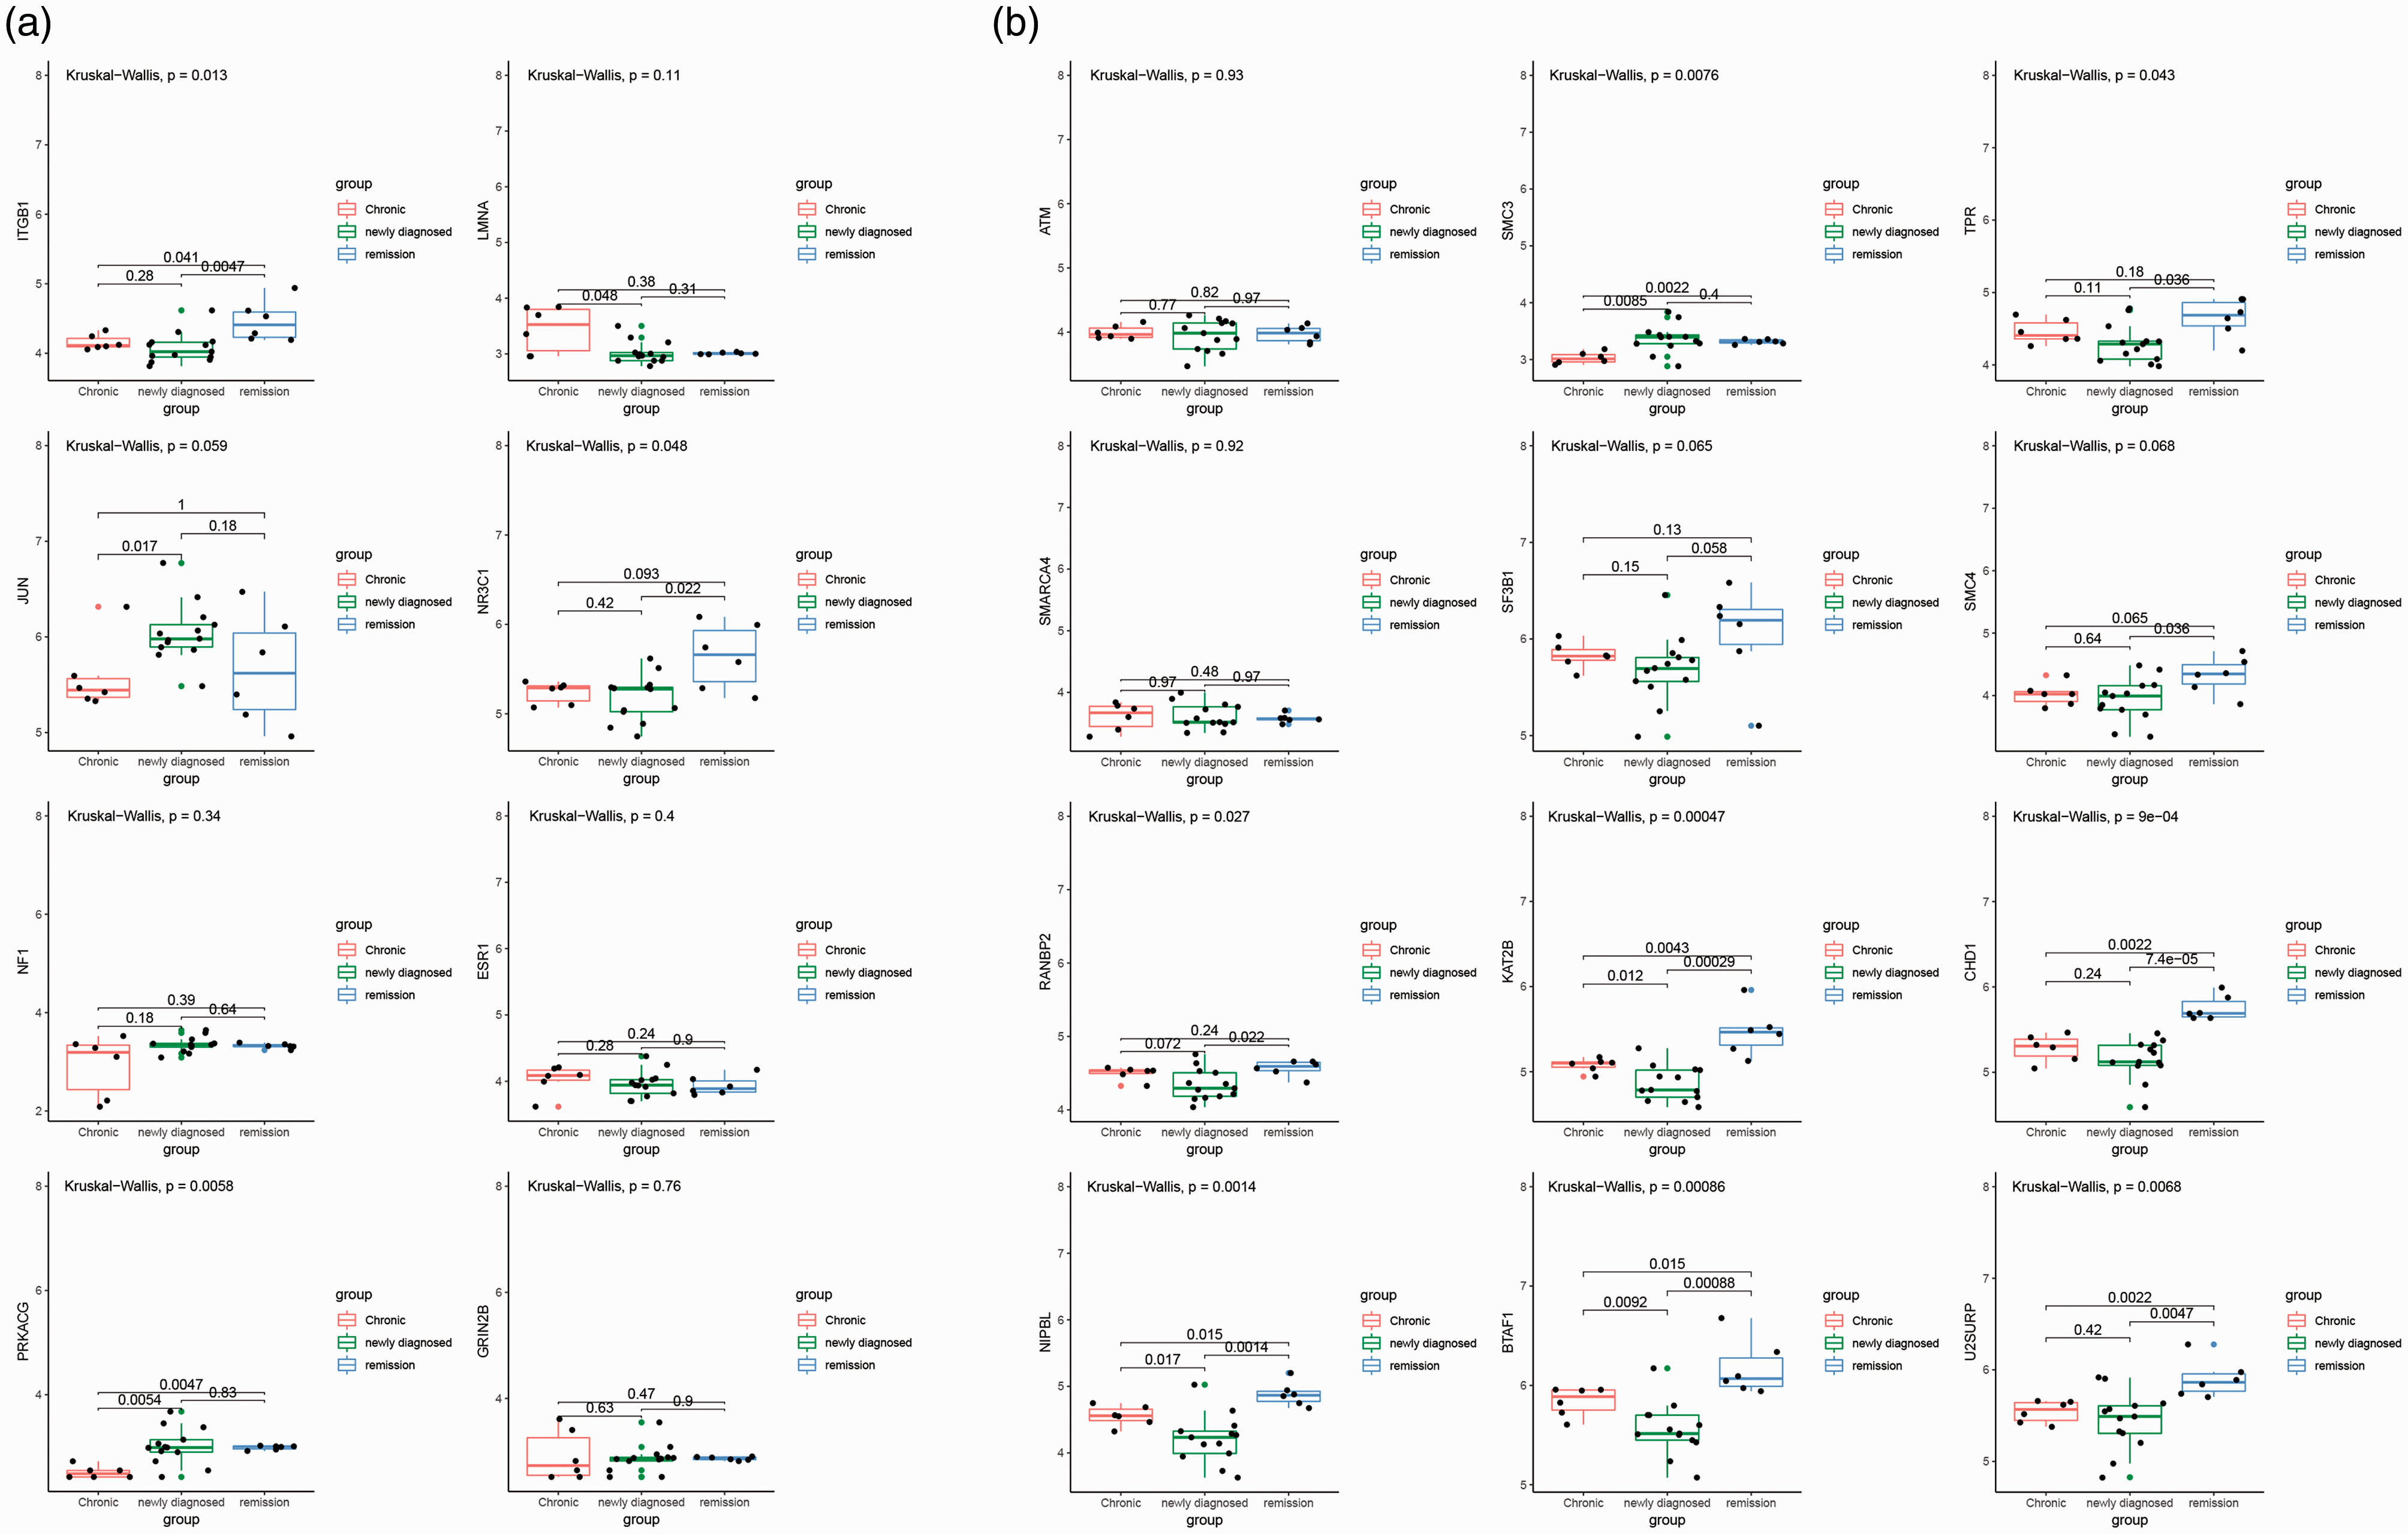
The expression of hub genes in merged datasets from GSE46922 and GSE56232. (a) Box plots of the expression of hub genes related to the chronic ITP phenotype after statistical calculation. (b) Box plots of the expression of hub genes related to the remission ITP phenotype after statistical calculation. The Wilcoxon test was used to compare differences in hub genes among newly diagnosed ITP, chronic ITP, and remission ITP groups. P < 0.05 was used as a cut-off criterion.
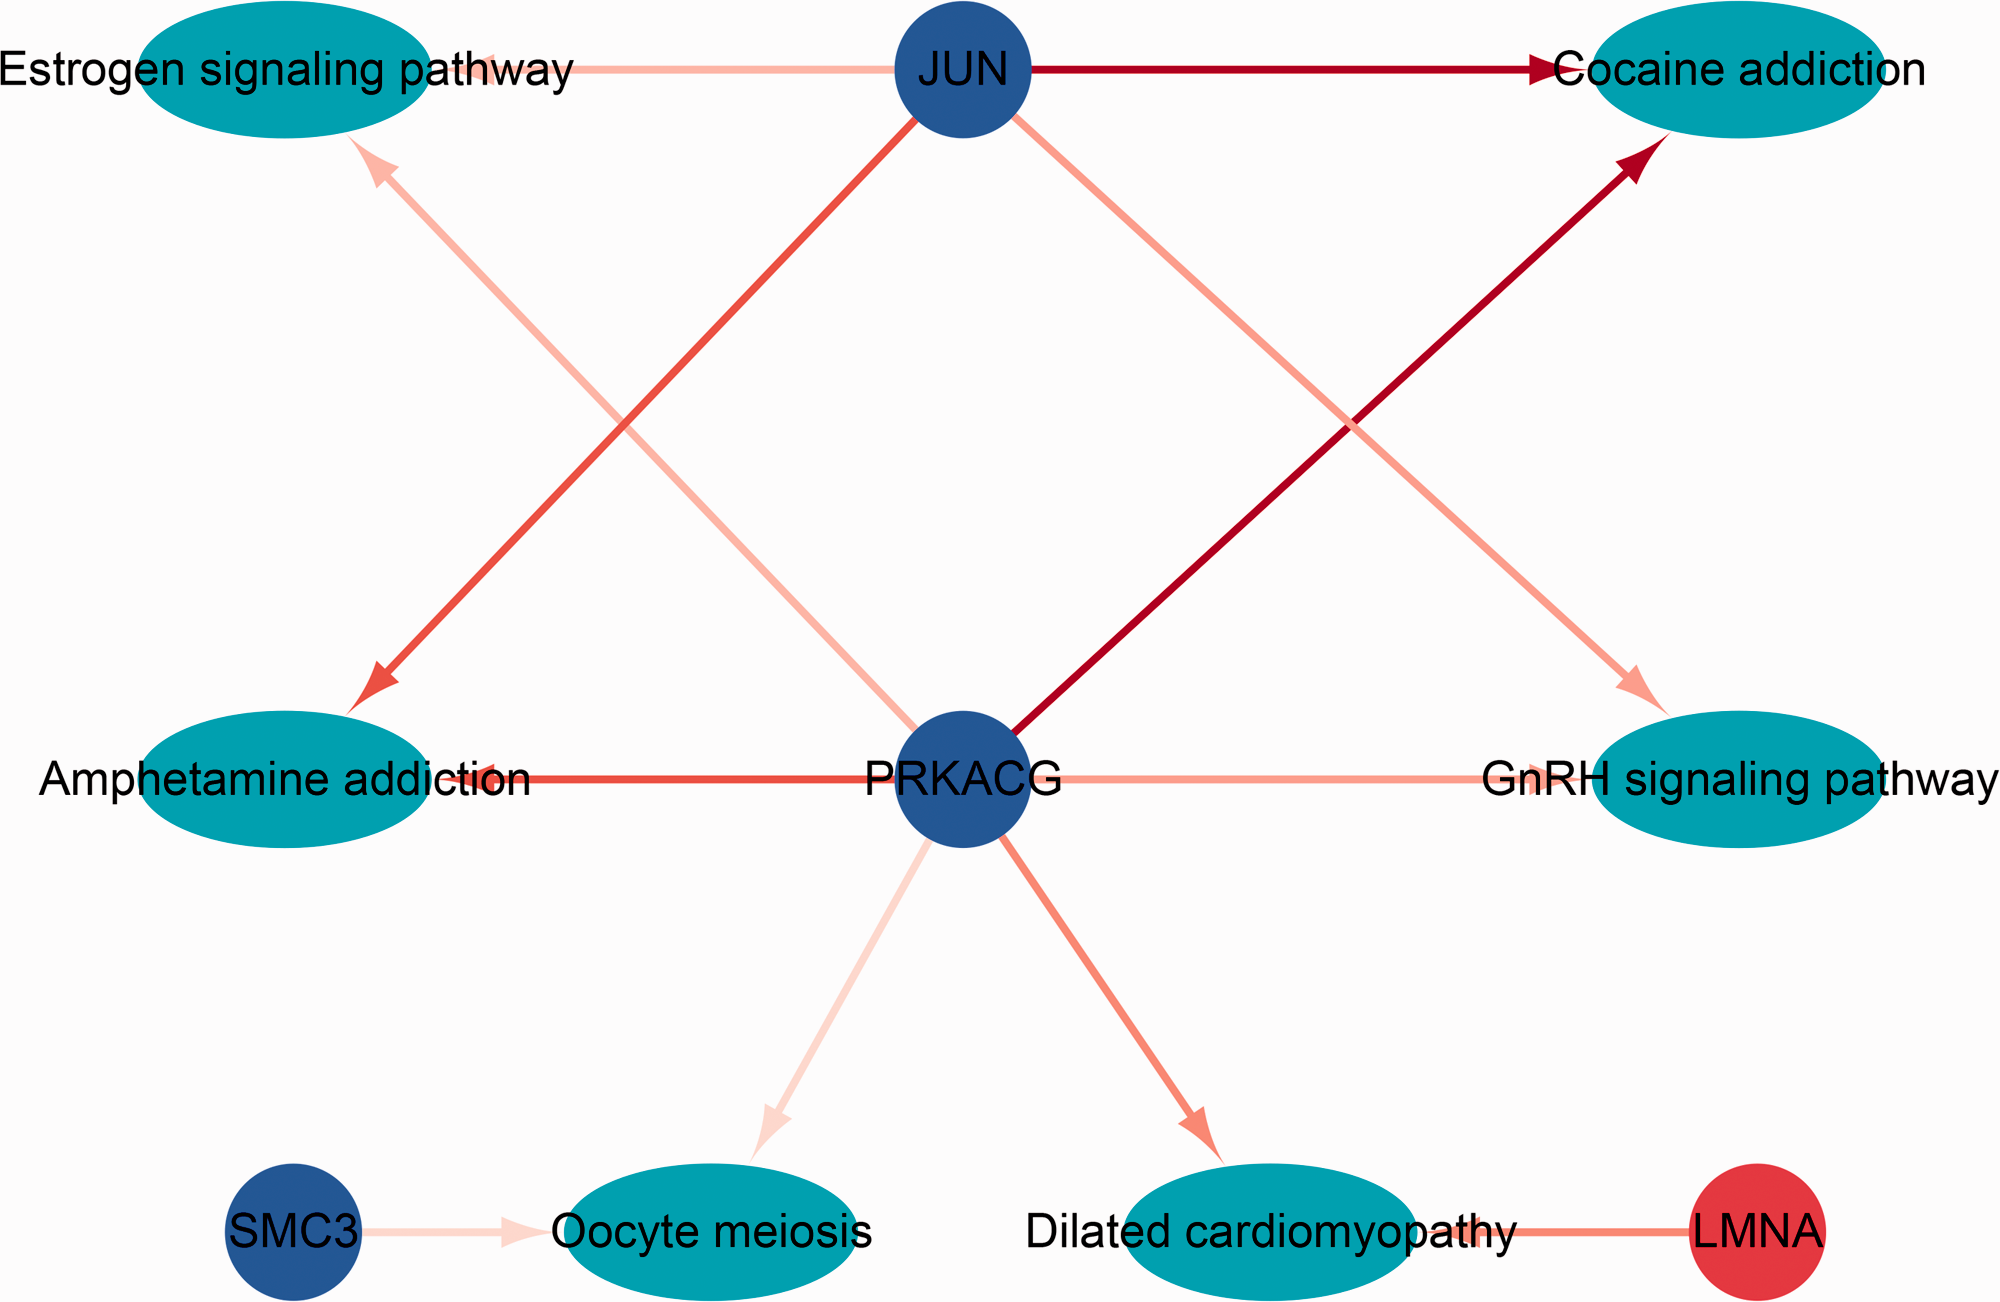
Sub-network of hub genes related to the disease phenotype of chronic ITP. Red represents up-regulated genes while blue represents down-regulated genes. Cyan represents the pathway related to its genes in the network.
Discussion
During the past few decades, specific treatment and management strategies have been identified for ITP patients with different disease phenotypes. 21 Present treatments mainly focus on the inhibition of autoantibody production, platelet degradation, and the stimulation of platelet production by megakaryocytes. 22 , 23 Current first-line therapies for ITP typically use glucocorticoids, whereas immunosuppressants and platelet agonists are employed as second-line drugs. However, although many newly diagnosed ITP patients will progress to chronic or temporary remission after treatment, they can later relapse. Recent reports suggest that the use of cyclosporine or platelet agonists such as eltrombopag can maintain the platelet count to some extent in patients with chronic ITP, 24 , 25 but dysregulated immune mechanisms appear to lead to different outcomes in the medication response. This is largely because most studies have focused on a single genetic event, or lack an understanding of the in-depth underlying molecular mechanisms of ITP. 26 , 27 In our study, we used DEG and WGCNA bioinformatic methods to analyze and compare individuals with chronic and remission ITP against those with newly diagnosed ITP.
Heat maps and volcano maps revealed a distinct distribution of DEGs in chronic and remission ITP groups compared with the newly diagnosed ITP group. This indicates that the constitution of individuals stratified by disease phenotype may be associated with underlying molecular mechanisms. Only a few studies have previously focused on exploring the molecular mechanisms of ITP pathogenesis. One reported the overexpression of genes associated with megakaryopoiesis, platelet adhesion, degranulation, and aggregation in patients treated with eltrombopag, which improved the management of ITP. 28 Another that focused on non-coding RNA found that microRNA (miR)-106b-5p and miR-200c-3p could function as valuable biomarkers to distinguish ITP patients. 29 However, these studies were limited to exploring the differences between patients and healthy controls, while the potential molecular mechanism underlying the progression of ITP has not been elucidated. In our study, we used the newly diagnosed ITP population as a reference to better explain the progression of disease at the molecular level.
The use of a single bioinformatic analysis method has certain limitations with respect to identifying candidate genes related to disease. Several studies have previously explored biomarkers using a combination of WGCNA and DEG identification to ensure reliability.30–32 Therefore, a similar integrated method of analysis was used in our study, and characteristic genes in the chronic ITP group were shown to be mainly enriched in cell structure and function terms, such as organelles, intracellular, and cellular parts. This is consistent with previous reports that target DEGs screened from ITP patients were related to transcription, the cytosol, and protein binding. 33 Another study showed that platelet-associated anti-glycoprotein IIb/IIIa autoantibodies in chronic ITP were frequently directed to cation-dependent conformational antigens, which potentially explains the impact of ion channel-related pathways on ITP disease progression. 34 Interestingly, the characteristic genes in the remission ITP group in our study were not only enriched in pathways related to cytoplasmic physiological activities, but were also involved in biological processes in the nucleus. This indicates that the progression of newly diagnosed ITP to remission may involve nuclear physiological activities, which differs from chronic ITP.
The PPI network of characteristic genes provides an overview of its functional relationship. We showed that several genes, including LMNA, JUN, PRKACG, and SMC3, may have an important impact on the progression of newly diagnosed ITP to chronic ITP, while NR3C1, TPR, SMC4, RANBP2, CHD1, and U2SURP may contribute to the benign outcome of ITP. c-Jun protein is a component of the transcription activator protein 1, which is involved in T cell and B cell receptor signal transduction and regulates various biological processes such as cell proliferation, differentiation, and apoptosis. 35 , 36 c-Jun was also shown to be an important therapeutic target for acute inflammation and rheumatoid arthritis, 37 , 38 while tumor necrosis factor (TNF)-α up-regulated cellular inhibitor of apoptosis protein 2 via the c-Jun N-terminal kinase pathway in nasopharyngeal carcinoma. 39 Therefore, it is conceivable that the relationship between JUN and TNF-α promotes ITP progression to its chronic or remission stage by activating the TNF signaling pathway. One study based on data analysis also confirmed JUN as the candidate gene, which was consistent with our results. 40
Another study identified a potential relationship between lamin A/C (LMNA)-associated generalized lipodystrophy and juvenile dermatomyositis. 41 On this basis we postulate that the observed high LMNA expression in the chronic ITP group in our study is closely related to disease progression. Furthermore, a family-based genetic study demonstrated that the p.74Ile>Met PRKACG mutation is associated with a marked defect in proplatelet formation and low expression of filamin A in megakaryocytes. Additionally, homozygous patients in this family showed severe thrombocytopenia as well as bleeding. 42 Taken together, these findings suggest that the sub-network of pathways associated with the characteristic genes JUN, LMNA, and PRKACG in the chronic ITP group represents a potential molecular mechanism underlying disease.
The human glucocorticoid receptor gene (NR3C1) has been reported to determine the differences and sensitivities of the glucocorticoid response in individuals with autoimmune diseases. 43 , 44 Based on this, changes in NR3C1 expression may affect the efficacy of glucocorticoid therapy in patients with ITP, which could explain the high NR3C1 expression observed in the remission group in our study. Moreover, the function of the glucocorticoid receptor was found to be regulated by the nuclear protein TPR, which is consistent with the co-upregulation of TPR and NR3C1 observed in our study. 45 Combining these findings, we hypothesize that the rational use of glucocorticoids could serve as a beneficial treatment, by regulating NR3C1, for newly diagnosed patients with ITP undergoing remission. The transcription factor CHD1 was previously shown to regulate glucocorticoid signaling during the course of Alzheimer’s disease. 46 Given the complexity of transcription factor regulatory mechanisms, and the observation that CHD1 expression was significantly higher in the remission ITP group than in the newly diagnosed group in our study, it is unclear how CHD1 determines the patient response to drugs. Other characteristic genes related to ITP remission, such as RANBP2 and U2SURP, have never been investigated, so their impact on disease progression should be explored.
Our study has some limitations. First, the data used in our analysis were downloaded from a public database, which lacked important clinical information such as drug history and ITP patient outcomes. Second, the original data used in our study lacked the gene expression profile of healthy children; therefore, it would be necessary to establish a control group in a follow-up study to demonstrate experimental rigor. Finally, because of individual drug treatment differences among patients with ITP, our follow-up research will be devoted to explaining the effects of therapeutic agents on gene profiles in chronic and remission ITP groups; we will also perform in vitro and in vivo experiments focusing on a larger number of clinical samples to validate our findings.
In conclusion, our research used bioinformatics to integrate and analyze gene expression profile data of different ITP phenotypes, and revealed the potential pathways and genes associated with disease progression. Our findings provide new insights into the pathogenesis and progression of ITP.
Supplemental Material
sj-pdf-1-imr-10.1177_0300060520971437 - Supplemental material for Use of bioinformatic analyses in identifying characteristic genes and mechanisms active in the progression of idiopathic thrombocytopenic purpura in individuals with different phenotypes
Supplemental material, sj-pdf-1-imr-10.1177_0300060520971437 for Use of bioinformatic analyses in identifying characteristic genes and mechanisms active in the progression of idiopathic thrombocytopenic purpura in individuals with different phenotypes by Mengyi Zhang and Binhan Guo in Journal of International Medical Research
Footnotes
Authors’ contributions
Binhan Guo conceived and designed the experiments, and analyzed and interpreted the data; Mengyi Zhang collected and assembled the data. Both authors wrote the manuscript and approved the final version.
Declaration of conflicting interest
The authors declare that there is no conflict of interest.
Funding
This research received no specific grant from any funding agency in the public, commercial, or not-for-profit sectors.
Supplemental material
Supplemental material for this article is available online.
References
Supplementary Material
Please find the following supplemental material available below.
For Open Access articles published under a Creative Commons License, all supplemental material carries the same license as the article it is associated with.
For non-Open Access articles published, all supplemental material carries a non-exclusive license, and permission requests for re-use of supplemental material or any part of supplemental material shall be sent directly to the copyright owner as specified in the copyright notice associated with the article.