
Abstract
Objective
Pericardial adipose tissue volume (PATV) is related to the mechanism of coronary artery disease (CAD), but its association with CAD risk factors is not clear. This study aimed to investigate the relationships between PATV and its associated factors.
Methods
A total of 682 inpatients were consecutively enrolled in this study. Patients were divided into the high PATV group (PATV ≥174.5 cm3; n = 506) and low PATV group (PATV < 174.5 cm3; n = 176). Multiple linear regression analysis was conducted to evaluate the related factors of PATV. Multivariable logistic regression was used to analyze the risk factors of CAD.
Results
Left ventricular fat volume, right ventricular fat volume, body mass index, low-density lipoprotein cholesterol, and high-density lipoprotein cholesterol were significant and independent risk factors of enlargement of PATV. Increased PATV was identified as an independent risk factor of CAD, and increased pulse pressure was also independently and positively correlated with CAD.
Conclusions
PATV is significantly correlated with the classic risk factors of CAD. Pulse pressure is also correlated with PATV. PATV is an independent risk factor of CAD, and pericardial adipose tissue may alternatively be used in non-invasive diagnostic examination of CAD.
Keywords
Introduction
Pericardial adipose tissue (PAT) is an extraordinary visceral fat depot that originates from the primitive thoracic mesenchyme. PAT is located outside the visceral pericardium and is internal to the parietal pericardium.1,2 Previous studies have shown that PAT, as a metabolically active endocrine local adipocyte depot, is associated with coronary artery disease (CAD) by producing free fatty acids and pro- and anti-inflammatory adipocytokines.3–6 However, no data from hospital cohorts are available on correlations between the risk factors of CAD and pericardial adipose tissue volume (PATV). Therefore, we hypothesized that PATV is correlated with classic risk factors of CAD, and hypertrophy of PAT is a new risk factor of CAD. This study investigated the relationships between PATV and its associated factors.
Methods
Participants
A total of 2384 inpatients with suspected CAD who underwent coronary computed tomographic angiography (CCTA) at The Affiliated Hospital of Chengde Medical University from September 2015 to June 2017 were included in the study. The patients were divided into two groups of the CAD group (n = 488) and the non-CAD group (n = 1896). The criteria of CAD were as follows: myocardial ischemic symptoms and at least one branch with stenosis ≥50% in the left main, left anterior descending, left circumflex, or right coronary artery. Major exclusion criteria were suspected acute coronary syndrome, connective tissue disease, aortic dissection, constrictive pericarditis, and hypertrophic cardiomyopathy. The patients were divided into the high PATV group (PATV ≥174.5 cm3, n = 506) and low PATV group (PATV < 174.5 cm3, n = 176) according to the optimal computed tomographic (CT) diagnostic cut-off point for PAT volume. The study was approved by the Institutional Review Board of The Affiliated Hospital of Chengde Medical University. This study was carried out in accordance with the World Medical Association’s Code of Ethics (Helsinki Declaration). All patients provided written informed consent.
Demographic and clinical data
Demographic data, including age, sex, height, and weight, and risk factors for CAD, including diabetes, hypertension, dyslipidemia, and ischemic stroke, were collected. Heart rate, systolic blood pressure, diastolic blood pressure, routine blood test results, and biochemistry results were also recorded. Pulse pressure and body mass index (BMI) were calculated. Hypertension was defined as systolic blood pressure ≥140 mmHg (1 mmHg = 0.133 kPa) and/or diastolic blood pressure ≥90 mmHg at rest, or previous diagnosis with hypertension in antihypertensive therapy. 7 Diabetes was defined as follows: symptoms of diabetes and random blood glucose levels ≥11.1 mmol/L, or fasting plasma glucose ≥7.0 mmol/L or 2-h oral glucose tolerance test blood glucose levels ≥11.1 mmol/L; or no diabetes symptoms and at least twice the blood glucose levels that meet the above-mentioned criteria. 8 Dyslipidemia was defined as serum total cholesterol levels ≥5.18 mmol/L (200 mg/dL), high-density lipoprotein cholesterol (HDL-C) levels ≤1.04 mmol/L, low-density lipoprotein cholesterol (LDL-C) levels ≥3.37 mmol/L, or triglyceride levels ≥1.7 mmol/L, or a previous diagnosis of dyslipidemia in medication. 9 Overweight was defined as BMI ≥24 kg/m2 according to the Chinese diagnostic standard.
PATV measurement by CCTA
All CCTA scans were performed on a 128-slice CT scanner during breath-holding by experts in radiology. PATV was measured through a CCTA workshop by Masters students in radiology and cardiology using the radiology semi-automatic software program AW4.7 on a CT workstation (General Electric, Chicago, IL, USA). We manually tracked and drew the pericardium layer by layer with a threshold of −190 to −30 HU. The coronary artery calcification (CAC) score was defined as at least four consecutive pixels with a CT density of 130 HU (Agatston method). The total Agatston CAC score was calculated by summing the scores of all coronary arteries. 10
Statistical analysis
Data processing and statistical analysis were performed using the Statistical Package for Social Sciences, version 19 software (SPSS Inc., Chicago, IL, USA). All continuous variables showed a skewed distribution and were analyzed by the Shapiro–Wilk test, and are expressed as median and interquartile range. The Mann–Whitney U test was used to compare the relationship of all continuous variables between the two groups. Categorical variables are presented as number (%), and the chi-square test was used to compare these variables between the two groups. PATV was normally distributed, and Pearson’s and Spearman’s tests were used to analyze the correlations between PATV and continuous variables. Multiple linear regression analysis was conducted to evaluate factors related to PATV. Multivariable logistic regression analysis was performed to further determine PATV as a predictor of CAD. Receiver operating curve analysis was used to determine the best diagnostic cut-off point for PATV. All statistical analyses were two-sided and a p value <0.05 was considered statistically significant.
Results
Baseline demographic and clinical characteristics
A total of 200 non-CAD participants were screened by the simple randomized method and 482 patients with CAD were enrolled in this study (Figure 1). All baseline demographic and clinical characteristics of the patients are shown in Table 1. The morbidity of CAD, diabetes, dyslipidemia, hypertension, and overweight, and a CAC score ≥100 were significantly higher in the high PATV group than in the low PATV group (all p < 0.05). In the high PATV group, the prevalence of hypertriglyceridemia and serum HDL-C levels ≤1.04 mmol/L was significantly higher than that in the low PATV group (both p < 0.05). Moreover, increased pulse pressure, abnormal ventricular wall motion, and enlarged left ventricular end-diastolic diameter (LVEDD) in echocardiography were significantly more common in the high PATV group than in the low PATV group (all p < 0.05). However, there were no significant differences in age, leukocytes, neutrophils, lymphocytes, platelets, uric acid, creatinine, and the prevalence of ischemic stroke between the two groups. Interestingly, left and right ventricular fat volumes were significantly higher in the high PATV group than in the low PATV group (both p < 0.001).

Screening flowchart of all of the patients enrolled in the study.
Baseline characteristics of the patients.

Data are presented as number (%) of patients or median (interquartile range).
PATV: pericardial adipose tissue volume; BMI: body mass index; CAC: coronary artery calcification; CAD: coronary artery disease; LVEDD: left ventricular end-diastolic diameter; HDL-C: high-density lipoprotein cholesterol; LDL-C: low-density lipoprotein cholesterol; HGB: hemoglobin; LV: left ventricular; RV: right ventricular.
Correlations between clinical parameters and PATV
A significant positive relation was found between BMI and PATV (r = 0.424, p < 0.001). Left and right ventricular fat volumes were positively related to PATV (r = 0.296, p < 0.001; r = 0.364, p < 0.001, respectively). LVEDD was also positively related to PATV (r = 0.275, p < 0.05). HDL-C levels in the lipid profile were negatively related to PATV (r = −0.127, p < 0.001). However, triglyceride and LDL-C levels were positively correlated with PATV (r = 0.142, p < 0.001; r = 0.081, p = 0.046, respectively). PATV was also positively correlated with age (r = 0.135, p < 0.001), the CAC score (r = 0.192, p < 0.001), pulse pressure (r = 0.087, p = 0.023), leukocytes (r = 0.142, p < 0.001), hemoglobin (r = 0.110, p = 0.005), uric acid (r = 0.125 p = 0.002), and creatinine (r = 0.134, p = 0.001) (Table 2).
Correlations between clinical parameters and PATV.
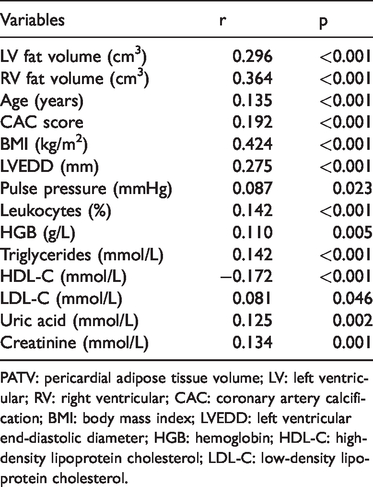
PATV: pericardial adipose tissue volume; LV: left ventricular; RV: right ventricular; CAC: coronary artery calcification; BMI: body mass index; LVEDD: left ventricular end-diastolic diameter; HGB: hemoglobin; HDL-C: high-density lipoprotein cholesterol; LDL-C: low-density lipoprotein cholesterol.
Risk factors of enlargement of PATV
Multiple linear regression models were used to determine independent risk factors of enlargement of PATV. Left ventricular fat volume, right ventricular fat volume, BMI, sex, LDL-C, HDL-C, and the prevalence of hypertension and diabetes were independent risk factors of enlargement of PATV (all p < 0.01). Additionally, right ventricular fat volume had the greatest effect on PATV among all of the above-mentioned factors (Table 3).
Multiple linear regression analysis for PATV.

PATV: pericardial adipose tissue volume; LV: left ventricular; RV: right ventricular; BMI: body mass index; LDL-C: low-density lipoprotein cholesterol; HDL-C: high-density lipoprotein cholesterol.
Receiver operating curve and diagnostic test of enlargement of PATV with CAD
The receiver operating curve and diagnostic test of enlargement of PATV based on the prevalence of CAD showed that the area under the curve of PATV was 0.665 (95% confidence interval: 0.622–0.708, p < 0.001). The optimal diagnostic cut-off point for PATV was 174.5 cm3, and the sensitivity and specificity were 0.799 and 0.395, respectively. The positive and negative predictive values were 0.761 and 0.499, respectively. The positive/negative likelihood ratios were 1.320 and 0.509, respectively (Figure 2).
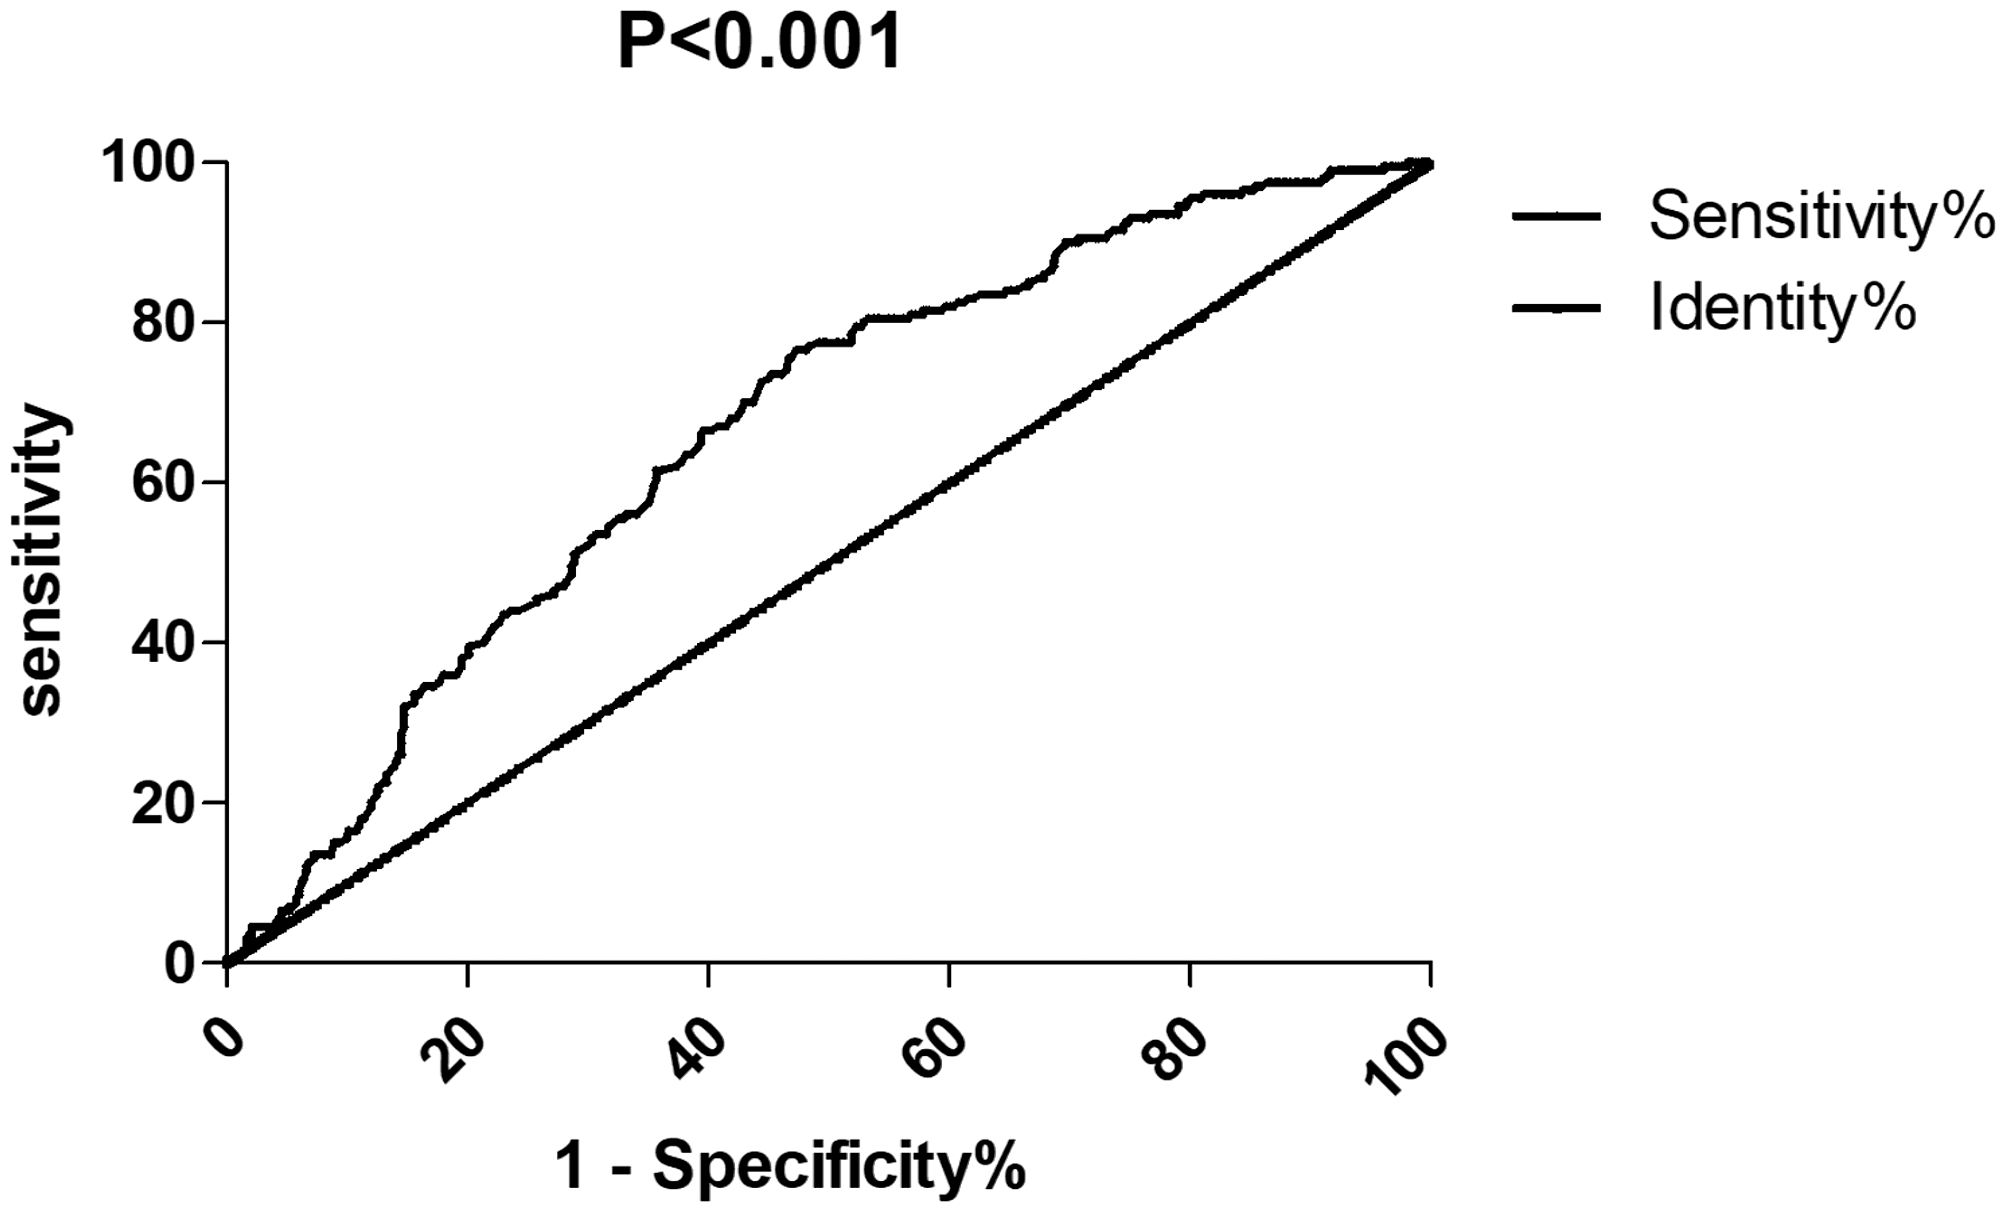
Receiver operating characteristics curve analysis of pericardial adipose tissue volume between the coronary artery disease and non-coronary artery disease groups.
Comparison of C-statistics in various subgroups
The C-statistics of male and female subgroups were 0.681 (0.618–0.743) and 0.643 (0.581–0.705), respectively (both p < 0.001). The C-statistics of the older and young-middle age subgroups were 0.642 (0.539–0.745) and 0.670 (0.621–0.718), respectively (both p < 0.05). The predictive value of PATV for the male and young-middle aged CAD subgroups was greater than that for the female and older subgroups, respectively.
Risk factors of CAD
The variables were screened to be entered into a multivariate logistic regression model to test for risk factors of CAD. Increased PATV was identified as an independent risk factor of CAD, besides the classic risk factors, including hypertension, diabetes, ischemic stroke, and increased LDL-C levels (all p < 0.05), with odds ratios of 2.050, 1.963, 2.008, 2.832, and 1.916, respectively. The odds ratio of increased PATV was similar to odds ratios of classic risk factors (e.g., hypertension, diabetes, and increased LDL-C levels). Interestingly, increased pulse pressure was independently and positively correlated with CAD (p = 0.022) (Table 4).
Multiple logistic regression of CAD risk factors and PATV.

CI: confidence interval; LDL-C: low-density lipoprotein cholesterol; PATV: pericardial adipose tissue volume.
Discussion
We found that PATV was significantly related to the classic risk factors of CAD. Age, BMI, hypertension, diabetes mellitus, serum triglyceride levels, and LDL-C levels were positively correlated with PATV, whereas HDL-C levels were negatively correlated with PATV. To the best of our knowledge, age, hypertension, diabetes, dyslipidemia, overweight, and coronary calcification are risk factors of CAD.11–13 Suk et al. 14 showed that the amount of PAT was associated with some risk factors of cardiovascular diseases. In the Framingham Heart Study, BMI was significantly associated with PAT volume. 15 Previous studies showed that older age, male sex, higher BMI, hypertension, diabetes, and hypercholesterolemia were correlated with PAT volume.16–19 PATV was also reported to be associated with metabolic diseases. 20
In the current study, left and right ventricular fat volumes were positively related to PAT, and right ventricular fat volume showed a greater effect on PATV than left ventricular fat volume. Additionally, LVEDD was positively related to PATV. Increased PATV affects left and right ventricular fat volumes, which may promote secretion of adipocytokines from adipose tissues, thereby exacerbating heart function and promoting CAD. Fatty infiltration of the myocardium, increased fibrosis, endothelial dysfunction, and inflammatory and oxidative stress of adipocytokines from PAT are the major pathophysiological mechanisms of PAT, provoking and increasing the risk of CAD.21,22 Enlargement of PATV has an unfavorable effect on structure and function of the heart. A cohort study showed significant correlations between PATV and several hemodynamic and diastolic functional parameters of the left ventricle. 23 A previous study also showed that PAT was associated with systolic and diastolic dysfunction in patients with type 2 diabetes. 24 Shah et al., 25 Hua et al., 26 and Pucci et al. 27 found that PATV enlargement affected mass remodeling and hemodynamic and diastolic function of the left ventricle, among which left ventricular function showed a curvilinear association with PATV. Additionally, PATV is also associated with mass and dysfunction of the right ventricle. 28
The present study also investigated the correlation between pulse pressure and PATV. To the best of our knowledge, this is the first study to show that left and right ventricular fat volumes were positively correlated with PATV. Enlargement of PATV may increase pulse pressure, coronary atherosclerosis, and coronary stenosis. Local secretion of inflammatory and oxidative stress biomarkers from PATV may promote endothelial dysfunction, proliferation of coronary vascular smooth muscle cells, and coronary atherosclerosis. 29 Cicero et al. 30 reported that PAT is a biomarker of vascular aging and related to the atherosclerotic plaque burden. Therefore, pulse pressure is an independent risk factor of enlargement of PATV, and this enlargement may be a good predictive factor for increased pulse pressure. Previous studies have reported that pulse pressure is associated with cardiovascular adverse events.31,32 Kim et al. 33 found that pulse pressure was associated with obstructive CAD, and was a simple and useful indicator of CAD, particularly in women.
In our study, the CAC score, blood leukocytes, hemoglobin, uric acid, and creatinine were positively linearly correlated with PATV. A higher PATV has a greater amount of inflammatory cells and higher inflammatory gene expression, which is associated with chronic elevation of inflammatory markers.34,35 Our study is in line with previous findings that PATV was positively correlated with coronary calcium. 36 , 37
Increasing evidence has shown that PAT is correlated with the presence and severity of CAD, and increased PAT is a risk factor of CAD.19,38–40 The amount of PAP is an independent predictor of extensive coronary and intra-coronary plaque burden. 41 PAT also plays a major role in the pathophysiology of coronary endothelial dysfunction, which includes promoting the release of atherogenic cytokines and contributing to hypercoagulability and intramyocardial pimelosis. 41 Okura et al. 42 showed that anomalous accumulation of PAT was related to the severity of CAD in patients with preserved ejection fraction heart failure. Taguchi et al. 43 found that accumulation of PAT was a stronger coronary risk factor than other body areas of fat in non-obese people. Therefore, our study further confirmed that increased PATV was associated with CAD, and PAT may alternatively be used in a non-invasive examination of CAD.
The present study has some limitations. First, the sample was relatively small and the inpatients were enrolled from a single hospital. This might have led to selection bias and restricted generalization of our findings. Second, we were not able to perform inter- and intra-observer variability tests. Third, the design of this study was retrospective and lacked a healthy control group.
Conclusions
This retrospective study shows that PATV is correlated with the classic risk factors of CAD and is a possible new independent risk factor of CAD. Left and right ventricular fat volumes are positively correlated with PATV. Interestingly, pulse pressure is correlated with PATV. Our study indicates that enlargement of PATV is associated with CAD, and PAT can be used in a non-invasive diagnostic examination of CAD.
Footnotes
Acknowledgements
The authors are grateful to the assistance provided by cardiology and radiology doctors and nurses at The Affiliated Hospital of Chengde Medical University.
Declaration of conflicting interest
The authors declare that there is no conflict of interest.
Funding
This study was supported by a grant from Hebei Province Government Science and Technology Agency (Grant no. 17277769D) to Dr. Lixian Sun.
Supplemental material
Supplemental material for this article is available online.