
Abstract
Objective
To elucidate the molecular mechanisms by which safflower yellow (SY) mediates therapeutic effects in rats with paraquat intoxication-induced pulmonary fibrosis.
Methods
Rats received combinations of paraquat, SY, and SB431542, a transforming growth factor (TGF)-β1 receptor antagonist. Survival over 28 days was assessed by Kaplan–Meier analysis. Rat tissue and serum samples were assessed by hematoxylin and eosin staining, Masson’s Trichrome staining, immunoblotting, quantitative polymerase chain reaction, enzyme-linked immunosorbent assay, and transmission electron microscopy.
Results
Survival rates were higher in SY and SB431542 groups (treatment and paraquat) than in the exposure group (paraquat alone). In the exposure group, serum TGF-β1 levels increased between days 3 and 14; mammalian STE20-like (MST) levels increased between days 3 and 7; TGF-β1 and Smad3 levels increased between days 3 and 14; and Yap and connective tissue growth factor levels increased between days 3 and 28. TGF-β1 levels were lower in SY and SB431542 groups than in the exposure group. Pathology scores were higher in exposure, SY, and SB431542 groups than in the control group throughout the experiment.
Conclusions
In rats with paraquat intoxication-induced pulmonary fibrosis, Hippo signaling could be activated by the MST-Yap pathway; SY and SB431542 could alleviate pulmonary fibrosis via Hippo signaling.
Keywords
Introduction
Paraquat, also known as 1-1′-dimethyl-4-4-bipyridinium, mainly acts on the chloroplast layer of green plants, where it exhibits an herbicidal effect by inducing excessive production of reactive oxygen species. 1 China has become a major producer and consumer of this reagent in recent years; 2 in addition, paraquat has become the main cause of lethal pesticide poisoning in some areas of China, such that the mortality rate of paraquat poisoning is reportedly 60% to 90%. 3 Several studies have shown that transforming growth factor (TGF)-β1 is involved in paraquat-induced pulmonary fibrosis.4,5 There is increasing evidence that TGF-β1 induces pulmonary fibrosis through connective tissue growth factor (CTGF)-mediated stimulation of stromal cell proliferation and extracellular matrix synthesis.6,7 However, the detailed molecular mechanisms of paraquat poisoning remain unclear.
The Hippo signaling pathway is reportedly involved in the regulation of cell proliferation, differentiation, and apoptosis through its effector molecule Yap, which is closely associated with the occurrence and development of tumors. 8 The Hippo signaling pathway is also presumed to be closely related to the occurrence of many other human diseases, including aortic aneurysm, tissue fibrosis, and viral hepatitis.9,10 Moreover, the Hippo and TGF-β1 signaling pathways are important for regulating CTGF expression. 11 Therefore, the Hippo signaling pathway may play a role in the pathogenesis of paraquat-induced pulmonary fibrosis.
Safflower is a commonly used traditional Chinese medicine that promotes blood circulation and removes blood stasis. Safflower yellow pigment, the main active ingredient, is a water-soluble safflower extract; its main component is hydroxysafflor yellow (>85%), injections of which have been clinically used to treat ischemic cardiovascular and cerebrovascular diseases. 12 In addition, safflower yellow pigment exhibits antioxidative, anti-inflammatory, and antifibrotic effects. 13 Recent research has shown that safflower yellow can inhibit the expression of TGF-β1, TIMP-1, and collagen; it also exhibits therapeutic effects with respect to liver fibrosis, renal interstitial fibrosis, and pulmonary fibrosis.14,15 Therefore, safflower yellow pigment may be useful in treatment of paraquat-induced pulmonary fibrosis. However, there remains insufficient evidence regarding the detailed molecular mechanisms by which safflower yellow mediates therapeutic effects in the context of paraquat intoxication-induced pulmonary fibrosis. Here, we investigated the tissue pathologies and mRNA and protein expression levels in the Hippo signaling pathway in rats treated with combinations of paraquat, safflower yellow, and SB431542, a TGF-β1 receptor antagonist. 16 The results can provide a theoretical basis for treatment of paraquat-induced pulmonary fibrosis with safflower yellow pigment.
Materials and methods
Animals
The animals used in this experiment were supplied by the Experimental Animal Center of Shandong University. In total, 255 6-week-old specific pathogen-free male Wistar rats (235–265 g) were used in this study. Food and drinking water were provided in accordance with the standards of the Experimental Animal Center of Qilu Hospital of Shandong University. The experimental environment was as follows: 12-hour light/dark cycle; water ad libitum; room temperature and humidity of 25°C and 40% to 60%, respectively. All rats underwent adaptive feeding for 7 to 10 days in the Experimental Animal Center before the experiment. This experiment was approved by the Ethics Committee of Qilu Hospital of Shandong University.
Experimental groups and collection of samples
After adaptive feeding had been completed, the 255 rats were randomly divided into six groups: blank control (BC, n = 35), safflower yellow pigment control (SY Con, n = 35), SB431542 control (SB Con, n = 35), exposure (Exp, n = 50), safflower yellow pigment intervention (SY Int, n = 50) and SB431542 intervention (SB Int, n = 50). Rats in the BC, SY Con, and SB Con groups underwent intragastric administration of 1 mL injection water after they had fasted for 16 hours. Rats in the Exp, SY Int, and SB Int groups underwent administration of 1 mL injection water with 50 mg/kg paraquat solution (20% volume fraction) via intraperitoneal injection, after they had fasted for 16 hours. Rats in the SY Int group underwent daily administration of 1 mL of injection water with 50 mg/kg safflower yellow via intraperitoneal injection. Rats in the SB Int group underwent daily administration of 1 mL injection water with 100 μg/kg SB431542 through intraperitoneal injection. Rats in the other groups underwent daily administration 1 mL injection water through intraperitoneal injection. Six rats were sacrificed in each group on days 3, 7, 14, 21, and 28 after the start of the experiment. Rats were euthanized by intraperitoneal injection of an overdose of 300 mg/kg body weight of 10% (w/v) chloral hydrate solution (National Drug Approval no. H37022673, Qingdao Yulong Algae Co., Ltd., Qingdao, China), then were placed under a heat lamp to maintain normal body temperature. For humane endpoint criteria, we followed the main recommendations by Morton. Changes in body weight, physical appearance and behavior were scored as previously reported. 17 All experimental protocols adhered to the guidelines of the Animal Welfare Committee of the Qilu Hospital of Shandong University. After rats had been euthanized, 6 to 8 mL of blood were collected from the abdominal aorta. Blood samples were placed in a 37°C water bath for 2 hours, then centrifuged at 1,200 × g for 15 minutes. The supernatant was stored at −80°C for further analysis. After blood had been collected, bilateral lung tissues were carefully removed. Lung tissue from the right lower lobe was fixed in 10% neutral formaldehyde. The left lower lobe was rapidly divided into small pieces of approximately 1 × 1 mm with a sharp blade. The samples were immersed in electron microscope fixative solution. The right middle lobe was frozen at −80°C until further analysis.
Enzyme-linked immunosorbent assay
Rat serum samples were removed from −80°C storage and returned to room temperature. A commercial enzyme-linked immunosorbent assay kit was used to quantify serum TGF-β1, in accordance with the manufacturer’s protocol (Lianke Biotech, Hangzhou, China).
Quantitative reverse transcriptase polymerase chain reaction (qRT-PCR)
mRNA was extracted from frozen rat lung tissue using the TaKaRa MiniBEST Universal RNA Extraction Kit (TaKaRa Bio, Shiga, Japan). cDNA was reverse transcribed from 400 ng total RNA in 100 µL final volume, using a high capacity cDNA Archive kit (Applied Biosystems, Foster City, CA, USA), in accordance with manufacturer’s instructions. Mammalian STE20-like (MST), TGF-β1, Yap, Smad3, and CTGF mRNA levels were determined by qRT-PCR, using glyceraldehyde 3-phosphate dehydrogenase (GAPDH) as the reference gene. The following primers were used: TGF-β1 (Forward (F): 5′-GGCGGTGCTCGCTTTGTA-3′; Reverse (R): 5′-TCCCGAATGTCTGACGTATTGA-3′), Smad3 (F: 5′-CGAGAACACTAACTTCCCCGCT-3′; R: 5′-GTGGTTCATCTGGTGGTCGCTA-3′), MST (F: 5′-AGCTCGATCCCTCCTTCATC-3′; R: 5′-TGGATCTCCTCTGGGCTCTT-3′), CTGF (F: 5′-CCAACTATGATGCGAGCCAACT-3′; R: 5′-TTAGCCCGGTAGGTCTTCACACT-3′), YAP (F: 5′-TTCCTGATGGATGGGAGCAAG-3′; R: 5′-CAGCCAGGATGTGGTCTTGTT-3′), and GAPDH (F: 5′-TTCCTACCCCCAATGTATCCG-3′; R: 5′-CATGAGGTCCACCACCCTGTT-3′). Reactions were performed in 10-µL volumes. The 10-µL qRT-PCR system contained 5 µL 2X SsoAdvanced™ Universal SYBR® Green Supermix (BioRad, Hercules, CA, USA), 0.5 µL primers (5 pmol each), 0.5 µl DNA template (approximately 20 ng), and 4 µL ddH2O. The thermocycler protocol was as follows: 94°C for 3 minutes, then 40 cycles of 95°C for 15 seconds and 60°C for 25 seconds. The ΔΔCt method was used to calculate mRNA expression levels.
Immunoblotting
Total protein samples from each group were extracted with pre-cooled cell lysate (volume ratio of phenylmethylsulfonyl fluoride to radioimmunoprecipitation assay buffer cell lysate = 1:120). Protein loading buffer was added to the collected protein samples, and each mixture was heated in a 100°C boiling water bath for 5 minutes. Proteins were separated by gel electrophoresis, then transferred onto a polyvinylidene difluoride membrane (Millipore, Billerica, MA, USA). After the membrane had been blocked for 1 hour at room temperature, it was incubated with one of the following primary antibodies: rabbit polyclonal anti-mouse MST (Cat. No. PA5-36100, 1:1000 dilution; Invitrogen, Carlsbad, CA, USA), TGF-β1 (Cat. No. MA5-15065, 1:1500 dilution; Invitrogen), Yap (Cat. No. PA1-46189, 1:1200 dilution; Invitrogen), Smad3 (Cat. No. PA5-34774, 1:1500 dilution; Invitrogen), or CTGF (Cat. No. PA5-32193, 1:1500 dilution; Invitrogen) for 12 hours at 4°C. Then, the membrane was incubated with the corresponding secondary antibody (Cat. No. BA1054-0.5, 1:2000 dilution; Boster Bio, Wuhan, China) for 1 hour at room temperature. The Odyssey Infrared Imaging System (LI-COR Biosciences, Lincoln, NE, USA) was used to observe the results of immunoblotting analysis.
Hematoxylin and eosin staining and Masson’s trichrome staining
Lung tissues with a minimum diameter of >2 cm were collected and immediately stored in liquid nitrogen for DNA extraction and staining. All specimens were subjected to autolysis for 4 to 8 hours, then snap-frozen at −80°C until further use. Samples were fixed in 10% buffered formalin, then embedded in paraffin; 3- to 5-µm-thick sections were stained with hematoxylin (Cat. No. H3136, Sigma-Aldrich, St. Louis, MO, USA) for 10 minutes and with eosin (Cat. No. E4382, Sigma-Aldrich) for 1 minute to establish the diagnostic areas. In addition, 3- to 5-µm-thick sections were stained with Masson’s Trichrome Stain Kit, in accordance with the manufacturer’s protocol (Solarbio, Beijing, China). Subsequently, two senior pathologists observed the pathological changes using an optical microscope. Pathology scores were assessed using the method described by Szapiel et al. 18 The pathological score consisted of alveolar inflammation and pulmonary fibrosis scores. The criteria for alveolitis were as follows: grade 0, normal alveolar morphology, no alveolar inflammation; grade I, mild alveolitis, alveolar septum widened by inflammatory cell infiltration; grade II, moderate alveolitis; grade III, severe alveolitis, a large number of infiltrating inflammatory cells, and diffusely distributed lesions. The criteria for pulmonary fibrosis were as follows: grade 0, normal lung tissue, with few or no filamentous collagen fibers; grade I, slight increase in collagen fibers with thin bundle morphology; grade II, moderate increase in collagen fibers fused into fine bands, with alveolar structure disorder; grade III, substantial increase in collagen fibers into a broadband or flaky morphology, with alveolar collapse and fusion, as well as structural disorder. Alveolar inflammation and pulmonary fibrosis scores were 0 points for grade 0, 2 points for grade I, 3 points for grade II, and 4 points for grade III; these scores were used for statistical analysis.
Transmission electron microscopy
Lung tissues were analyzed by transmission electron microscopy using negative staining. Three-micrometer-thick sections were placed on Formvar/carbon coated copper mesh grids, washed three times with PBS, and fixed with 2.0% phosphotungstic acid in aqueous suspension. Samples were examined with a Hitachi 7100 transmission electron microscope (Hitachi Medical Corporation, Tokyo, Japan).
Statistics
All data are expressed as mean ± standard deviation and were analyzed by using SPSS Statistics, version 19.0 (IBM Corp., Armonk, NY, USA). Normally distributed data were analyzed by one-way analysis of variance, while non-normally distributed data were analyzed by the rank-sum test. P < 0.05 was considered statistically significant. Survival rates were assessed using Kaplan–Meier analysis. Associations among TGF-β1, Smad3, and Yap protein expression levels were determined by Pearson analysis.
Results
Analysis of survival
Survival rate analysis was performed to assess the effects of paraquat, safflower yellow pigment, and SB431542 (Figure 1). There were no differences in survival among the BC, SY Con, and SB Con groups. However, the survival rate was significantly higher in the BC group than in the Exp, SY Int, and SB Int groups (P < 0.05). Moreover, survival rates were significantly higher in the SY Int and SB Int groups than in the Exp group (P < 0.05). These results suggested that paraquat exposure could reduce the rats’ survival, and that the impact of paraquat exposure could be relieved by treatment with safflower yellow pigment or SB431542.

Rates of survival among groups over time.
Serum concentrations of TGF-β1
Figure 2 shows the serum concentrations of TGF-β1 in all groups. There were no differences in serum concentrations of TGF-β1 among the BC, SY Con, and SB Con groups. The serum concentration of TGF-β1 in the Exp group progressively increased from day 3 to day 14, then gradually decreased until day 28. The absolute value of the serum concentration of TGF-β1 on day 28 remained higher in the Exp group than in the BC group on day 28 (P < 0.05). In addition, the serum concentrations of TGF-β1 were also higher in the Exp group than in the BC group on days 3, 7, 14, and 21 (P < 0.05 for all). Moreover, the serum concentrations of TGF-β1 in the Exp group were higher in the SY Int and SB Int groups; however, the absolute values of the serum concentrations of TGF-β1 at all time points were lower in the SY Int and SB Int groups than in the Exp group (P < 0.05 for all). In summary, the serum concentrations of TGF-β1 in rats were positively correlated with paraquat exposure and negatively correlated with safflower yellow pigment and SB431542 treatments.
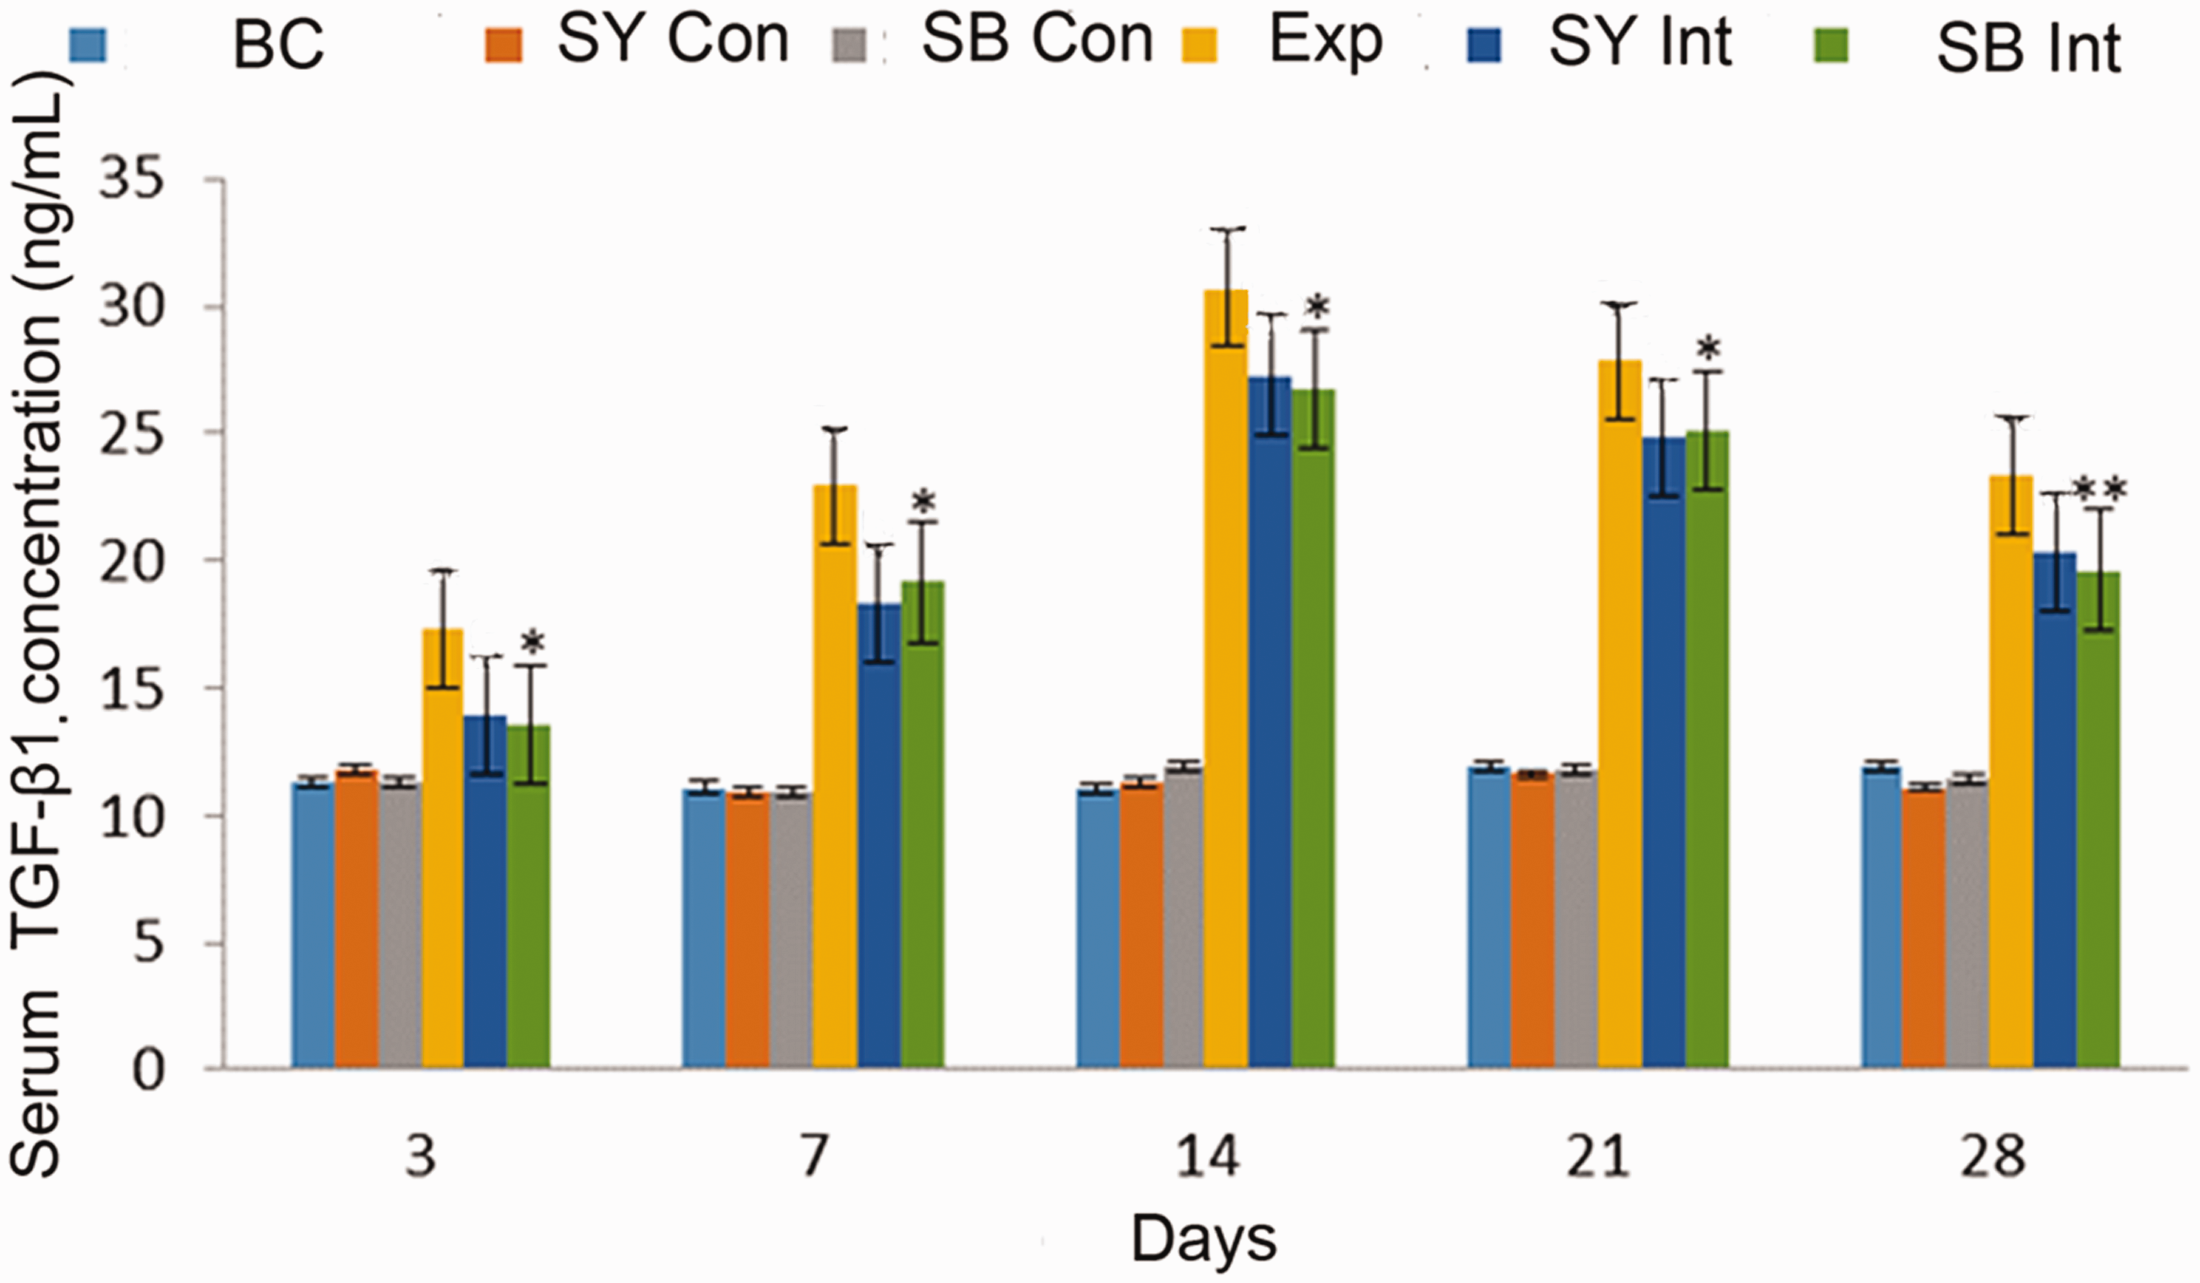
Enzyme-linked immunosorbent assay analysis of serum TGF-β1 concentrations among groups over time. Serum concentrations of TGF-β1 were positively correlated with paraquat exposure and negatively correlated with safflower yellow pigment treatment and SB431542 treatment. Exp vs BC: aa (P < 0.01), a (P < 0.05); Exp vs SY Int: bb (P < 0.01), b (P < 0.05); Exp vs SB Int: **(P < 0.01), *(P < 0.05).
Analysis of MST, TGF-β1, Yap, Smad3, and CTGF expression levels in lung tissues
qRT-PCR and immunoblotting analysis were used to investigate the mRNA and protein expression levels of key components of the Hippo and TGF-β1 signaling pathways in lung tissues from each group. qRT-PCR analysis revealed that the MST mRNA expression level in lung tissue from rats in the Exp group decreased from day 3 to day 7, then increased slowly until day 28. The absolute value of the MST mRNA expression level remained lower in the Exp group than in the BC group on day 28 (P < 0.05). There were no significant differences in MST mRNA expression levels among the BC, SY Con, and SB Con groups (Figure 3a).
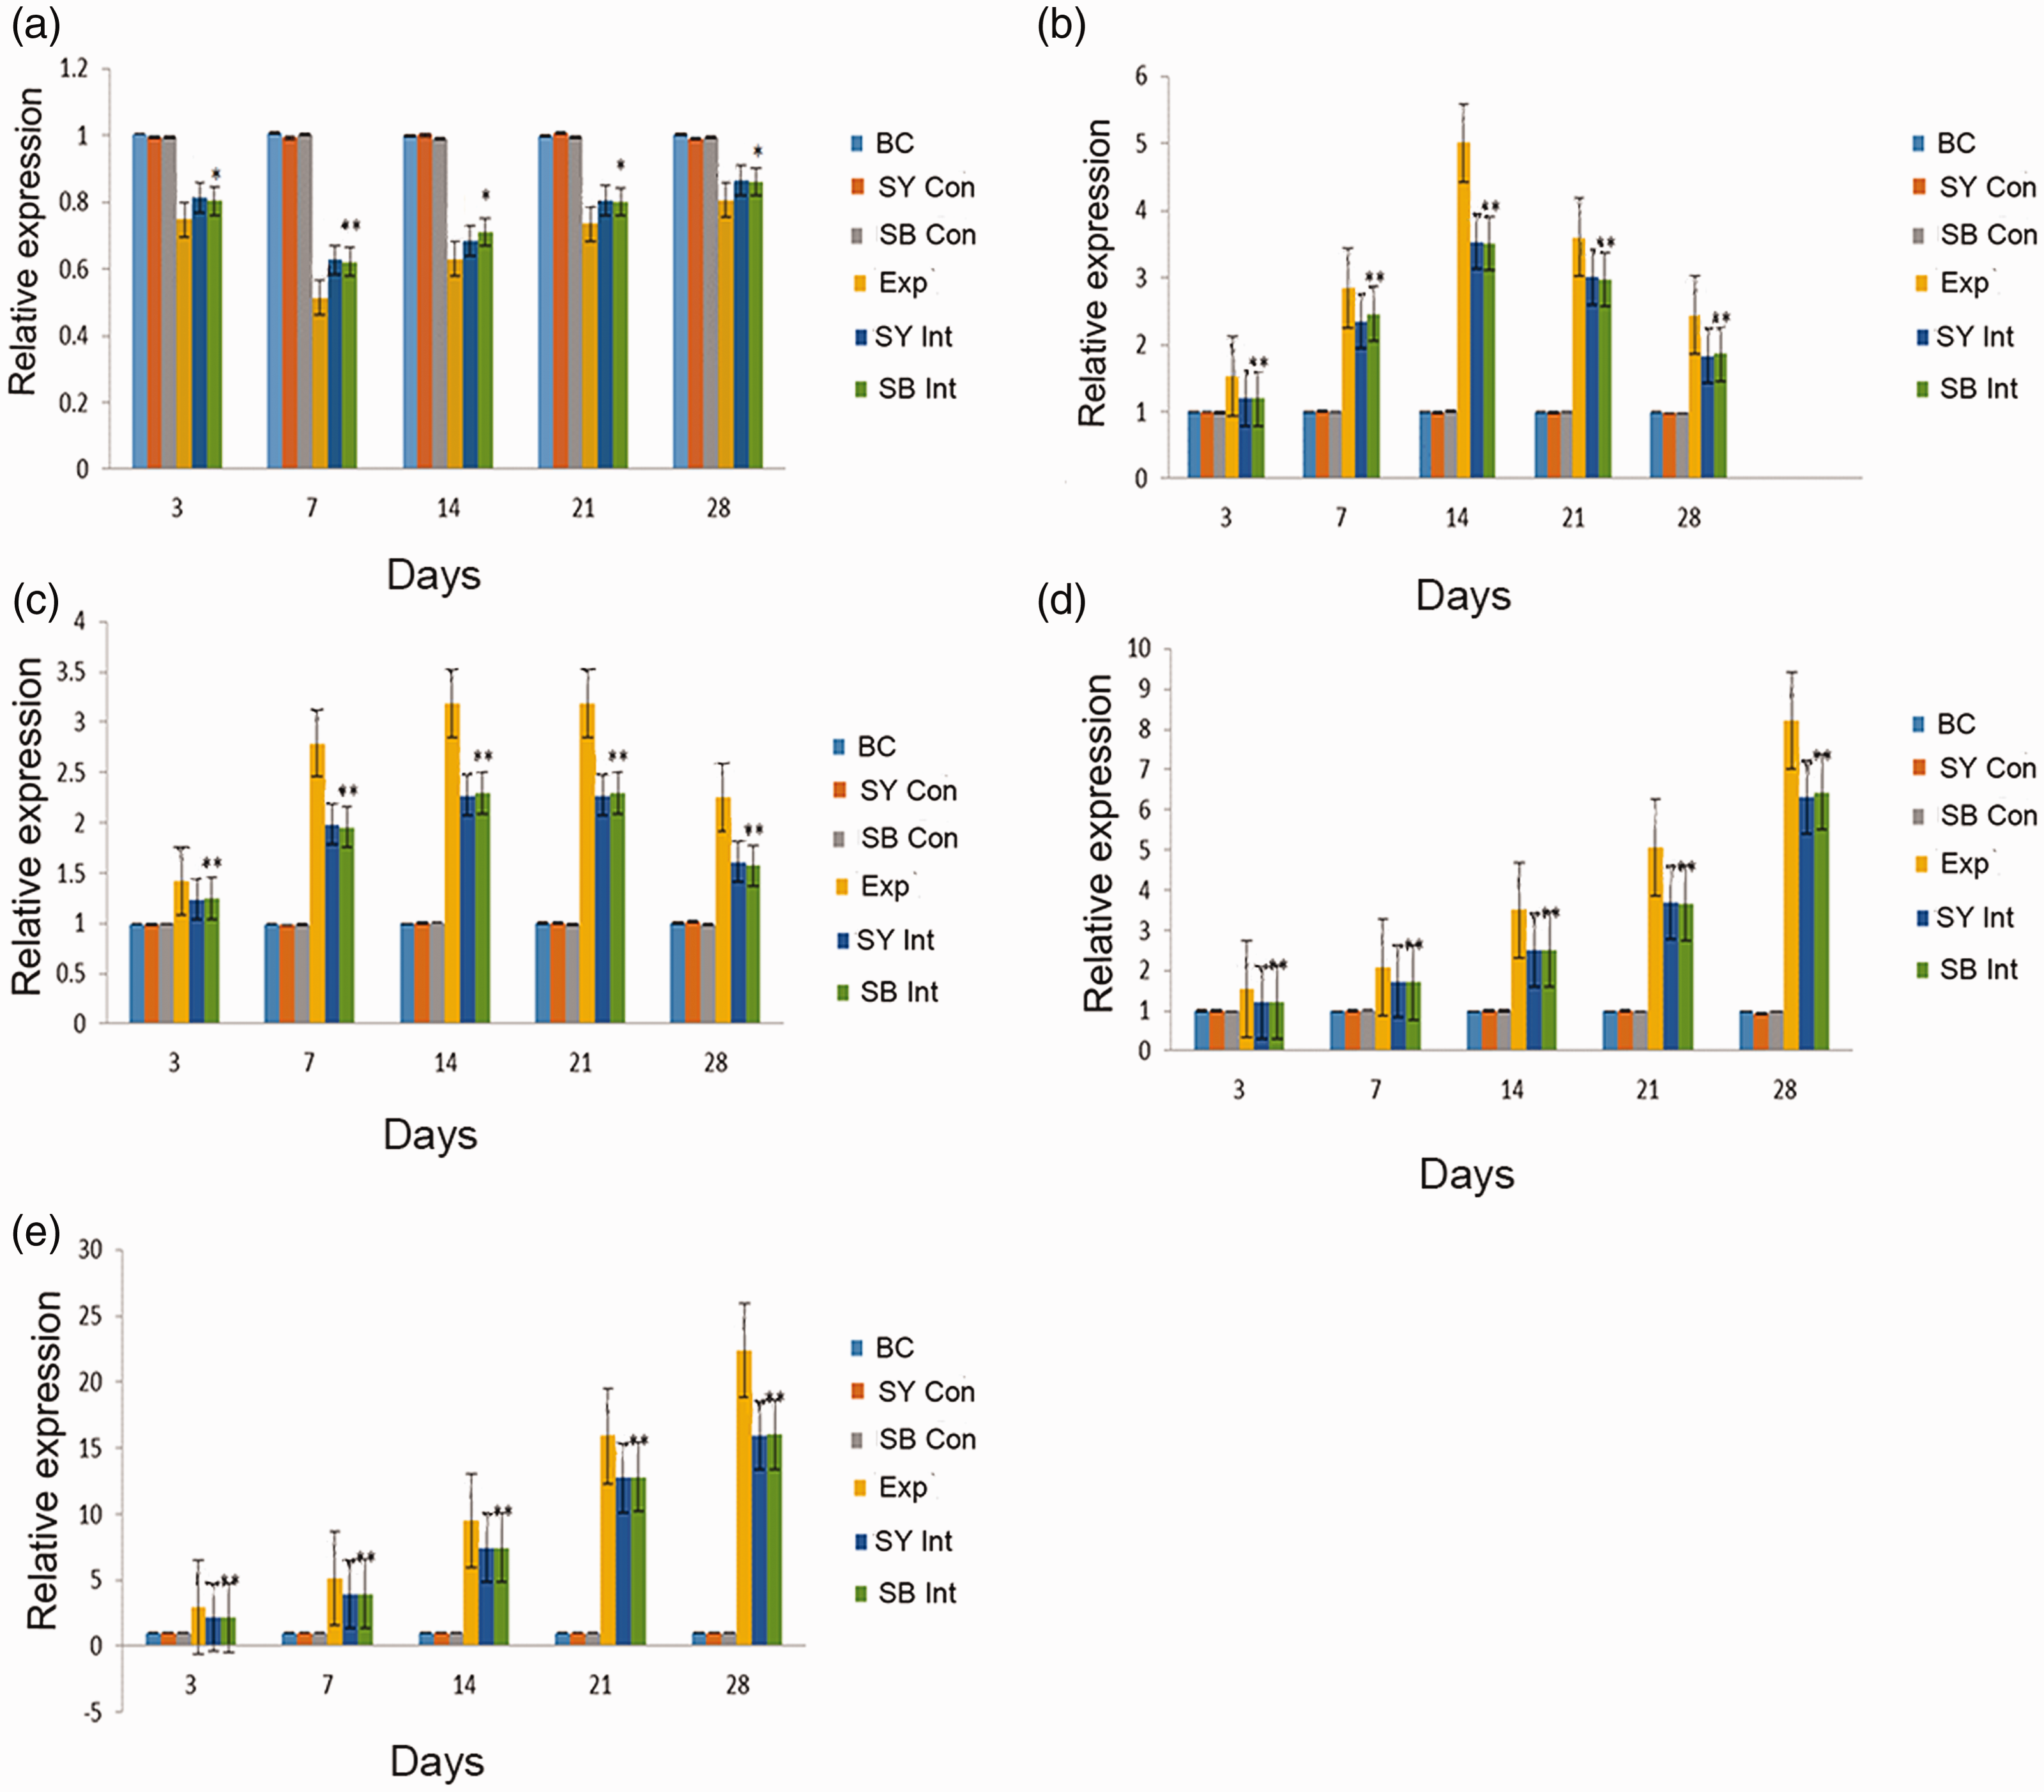
mRNA expression levels of MST, TGF-β1, Smad3, Yap and CTGF among groups over time.
Furthermore, the TGF-β1 and Smad3 mRNA expression levels in the Exp group progressively increased from day 3 to day 14, then decreased slowly; these levels remained relatively high on day 28. The TGF-β1 and Smad3 mRNA expression levels exhibited similar trends in the SY Int and SB Int groups. However, the absolute values of TGF-β1 and Smad3 mRNA expression levels at each time point were lower in the SY Int and SB Int groups than in the Exp group (P < 0.05 for all). No differences in TGF-β1 and Smad3 mRNA expression levels were detected among the BC, SY Con, and SB Con groups (Figure 3b, c).
In addition, the Yap and CTGF mRNA expression levels increased from day 3 to day 28 in the Exp group, as well as in the SY Int and SB Int groups. In contrast, the absolute values of the Yap and CTGF mRNA expression levels at each time point were lower in the SY Int and SB Int groups than in the Exp group (P < 0.05 for all). No differences in Yap and CTGF mRNA expression levels were detected among the BC, SY Con, and SB Con groups (Figure 3d, e).
Immunoblotting analysis revealed that the MST protein expression levels in lung tissue were normal in the BC, SY Con, and SB Con groups; no significant differences in expression were observed at any time point among these three groups. The MST protein expression level in lung tissue from the Exp group decreased from day 3 to day 7, then slowly increased until day 28. However, MST protein expression remained lower in the Exp group than in the BC group (P < 0.05 for all). MST protein expression levels in the SY Int and SB Int groups exhibited trends similar to that observed in the Exp group. However, MST protein expression levels were higher at all time points in the SY Int and SB Int groups than in the Exp group (P < 0.05 for all) (Figure 4).

Immunoblotting analysis of MST, TGF-β1, Smad3, Yap and CTGF among groups over time. Actin was used as an internal reference.
The TGF-β1 and Smad3 protein expression levels in the BC, SY Con, and SB Con groups could be detected at very low levels at all time points; no significant differences in the expression levels of either protein were observed at any time point among these three groups. The TGF-β1 and Smad3 protein expression levels in the Exp group increased from day 3 to day 14, then decreased until day 28. However, their expression levels remained higher in the Exp group than in the BC group on day 28 (P < 0.05). The TGF-β1 and Smad3 protein expression levels in the SY Int and SB Int groups exhibited trends similar to that observed in the Exp group. However, both protein expression levels were lower at all time points in the SY Int and SB Int groups than in the Exp group (P < 0.05) (Figure 4).
In addition, Yap and CTGF protein expression levels in the BC, SY Con, and SB Con groups could be detected at very low levels at all time points; no significant differences in the expression levels of either protein were observed at any time point among these three groups. The Yap and CTGF protein expression levels in the Exp group increased from day 3 to day 28. Their expression levels were higher in the Exp group than in the BC group on day 28 (P < 0.05). The Yap and CTGF protein expression levels in the SY Int and SB Int groups exhibited trends similar to that observed in the Exp group. However, both protein expression levels were lower at all time points in the SY Int and SB Int groups than in the Exp group (P < 0.05 for all) (Figure 4).
Hematoxylin and eosin staining and Masson’s trichrome staining findings
Hematoxylin and eosin staining of lung tissues revealed clear and intact alveolar structure at all time points in the BC, SY Con, and SB Con groups. In these groups, the alveolar septum was intact without hyperemia; the lung tissue was smooth without obvious inflammatory cell infiltration and fibrosis. In the Exp group, inflammatory changes in the lung tissue could be observed on day 3; specifically, capillary hyperemia could be observed in interstitial lung, and inflammatory cells begin to infiltrate the lung tissue. On day 14, the capillary wall began to thicken in the lung tissue; small numbers of fibroblasts and myofibroblasts appeared. On day 28, the lung tissue was characterized by obvious proliferation of fibroblasts; significant thickening of the capillary wall and considerable deposition of collagen fiber could also be observed. Similar findings were observed in the SY Int and SB Int groups; however, the degrees of inflammation and fibrosis were less than those observed in the Exp group (Figure 5).

Hematoxylin and eosin staining analysis of lung tissues among groups over time. In the Exp group, inflammatory changes in the lung tissue are present on day 3. Capillary hyperemia is present in interstitial lung, and inflammatory cells have begun to infiltrate lung tissue. On day 14, the capillary wall in lung tissue has begun to thicken, and small numbers of fibroblasts and myofibroblasts are present. On day 28, obvious proliferation of fibroblasts is present in lung tissue. Substantial thickening of the capillary wall and extensive collagen fiber deposition are present. The findings are similar in the SY Int and SB Int groups.
Masson’s trichrome staining revealed that lung tissue structure was normal at all time points in the BC, SY Con, and SB Con groups; few or no collagen fibers could be observed. In the Exp group, lung tissue inflammation reached its peak on day 14; alveolar septum was significantly thickened, while collagen fibrosis and fibroblasts were observed around the bronchi and interstitial capillaries. On day 28, many coarse and disorderly collagen fibers could be observed in the pulmonary interstitium and a portion of the alveoli; fibroblast proliferation was considerable. Similar findings were observed in the SY Int and SB Int groups; however, the degrees of inflammation and fibrosis were less than those observed in the Exp group (Figure 6).
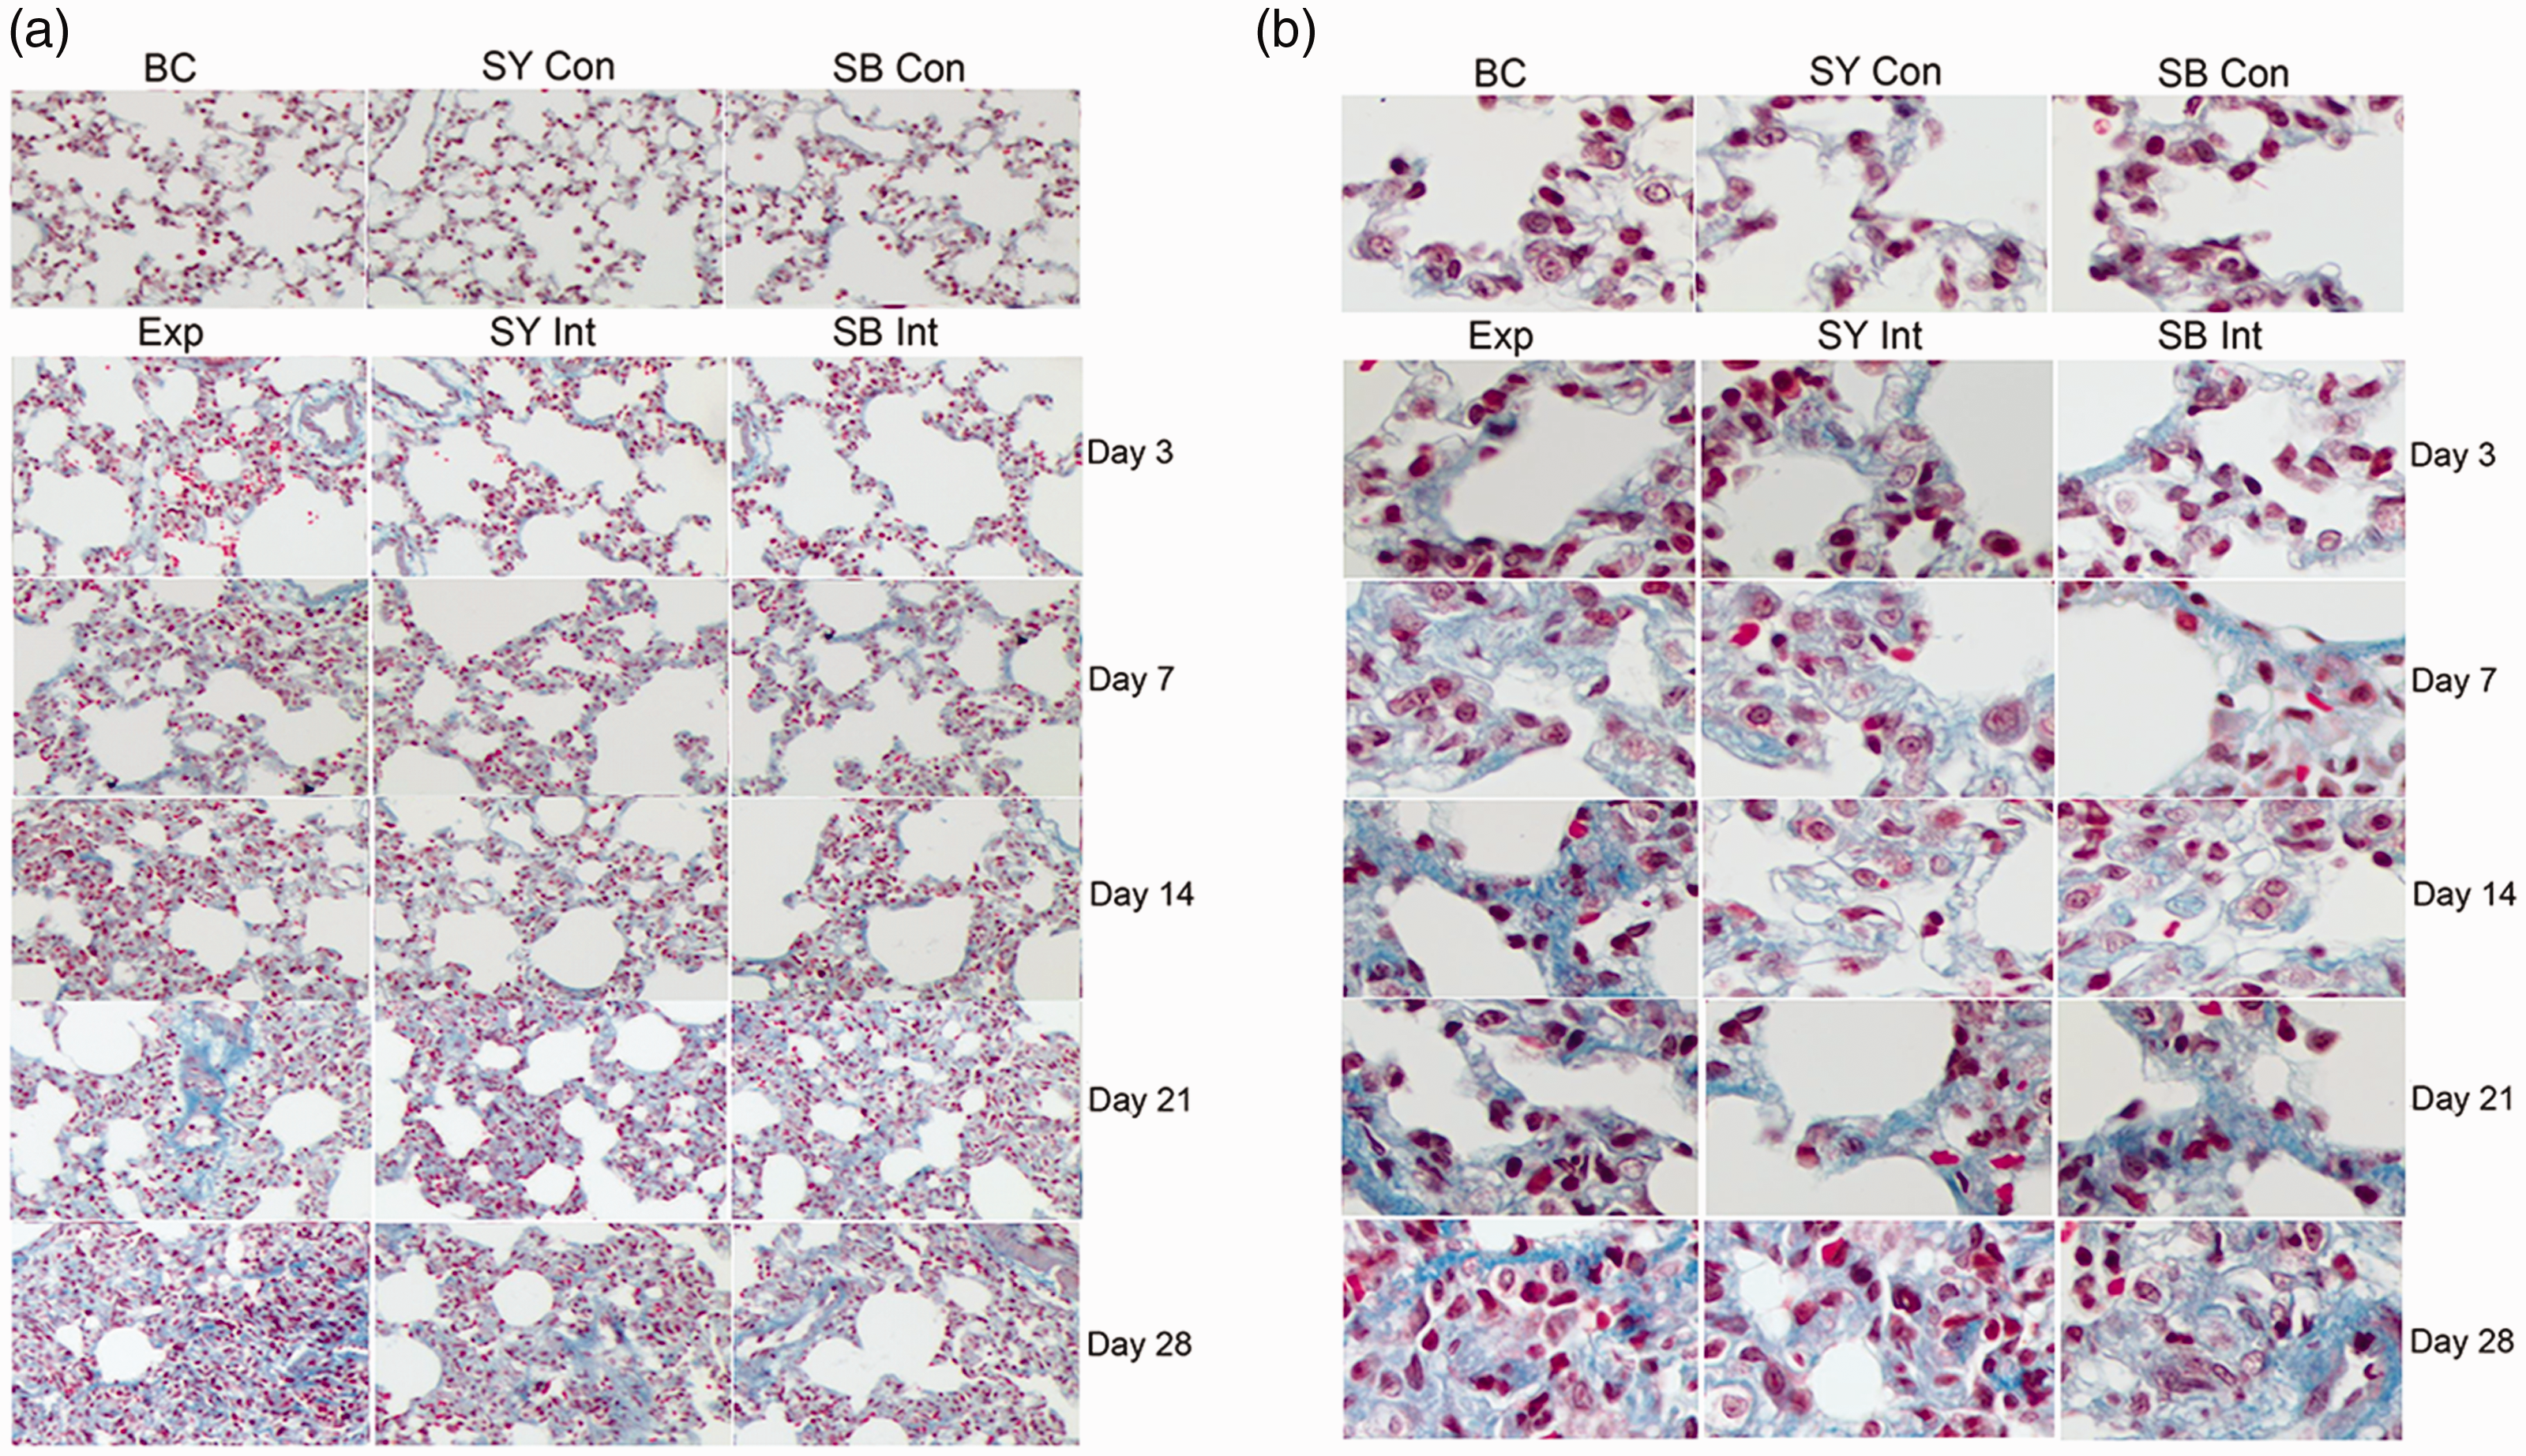
Masson’s trichrome staining analysis of lung tissues among groups over time. Few or no collagen fibers are present in the control groups. In the Exp group, lung tissue inflammation has reached a peak on day 14, and alveolar septum is considerably thickened. Collagen fibrosis and fibroblasts are present around bronchi and interstitial capillaries. On day 28, many coarse and disorderly collagen fibers are present in the pulmonary interstitium and a portion of the alveoli; fibroblasts exhibit substantial proliferation. Similar findings are present in the SY Int and SB Int groups. However, the degrees of inflammation and fibrosis are less than those observed in the Exp group.
Moreover, pathological scoring of lung tissue at each time point revealed no differences in terms of inflammation and fibrosis among the BC, SY Con, and SB Con groups. The inflammation score in the Exp group increased from day 3 to day 14, then gradually decreased (Figure 7); fibrosis score in the Exp group also increased from day 3 to day 28. Scores of inflammation and fibrosis were significantly higher in the Exp group than in the BC group at all time points (P < 0.05 for all). Scores of inflammation and fibrosis in the SY Int and SB Int groups exhibited trends similar to those observed in the Exp group. However, the absolute scores of inflammation and fibrosis were lower in the SY Int and SB Int groups than in the Exp group at all time points (P < 0.05 for all) (Figure 7).
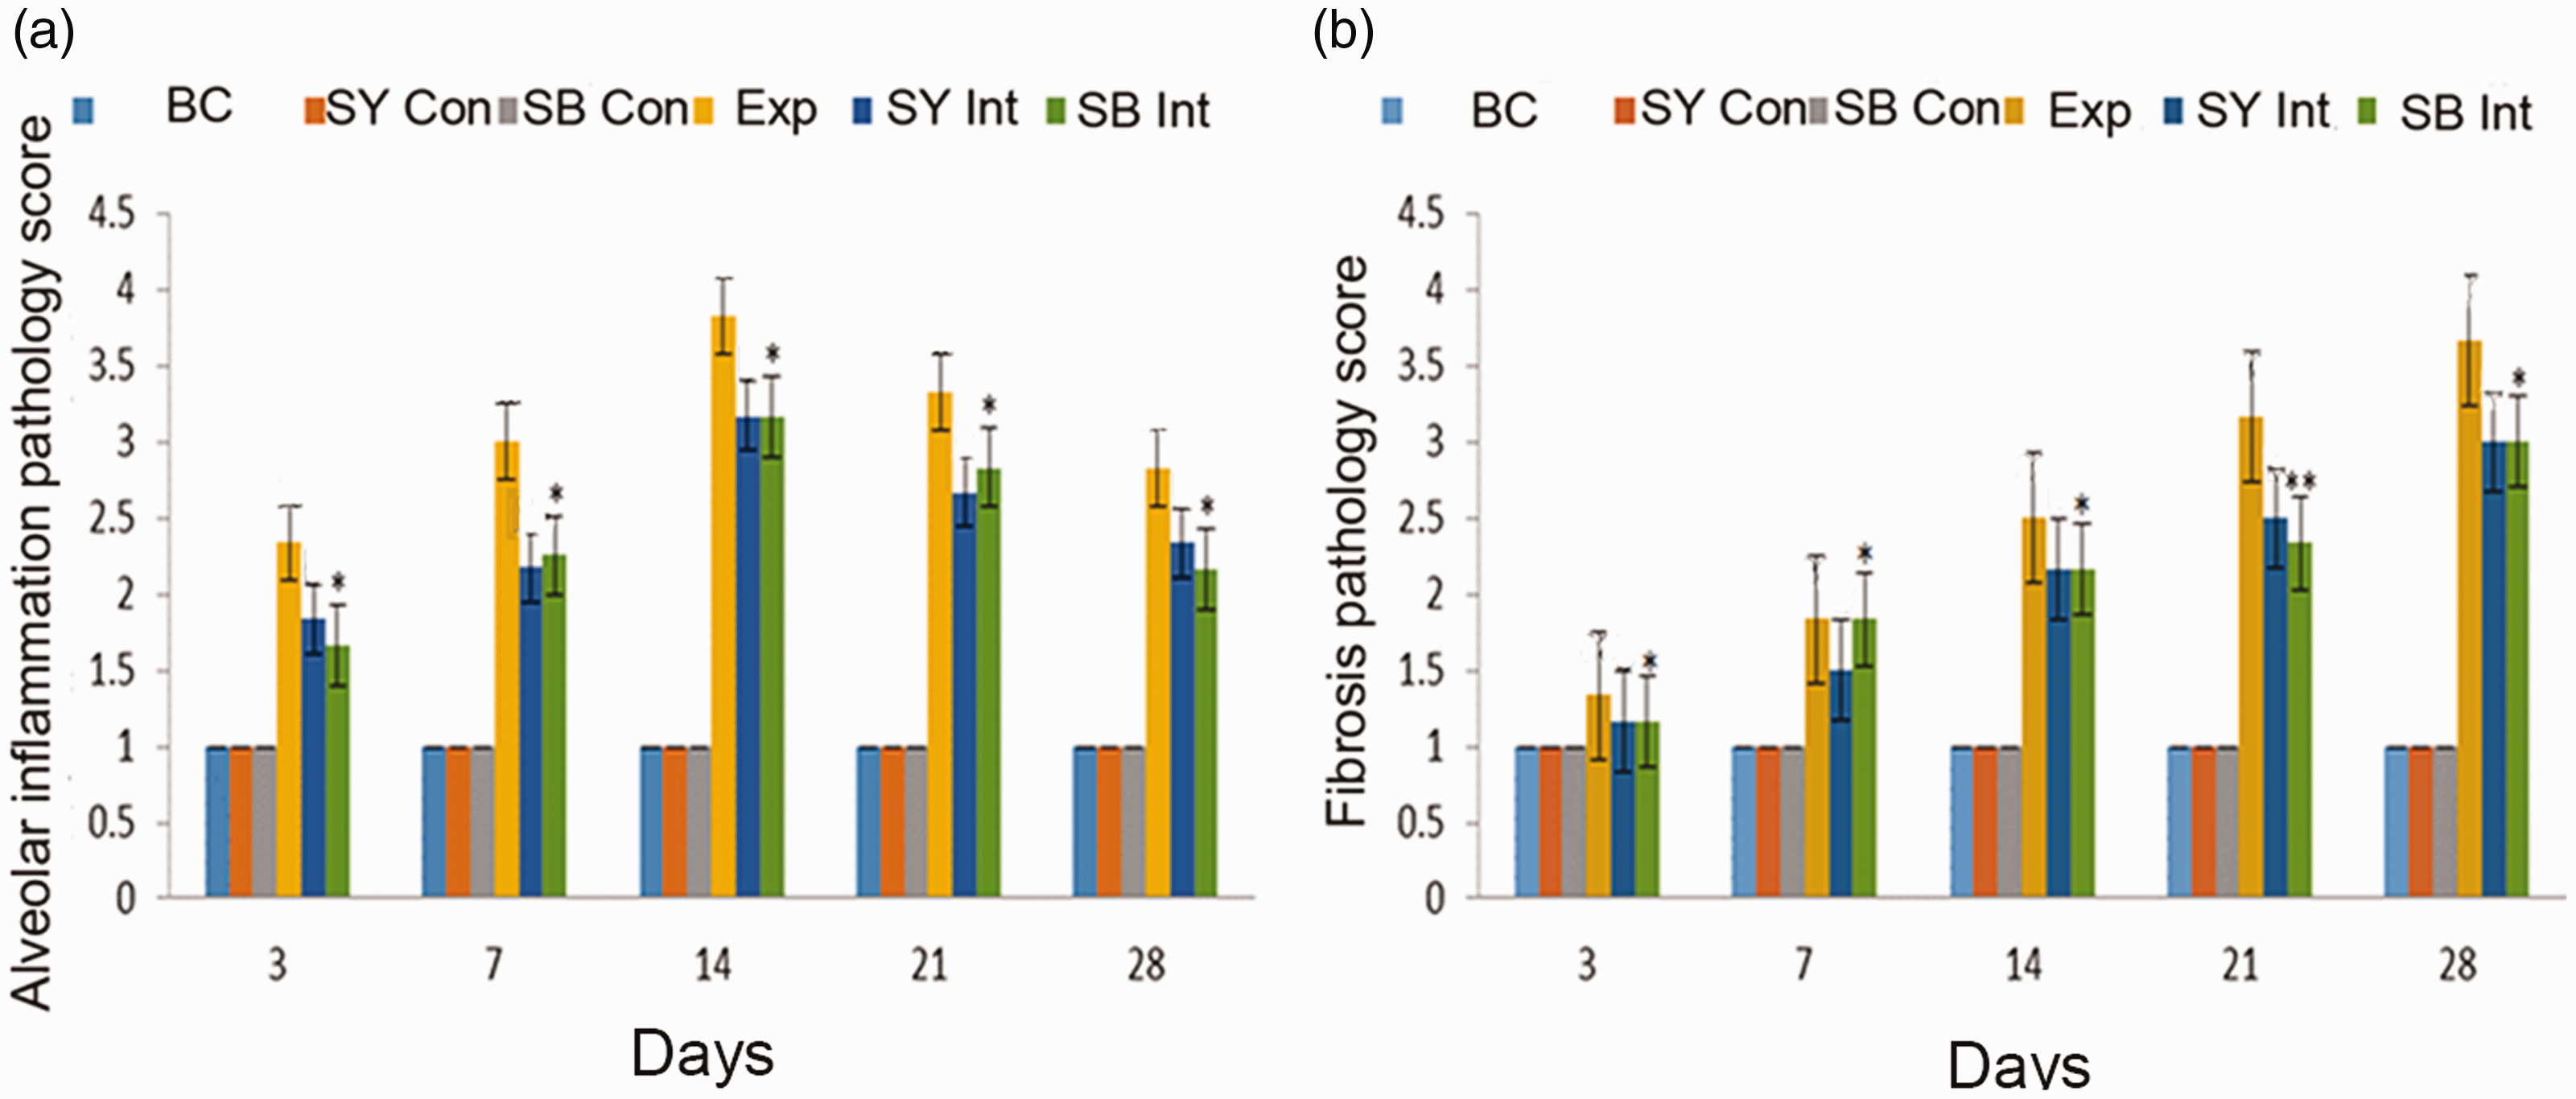
Pathology scores in lung tissue among groups over time.
Electron microscopy findings
Lung tissue structure was generally normal and demonstrated no obvious damage to cellular ultrastructure in the BC, SY Con, and SB Con groups. In the Exp group, ultrastructural damage appeared on day 3; mitochondria, lamellar bodies, and a few type I and type II alveolar epithelial cells were damaged. Damage to type I alveolar epithelial cells was further aggravated on day 14; nuclei were incomplete, while type II alveolar epithelial cells exhibited obvious vacuolar degeneration and mitochondria were remarkably swollen. Moreover, some hyperplastic collagen fibers were observed in the interstitial lung. On day 28, considerable fibroblast proliferation was observed, and many coarse collagen fibers were disordered. Ultrastructural changes were similar in the SY Int and SB Int groups; However, the degrees of damage and fibrosis were less than those observed in the Exp group (Figure 8).
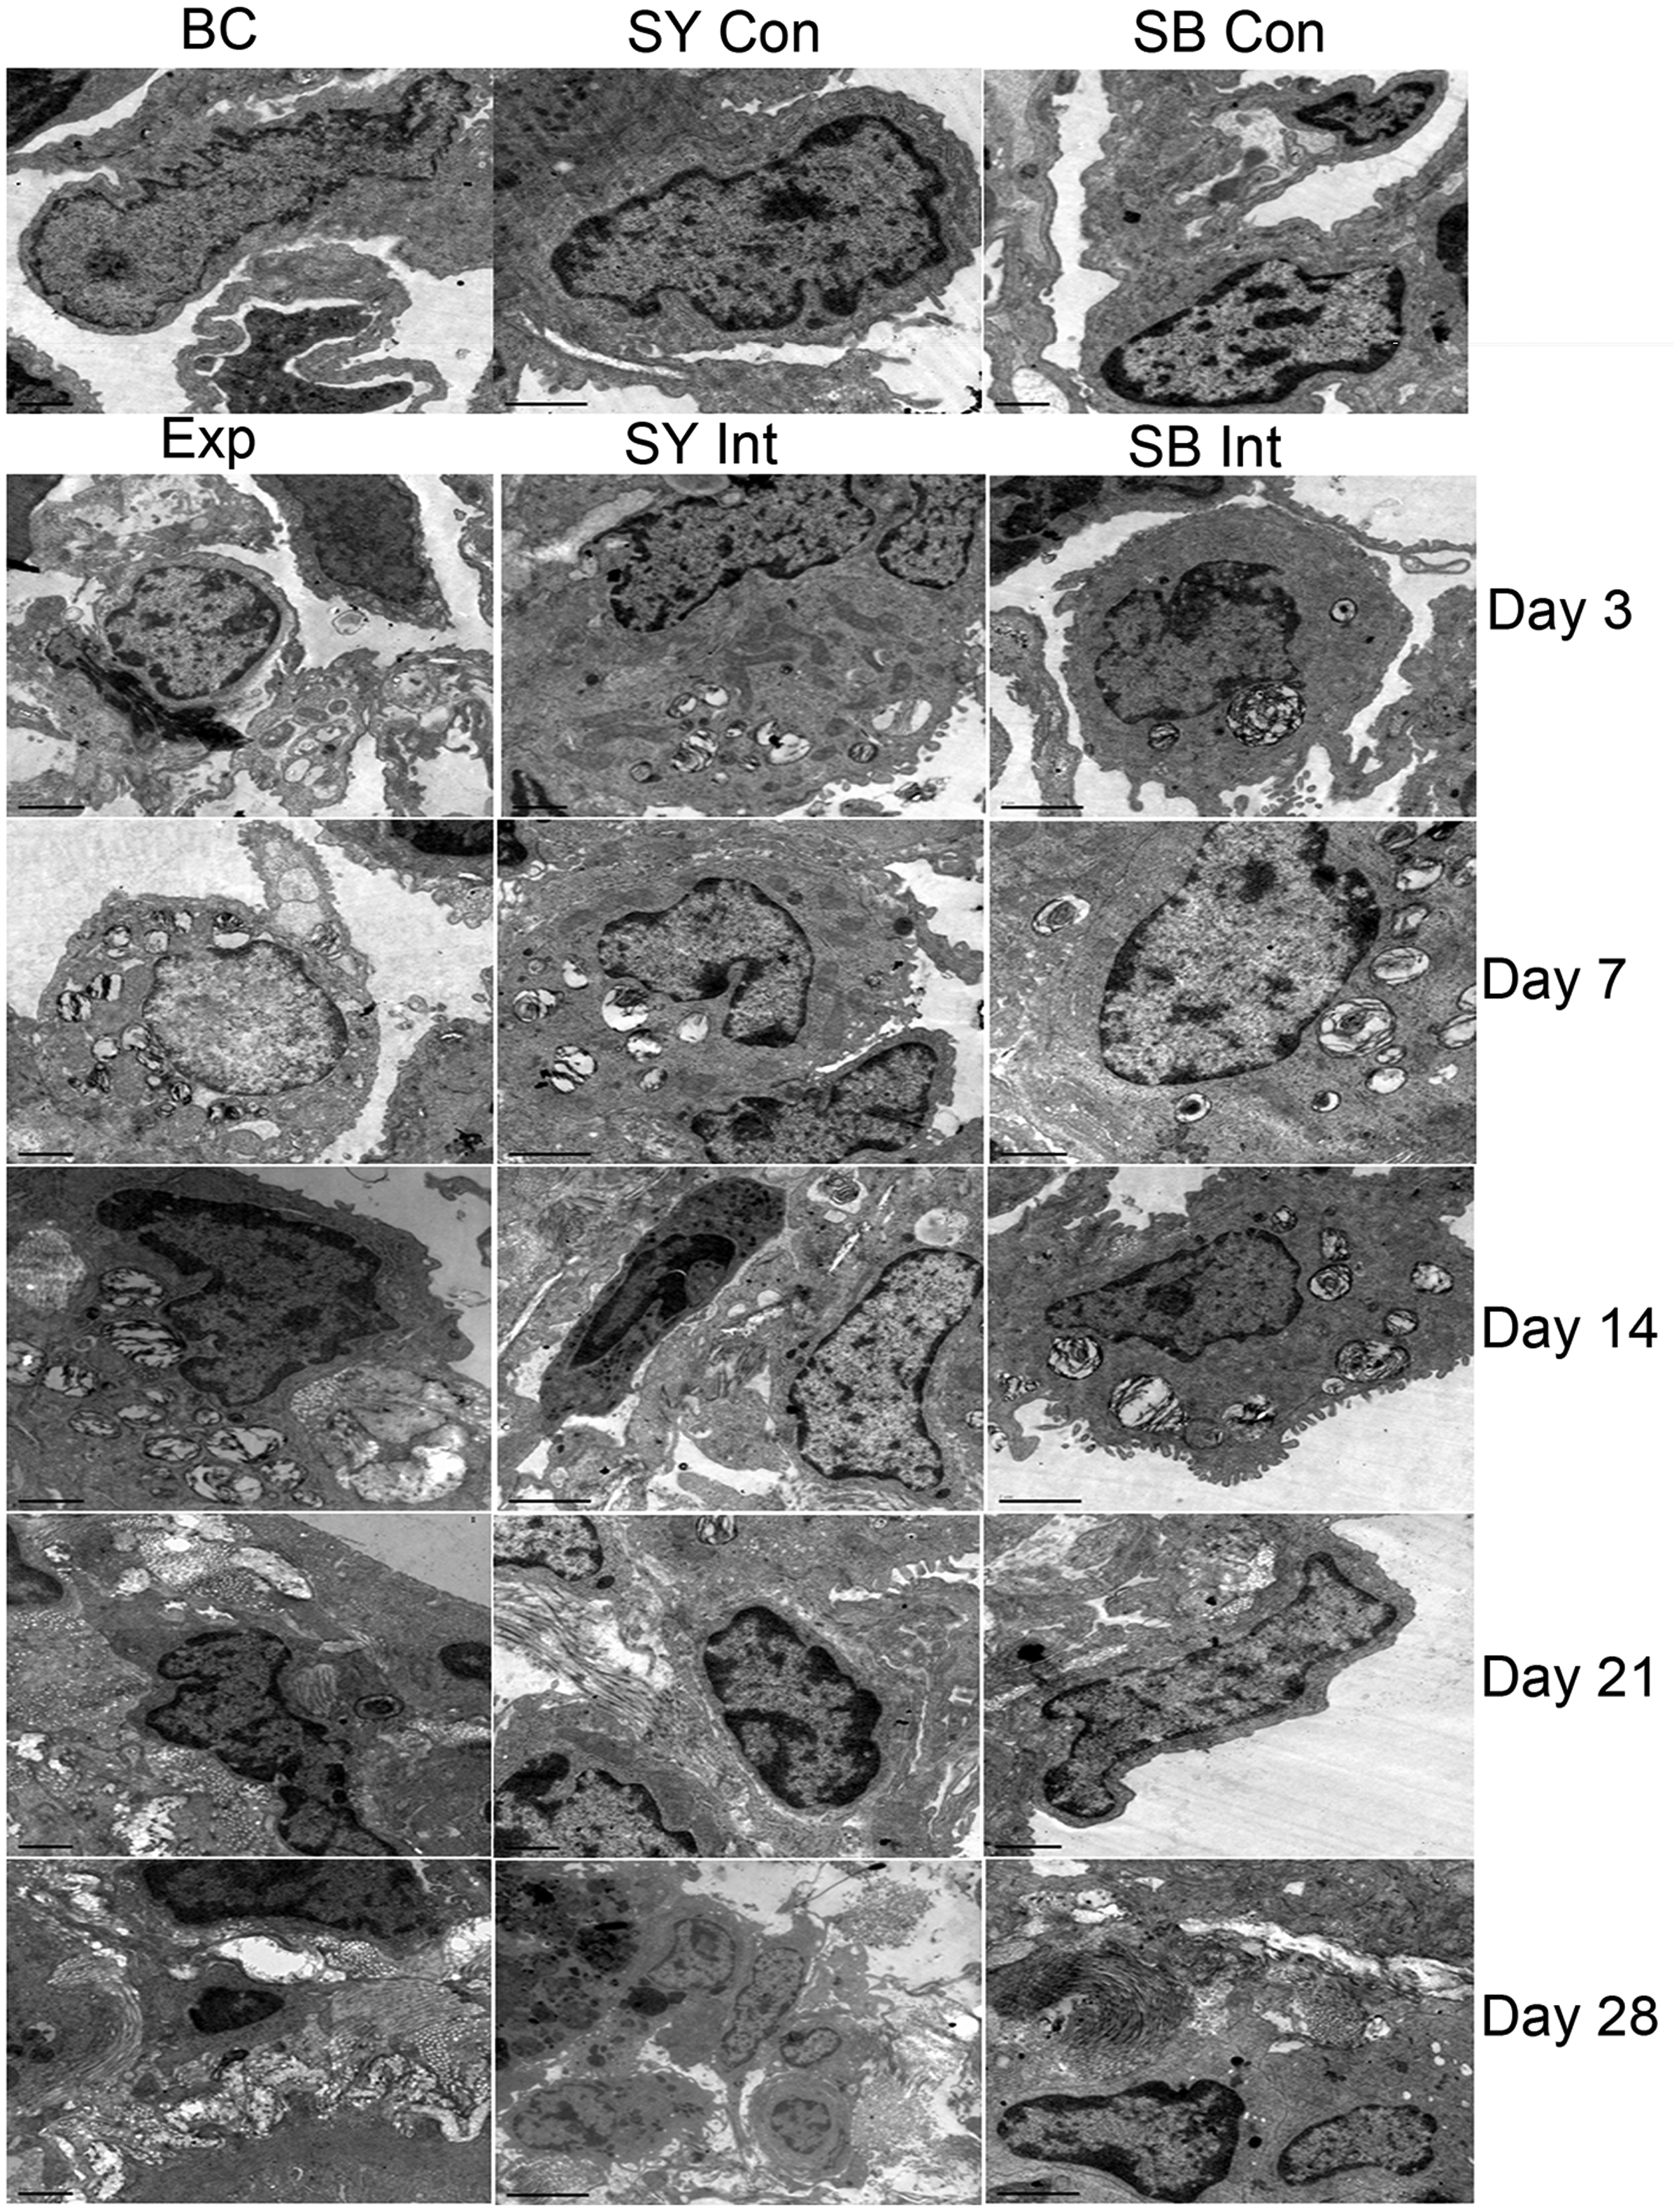
Transmission electron microscopy analysis of lung tissues among groups over time. No obvious damage to cell ultrastructure is present in the BC, SY Con, and SB Con groups. In the Exp group, ultrastructural damage is present on day 3; mitochondria, lamellar bodies, and a few type I and type II alveolar epithelial cells are damaged. Damage to type I alveolar epithelial cells is further aggravated on day 14; nuclei are incomplete, obvious vacuolar degeneration of type II alveolar epithelial cells is present, and mitochondria are remarkably swollen. A few hyperplastic collagen fibers are present in the interstitial lung. Substantial fibroblast proliferation is present on day 28; many coarse collagen fibers are disordered.
Discussion
In this study, we used a single dose of 50 mg/kg paraquat, based on the previously reported rat paraquat oral exposure experimental animal model. 19 This 50 mg/kg dose of paraquat has been shown to cause typical paraquat poisoning-related pathological changes in experimental rats. In addition, it avoids death due to an excessive dose. The pathological results in the present study revealed acute lung injury in lung tissue from the Exp group; the inflammatory response reached its peak on day 14, while fibrosis was present on day 7. Moreover, typical pulmonary fibrosis could be observed on day 28. These results were consistent with those in previous models of paraquat poisoning in rats, 20 which suggested that the animal model used in this study exhibits the expected pathological changes in lung tissue after paraquat poisoning.
A previous study indicated that high levels of TGF-β1 in rat lung tissue were positively correlated with the level of hydroxyproline in lung tissue, suggesting that TGF-β1 is closely associated with the development of paraquat-induced pulmonary fibrosis. 21 Moreover, the TGF-β1 expression level in lung tissue increased progressively from day 3 to day 14. 22 In the present study, we observed changes in TGF-β1 and Smad3 expression levels in lung tissue from rats with paraquat-induced pulmonary fibrosis by performing qRT-PCR and immunoblotting. We found that TGF-β1 and Smad3 expression levels increased from day 3 to day 14. These experimental results are consistent with relevant research findings in recent years. Moreover, TGF-β1 alone has been shown to cause a lesser degree of tissue fibrosis, while TGF-β1 and CTGF could synergistically induce more pronounced fibrosis. 23 In addition, CTGF antibodies have been reported to substantially reverse the process of tissue fibrosis. 24 In the present study, the level of CTGF expression progressively increased from day 3 to day 28. Notably, changes in the level of CTGF expression were correlated with hematoxylin and eosin staining and Masson’s trichrome staining results in rat lung tissue. These findings suggest that the degree of paraffin-induced pulmonary fibrosis is closely related to the expression of CTGF in lung tissue.
In the classical Hippo pathway, a series of upstream signaling molecules, such as NF2, can activate the MST1/2 kinase; activated MST1/2 can phosphorylate Sav1, Last1/2, and Mob. 25 In this study, the level of Yap expression in lung tissue from rats exposed to paraquat showed a progressive increase from day 3 to day 28, which indicated that Yap was progressively activated in lung tissue after paraquat exposure. In addition, Yap expression was closely associated with progressively high expression levels of TGF-β1 and Smad3 on days 3, 7, and 14 (data not shown). We hypothesized that the Hippo and TGF-β1/Smad pathways may play a synergistic role in promoting lung fibrosis after paraquat exposure in rats. For example, the effector molecules of these two pathways may form a Yap-TEAD4-Smad3-P300 complex in the nucleus. 11 This complex induces the expression of CTGF during paraquat-induced lung fibrosis. Moreover, we examined the expression of MST, because early activation of Yap in lung tissue after paraquat exposure in rats occurs as a result of inhibition of the classical Hippo pathway; notably, paraquat poisoning can inhibit MST kinase. We found that the activity of MST kinase gradually recovered after 7 days of paraquat exposure. However, the activation of Yap did not stop at this time point, which was presumably related to the regulation of Yap activity by multiple signaling pathways and various factors.
Safflower yellow pigment has been shown to inhibit bleomycin-induced pulmonary fibrosis in rats and mice. 26 Hydroxysafflor yellow can alleviate morphological changes in human type II alveolar epithelial cells, induced by TGF-β1 activity. In addition, hydroxysafflor yellow can inhibit the expression of type I collagen mRNA and the phosphorylation of intracellular Smad3 protein. 27 In the present study, the results of hematoxylin and eosin staining and Masson’s trichrome staining suggested that early lung injury and advanced pulmonary fibrosis were alleviated in the SY Int group, compared with the Exp group. Electron microscopy revealed similar findings. However, lung tissue in the SY Int group exhibited a degree of damage and fibrosis. These results suggest that safflower yellow pigment can be used to alleviate, but not fully reverse, the occurrence of pulmonary fibrosis caused by paraquat.
SB431542 is a specific type I antagonist of the TGF-β1 receptor, 16 which can specifically block the phosphorylation of intracellular Smad proteins induced by TGF-β1, thereby modifying the formation of the Yap-TEAD4-Smad3-P300 complex in the nucleus. In this study, SB431542 could significantly reduce the expression levels of TGF-β1, Smad3, CTGF and Yap in lung tissue from rats exposed to paraquat. Moreover, the degrees of early lung injury and advanced pulmonary fibrosis in lung tissue could be significantly reduced by SB431542 treatment, as determined by light microscopy and electron microscopy analysis. These results suggest that SB431542 can partially inhibit pulmonary fibrosis in paraquat rats by modifying the TGF-β1/Smad and Hippo pathways; importantly, the effects of this inhibition were similar to those of treatment with safflower yellow pigment.
Conclusion
The Hippo signaling pathway is activated by the MST-Yap pathway in rats with acute paraquat poisoning. In addition, the Hippo signaling pathway promotes the development of pulmonary fibrosis in rats by interacting with the TGF-β1/Smad signaling pathway. This study showed that safflower yellow pigment and SB431542 could partially alleviate pulmonary fibrosis in rats with acute paraquat poisoning by interfering with the Hippo signaling pathway. Other pathways, which are independent of the TGF-β1 signaling pathway, are reportedly involved in acute paraquat poisoning in rats. The results of the present study provide insight into the molecular mechanisms of paraquat poisoning in rats, and may support the use of safflower yellow pigment and SB431542 in the development of treatments for paraquat poisoning.
Footnotes
Declaration of conflicting interest
The authors declare that there is no conflict of interest.
Funding
The study was supported by the Shandong Province Key Research and Development Project (2015GSF118038); and the Shandong Province Key Research and Development Project (2016GSF201041).