
Abstract
Objective
To compare corneal thickness (CT) measurements using the CEM-530 (Nidal, Gamagori, Japan) and Pentacam HR (Oculus, Wetzlar, Germany).
Methods
The CT of 209 healthy subjects (209 right eyes) aged 24 to 89 years (71.35 ± 10.72 years) was measured at the corneal apex (CA), pupil center (PC), and thinnest point (TP) with the Pentacam HR and at the corneal center with the CEM-530 in random order at the same time of day.
Results
A good correlation but statistically significant difference was found between the CEM-530 and Pentacam HR measurements at the CA (6.10 ± 8.12 µm, R2 = 0.8947), PC (7.46 ± 8.57 µm, R2 = 0.8826), and TP (12.44 ± 10.04 µm, R2 = 0.8392). Comparison of the two devices produced the following regression formulas: y = 0.8859x + 57.644 for the CA, y = 0.8852x +56.657 for the PC, and y = 0.8557x + 68.148 for the TP, where x is the CT obtained with the CEM-530 and y is that obtained with the Pentacam HR.
Conclusions
These findings indicate that the CEM-530 produces a thicker corneal measurement than the Pentacam HR. The herein-proposed correcting factors are needed to reliably compare these devices.
Introduction
Accurate measurement of the corneal thickness (CT) has become mandatory for several reasons during the past several years. These reasons include the increasing popularity of corneal refractive surgery1–3; the need for precise measurement of the intraocular pressure, which is influenced by the CT3–5; the correlation of CT with other corneal parameters 6 ; the study of endothelial cell function 7 ; the possibility of differentiating keratoconus from contact lens-induced corneal warpage 8 ; and the likelihood of treating keratoconus with corneal cross-linking.9,10
Different techniques can be utilized to measure the CT, such as ultrasound pachymetry (UP), optical coherence tomography, dual-beam partial coherence interferometry, contact and non-contact specular microscopy (SM), optical pachymetry, ultrasound biomicroscopy, slit scanning corneal tomography (Orbscan), rotating Scheimpflug cameras (Pentacam, Galilei), and confocal microscopy. 11–14
In clinical practice, UP (so far considered the gold standard) is a commonly used, low-cost, accurate, and efficient method. However, this technique has several disadvantages, including the need for significant operator expertise, corneal contact with a risk of cross infections, the necessity of topical anesthesia, and often irreproducible probe placement. 15
The Pentacam camera (Oculus, Wetzlar, Germany) and SM cameras such as the CEM-530 (Nidek, Gamagori, Japan) are non-contact devices with no risk of corneal infection and no need for anesthesia. Moreover, they are less operator-dependent and are quite comfortable for the patient.
To the best of our knowledge, no comparison between CT measurements obtained with the Pentacam HR rotating Scheimpflug camera (version 1.19r11) and the CEM-530 non-contact SM camera has been performed. For this reason, it is important to clarify whether these two devices provide comparable results and if they can be used interchangeably. This information could be very important if the CT measurement in patients followed for conditions such as keratoconus is obtained with different devices at different follow-up visits.
In this study, we compared CT measurements between the Pentacam HR and CEM-530 to establish a regression formula that can make their measurements comparable.
Methods
The right eyes of healthy subjects were included in this prospective study. Individuals with ocular and systemic diseases that could potentially affect the aim of the study, such as glaucoma, corneal opacities, keratoconus, dry eyes, use of contact lenses, pregnancy, collagenopathies, and diabetes, were excluded.
The study was performed in accordance with the Declaration of Helsinki guidelines. The purpose of the study was explained to all participants, who provided written informed consent. The study was approved by the Institutional Review Board of the University of Salerno (Cometico Campania Sud, Protocol No. 16544).
CT measurements were consecutively performed in random order on the same day using the Pentacam HR and the Nidek CEM-530. To avoid measurement bias, two different operators, one for each instrument, performed the examination. They were not aware of the previously obtained results with the other device.
One high-quality measurement, according to the machine software, was performed with each device. If high quality was not achieved, the measurements were repeated until satisfactory quality was obtained.
The Pentacam HR relies on a rotating Scheimpflug camera and a monochromatic slit light source (blue led at 475 nm) that rotate together around the eye’s optical axes. The CEM-530 is an optical instrument that simultaneously performs pachymetric measurements and SM. In this study, measurements were performed using the automatic mode of the instrument.
The CT value obtained with the Nidek CEM-530 at the corneal center was compared with the three different CT values obtained with the Pentacam, namely those at the corneal apex (CA), pupil center (PC), and thinnest point (TP). All data were entered into a Microsoft Excel spreadsheet (Microsoft Corp., Redmond, WA, USA). Student’s paired t test, Bland–Altman plots, the intraclass correlation coefficient (ICC) (MedCalc 19.1; Ostend Belgium), and Pearson’s correlation coefficients were used for the statistical evaluation.16,17 A P value of <0.05 was considered statistically significant.
Results
This study included 209 right eyes of 209 healthy subjects (109 men and 100 women; mean age, 70.79 ± 11.63 years; age range, 24–89 years). Table 1 summarizes the results obtained with both the Nidek CEM-530 and Pentacam HR instruments.
Corneal thickness measurements obtained with Pentacam HR and Nidek CEM 530.

The CT values measured with the Nidek CEM-530 at the corneal center and the Pentacam HR at the CA, PC, and TP showed a good correlation (R2 = 0.8947, 0.8826, and 0.8392 and intraclass correlation coefficient = 0.9439, 0.9378, and 0.9140, respectively) (Figures 1–3). However, the values obtained with the CEM-530 were significantly thicker than those measured with the Pentacam HR (P < 0.001). The differences between the two devices were 6.10 ± 8.12 µm (range, −20.00 to 31.00 µm) at the CA, 7.46 ± 8.57 µm (range, −23.00 to 32.00 µm) at the PC, and 12.44 ± 10.04 µm (range, −16.00 to 49.00 µm) at the TP.
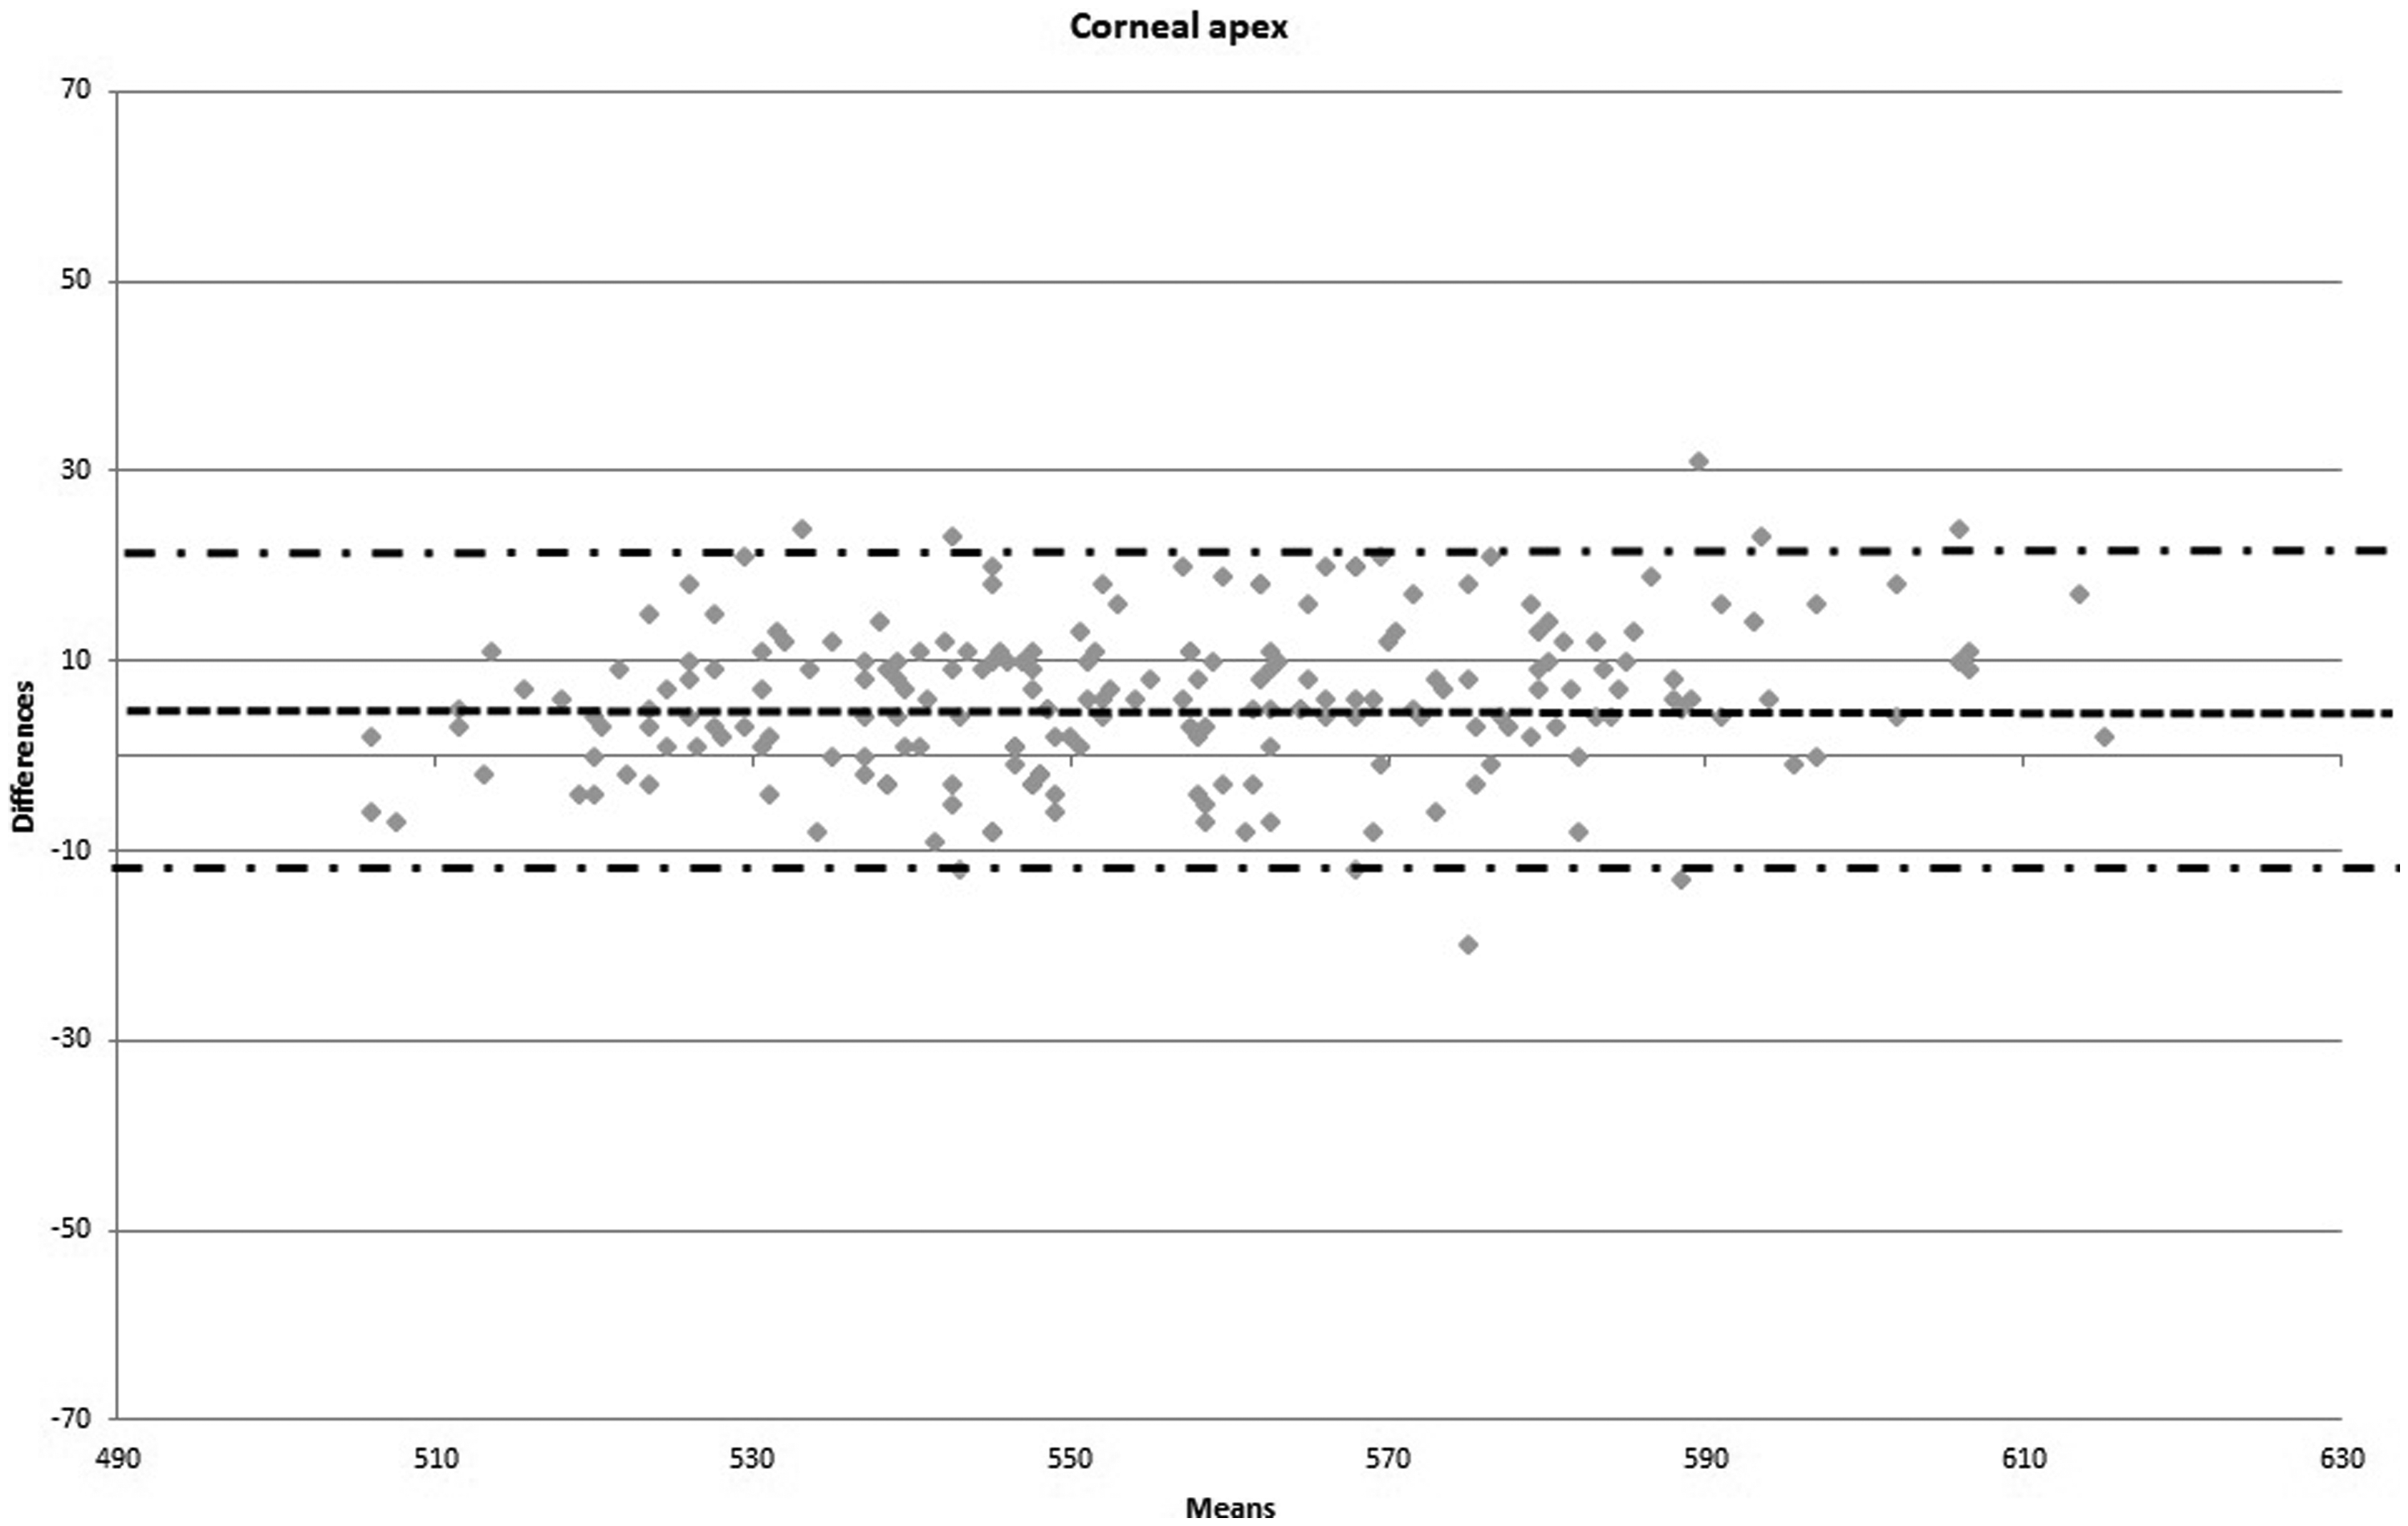
Bland–Altman correlation between corneal thickness measurements in microns obtained with the Nidek CEM-530 and Pentacam HR at the corneal apex.

Bland–Altman correlation between corneal thickness measurements in microns obtained with the Nidek CEM-530 and Pentacam HR at the pupil center.
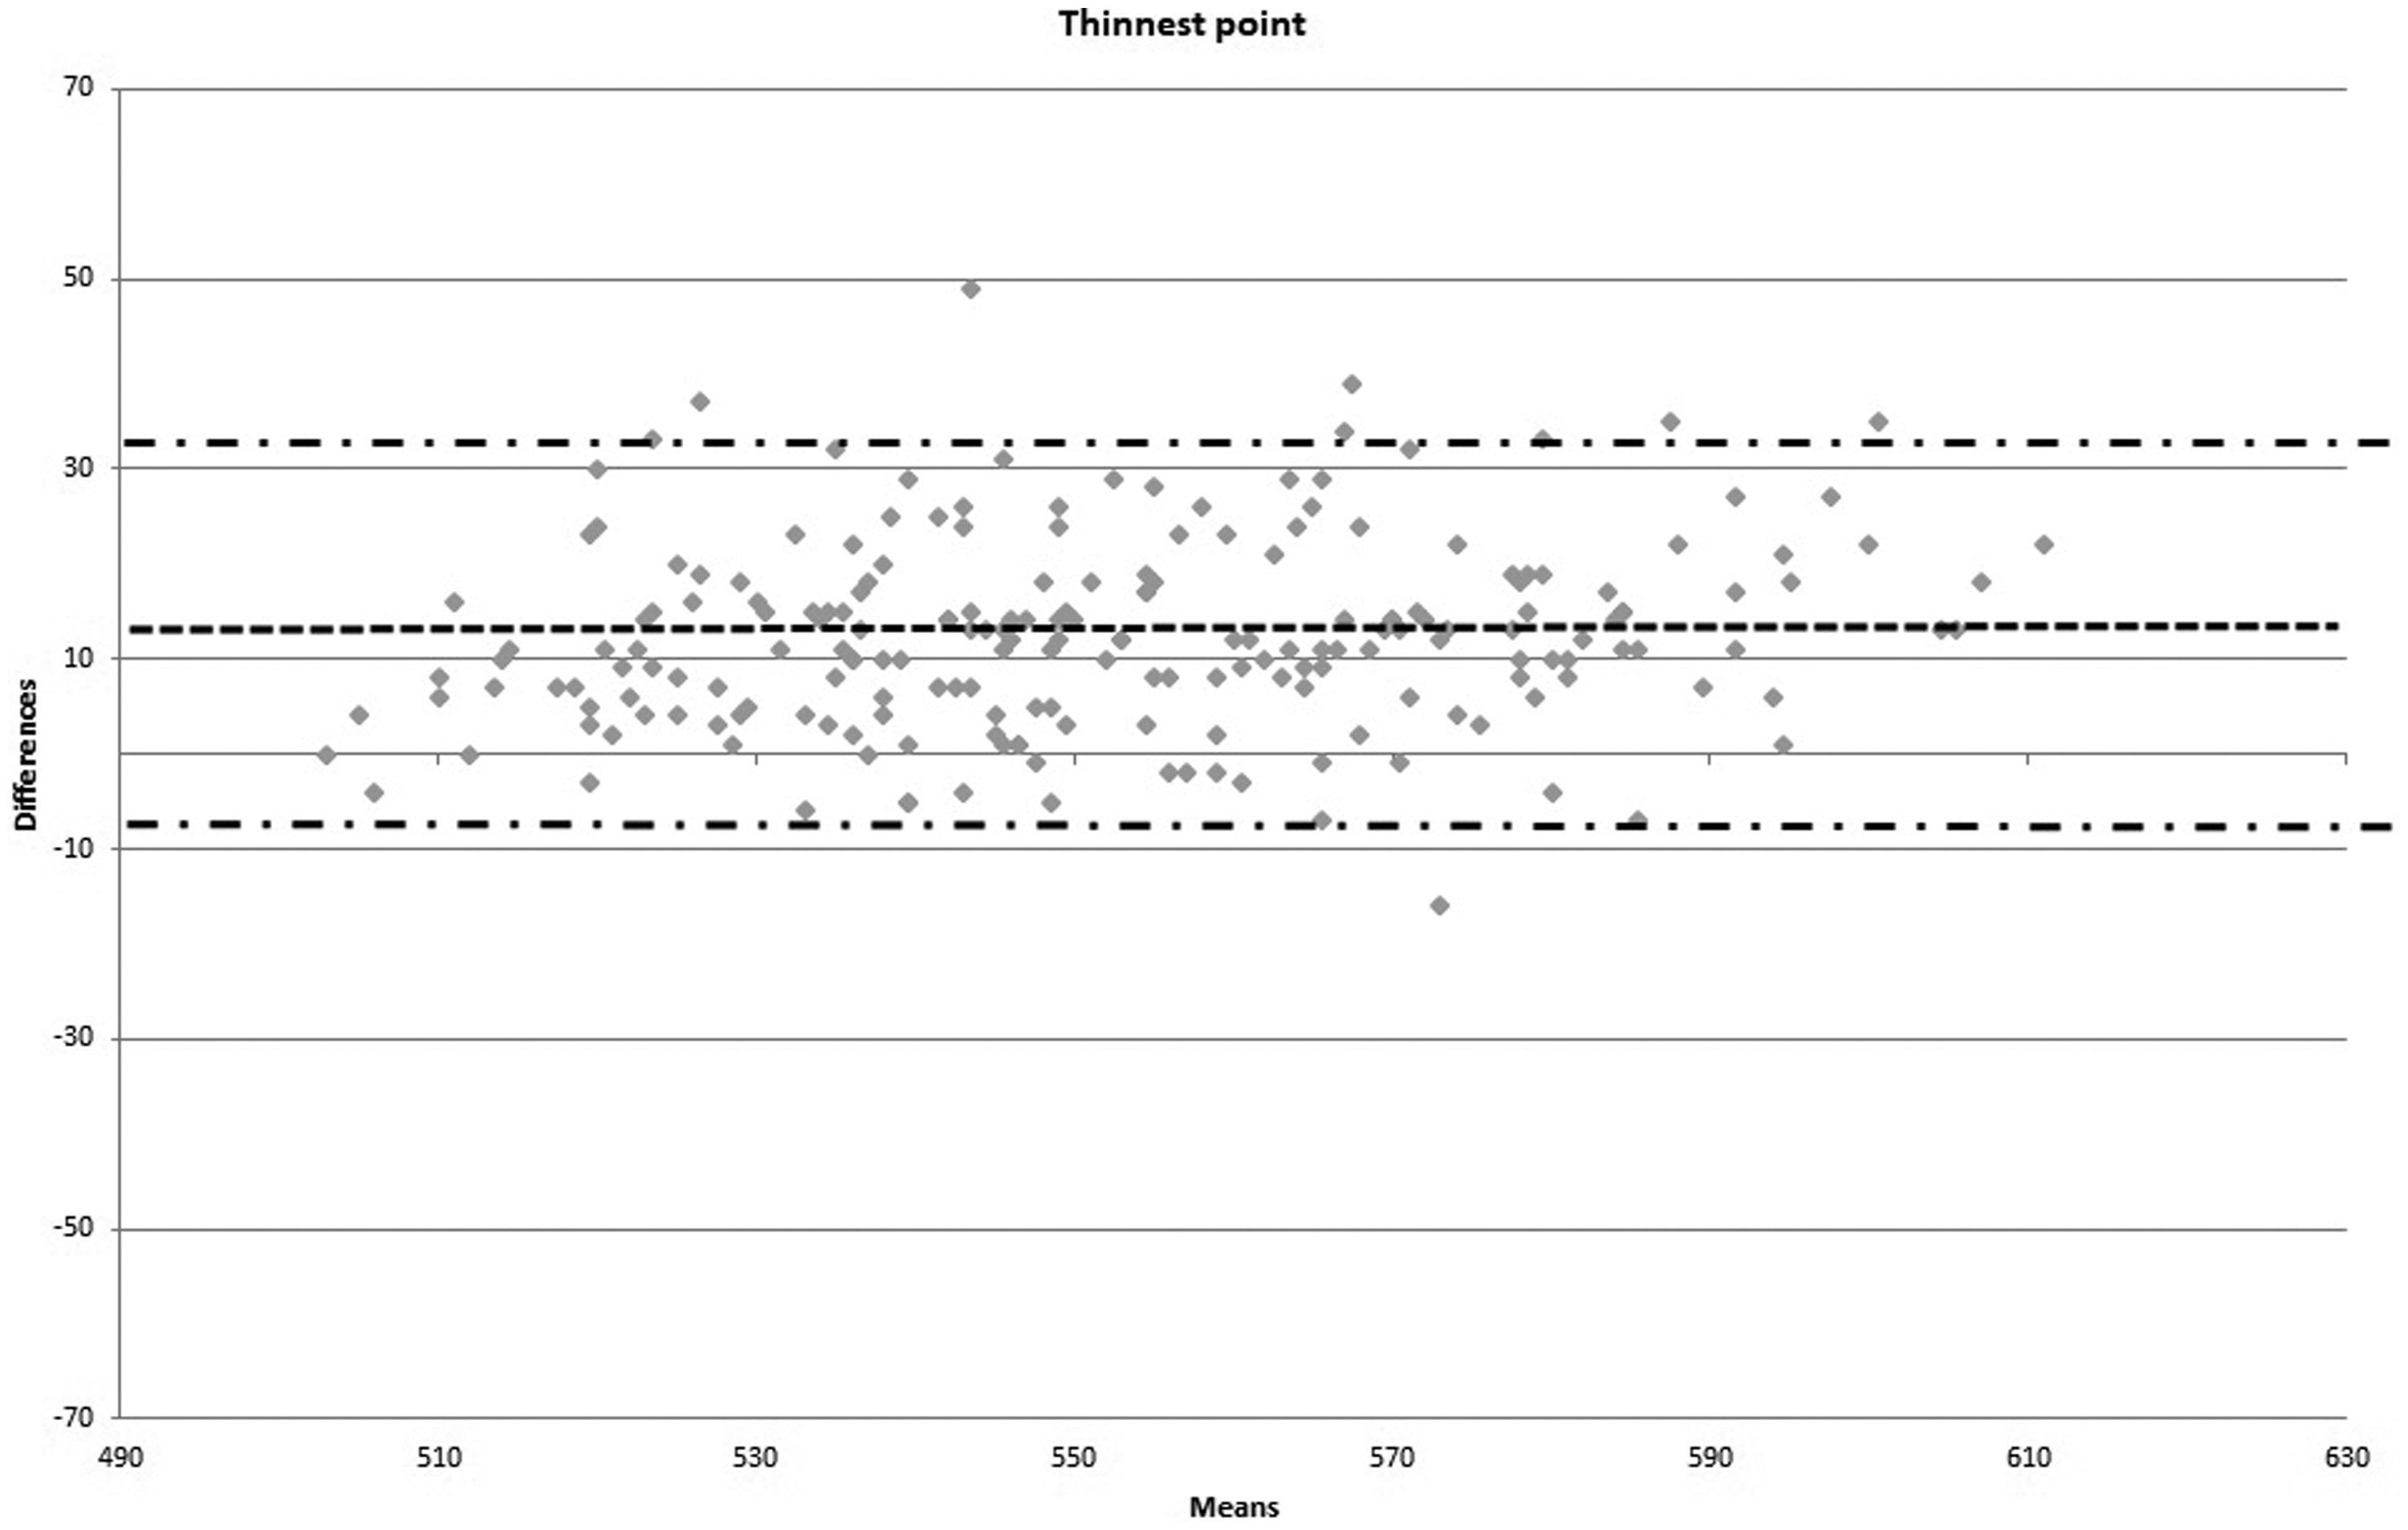
Bland–Altman correlation between corneal thickness measurements in microns obtained with the Nidek CEM-530 and Pentacam HR at the thinnest point.
The good correlation between these two devices allowed us to establish a regression formula that could make the results comparable. The following regression formulas were calculated: y = 0.8859x + 57.644 for the CA, y = 0.8852x + 56.657 for the PC, and y = 0.8557x + 68.148 for the TP, where x is the CT measured with the Nidek CEM-530 and y is the CT measured with the Oculus Pentacam HR.
Discussion
Precise measurement of the CT is important in clinical practice. Numerous devices are available for such measurements, making agreement studies mandatory.
We compared the Oculus Pentacam HR and the Nidek CEM-530 SM because these two devices do not require corneal contact and because both the Pentacam11,15,18–22 and Nidek23,24 have been singularly compared with other devices. Among these comparisons, only a few have involved a Scheimpflug camera versus SM devices15,18–20 and only one has involved a Scheimpflug camera versus the Nidek CEM-530. 25
We did not make a comparison with UP because it requires contact, may be uncomfortable for patients, and may damage the corneal epithelium with potential corneal infection; additionally, the measurement reproducibility depends on the examiner’s expertise in placing the probe.26,27
Among the studies published to date, only a few have attempted to establish a regression formula that allows for comparison between the results obtained by different devices.15,28,29
Uçakhan et al. 11 compared the central CT in 45 normal eyes between the SP-2000P Topcon noncontact SM device (Topcon Corporation, Tokyo, Japan) and the Pentacam HR. The CT measurements obtained by these two devices were significantly different but showed a good linear correlation (SP 2000P, 535.5 ± 6.5 µm; Pentacam HR, 557.6 ± 6.5, µm).
Fujioka et al. 18 compared the CT at the TP between the Pentacam and the Noncon Robo (Konan Medical, Hyogo Japan) in 135 eyes of healthy and glaucomatous subjects. The results showed a significant linear correlation (r = 0.734), but the CT obtained with the NONCON ROBO (552.04 ±42.95 µm) was significantly smaller than that obtained with the Pentacam (559.49 ±38.44 µm).
Lam and Chen 19 compared the central CT as measured by the SP-2000P Topcon SM device and the Oculus Pentacam in 39 eyes and found good agreement between the two instruments, with slightly thinner CT obtained by the SP-2000P device.
Similarly, Maloca et al. 20 compared the Oculus Pentacam version 1.19r11 with the noncontact SP-1P specular microscope, version 1.21 (Topcon Corporation) and found that the latter produced thinner central CT measurements.
De Bernardo et al. 15 evaluated the central CT in 73 healthy eyes and concluded that the CT measurement produced by the SP-3000P non-contact specular microscope was thinner than that produced by the Pentacam.
Karaca et al. 25 measured the central CT in 100 eyes with the Oculus Pentacam HR, Nidek CEM-530, and CellChek XL (Konan Medical) and reported a good correlation among the devices; however, they found that the Pentacam HR provided thicker measurements than the Nidek CEM-530.
Gonzalez-Perez et al. 21 measured the central CT with an SM device (Topcon SP-3000 specular microscope) and an Oculus Pentacam in 22 right eyes of 22 healthy adults (7 men and 15 women). They found that the Topcon SP-3000 rendered a lower average underestimation of 23 ± 32 mm and a lower correlation coefficient compared with the Pentacam.
Tai et al. 22 analyzed and compared the central CT measurements of 184 eyes of 92 healthy subjects using the same instruments and found that the mean central CT was 507.8 ± 30.2 for the Topcon SP-3000P and 538.4 ± 31.7 for the Oculus Pentacam, confirming that the Topcon SP-3000P underestimates the central CT.
One of the problems that can arise in such studies is that although different points can be measured with the Pentacam HR, it is impossible to know which of them correspond to those obtained with an SM device. To avoid subjective bias, we compared the single value obtained with an SM device with the three different points automatically obtained with Pentacam HR.
In contrast to previously published papers, we found that the Oculus Pentacam HR produces significantly thinner CT measurements than the SM device. One reason for this could be that we utilized the Pentacam HR, whereas previous studies utilized the Pentacam. Another explanation could be that we evaluated different points than did Karaca et al. 25 and Uçakhan et al. 11 In fact, in contrast to our study, they did not report the Pentacam measurements that were used for comparison with the SM device.
However, this explanation is not supported by Fujioka et al., 18 who found that the CT at the TP was thicker when measured by the Pentacam than when measured by an SM device.
The correct explanation could be that the Nidek SM device tends to give thicker CT measurements than other SM devices. In fact, Cakici et al. 24 found that the mean CT value provided by the Nidek SM was thicker than that provided by the Tomey SM (Nagoya, Japan) and Topcon SM devices.
Conclusions
Determination of which system provides the most accurate CT is not a simple task, but the use of our regression formula (which correlates the Pentacam HR with the Nidek CEM-530) may have translational relevance because it can help to easily convert one value into another, making the measurements of two devices comparable.