
Abstract
Objective
To explore concomitant neuroimaging and genetic alterations in patients with schizophrenia with or without auditory verbal hallucinations (AVHs), and to discuss the use of pattern recognition techniques in the development of an objective index that may improve diagnostic accuracy and treatment outcomes for schizophrenia.
Methods
The pilot study included patients with schizophrenia with AVHs (SCH-AVH group) and without AVHs (SCH-no AVH group). High throughput sequencing (HTS) was performed to explore RNA networks. Global functional connectivity density (gFCD) analysis was performed to assess functional connectivity (FC) alterations of the default mode network (DMN). Quantitative long noncoding (lnc) RNA and mRNA expression data were related to peak T values of gFCDs using Pearson’s correlation coefficient analysis.
Results
Compared with the SCH-no AVH group (n = 5), patients in the SCH-AVH group (n = 5) exhibited differences in RNA expression in RNA networks that were related to AVH severity, and displayed alterations in FC (reflected by gFCD differences) within the DMN (posterior cingulate and dorsal-medial prefrontal cortex), and in the right parietal lobe, left occipital lobe, and left temporal lobe. Peak lncRNA expression values were significantly related to peak gFCD T values within the DMN.
Conclusion
Among patients with schizophrenia, there are concomitant FC and genetic expression alterations associated with AVHs. Data from pattern recognition studies may inform the development of an objective index aimed at improving early diagnostic accuracy and treatment planning for patients with schizophrenia with and without AVHs.
Introduction
Auditory verbal hallucinations (AVHs) are experienced by people with a wide range of mental disorders, including schizophrenia, bipolar disorder, major depressive disorder, post-traumatic stress disorder, and borderline personality disorder. 1 Individuals without any diagnosable neuropsychiatric disorder can also experience AVHs. 2 Due to their heterogeneity, people with AVHs are at risk of misdiagnoses and improper treatment planning.
Because AVHs can be caused by a serious neurological problem, the International Consortium on Hallucination Research (ICHR) included the phenomenon in its top 10 list of hot future research topics in the field of auditory hallucinations in 2013,3,4 thereby stimulating multi-dimensional studies of auditory hallucinations. In 2015, the ICHR re-emphasized the need for multi-perspective and interdisciplinary auditory hallucination research. 5 Within the next couple of years, phenomenological and non-trend analysis research demonstrated brain functional connectivity (FC) changes in patients with schizophrenia who experience AVHs following commencement of clozapine treatment. 6 Meanwhile, the application of linear support vector machines to functional magnetic resonance imaging (fMRI) data has enabled researchers to commence delineating AVH characteristics, including white matter connectivity alterations, in patients with schizophrenia, and neuroimaging studies of AVHs have since expanded rapidly worldwide.6–8
Beyond neuroimaging, the ICHR has emphasized the importance of studying the neuropathological characteristics of AVHs from multiple perspectives in different populations. At the 2018 annual ICHR meeting, it was proposed that the pathological characteristics of and potential treatments for AVHs should be explored at molecular, synaptic, and neurotransmitter levels. 6 Accordingly, the pursuits of ‘Understanding AVHs in healthy and psychotic individuals: Features, imaging, and interventions’ (see Figure 1), 9 and ‘Auditory verbal hallucinations and the auditory network: from molecules to connectivity’ (see Figure 2), 10 have emerged as urgent problems to be solved going forward. Empirical clarification of pathological AVH subtypes may help prevent misdiagnosis and improper treatment planning in patients with AVHs, and thus, ultimately, may help clinicians to target treatment according to AVH subtype.3–8
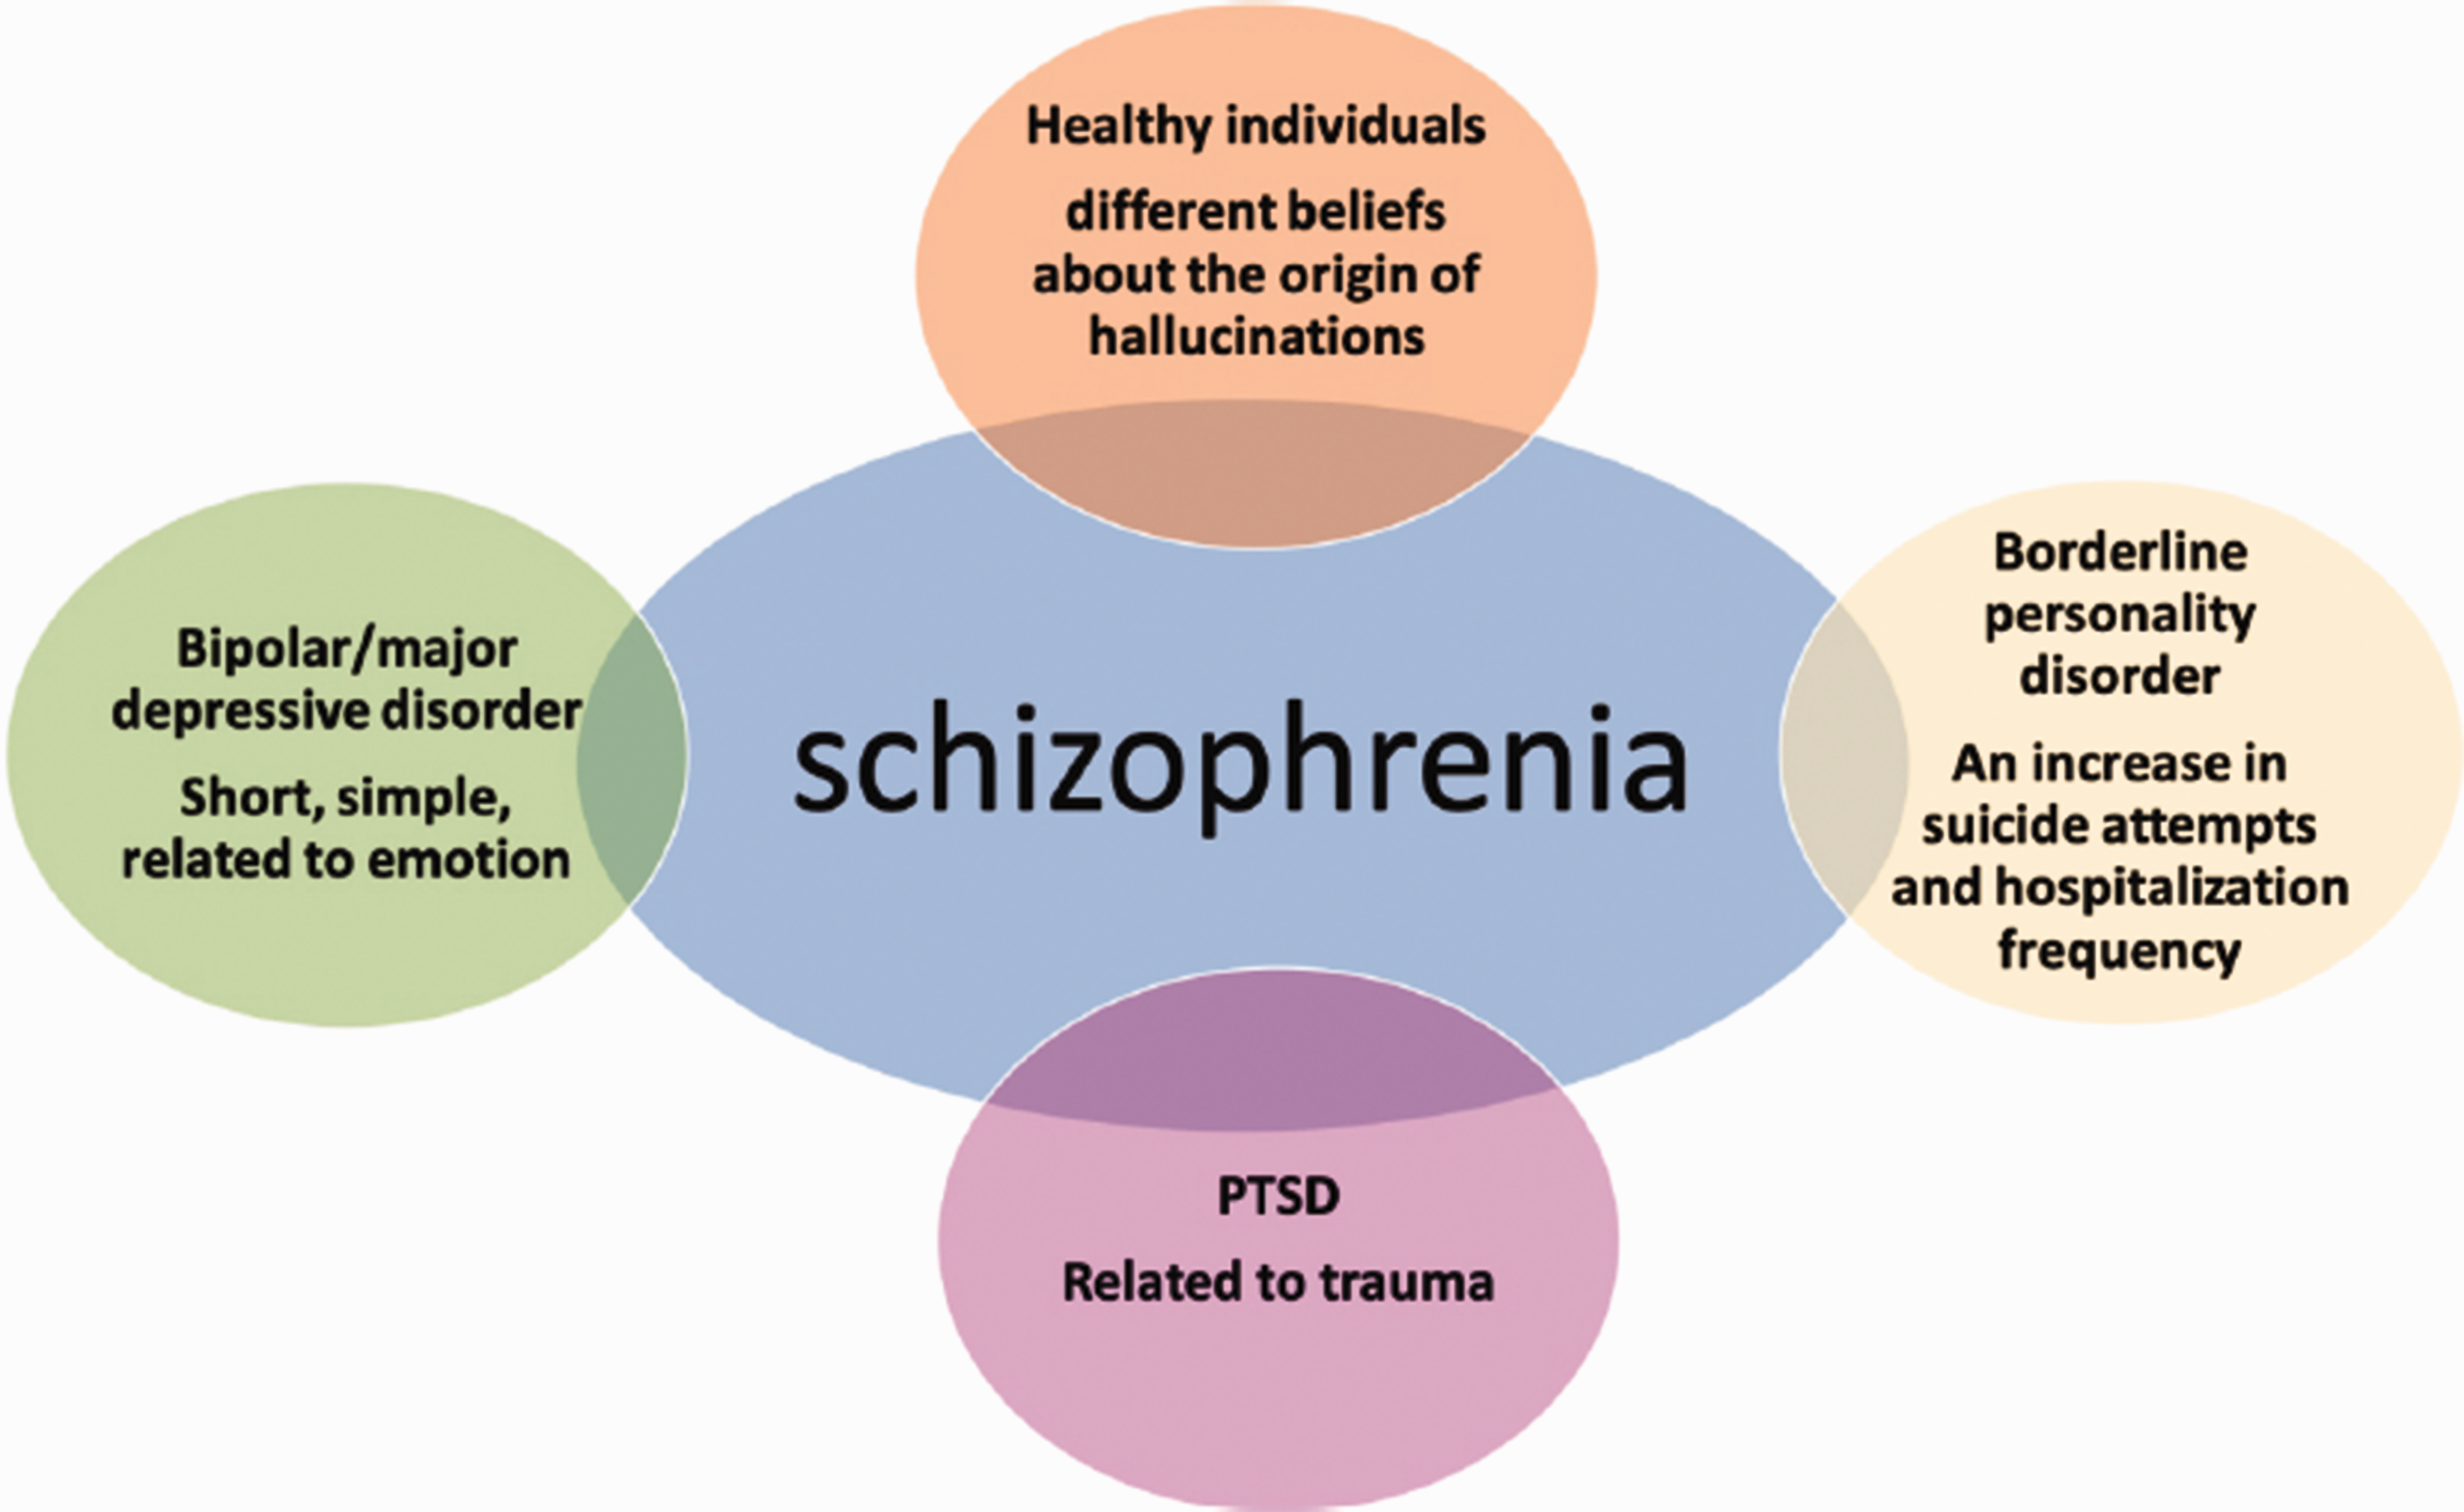
Understanding auditory verbal hallucinations (AVHs) in healthy individuals and patients with psychosis: features, imaging, and interventions (from Zhou et al., 2019). 9
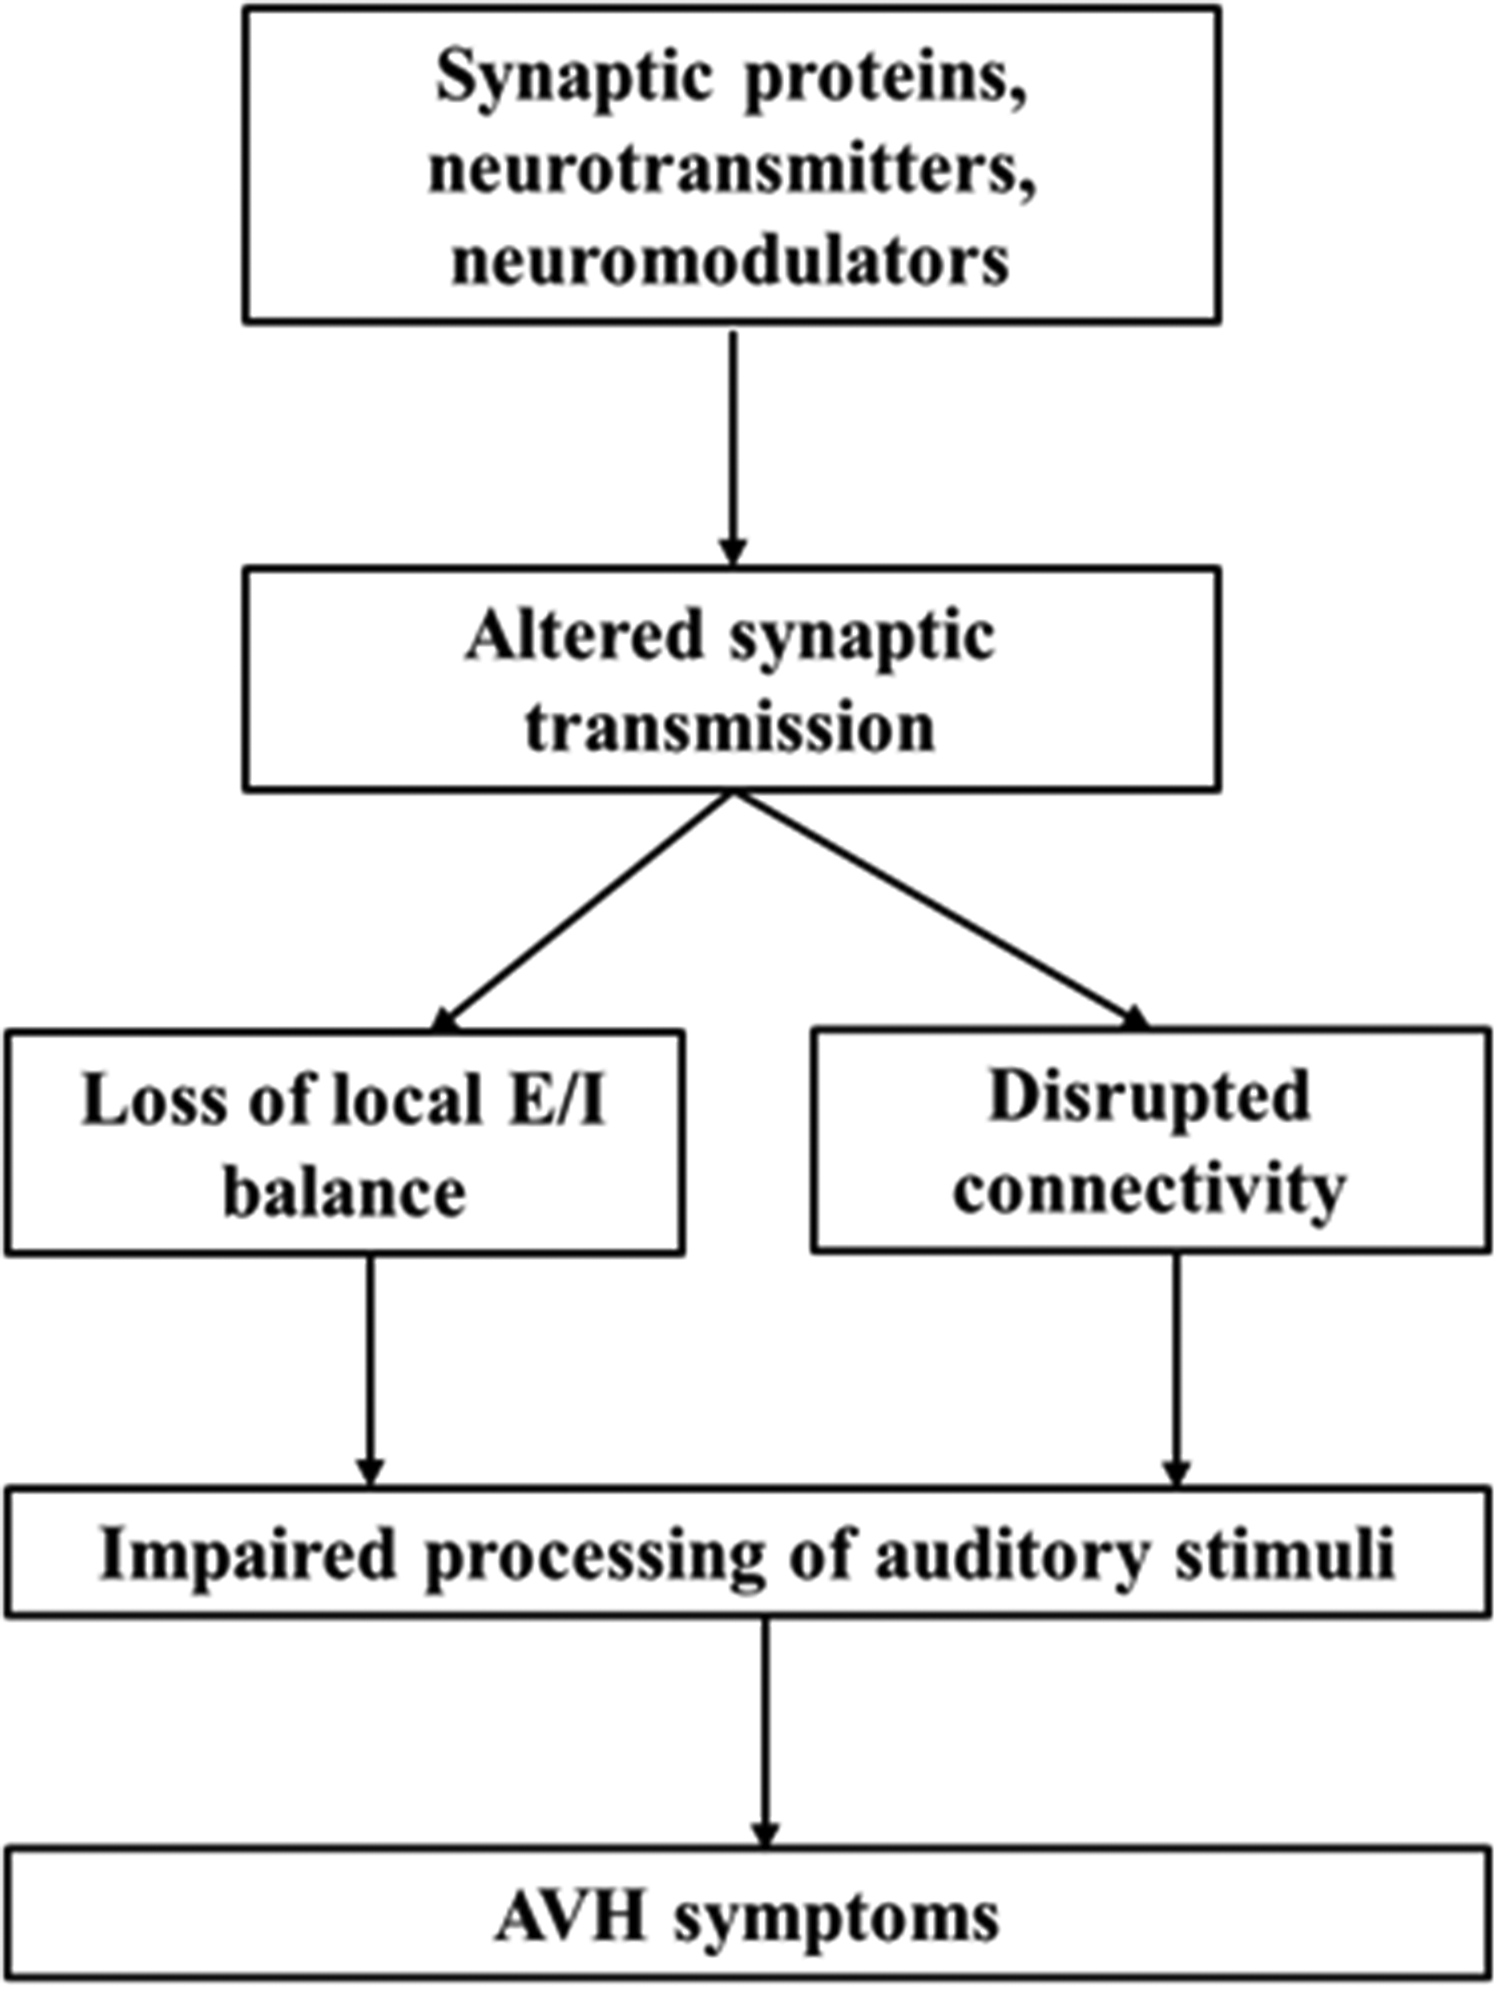
Auditory verbal hallucinations (AVHs) and the auditory network: from molecules to connectivity (from Huang et al., 2019). 10
The aim of the present pilot study was to explore concomitant neuroimaging and genetic expression alterations in a small sample of patients with schizophrenia, and to identify the alterations that differ between patients with versus those without AVHs. Specifically, global FC density (gFCD) analyses were conducted to identify patterns of FC alterations, particularly regarding the default mode network (DMN); and high-throughput sequencing (HTS) technology was adopted with weighted gene co-expression network analysis (WGCNA) and canonical correlation analysis (CCA) to identify group-related mRNA network distinctions. A discussion is provided regarding how neuroimaging, genetics, and-pattern recognition techniques may be employed to explore specific neuroimaging-marker and genetic features of AVH subtype with the goal of developing a potential objective index based on such features that can, firstly, aid the clinical diagnosis of AVHs by subtype in an early stage and, ultimately, support tailored treatment planning and the formulation of prognoses according to AVH subtype.
Patients and methods
Study population
This pilot study included two groups of patients who were recruited from the inpatient population at Tianjin Anding Hospital, Tianjin, China between July 2017 and August 2017: patients with schizophrenia with AVHs (SCH-AVH group) and patients with schizophrenia without AVHs (SCH-no AVH group). To minimize potential confounding influences on aberrant brain or genetic features, efforts were made to match these two groups with respect to sociodemographic characteristics (age, sex ratio, and educational level), schizophrenia symptom severity assessed by the Positive and Negative Syndrome Scale (PANSS), 11 and antipsychotic agent dosages (reported as chlorpromazine equivalent dosages). 12 The inclusion criteria were: (1) fully meeting criteria for schizophrenia according to the American Psychiatric Association’s Diagnostic and Statistical Manual of Mental Disorders (DSM-IV, 1994); (2) unambiguous determination of having or not having AVHs, as defined by the auditory hallucination rating scale (AHRS); 13 (3) being 18–35 years of age; (4) having an intelligence quotient ≥80; and (5) no substance misuse problems. The exclusion criteria were: (1) moderate or severe physical disease (e.g. liver or kidney disease, or diseases of the respiratory, cardiovascular, endocrine, or nervous system); (2) current recipient of electroconvulsive therapy; (3) a history of loss of consciousness for ≥5 min; (4) left-handedness (determined by the Annett Hand Preference Questionnaire), 14 and (5) any fMRI contraindication. The pilot study was approved by the Ethics Committee of Tianjin Anding Hospital and all study participants provided written informed consent.
Acquisition of fMRI data
Images were acquired with a 3T GE Discovery MR750 scanner (General Electric, Milwaukee, WI, USA) equipped with an eight-channel phased-array head coil. For SCH-AVH participants, all images were captured during an AVH episode. During scanning sessions, participants were required to remain still while lying in the supine position without falling asleep. Whole-brain resting-state fMRI data based on blood oxygen level-dependent signals were obtained with a gradient-echo echo-planar imaging sequence with the following acquisition parameters: repetition time (TR) = 2 000 ms; echo time (TE) = 45 ms; slices = 32; slice thickness = 4 mm; gap =0.5 mm; field-of-view (FOV) = 220 × 220; matrix size = 64 × 64; and flip angle (FA) =90°. Parallel imaging using the sensitivity encoding technique (factor 2) was used to acquire all images. Structural images were obtained with a high-resolution 3D Turbo-Fast Echo T1WI sequence with the following parameters: 188 slices, TR/TE = 8.2/3.2, slice thickness = 1 mm, no gap, FA = 12°, matrix size = 256 × 256, FOV = 256 × 256.15,16
Data preprocessing
Resting-state fMRI data were processed with SPM software, version 12 (http://www.fil.ion.ucl.ac.uk/spm). To allow for imaging unit stabilization and participant familiarization, the first ten scan volumes were discarded for each participant. The remaining volumes were corrected for slice-timing and motion artifacts. Translational and rotational head movements were less than 2 mm and 2°, respectively, for all participants.
Covariates, including head motion, white matter signal, and cerebrospinal fluid signal, were regressed out from the time series of every voxel. First, the Friston 24-parameter model was used to regress out effects of head motion. Next, data with a calculated frame-wise displacement >0.5 for a specific volume were regressed out. The datasets were filtered for band-pass frequencies in the range of 0.01–0.08 Hz. Individual structural images were co-registered to a mean functional image, and transformed structural images were co-registered to Montreal Neurological Institute space via linear registration. Motion-corrected functional volumes were spatially normalized to Montreal Neurological Institute space based on parameters estimated during linear co-registration. Finally, the functional images were re-sampled into 2-mm cubic voxels for further analysis. 17
Calculation of gFCD
The gFCD of each voxel was calculated according to an in-house Linux script, as previously described. 17 Functional connectivity between voxels was evaluated with Pearson’s linear correlation analysis, applying a threshold of R > 0.6. The gFCD calculations were limited to voxels within the cerebral grey matter mask. The gFCD at any given voxel, x0, was calculated as the total number of functional connections, k(x0), between x0 and all other voxels according to a growth algorithm; this calculation was completed for all x0 voxels. Next, gFCD was divided by the mean value of qualified voxels in the brain to increase the normality of the distribution. The gFCD maps were spatially smoothed by a 6 × 6 × 6 mm3 Gaussian kernel to minimize functional brain anatomy differences between participants.18,19 Changes in gFCD were subjected to family-wise error correction. 20
HTS
High throughput sequencing, which has enabled an important breakthrough in schizophrenia research, 21 was conducted with total RNA extracted from peripheral blood samples using TRIzol reagent (Invitrogen, Carlsbad, CA, USA) according to the manufacturer’s instructions. Total RNA was quantified in a NanoDrop ND-1000 machine and the integrity of each RNA sample was assessed by agarose gel electrophoresis.
Microarray assay
Long non-coding (lnc) RNAs were collated from authoritative data sources (principally Ref Seq, UCSC Known genes, and Ensembl) and RNA samples were analysed on Arraystar human 8 × 60 K lncRNA microarrays (version 2.0) containing 33 045 lncRNAs and 30 215 mRNAs. Transcripts were identified with high-accuracy specific exon or splice-junction probes. Sample labelling and array hybridization were carried out according to the Agilent One-Color Microarray-Based Gene Expression Analysis protocol (Agilent Technologies, Santa Clara, CA, USA) with minor modifications. Subsequently, the arrays were washed, fixed, and then scanned by an Agilent DNA Microarray Scanner (item No. G2505C). The microarray experiments were performed by KangChen Bio-tech (Shanghai, China).
Microarray data preprocessing
Microarray data analysis was performed in R and Bioconductor software packages. 22 Raw expression data were log2 transformed, background corrected, and normalized by quantile normalization for both lncRNA and mRNA datasets. A total of 21 250 lncRNAs and 21 654 mRNAs were carried over for further analysis.
WGCNA
Weighted gene co-expression network analysis datasets for lncRNA and mRNA were constructed in WGCNA R software. 23 First, the most variable transcripts were selected, applying the selection criterion of an absolute fold-change in expression of N 1.3 with a P value < 0.05 (two-sample t-test), 24 which yielded the selection of 3 416 lncRNAs and 384 mRNAs for construction of respective co-expression networks. Network construction was performed with the block-wise module function in WGCNA R. A Pearson’s correlation matrix was calculated for all possible RNA pairs and then transformed into an adjacency matrix according to a power function, which resulted in a weighted network. A dynamic tree cut algorithm was used to detect groups of highly correlated genes. Modules were defined as tree branches and colour-coded. Network preservation was assessed with the module preservation function. 25 A preservation statistic Z summary N 2.0 indicated that the module in one group was significantly preserved in another group. 26 The expression profiles of each module were summarized by the module eigengene, which was defined as the first principal component of the module. The modules were subjected to multiple regressions with age and sex as covariates using the linear model in the limma R package. 27 In putative disease-related modules, RNAs that had high connectivity were identified as hub RNAs.
Statistical analyses
Data are reported as mean ± SD. To define relationships between disease-associated hub lncRNAs and mRNAs, CCA analysis was performed using the CCP program in R. 28 , 29 Pearson’s correlation coefficient analysis was performed using SPSS software, version 21.0 (IBM, Armonk, NY, USA) to identify relationships between peak T-values of FC in the fMRI data and hub lncRNA and associated mRNA expression quantities. P values < 0.05 were considered to be statistically significant.
Results
Demographic and clinical profile of the study population
A total of five female patients were enrolled in the SCH-AVH group (mean age, 38.5 ± 4.5 years; mean educational level, 16.5 ± 2.5 years of schooling; mean PANSS score, 71.3 ± 5.0; and mean AHRS score, 12.0 ± 2.5). The SCH-AVH group had a mean illness duration of 36.0 ± 6.0 months and mean antipsychotic drug dosage of 625.0 ± 125.5 mg/d (chlorpromazine equivalent dosage). Five female patients were enrolled into the demographically-matched SCH-no AVH group (mean age, 38.0 ± 2.0 years; mean educational level, 16.0 ± 2.0 years; and mean PANSS score, 69.5 ± 3.9). The SCH-no AVH group had a mean illness duration of 34.5 ± 5.6 months and mean antipsychotic drug dosage of 600.0 ± 130.5 mg/d (chlorpromazine equivalent dosage). The two groups were statistically similar (P > 0.05) regarding the aforementioned clinical and demographic variables.
Between-group differences in lncRNA and mRNA expression
Expression profiles for lncRNA and mRNA in the SCH-AVH and SCH-no AVH groups are presented as fragments per kilobase of transcript per million mapped reads (FPKMs; Figure 3a). Compared with the SCH-no AVH group, the SCH-AVH group displayed significantly higher lncRNA and mRNA expression levels, in FPKMs, as well as greater interactions between lncRNA MSTRG.96171.1 and 13 different mRNAs. A schematic of this lncRNA-mRNA network is shown in Figure 3b. LncRNA MSTRG.96171.1 was found to interact with the following mRNAs: poly(ADP-ribose) polymerase family member 14 (PARP14); calcium-binding protein 39 (CAB39); bromodomain containing 2 (BRD2); toll-like receptor 6 (TLR6); adenosine A2A receptor (ADORA2A); slingshot phosphatases 3 (SSH3); aspartic peptidase retroviral-like 1 (ASPRV1); kyphoscoliosis peptidase (KY); ligand dependent nuclear receptor corepressor (LCOR, formerly known as chromosome 10 open reading frame 12 or C10orf12); ribosomal protein S18 (RPS18); GRINL1A complex locus 1 (GCOM1); thymosin beta 4 X-linked (TMSB4X); and transmembrane protein 63C (TMEM63C).

Compared with the schizophrenia without AVHs (SCH-no AVH) group, patients in the schizophrenia with AVHs (SCH-AVH) group had significantly differentiated expression of components of a long noncoding (lnc) RNA-mRNA network as well as functional connectivity (FC) alterations affecting default mode network (DMN) structures. (a) LncRNA and mRNA expression profiles, reported in fragments per kilobase of transcript per million mapped reads (FPKMs) of the two groups. (b) LncRNA-mRNA network that was found to have a differential expression profile between the SCH-AVH and SCH-no AVH groups. Interactions among lncRNA MSTRG.96171.1 (octagon node) and 13 defined mRNAs (diamond nodes) are shown, including lncRNA-mRNA (wavy lines) and mRNA-mRNA (straight lines) interactions. (c) Representative images showing FC alterations in SCH-AVH participants (C1, coronal; C2, sagittal; and C3, axial images); and (d) LncRNA-mRNA network-related FC alterations in SCH-AVH participants (D1, coronal; D2, sagittal; and D3, axial images). PARP14, poly(ADP-ribose) polymerase family member 14; CAB39, calcium-binding protein 39; BRD2, bromodomain containing 2; TLR6, toll-like receptor 6; ADORA2A, adenosine A2A receptor; SSH3,slingshot phosphatases 3; ASPRV1, aspartic Peptidase Retroviral Like 1; KY, kyphoscoliosis Peptidase; C10orf12, chromosome 10 open reading frame 12; RPS18, ribosomal Protein S18; GCOM1, GRINL1A Complex Locus 1; TMSB4X, Thymosin Beta 4 X-Linked; and TMEM63C, transmembrane protein 63C.
Between-group differences in FC
Significantly greater FC (represented by gFCD data) was observed within the DMN, as well as in the right parietal lobe, left occipital lobe, and left temporal lobe of participants in the SCH-AVH group compared with those in the SCH-no AVH group. Representative images from SCH-AVH-group patients are shown in Figure 3c.
Correlations between lncRNAs and peak gFCD T values within the DMN
Pearson analysis demonstrated significant correlation (P < 0.05) between peak gFCD T-values in major components of the DMN and lncRNA MSTRG.96171.1 associated expression (representative images from SCH-AVH-group patients are shown in Figure 3d). Specifically, peak T-values located in the posterior cingulate (r = 0.47) and in the dorsal-medial prefrontal cortex (r = 0.53) correlated with LncRNA MSTRG.96171.1 expression quantity.
Discussion
In the present study, HTS revealed a differentiated RNA network between patients with schizophrenia who experience AVHs and those who do not (SCH-AVH group versus SCH-no AVH group). An inter-group comparison of gFCD data revealed pathways with increased FC within the DMN and within the right parietal lobe, left occipital lobe, and left temporal lobe in the SCH-AVH group compared with values obtained for the SCH-no AVH group. Furthermore, peak T values for FCs of three major structures in the DMN were found to correlate with lncRNA MSTRG.96171.1 network expression.
Long noncoding RNAs have been reported to affect downstream gene expression, to interfere with RNA splicing, to regulate the activity of proteins by binding them, to act as structural components in nucleic acid-protein complexes, and to change the cellular localization of proteins.30–38 Hence, elucidating the relationship between lncRNAs and schizophrenia can provide insights into the pathological mechanisms of schizophrenia. A previous post-mortem study revealed a schizophrenia-related mRNA network comprising lncRNAs and mRNAs in amygdala tissue. 39 Though they were generated from a very small sample pilot study, the present findings provide a new clue for investigating genetic and structural characteristics of schizophrenia in the brains of living patients. Future large-sample cohort studies may help to clarify RNA network influences on the pathological mechanisms of schizophrenia.31–38
Previously, the present authors found that FC strength alterations within the DMN (as a unit) correlated with lncRNA-mRNA network alterations in schizophrenic patients with AVHs. 40 In the present pilot study, a different FC index was used, namely gFCD, which reflects the number of voxels that are functionally connected to each other voxel in the brain, and the relationship between gFCD alterations and expression of components in a lncRNA-mRNA network was analysed. Importantly, because gFCD represents the information communication ability of the whole brain, 41 the presently observed gFCD differences between the SCH-AVH and SCH-no AVH groups indicates that the characteristic of experiencing AVHs is associated with differentiable information communication characteristics within the schizophrenic population. Furthermore, this alteration in FC strength appears to occur concomitantly with alterations in mRNA expression, providing evidence to support the possibility that AVHs are related to alterations in both DMN FC strength, 40 as well as to alterations in the numbers of functionally connected voxels throughout the brain (current data) that can be related to abnormal expression within a lncRNA-mRNA network.
Clinical phenotyping bridges
Genomic features are endogenous characteristics whereas neuroimaging anomalies may reflect neuropathological characteristics that underlie endophenotypes. It can be inferred that genes influence, at least to some extent, the neuropathological characteristics in patients with schizophrenia, including the phenotypic expression of AVHs. Upon being verified and confirmed to be reliable, phenotype-characteristic brain neuroimaging and gene expression markers may be related to explicit clinical manifestations of AVHs and used to monitor patient responses to therapy. In this context, a bridge is an observable marker that reflects relationships among endogenous genetic characteristics, dominant clinical features, and therapeutic outcomes. The identification of characteristic markers that can be used as a bridge may be useful for clinical phenotyping in advance of symptom onset or progression, and may further provide an objective basis for early intervention before symptoms become prominent. A summary of this proposed relationship between internal phenotype and neuroimaging bridges is presented in a schematic diagram in Figure 4.

Cartoon showing use of bridges developed from genetic-neuroimaging techniques to assess auditory verbal hallucination (AVH) subtypes, such as AVHs in major depressive disorder (subtype A), AVHs in schizophrenia (subtype B), and AVHs in healthy individuals (subtype C).
Given current technological limitations, there is not yet enough information to establish a reliable bridge with which to fully explore the mechanisms that mediate AVHs. For example, electrophysiological studies capture only broad-based signals from the whole brain during AVHs, without providing any direct quantitative information regarding levels or release of neurotransmitters in the brain.42–46 The present data are suggestive of a tentative bridge with which to explore the mechanisms mediating AVHs (Figure 4). Future technical advancements may lead to the recognition of a robust bridge, or bridges, that can be used for in-depth studies of the AVH phenomenon.47–51
Future outlook
Epidemiological evidence suggests that researchers should define a precise classification scheme and develop targeted therapies for auditory hallucinations in the contexts of different clinical conditions. Meanwhile, symptomatology research has indicated that a qualitative diagnosis of patients experiencing AVHs should be made early in differential diagnoses. Differentiable neuroimaging presentations of different disorders presenting with AVHs suggests that specific therapeutic targets for treating AVHs should be informed by particular diagnoses. The authors expect that genetic studies will continue to reveal genomic associations with AVHs that are specific to particular disorders. Furthermore, genomic associations with AVHs should be explored in different study populations, including in patients diagnosed with various neuropsychiatric disorders. Machine learning approaches can be used to establish early qualitative diagnostic and predictive indicators related to AVHs, including in the context of particular disorders. The development of qualitative diagnostic and therapeutic efficacy prediction models in patients with AVHs who have various diagnoses may improve the accuracy and repeatability of prediction models, and may, ultimately, facilitate the delivery of early, potentially curative treatments.7,52–60
Data related to genomic characteristics, brain characterizations (endophenotypes), clinical manifestations, and prognostic characteristics (phenotypes) may be submitted to machine learning algorithms to establish disease optimization classifiers that reveal characteristics that are specific to particular diagnoses or common across neurological conditions accompanied by AVHs. This approach may provide a basis for early AVH diagnosis and treatment models in different diagnostic contexts based on imaging and genetic features. Moreover, such data may enable the development of an objective evaluation system to improve diagnosis and treatment efficiency. These developments should lead to a reduction in AVH-induced harm. Empirical elucidation of highly specific and stable imaging and genetic features of individuals who experience AVHs in different neuropsychiatric disorders, and the identification of precise clinical targets for potential early treatment, should stimulate discussion among basic scientists and clinicians. Advancement of the study of auditory hallucinations as a global problem should reduce the pitfalls of trial-and-error treatment approaches.56–62 A proposed prediction model is shown in Figure 5.
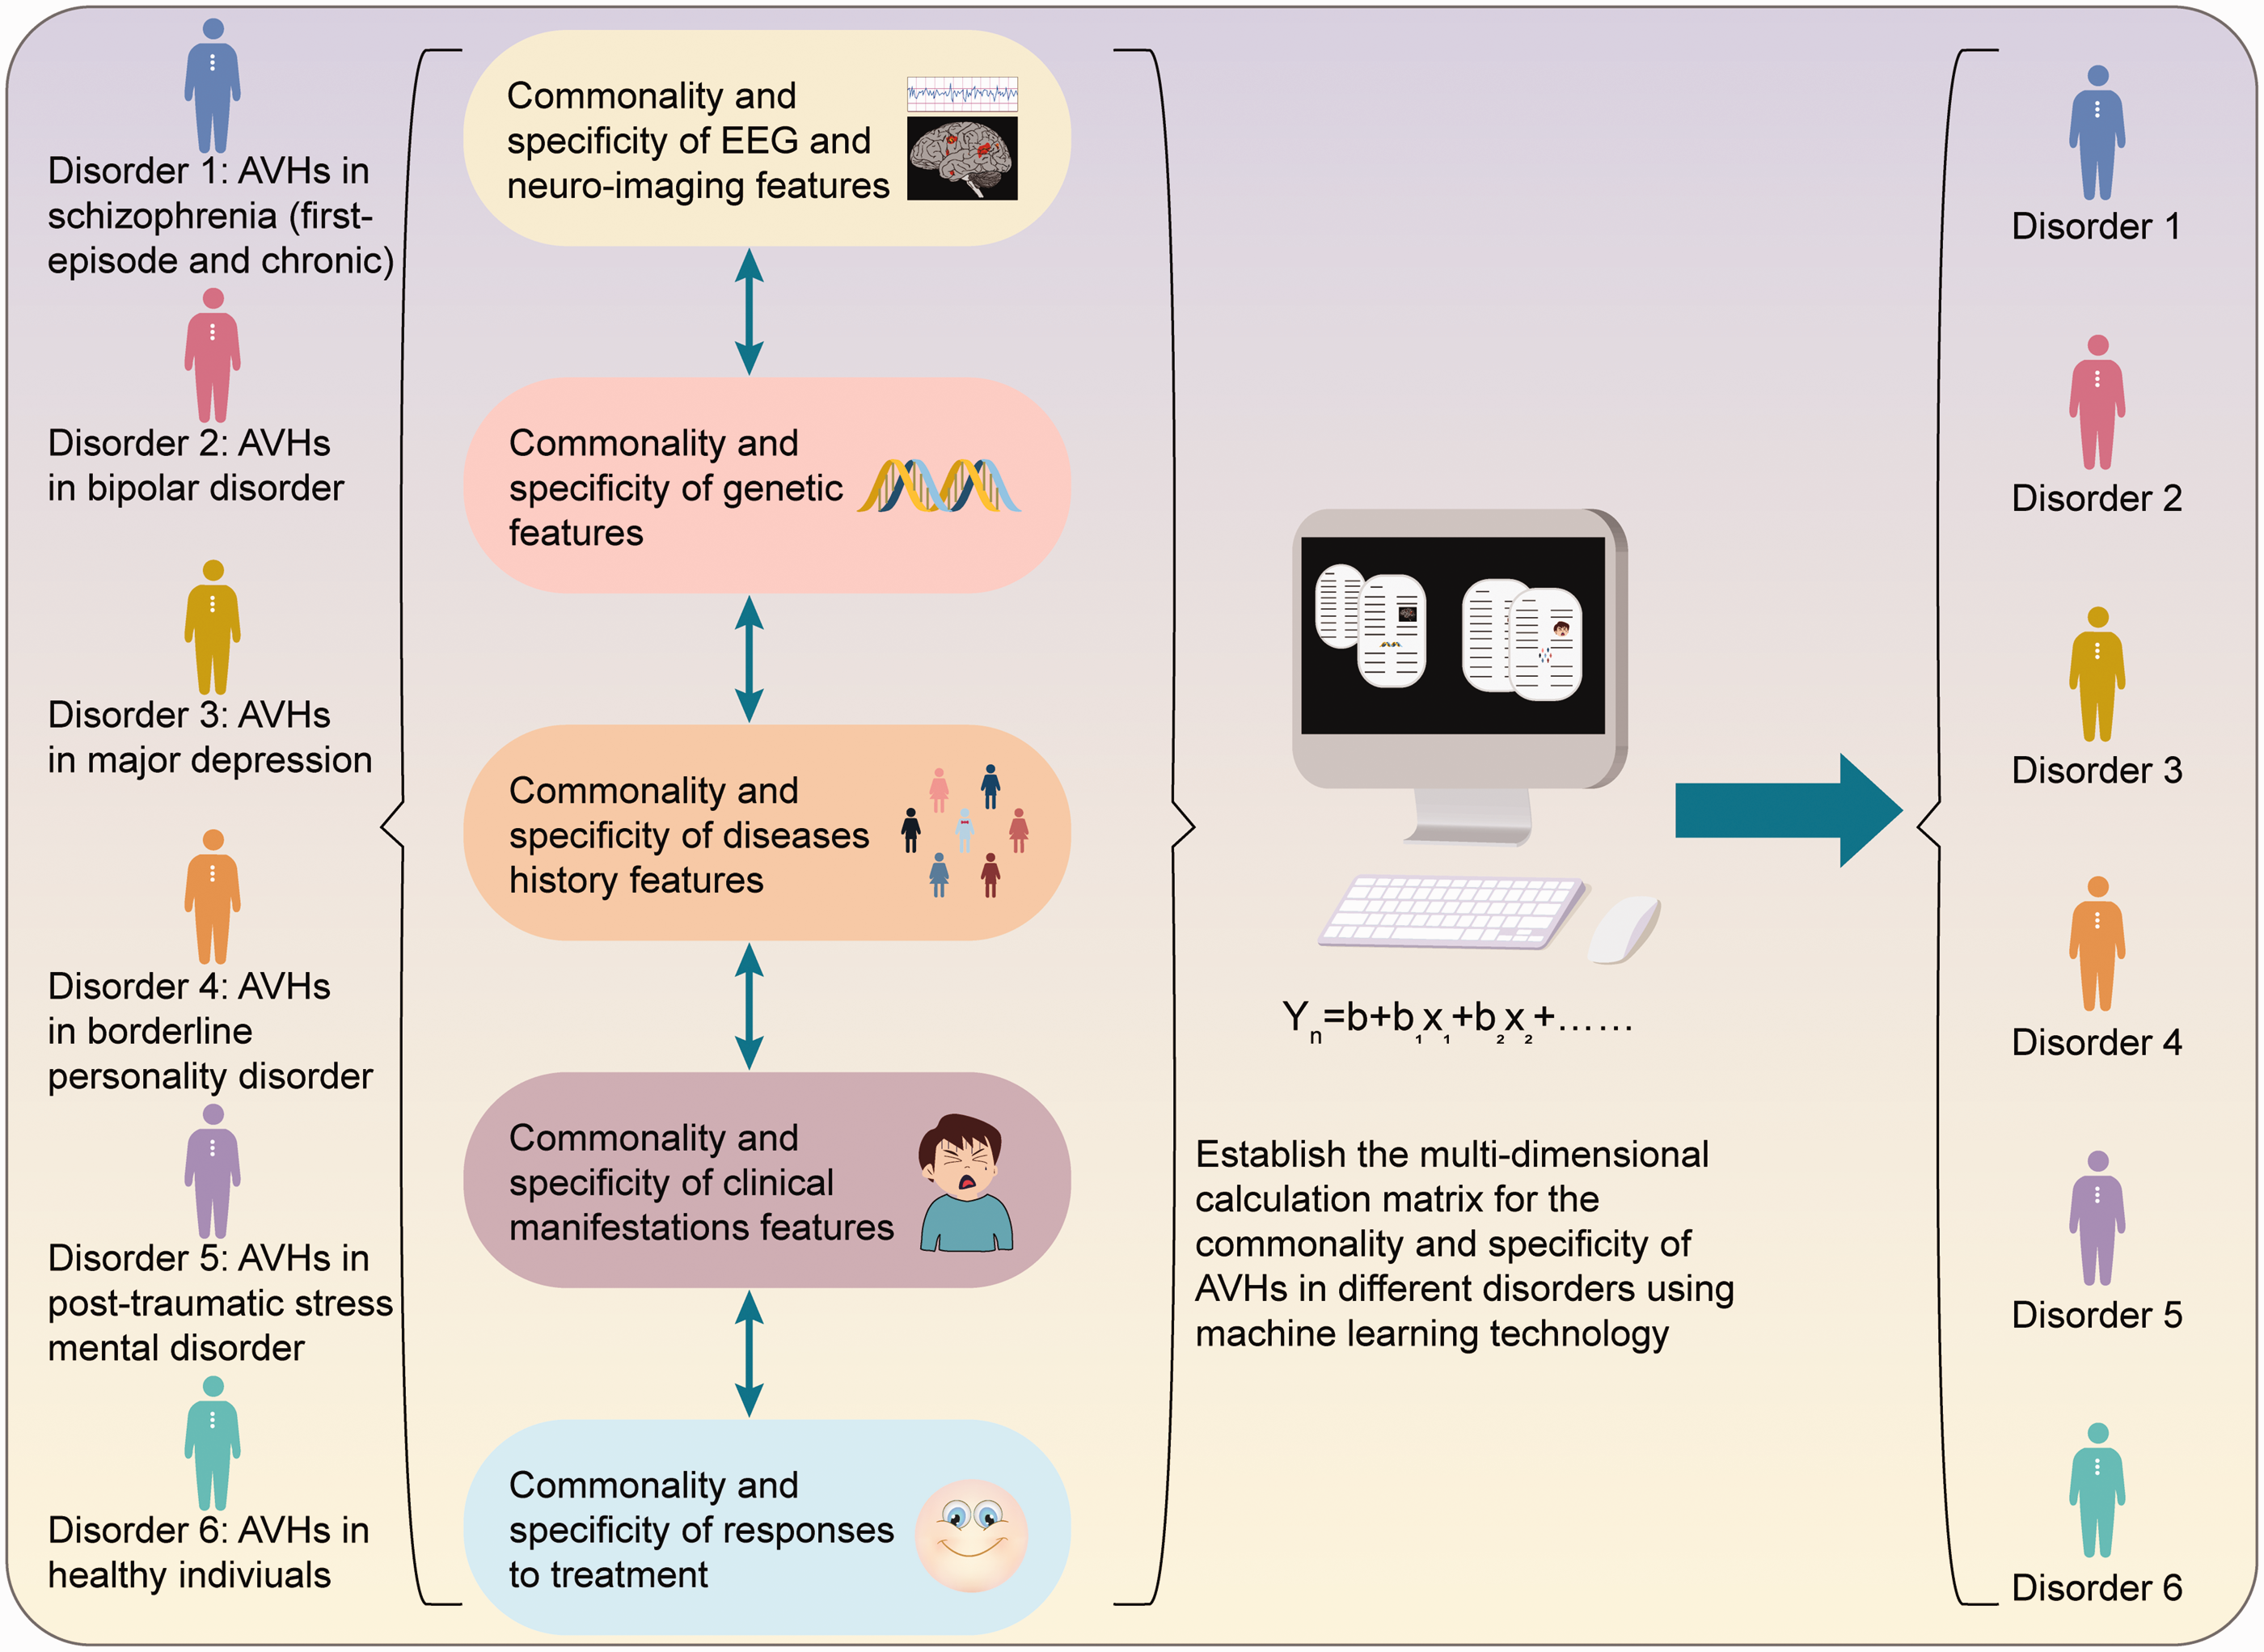
Prediction model based on baseline genetic data, brain neuroimaging, and clinical manifestations. The ideal predictive model would be able to classify different auditory verbal hallucination (AVH) subtypes in the early stages of illness. EEG, electroencephalogram.
Conclusion
The present study revealed AVH-associated FC alterations among patients with schizophrenia, within the DMN and within the right parietal lobe, left occipital lobe, and left temporal lobe, as well as greater interactions of lncRNA MSTRG.96171.1 with the expression of 13 different mRNAs. Because AVHs occur in diverse populations, including in individuals with a diverse range of neuropsychiatric disorders, as well as in healthy individuals, the present authors propose exploring concomitant AVH-associated neuroimaging and genetic alterations that are diagnosis-specific, in addition to those that are common across diagnoses. The submission of such data to pattern recognition techniques may inform the development of an objective index that could be used to support early differential diagnosis and, ultimately, improve treatment planning for patients with AVHs. Other scholars are invited to join in improving the quality of research in this field with the ultimate goal of reducing AVH-associated distress.
Footnotes
Declaration of conflicting interest
The authors declare that there is no conflict of interest.
Funding
This work was supported by grants from the National Natural Science Foundation of China (81871052 to CZ), the Key Projects of the Natural Science Foundation of Tianjin, China (17JCZDJC35700 to CZ), the Tianjin Health Bureau Foundation (2014KR02 to CZ), the National Key Research and Development Program of China (2016YFC1307004 to YX), the Shanxi Science and Technology Innovation Training Team’s Multidisciplinary Team for Cognitive Impairment (201705D131027 to YX), the Zhejiang Public Welfare Fund Project (LGF18H090002 to DJ), the Tianjin Anding Hospital Outstanding Award (300,000 CNY granted to CZ), and the key project of Wenzhou Science and Technology Bureau (ZS2017011 to XL).