
Abstract
Objectives
White matter hyperintensities (WMH) are a common imaging finding indicative of cerebral small vessel disease. Lesion segmentation algorithms have been developed to overcome issues arising from visual rating scales. In this study, we evaluated two automated methods and compared them to visual and manual segmentation to determine the most robust algorithm provided by the open-source Lesion Segmentation Toolbox (LST).
Methods
We compared WMH data from visual ratings (Scheltens’ scale) with those derived from algorithms provided within LST. We then compared spatial and volumetric WMH data derived from manually-delineated lesion maps with WMH data and lesion maps provided by the LST algorithms.
Results
We identified optimal initial thresholds for algorithms provided by LST compared with visual ratings (Lesion Growth Algorithm (LGA): initial κ and lesion probability thresholds, 0.5; Lesion Probability Algorithm (LPA) lesion probability threshold, 0.65). LGA was found to perform better then LPA compared with manual segmentation.
Conclusion
LGA appeared to be the most suitable algorithm for quantifying WMH in relation to cerebral small vessel disease, compared with Scheltens’ score and manual segmentation. LGA offers a user-friendly, effective WMH segmentation method in the research environment.
Keywords
Introduction
White matter hyperintensities of presumed vascular origin (WMH) are a common magnetic resonance imaging (MRI) finding in older adults, indicative of cerebral small vessel disease and associated with age and vascular and metabolic risk factors. Increased WMH burden has also been associated with cognitive decline, gait disturbance, increased risk of stroke, dementia, and death. 1
The development of computed tomography imaging enabled the first in vivo visualization of WMH, which was further improved by the development and progression of MRI technologies. 2 For example, 7 T MRI has recently allowed for increasingly sensitive imaging of brain lesions, such as those arising from multiple sclerosis (MS), 3 while the development of techniques such as magnetic resonance angiography has allowed visualization of the cerebral vasculature. 4 However, the increasing ability to acquire more detailed images of the brain and WMH is accompanied by the need for efficient and reliable methods of quantifying these lesions.
To date, most studies of WMH have used semi-quantitative visual rating scales to determine WMH severity. These visual rating scales, such as Fazekas and Scheltens’ scales,5,6 aim to quantify the lesion burden based on visual assessment of the size and location of the lesions. However, this approach is time-consuming, requires significant training, and is prone to inter-/intra-rater variability and floor/ceiling effects.7,8 Semi- and fully automated lesion segmentation algorithms have thus been developed in recent years to compensate for some of the issues associated with visual rating scales.
An open-source, fully automated segmentation toolbox, developed and evaluated against manual segmentation of brain white matter lesions arising from MS, 9 has proved popular in recent lesion segmentation analyses. This Lesion Segmentation Toolbox (LST) software is an extension of the Statistical Parametric Mapping: The Analysis of Functional Brain Images (SPM) MATLAB-based toolbox. MATLAB is a software environment and programming language commonly used in biomedical imaging, with applications including data analysis, signal processing, machine learning, and computer vision. Many widely used brain image analysis toolboxes have been developed for SPM and MATLAB, including applications for region of interest analysis, brain atlases, and functional MRI analysis.
Previous studies evaluated the performance of the LST toolbox against already well established automated algorithms including k-Nearest Neighbor with Tissue Type Priors, and Lesion Topology preserving Anatomical Segmentation, and showed that the Lesion Probability Algorithm (LPA) provided by LST performed better in spatial and volumetric analyses than other tested methods. 10 Further studies compared supervised learning algorithms (Support Vector Machine, Random Forest, Deep Boltzmann Machine, and Convolution Encoder Network) with the fully automated algorithms in LST and found that the performance of the algorithms was comparable, indicating that WMH quantification is a challenging problem with many possible solutions. 11 LST has also shown potential for evaluating fluid-attenuated inversion recovery (FLAIR)-detected brain lesions in patients with amyotrophic lateral sclerosis 12 and in patients with diabetes. 13
In this study, we aimed to validate two algorithms, the Lesion Growth Algorithm (LGA) and LPA provided by the LST. We first determined the optimal threshold values required to obtain comparable results for total lesion volume (TLV) derived from the LST-based algorithms and Scheltens’ scores. We then compared spatial and volumetric results between the LST-based algorithms and manual (i.e., hand-drawn) WMH segmentation.
Materials and methods
Subjects
Participants were included in this study if they had MRI, visual rating scores, and manually segmented lesion data readily available from previous studies in the Aberdeen Biomedical Imaging Centre. Participants were not newly recruited for the present study. WMH lesion scores from Scheltens’ scale were compared with TLV from the LST algorithms based on MRI results obtained from participants at age 68 years and again at 72 years, and imaging data from both scanning sessions were included in this analysis.
Regarding spatial and volumetric comparisons, MRI results were used to determine the optimal LST algorithm compared with spatial and volumetric data derived from manual (i.e., hand-drawn) lesion maps.
All participants provided written informed consent, and the studies were approved by the North of Scotland Research Ethics Committee.
MRI
For comparisons with Scheltens’ visual score, brain MRI was performed using a 1.5 T NVi system (General Electric, Milwaukee, WI, USA). Three-dimensional T1-weighted structural images were obtained using a spoiled gradient recalled acquisition sequence (repetition time (TR)/echo time (TE) = 20/6 ms; flip angle (FA) = 35°; number of slices = 24; slice thickness = 1.6 mm, matrix = 256 × 192; in-plane resolution = 1 × 1 mm). Axial FLAIR images were obtained to evaluate WMH (TR/TE = 9002/1.33 ms; inversion time (TI) = 2200; slice thickness = 5 mm, space = 1.2 mm).
For spatial and volumetric comparisons, brain MRI was carried out using a 3 T Philips Achieva TX-series system (Philips Healthcare, Best, The Netherlands). Three-dimensional T1-weighted (TR = 8.2 ms; TE = 3.8 ms; TI = 1031 ms; FA = 8°; field of view (FOV) = 240 mm; matrix = 240 × 240; voxel size = 1.0 × 1.0 × 1.0 mm3) and axial FLAIR sequences (TR = 8000 ms; TE = 349 ms; TI = 2400 ms; FOV = 240 mm; matrix size = 240 × 238; voxel size = 0.94 × 0.94 × 1.00 mm3) were used.
Visual lesion rating
WMH visual ratings were assessed by experienced neuroradiologists using Scheltens’ scale. 5 WMH within different brain regions was rated from 0 to 2 or from 0 to 6, based on the location, lesion size, and number of observable lesions (greater scores indicated greater lesion burden). Regional WMH data were measured and collated into a global total Scheltens’ score for each participant.
Manual lesion segmentation
For spatial and volumetric comparisons, visual lesion maps were created using the Medical Image Processing, Analysis, and Visualization (MIPAV 14 ) application to manually delineate and fill WMH in axial FLAIR images. Outputs were assessed by experienced analysts upon completion. The manual lesion maps allowed for spatial comparison with lesion probability maps obtained using LST. TLVs (mL) of WMH segmented in the manual lesion maps were calculated in MATLAB, allowing volumetric comparisons between manual and automated lesion segmentation approaches.
Automated lesion segmentation
Automated lesion segmentation was performed using the LGA and LPA algorithms provided by LST. 9 LGA requires T1 and FLAIR images, and LPA requires only a FLAIR image. The outputs of both algorithms were lesion probability maps, TLV (mL), and total lesion number.
LGA segments the T1 image into three main tissue classes: white matter, gray matter, and cerebrospinal fluid. This information is combined with a co-registered FLAIR image to provide a lesion belief map for each class. An initial binary lesion map obtained by imposing a predetermined initial threshold (κ) on the independent maps is then grown along hyperintense voxels in the FLAIR image.
LPA uses a binary classifier approach. This classifier was trained using data from 53 patients with MS with high lesion burdens. LPA uses a lesion belief map and a spatial covariate that accounts for voxel-specific changes in lesion probability. Information from this training data (i.e., parameters of the model fit) are used to segment lesions in novel images (i.e., previously ‘unseen’ images) by providing a lesion probability estimate for each voxel. LPA does not require the use of an initial threshold.
LGA in SPM8 (LST version 1.2.3) and LPA in SPM12 (LST version 2.0.15) were used to obtain the lesion maps compared with the visual ratings (Scheltens’ score). The automated lesion maps used for spatial and volumetric comparisons with the manual lesion maps were derived from LGA/LPA in SPM12 (LST version 2.0.15). Figure 1 provides examples of manually segmented (Figure 1b), LGA (Figure 1c), and LPA (Figure 1d) lesion maps overlaid onto their corresponding FLAIR scans/slices.

Original FLAIR image (a), hand-drawn lesion map (b), LGA lesion map (c), and LPA lesion map (d).
Image analysis
TLVs derived from both LST algorithms (LGA and LPA) were compared with Scheltens’ visual rating scores. LGA uses an adjustable initial threshold κ. Here, κ was increased from 0.3 to 0.7 in intervals of 0.05. Spearman’s Rho correlations between the TLV values and Scheltens’ scores were calculated to determine the optimal κ value. κ was then set at this determined value throughout the remaining analyses.
The optimal lesion probability thresholds for LGA and LPA were assessed by increasing the threshold from 0 to 1 in intervals of 0.05. Spearman’s Rho correlations between the TLV and Scheltens’ scores were again calculated to determine the optimal lesion probability thresholds for LGA and LPA, respectively.
Once the optimal κ and lesion probability thresholds had been determined, Spearman’s Rho correlations and the Bland–Altman method 15 were used to determine which algorithm (LGA or LPA) was most comparable to Scheltens’ score.
Spatial and volumetric comparisons were performed between the LST-produced lesion probability maps (from LGA and LPA) and manually delineated lesion maps. TLVs were derived from each segmentation method (LGA, LPA, manual) in MATLAB. Image acquisition differed in the two experiments, and the initial threshold (κ) for LGA in this experiment was therefore set to the default value (0.3), and the lesion probability threshold for all methods (LGA, LPA, manual) was also set to the default value (0.5).
Spatial comparisons and volumetric comparisons were assessed using the Dice similarity coefficient (DSC). Volumetric comparisons were made using Pearson’s correlations, intraclass correlation coefficients (ICC; single-rater, absolute-agreement, two-way mixed-effects model), root mean square error (RMSE), and the Bland–Altman method.
The optimal algorithm was defined as the one that performed better in our spatial and volumetric comparisons, i.e. largest DSC, largest correlations (Pearson’s and ICC), lowest RMSE, lowest bias, and narrower limits of agreement in Bland-Altman analysis. A P-value of <0.05 was considered significant.
Results
Comparison with visual lesion rating
Visual lesion scores and LST algorithms were compared based on the MRI results for 243 participants (48% female). All participants were healthy, community-dwelling older adults belonging to the 1936 Aberdeen Birth Cohort.
LGA initial threshold (κ)
The initial threshold (κ) was increased from 0.3 to 0.7 in increments of 0.05. A boxplot of Spearman’s Rho correlations between the results obtained at incremental κ values and Scheltens’ score (Figure 2a) showed a plateau for κ values >0.55. Increasing the y scale in Figure 1a from 0 to 1 demonstrated a relatively large increment for κ values <0.5, and relatively small increment for κ values >0.5. Given that 0.5 was the point where the increment changed, this led to a plateau, and we therefore decided to use κ = 0.5 as our initial threshold for further analysis and comparisons with the visual ratings. The mean (± standard deviation) Spearman’s Rho for κ = 0.5 across lesion probability thresholds was 0.81 (± 0.002).

(a) Boxplot of initial threshold (κ) values for LGA and Spearman’s Rho. (b) Scatterplot of lesion probability threshold values for LGA and Spearman’s Rho. (c) Scatterplot of lesion probability threshold values for LPA and Spearman’s Rho.
Lesion probability threshold
Optimal lesion probability thresholds for LGA and LPA were determined by increasing the threshold values from 0 to 1 in increments of 0.05. Spearman’s Rho correlations between Scheltens’ score and TLV were calculated at each increment. For LGA, Spearman’s Rho approached a plateau for values >0.55 (Figure 2b). Because there were no large changes in score after this point, we determined the optimal lesion probability threshold for LGA compared with Scheltens’ score as 0.5 (rs = 0.808, P = 0.001). For LPA, Spearman’s Rho increased until the lesion probability threshold reached 0.65, and then decreased (Figure 2c). We therefore determined the lesion probability threshold for LPA compared with Scheltens’ score as 0.65 (rs = 0.818, P < 0.001).
Optimal algorithm compared with Scheltens’ scores
Scheltens’ scores and TLV data from LGA and LPA were log-transformed with Pearson’s correlations showing a strong correlation (r = 0.81, P < 0.05) (Figure 3a), with a similar result for Scheltens’ scores and LPA (r = 0.82, P < 0.05) (Figure 3b).
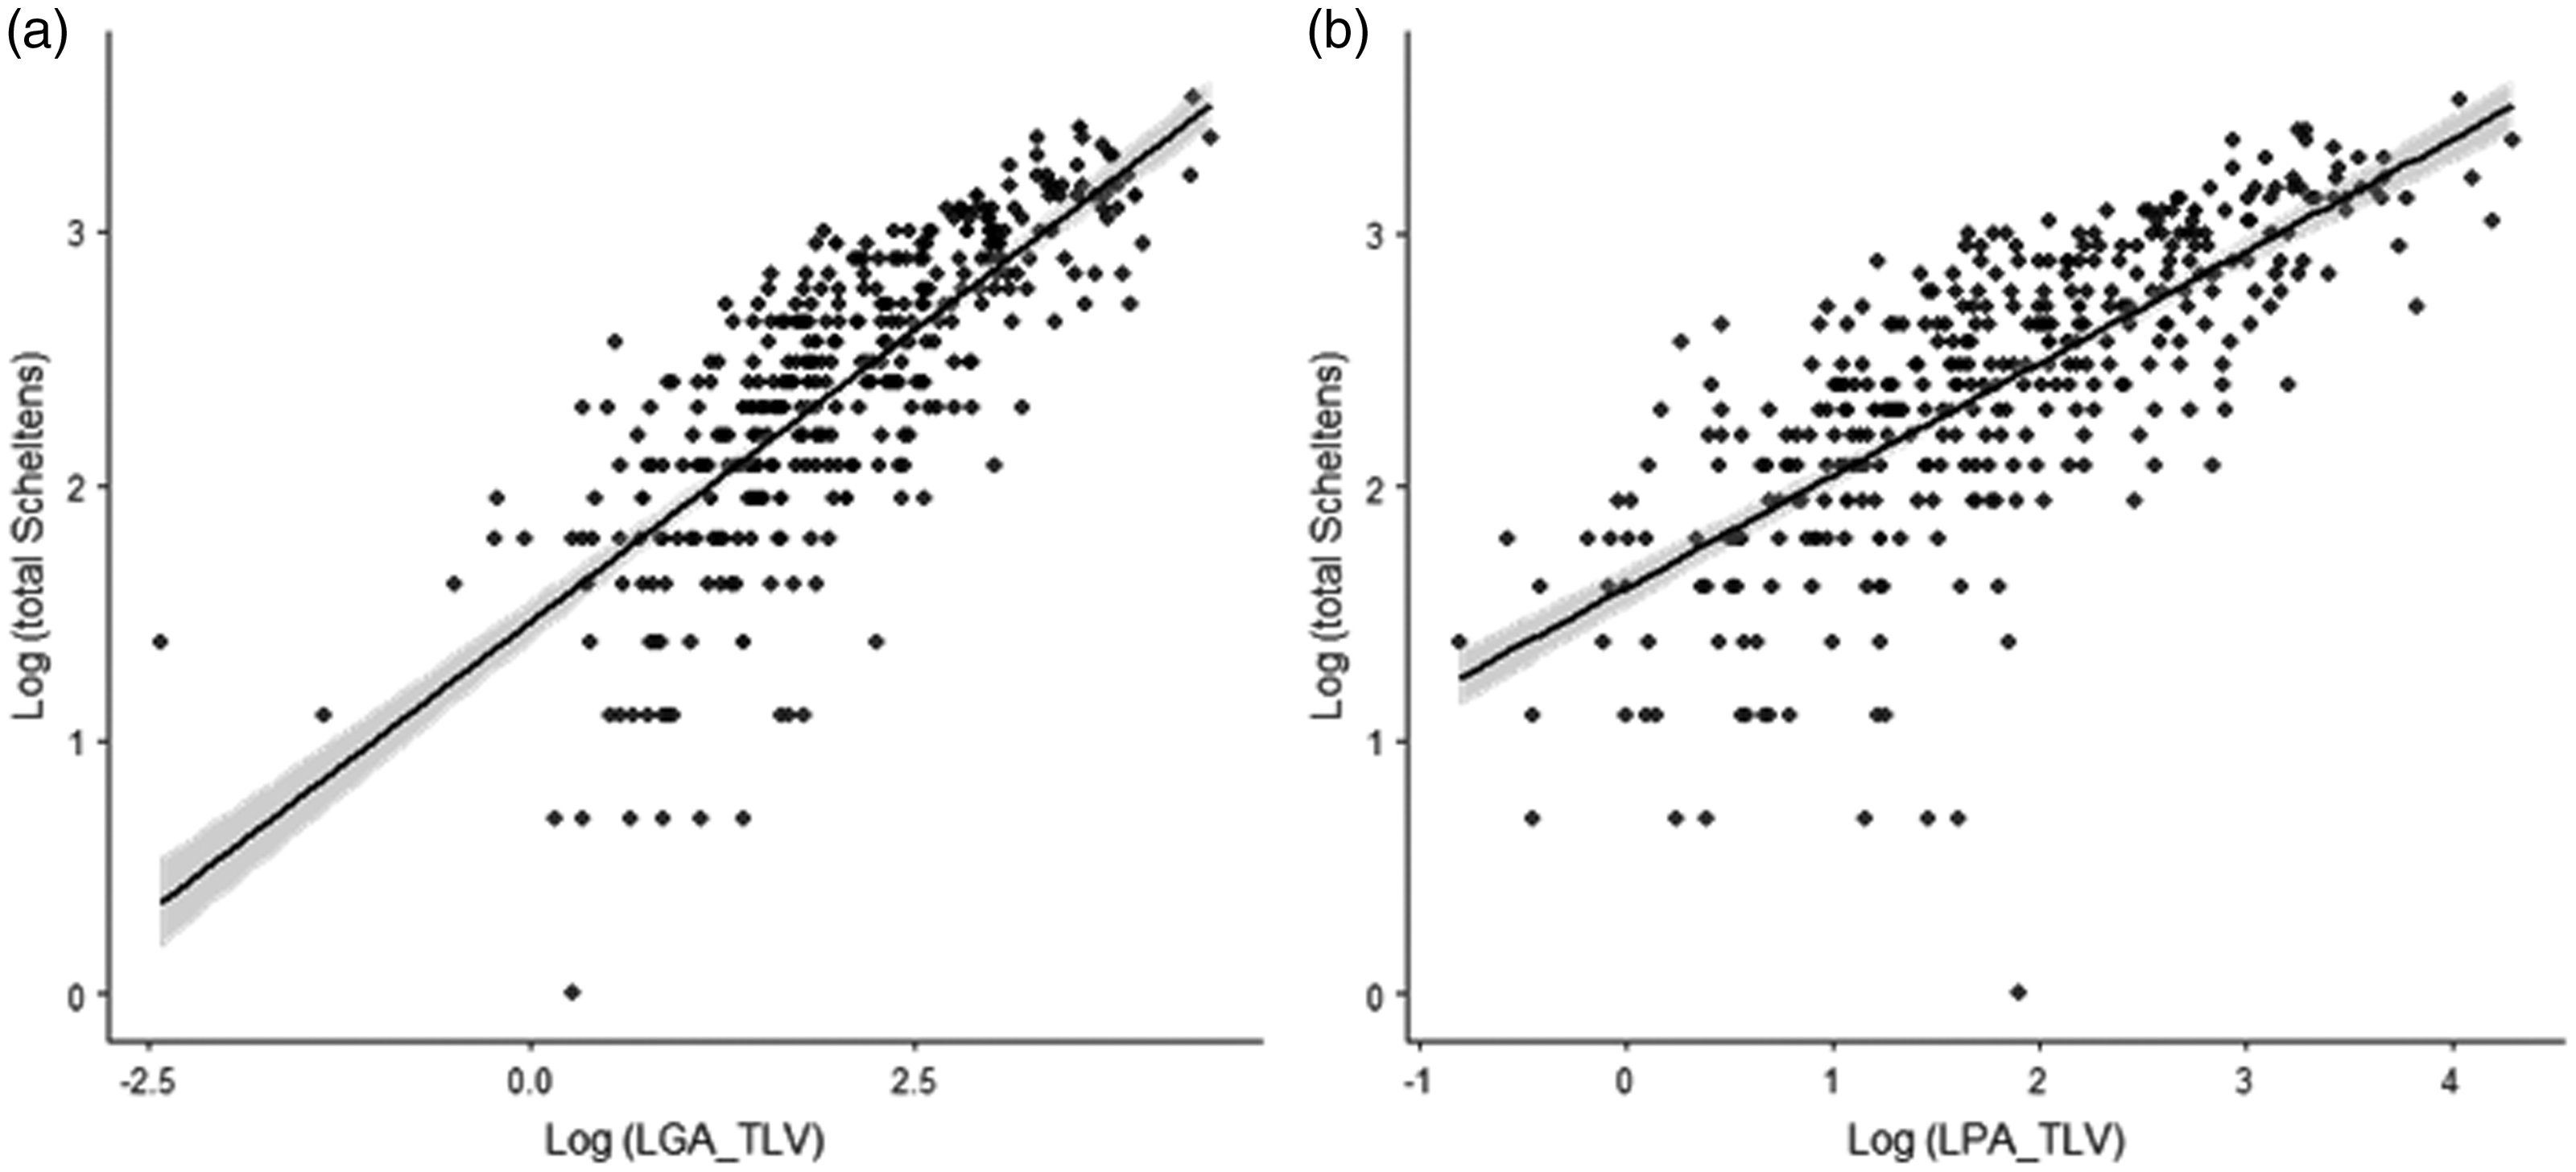
Scatterplots depicting the relationship between log-transformed automated and visual lesion ratings. (a) LGA vs. total Scheltens’ score. (b) LPA vs. total Scheltens’ score.
A comparison of Bland–Altman plots showed narrower limits of agreement for LGA compared with the visual rating (Figure 4a) than for LPA compared with the visual rating (Figure 4b) (Table 1). These results indicated that LGA showed better agreement with Scheltens’ score than LPA.
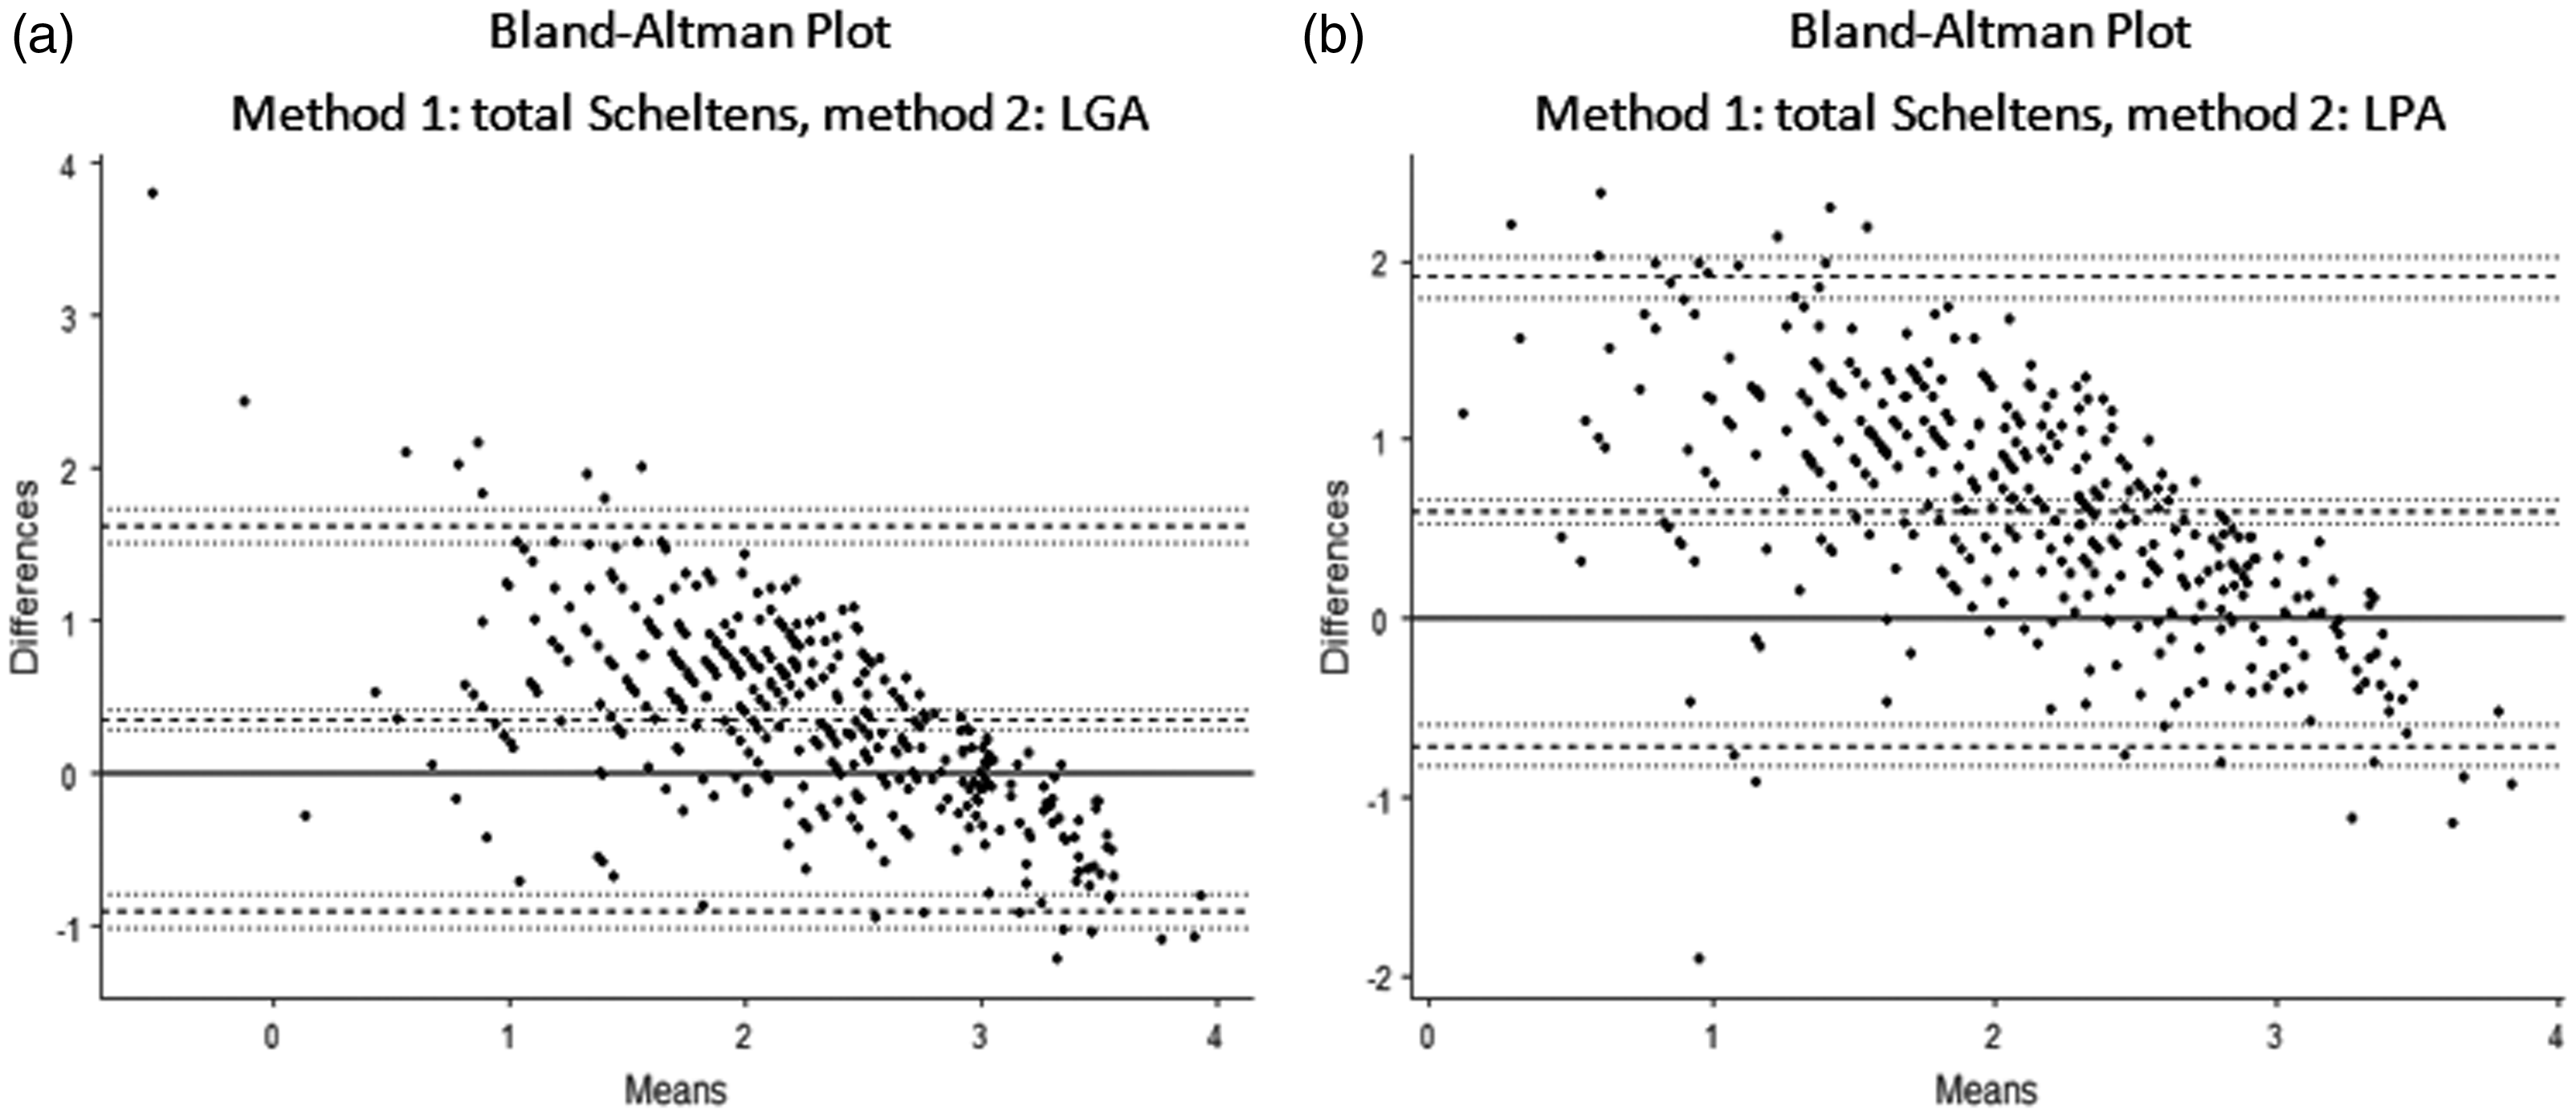
Bland–Altman plots of log-transformed LGA and Scheltens’ score (a) and log-transformed LPA and Scheltens’ score (b).
Lesion Segmentation Toolbox vs. visual rating: Bland–Altman results.

LST comparisons with manual lesion segmentation
Regarding spatial and volumetric comparisons, the optimal algorithm was determined based on MRI findings in 39 participants (51% female; mean age 52.95 ±13.52 years, range 21–77 years). These participants were a combination of healthy participants and participants with vasculitis, selected due to the availability of manual lesion segmentation data, and for their broad range of WMH burdens. WMH TLVs used for spatial and volumetric comparisons were derived from manual (hand-drawn) lesion maps (mean 5.33 ±5.05 mL), LGA (3.13 ± 4.59 mL), and LPA (5.12 ± 6.97 mL). An overview of the descriptive statistics is shown in Table 2. Default thresholds provided by LST were maintained for these comparisons (κ = 0.3, lesion probability threshold for LGA, LPA, and manual segmentation = 0.5).
Spatial comparison
The mean DSC for manual/LGA was 0.34 (±0.21) and for manual/LPA was 0.41 (±0.18). A paired-samples t-test indicated that the mean DSC for manual/LGA was significantly lower than for manual/LPA (t (38) = −5.09, P < 0.001).
Volumetric comparison
The ICC for manual/LGA was 0.739 (95% CI, 0.346 to 0.884), and for manual/LPA was 0.663 (95% CI, 0.441 to 0.808). Pearson’s correlations revealed significant positive correlations for manual/LGA (r = 0.82, P < 0.001) and for manual/LPA (r = 0.69, P < 0.001). The RMSE for manual/LGA was 3.655 and for manual/LPA was 4.979. Bland–Altman analysis for manual/LGA (Figure 5a) indicated a bias estimate of 2.21 (95% CI, 1.23 to 3.16), a lower limit of agreement of −3.58 (95% CI, −5.23 to −1.93), and an upper limit of agreement of 7.99 (95% CI, 6.34 to 9.64). For manual/LPA (Figure 5b), the bias estimate was 0.22 (95% CI, −1.42 to 1.85), the lower limit of agreement was −9.66 (95% CI, −12.48 to −6.85), and the upper limit of agreement was 10.09 (95% CI, 7.28 to 12.91).
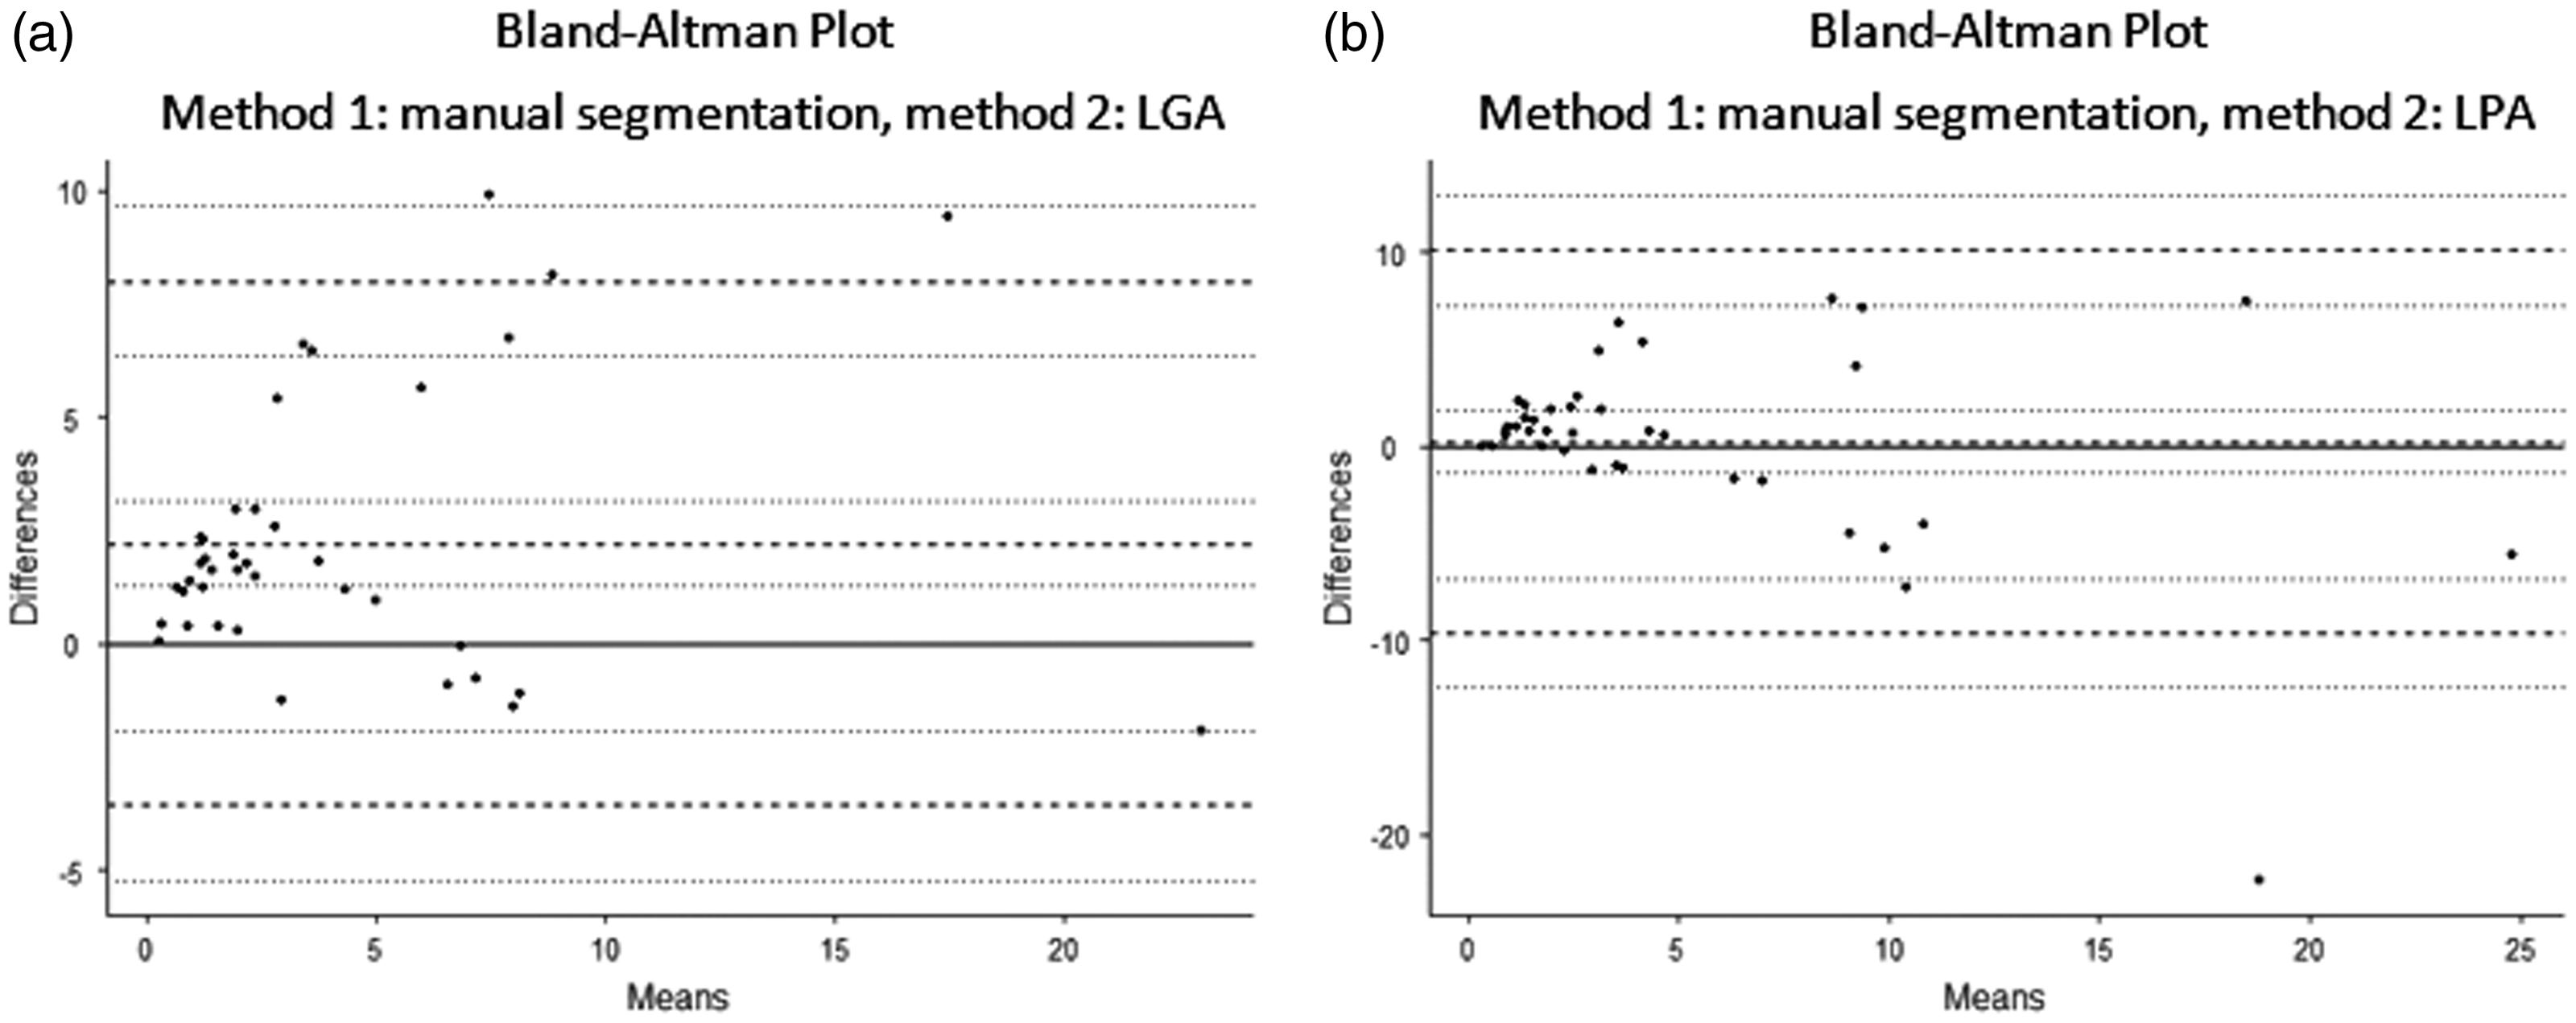
Manual segmentation vs. automated segmentation Bland-Altman plots. (a) Manual and LGA, (b) manual and LPA.
Optimal algorithm compared with manual lesion segmentation
LPA TLV had a significantly greater DSC with manually segmented TLV than LGA. However, visual inspection of the lesion maps suggested that LPA may over-estimate the lesion size, resulting in an increased DSC. LGA performed better in terms of correlations (Pearson’s and ICC) and RMSE comparisons. Bland–Altman analysis showed that LPA had a lower bias than LGA, but that the lower and upper limits of agreement were more widely distributed for LPA. The difference between the upper and lower limits of agreement for LGA was 11.57, compared with 19.75 for LPA, and we therefore considered that LGA performed better in relation to this measure. Overall, we considered that LGA performed better than LPA in these comparisons. An overview of the results of each comparison test together with the better-performing LST-based algorithm for each test can be found in Table 3.
White matter hyperintensity descriptive statistics: Lesion Segmentation Toolbox vs. manual.

LGA, lesion growth algorithm; LPA, lesion probability algorithm; TLV, total lesion volume.
Lesion Segmentation Toolbox vs. manual segmentation methods for white matter hyperintensity.

LGA, lesion growth algorithm; LPA, lesion probability algorithm; SD, standard deviation; DSC, Dice similarity coefficient; RMSE, root mean square error; ICC, intraclass correlation coefficient; CI, confidence interval; LoA, limit of agreement.
Discussion
Previous studies on the identification of WMH have mainly been related to MS.3,10,16 Although the gold standard method for WMH analysis has typically involved the use of visual rating scales and semi-quantitative methods,5,6 fully automated methods have performed well compared with visual and manual methods. Given potential intra/inter-rater variability in visual segmentation and ratings, automated methods should be fully assessed with the aim of replacing manual segmentation as the gold standard. In the present study, we determined if WMH segmentation algorithms provided by LST produced comparable results to two ground-truthing measures: Scheltens’ visual rating scale and manual lesion segmentation. We then determined if the LGA or LPA algorithm performed better compared with Scheltens’ scale and manual segmentation for identifying lesions with a vascular origin.
We first compared TLVs to Scheltens’ score using incremental initial threshold (κ) values for LGA, and found that a κ value of 0.5 provided the most comparable TLV. Similarly, we tested incremental lesion probability thresholds for LGA and LPA and found that thresholds of 0.5 for LGA and 0.65 for LPA compared best with Scheltens’ score. Regarding which of the two algorithms was most comparable to Scheltens’ score, LGA showed the better agreement. Although this was in line with previous studies suggesting that LGA performed better, 16 LGA must be used with caution when determining the initial threshold (κ) and the lesion probability threshold. The values indicated in the first experiment may not apply for comparisons with other experiments, visual rating scales, or data obtained from different (or multiple) scanning sites, and these values may depend on the origin of the lesions. A previous study comparing the performance of automated methods with manual segmentation for MS lesions showed that a combination of κ = 0.3 and a probability threshold of 0.4 performed best for LGA. 16 However, in the current analysis, where the origin of the lesions was vascular, the combination of κ = 0.5 and a probability threshold of 0.5 appeared to perform better.
Second, we conducted spatial and volumetric comparisons between manual segmentation and LST algorithms. Here, the initial threshold (κ) was 0.3 and the lesion probability thresholds for LGA and LPA were 0.5. In the spatial comparison, LPA had a greater DSC than LGA compared with manual segmentation, while volumetric comparisons revealed that TLV produced by LGA was more comparable to TLV produced by manual segmentation than that produced by LPA. Visual inspection determined that LPA appeared to overestimate the lesion size, resulting in a greater DSC. We therefore determined that LGA was the optimal algorithm compared with manual segmentation, in accordance with the result of comparisons with the visual ratings.
Previous studies comparing qualitative with quantitative methods showed a strong correlation between the two methods, suggesting that either could be used in research. 17 However, other studies found that different visual scales correlated differently with semi-automated volumetric methods, 18 indicating that quantitative methods were more sensitive for detecting small group differences. 19 The performance of the LST toolbox using the default settings has previously been evaluated against other automated methods and against manual methods, and both LPA and LGA were shown to perform well and to be suitable for clinical measurements and research purposes for MS lesions10,12 and lesions of vascular origin. 11 The initial and probability thresholds may be redefined to improve the performance of the LGA algorithm, depending upon the dataset being analysed. 16 However, the current study demonstrated that the default values provided a good level of agreement for lesions with vascular origin.
Conclusion
This study demonstrated a good level of agreement between manual segmentation and the LGA algorithm using default threshold values, indicating the suitability of LGA for future work with minimal user intervention. Although the LGA algorithm was initially developed to evaluate lesions resulting from MS, the current results suggest that it is also an efficient and effective segmentation tool for WMH of presumed vascular origin, with strong agreement with manual segmentation using the default threshold settings. The LGA algorithm thus represents a user-friendly method that is well-suited for a research environment.
Data access
Information on data access can be found at www.abdn.ac.uk/birth-cohorts/1936. Other data access inquiries can be addressed to the corresponding author.
Footnotes
Disclosures
ADM provides brain-imaging advice to TauRx Therapeutics Ltd. but receives no remuneration for this. She has previously received honoraria from GE Healthcare for educational lectures on brain imaging in dementia and parkinsonian disorders. JMJW receives partial studentship funding from TauRx Therapeutics Ltd. The other authors report no disclosures.
Declaration of conflicting interest
The authors declare that there is no conflict of interest.
Ethics
Ethical approval for the study was obtained from the North of Scotland Research Ethics Committee (refs: 09/S0801/83 and 03/0151).
Funding
Data collection was funded by grants from the Alzheimer’s Research Trust (now Alzheimer’s Research UK, grant reference: ART/SPG2003B), Alzheimer’s Research UK (grant reference: ARUK-SB2012B-2), the University of Aberdeen Development Trust (grant reference RGB3109), and NHS Grampian and the Chief Scientist’s Office (grant reference: CAF/08/08). JMJW is funded by the University of Aberdeen Development Trust and TauRx Therapeutics Ltd. CP is funded by Royal Surrey County Hospital NHS Foundation Trust. CJM, ADM, and GDW are funded by the Scottish Funding Council.