
Abstract
Objective
Blood oxygen level-dependent magnetic resonance imaging (BOLD MRI) is a noninvasive technique useful in patients with renal disease. The current study was performed to determine whether BOLD MRI can contribute to the diagnosis of renal pathological patterns.
Methods
BOLD MRI was used to obtain functional magnetic resonance parameter R2* values. Gray-level co-occurrence matrixes (GLCMs) were generated for gray-scale maps. Several GLCM parameters were calculated and used to construct algorithmic models for renal pathological patterns.
Results
Histopathology and BOLD MRI were used to examine 12 patients. Two GLCM parameters, including correlation and energy, revealed differences among four groups of renal pathological patterns. Four Fisher’s linear discriminant formulas were constructed using two variables, including the correlation at 45° and correlation at 90°. A cross-validation test showed that the formulas correctly predicted 28 of 36 samples, and the rate of correct prediction was 77.8%.
Conclusions
Differences in the texture characteristics of BOLD MRI in patients with lupus nephritis may be detected by GLCM analysis. Discriminant formulas constructed using GLCM parameters may facilitate prediction of renal pathological patterns.
Keywords
Introduction
Systemic lupus erythematosus (SLE) is a multisystem autoimmune disease with various manifestations. 1 The expression and clinical course of SLE vary from mild arthralgia and skin rashes to life-threatening renal and central nervous system involvement. Renal involvement is common in patients with SLE and is a significant cause of morbidity and mortality. 2 A precise description of renal histopathological lesions and appropriate classification of lupus nephritis (LN) are essential for nephrologists to guide treatment and predict the prognosis.3,4 Renal biopsy plays a critical role in the diagnosis, treatment, management, and follow-up of LN. Although renal biopsy can directly provide pathological information, it is an invasive method. Thus, it may not be ideal in patients with SLE, who tend to have a high risk of bleeding, especially those with coagulant function abnormalities or renal atrophy. 5
Blood oxygen level-dependent magnetic resonance imaging (BOLD MRI) is based on the paramagnetic properties of deoxyhemoglobin, which generates magnetic moments by its unpaired electrons in a magnetic field. The apparent relaxation rate, denoted as R2*, is proportional to the deoxyhemoglobin concentration. An increased R2* value implies an increased deoxyhemoglobin concentration and decreased oxygen bioavailability in tissues. 6 Since the first assessment of renal oxygenation states using BOLD MRI in an animal model in 1996, 6 several studies have been performed to investigate the potential of BOLD MRI in identifying various pathological conditions of the kidneys.7–11 However, few BOLD MRI or pathological studies of LN have focused on the relationship between pathological patterns and iconographical parameters.
In previous BOLD-MRI studies, the renal R2* values were measured directly. However, obvious fluctuations of the R2* values in entire renal parenchyma area had already been recognized by nephrologists and radiologists. Conspicuous interobserver measurement differences puzzled investigators even after the introduction of various measurement techniques such as a larger region of interest (ROI) sample and compartmental analysis. Moreover, the interrelation between R2* values and sample points as well as neighborhood points can provide useful information that can contribute to BOLD-MRI analysis. We hypothesized that analysis of R2* image patterns may be more stable than direct measurement of the R2* value. Texture analysis quantifies complex mathematical patterns called texture features, which exist in the gray-level distribution of pixels in digital images. Textural feature extraction based on the gray-level co-occurrence matrix (GLCM) is a second-order statistic that can be used to describe the spatial distribution of gray levels in a texture image. 12 Because the human visual system is unable to recognize subtle differences in textural information such as coarseness or regularity, application of GLCM texture analysis may enhance the value of BOLD MRI examination and may reflect renal histopathological heterogeneity in patients with LN.
Relevant studies on renal BOLD MRI and corresponding image analysis in patients with LN are lacking. Therefore, the purpose of this study was to analyze BOLD MRI images by texture analysis and construct an algorithmic model using a GLCM index. We explored the potential use of noninvasive techniques in diagnosing pathological patterns in patients with LN.
Methods
Study protocol
This study was designed as an observational open study. Patients were accrued from January 2015 to August 2016. Twelve patients were enrolled in the study. This study was approved by Tianjin Medical University General Hospital Ethical Committee, and all participants provided informed consent before entering the study. If a participant’s age was <16 years, informed consent was obtained from his or her parent or legal guardian. Patients who fulfilled the 2012 International Collaborating Clinics classification criteria for SLE were included. 13 Disease activity was assessed with the SLE Disease Activity Index. 14 The serum creatinine concentration was used to calculate the estimated glomerular filtration rate using the Chronic Kidney Disease Epidemiology Collaboration formula. 15
Renal histopathology
Two experienced pathologists evaluated the renal histopathological data of patients with renal biopsy-proven LN according to the 2003 International Society of Nephrology/Renal Pathology Society classification. 16 Disagreements were resolved by consensus or by a third pathologist. Agreements between the pathologists on renal pathological samples were evaluated by the kappa statistic, which was defined as slight (0.00–0.20), fair (0.21–0.40), moderate (0.41–0.60), substantial (0.61–0.80), or almost perfect agreement (0.81–1.00). 17
MRI techniques
MRI was performed using a 3.0T Imager (GE Discovery™ 750 3.0T; GE Medical Systems LLC, Waukesha, WI, USA). The scanner had a maximum gradient strength of 50 mT/m and a slew rate of 200 mT/m/s. A TORSOPA 8-channel body coil (GE Healthcare, Waukesha, WI, USA) was used. Images were acquired with a T1INPHASE + FAT sequence for morphologic evaluation using a T1-weighted fat-suppressed sequence. The field of view was 380 × 380 mm, section thickness was 7.0 mm, section width was 1.0 mm, and repetition time (TR)/echo time (TE) was 180/2.1. BOLD MRI was performed using a T2* spoiled gradient recalled echo sequence. The field of view was 380 × 380 mm; matrix was 192 × 160; TR was 100 ms; and TE was 2.4, 6.2, 10.0, 13.8, 17.6, 21.4, 25.2, and 29.0 ms. The echo number was 8.00, flip angle was 35°, bandwidth was 19.23 kHz, section thickness was 7.0 mm, section width was 1.0, section number was 8, and scan time was 25 s.
We scanned the bilateral kidneys of all included patients. Three pairs of consecutive renal coronal anatomical plane pictures were obtained from both the left and right kidneys of each patient. Consequently, we acquired six BOLD-MRI pictures (three left and three right kidney). After measurement of the GLCM parameters of each picture, the mean values of left and right kidney were calculated as the final measured values. Finally, three groups of GLCM values were generated for each patient.
Image analysis
R2* maps were constructed on an ADW 4.5 Workstation (GE Healthcare) using the FuncTool program.
Because the texture analysis was based on R2* maps that were generated by the FuncTool R2* program, we considered that the calculated GLCM results might be dependent on the methods of the R2*-fitting algorithm and that different R2*-fitting algorithms might generate different R2* maps. In the present study, we used a two-parameter R2*-fitting algorithm. The FuncTool software program provided two R2*-fitting algorithms: a two-parameter and three-parameter algorithm. The two-parameter method used the signal magnitude and velocity of signal decay. The three-parameter method added a third parameter: signal noise. R2* maps corresponding to each stage of gas inhalation and each image acquisition performed during the dynamic time series were calculated using the nonlinear Levenberg–Marquardt algorithm to fit the multiple-gradient-echo signal decay component. Under general conditions, the two-parameter method uses eight gradient echoes to fit the R2* map. Correspondingly, 16 gradient echoes are applied to the 3-parameter method. The following formula is the two-parameter fitting algorithm:

We converted the color R2* maps into gray-scale images by MATLAB software (MathWorks, Natick, MA, USA). Colorful R2* maps were imputed by MATLAB software, and the color-indexed images were separated into their red-green-blue component matrices. Using the standard weighting for the three-color components, the red-green-blue matrices were converted to a gray-scale intensity image.

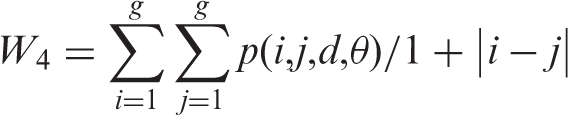
Three consecutive renal coronal anatomical planes were selected in each kidney. The selected ROI was traced in each renal cortex region. The R2* values of each voxel of the selected ROI in the colored maps were transformed into gray-scale maps. The GLCM is a statistical method that can provide the texture characteristics of the analyzed image. In the present study, we acquired renal BOLD-MRI and traced the selected ROI in the renal cortex region. We then transferred the colorful R2* image of the ROI into gray-level images. The GLCM is explained by the fact that in the presence of related frequencies of Pij in which two adjacent pixels have a constant distance of d, one of them with a gray intensity of i and the other with a gray intensity of j occur on the image. Therefore, the gray-level image is reshaped to a two-dimensional matrix, the size of which depends on the maximum gray intensity of the existing pixels in the image. The horizon of the GLCM in our study was designated as the 8 × 8 matrix. The original BOLD MRI images were colorful before they were transformed into gray-level images. Under common conditions, the gray-scale gradient of these gray-level images was 256. However, gray-level images with a 256-gradient gray scale will generate a huge GLCM with a 256 × 256 matrix. Because creation of a GLCM with a 256 × 256 matrix will require a tremendous calculation task, we degraded the gray-scale gradient from 256 to 8. Another essential parameter was “d,” which is the distance between the pixel of interest and its neighbor. In the present study, parameter d was designated 1, which represents a pixel and its back-to-back neighbor pixel. In one gray-level image, every pixel is adjacent to eight pixels. These eight pixels are distributed in the horizontal direction (0° and 180°), vertical direction (90° and 270°), and two diagonal directions (45° and 225°; 135° and 315°). However, because of the symmetric principle, we only need to study four directions: 0°, 45°, 90°, and 135°. In the present study, these four directions were manifested as the parameter “Offset” as follows: [0, 1], [−1, 1], [−1, 0], and [−1, −1], respectively. More details are provided on the MathWorks website: http://www.mathworks.com/help/images/ref/graycomatrix.html. GLCMs were generated for these gray-scale maps. GLCM parameters such as contrast, correlation, energy, and homogeneity were obtained by MATLAB R2015a (MathWorks). The parameters and calculation methods are shown below.
Contrast:

Correlation:


Energy:

Homogeneity:
Statistical analysis
To examine group differences in the four renal pathological patterns, we tested GLCM parameters using multivariate analysis of variance (MANOVA) models with a Type 1 error rate of 5%. MANOVA provides an omnibus test of statistical significance. If this omnibus test was statistically significant for the key independent variable, then post-hoc comparisons were run to identify which groups were statistically different. A further strategy to adjust for multiple comparisons was prioritization of the consistency of the four MANOVA output statistics (i.e., Wilk’s lambda, Lawley–Hotelling trace, Pillai’s trace, and Roy’s largest root). Group differences were inferred when all four statistics were statistically significant.
Linear discriminant analysis algorithm models were constructed to detect renal pathological patterns. We applied the stepwise method to construct the linear discriminant analysis models, which considered Wilk’s lambda, a minimum partial F-to-enter of 3.84, and a minimum partial F-to-remove of 2.71. The dependent variables used in the models were the pathological diagnoses, which classified patients as having LN class III, III + V, IV, or IV + V. The independent variables included GLCM parameters such as contrast, correlation, energy, and homogeneity in four directions (0°, 45°, 90°, and 135°). We applied a resampling method called leave-one-out cross validation. This technique is a useful error estimation method for small sample sizes. It is an unbiased estimator of the true error rate of a classifier. In leave-one-out cross validation, a single observation is left out as the testing sample and the remaining observations are used as training samples to develop a classifier. The classifier thus obtained is used to predict the classes of the left out samples. This loop is repeated such that each observation in the sample is used once as the validation datum. It is an almost unbiased estimator of the true error rate of a classifier if the classifier training algorithm is used on the entire dataset. 18
All analyses were performed using IBM SPSS statistics software (version 22.0.0.0; IBM Corp., Armonk, NY, USA). Statistical significance was determined at P < 0.05.
Results
General clinical and pathological data of patients with LN
Comparison of clinical and laboratory data from 12 patients with lupus nephritis.

LN, lupus nephritis; ANA, anti-nuclear antibodies; RNP, ribonucleoprotein; SLEDAI, Systemic Lupus Erythematosus Disease Activity Index; SSA, Sjogren’s syndrome A antigen; SSB, Sjogren’s syndrome B antigen; eGFR, estimated glomerular filtration rate
Comparison of 16 gray-level co-occurrence matrix parameters between four lupus nephritis groups and one healthy volunteer group.

Data are presented as mean ± standard deviation.
All patients received oral prednisone therapy. Four patients received pulsed intravenous cyclophosphamide (600–800 mg/month). Three patients received mycophenolate mofetil, one patient received tacrolimus, and four patients received leflunomide.
BOLD MRI and pathological images of patients with LN
Four groups of BOLD MRI and pathological images were obtained from four patients according to the pathological diagnosis of LN. The coronal plane of the patients’ right kidneys were selected for BOLD MRI analysis. Renal biopsy sections were stained for histopathological analysis. Using Masson’s trichrome-stained and methenamine silver-stained sections, we differentiated four renal pathological diagnoses: class III, class III + V, class IV, and class IV + V (Figure 1).
Blood oxygen level-dependent magnetic resonance imaging (BOLD MRI) and renal pathological images of kidneys. Representative MRI and Masson’s trichrome-stained and Periodic acid-Schiff–methenamine silver (PASM)-stained images from patients with class (a, e, i) III, (b, f, j) III + V, (c, g, k) IV, and (d, h, l) IV + V lupus nephritis. The BOLD MRI images are shown as pseudocolor maps. Blue represents the areas of lowest R2* values and oxyhemoglobin concentrations, whereas green, yellow, and red (in that order) represent increasing R2* values and higher oxyhemoglobin concentrations.
Comparison of renal BOLD MRI textural characteristics between patients with LN and healthy volunteers
Differences in the renal image textures were observed between the four LN groups and the healthy volunteers group according to the MANOVA results. Comparison of the GLCM textural parameters among these five groups showed that most GLCM indexes (12 of 16) were significantly different between the LN groups and the healthy volunteers group (Figure 2 and Table 2).
Discrepancy of four categorical gray-level co-occurrence matrix (GLCM) parameters between groups with four pathological patterns of lupus nephritis and healthy volunteers. (a) GLCM parameters at 0°, (b) GLCM parameters at 45°, (c) GLCM parameters at 90°, and (d) GLCM parameters 135°.
Discrimination models or formulas of patients with LN
The following four Fisher’s linear discriminant formulas were used for the pathological patterns of LN.


Cross validation results of linear discriminant formulas for predicting pathological patterns in patients with lupus nephritis.

Data are presented as n (%).

Distribution map of group centroids and samples calculated by a discriminant formula.
Discussion
A limited number of studies have used functional MRI techniques such as BOLD MRI to examine the kidneys of patients with LN. To the best of our knowledge, only two related studies have been published.19,20 These studies have suggested that functional MRI might promote an understanding of the manifestations of renal histopathology. For example, Li et al. 19 reported renal oxygenation characteristics using BOLD MRI in a group of patients with LN. They found a lower R2* value in patients with mixed proliferative and membranous LN (classes III + V and IV + V) than in patients with pure proliferative LN (classes III and IV) or pure membranous LN (class V). In the present study, we employed GLCM texture analysis to investigate renal BOLD MRI imaging. We chose GLCM texture analysis based on our hypothesis that renal pathological patterns would manifest themselves as textural gray-level patterns on MRI. The GLCM energy revealed significant differences in BOLD MRI among different renal pathological patterns. The energy, also called the angular second moment, was a measurement of homogeneity in the gray-scale variation of the imaging texture. This parameter reflects the magnitude of gray-scale distribution uniformity and texture granularity. Our study showed that the four directional energy values in the IV-G (A/C) + V group were inferior to those in the other three groups. Similar results were found for the GLCM parameter correlation. The correlation reflects the similarity grade of the gray scale in imaging texture. We found that the correlation values in the IV-G (A/C) + V group were superior to those in the other three groups. Based on these findings, we speculated that the variation in magnitude of the R2* values in the kidneys of patients with the IV-G (A/C) + V pattern of LN was also inferior to that in the kidneys of patients with the other three patterns of LN. These results indicate that the gradient of renal R2* values from the outer to inner cortex was more seriously damaged in the IV-G (A/C) + V group. Renal R2* values, which reflect renal oxygenation, are determined by renal oxygen delivery and oxygen consumption. Oxygen delivery is affected by arterial blood oxygenation, the erythrocyte volume fraction, and renal arterial blood flow. In contrast, oxygen consumption is mainly affected by sodium reabsorption in the tubular apparatus. 21 In the present study, we did not evaluate regional kidney perfusion, and the blood flow distribution in the cortex is unknown. However, we speculated that renal histopathological changes might impair the normal renal blood flow distribution. Under physiological conditions, the blood flow distribution exhibits heterogeneity. For example, Stein et al. 22 investigated the blood flow distribution in healthy dog kidneys. They found that the fraction of blood flow in the outer cortex was superior to that in the inner cortex. The mean percentage of renal blood flow was 40% to 42% in the outer cortex and 13% to 14% in the inner cortex. Spielman et al. 23 showed that after infusion of adenosine in dogs with elevated plasma renin activity, the outer cortical blood flow did not significantly change, whereas the inner cortical flow increased by 94%. However, renal histopathological changes might impair the normal renal blood flow distribution. For example, periglomerular shunts can cause the blood flow to be shunted directly from the cortex to the medulla. As blood flow declines in the cortex, tubular sodium absorption also decreases, and therefore less energy is required for this process. 24
Another finding of our study is that BOLD MRI texture analysis might provide another way to classify sample images. We focused on the relationships of the R2* value of each pixel rather than directly measuring the R2* values in the BOLD images. This method reduced measurement error. It is well known that the levels of R2* vary gradually from the cortex to the medulla, reaching a very hypoxic zone in the deepest sections of the medullary pyramids. Hence, the precision and reproducibility of the R2* values are affected by the size and location of the ROI. Larger ROIs that include entire medullary compartments may provide more representative and less variable mean values, but they often include multiple medullary and corticomedullary overlap zones with different hemodynamics. When relatively highly oxygenated medullary regions do not differ from the cortex, or when kidneys are severely diseased, the corticomedullary boundaries may be blurred. Small, selective ROIs are less vulnerable to volume averaging but may be skewed by fluctuations caused by spatial and temporal heterogeneity in the oxygen distribution within the kidney. 25 Moreover, GLCM parameters might provide diagnostic assistance in clinical practice. Based on our BOLD MRI texture analysis results, we constructed four Fisher’s linear discriminant formulas comprising two GLCM parameters. Cross validation showed that the total prediction accuracy reached 77.8% in the speculated renal pathological patterns. In particular, two groups of this renal pathological classification, namely III (A/C) and IV-G (A/C) + V, showed higher accuracy (83.3%). The cross validation results of the linear discriminant formulas and distribution map of group centroids and samples showed that the class III (A/C) and IV-G (A/C) + V groups had higher predictive accuracy. We also rechecked the renal biopsy pathological pictures of the two groups. In the class III (A/C) group, the pathological injuries were slight and the renal tissue microstructure was regular. In contrast, the pathological injury was more extensive and the renal microstructure was more irregular in the class IV-G (A/C) + V group. Therefore, we speculated that similar textural characteristics of the R2* maps were present in the two groups. The renal prognosis and outcomes may depend on the disease activity and renal pathological lesions in patients with LN. Because different pathological patterns of LN may lead to different renal prognoses and therapeutic strategies, biopsy examinations in patients with LN patients are still critical. Yu et al. 26 reported that interstitial lesions were significantly more severe in patients with class IV LN than the moderate lesions in patients with class III and mild lesions in patients with classes II and V. Interstitial infiltration, tubular atrophy, and interstitial fibrosis were significant independent risk factors for renal outcomes. Bao et al. 27 compared the classic therapeutic strategy (intravenous cyclophosphamide) and multi-target therapeutic strategy in patients with class IV + V LN. Ten of 20 patients in the multi-target therapy group and 1 of 20 patients in the intravenous cyclophosphamide group achieved complete remission at 6 months. At 9 months, the number of patients who had achieved complete remission increased to 13 and 3 in the multi-target therapy and intravenous cyclophosphamide groups, respectively. If the pathological diagnosis cannot be provided by renal biopsy, prediction of the prognosis and determination of a reasonable treatment strategy for patients with LN becomes difficult. The current study may provide a practical method for these patients.
This study had several limitations. First, the sample size was not large enough to construct a robust model. Only 12 patients with a renal pathological diagnosis underwent BOLD MRI and were classified with the GLCM parameter linear discriminant formulas. In addition, our study lacked several LN pathological patterns such as class II, V, and VI. Other pathological subclasses such as IV-G (A) and IV-S (A) were also absent from this study. Because many factors can impact renal oxygenation, we excluded some patients with LN whose complex pathophysiological conditions might have concealed their true renal oxygenation level. These conditions included chronic respiratory and cardiovascular insufficiency, extensive systemic edema, severe anemia, and high-dose diuretic therapy. We had hoped to develop a classifier for the pathological diagnosis of LN using GLCM parameters of an R2* map in the present study. Unfortunately, the 12 patients with LN only provided 36 pictures of an R2* map (3 consecutive coronal R2* maps from each side of the kidney) as the study samples. Thus, cross validation was introduced as a resampling method with which to prevent predictive error because of the small sample. Previous studies have proven that cross validation is an effective solution to the lack of sufficiently large training and testing datasets. 18 Second, we did not explore the correlation between pathological activity or chronicity indexes and R2* values. Third, several other categories of functional MRI, such as diffusion tensor imaging, were not investigated in our study. More GLCM parameters from different types of functional MRI may enhance the diagnostic capability of our formulas.
In conclusion, renal histopathological changes in patients with LN may cause corresponding variations of R2* maps in BOLD MRI. The GLCM parameters may be useful indexes with which to differentiate patients with diverse renal pathological patterns. Linear discriminant formulas with GLCM parameters may facilitate the prediction of renal pathological patterns. More patients with diverse renal pathological patterns and more functional MRI indexes are required to construct a widely used and robust predictive model.
Footnotes
Declaration of conflicting interests
The authors declare that there is no conflict of interest.
Funding
This research received no specific grant from any funding agency in the public, commercial, or not-for-profit sectors.